Article

Efficiency of Phage φ6 for Biocontrol of Pseudomonas syringae pv. syringae: An in Vitro Preliminary Study

by
Larindja A. M. Pinheiro
1,
Carla Pereira
1,*,
Carolina Frazão
1,
Victor M. Balcão
1,2 and
Adelaide Almeida
1,*
1
Department of Biology and CESAM, University of Aveiro, Campus Universitário de Santiago, 3810-193 Aveiro, Portugal
2
PhageLab—Laboratory of Biofilms and Bacteriophages, University of Sorocaba, 18023-000 Sorocaba, São Paulo, Brazil
*
Authors to whom correspondence should be addressed.
Submission received: 13 July 2019 / Revised: 31 July 2019 / Accepted: 21 August 2019 / Published: 23 August 2019

Abstract

:
Pseudomonas syringae is a plant-associated bacterial species that has been divided into more than 60 pathovars, with the Pseudomonas syringae pv. syringae being the main causative agent of diseases in a wide variety of fruit trees. The most common treatments for biocontrol of P. syringae pv. syringae infections has involved copper derivatives and/or antibiotics. However, these treatments should be avoided due to their high toxicity to the environment and promotion of bacterial resistance. Therefore, it is essential to search for new approaches for controlling P. syringae pv. syringae. Phage therapy can be a useful alternative tool to the conventional treatments to control P. syringae pv. syringae infections in plants. In the present study, the efficacy of bacteriophage (or phage) φ6 (a commercially available phage) was evaluated in the control of P. syringae pv. syringae. As the plants are exposed to the natural variability of physical and chemical parameters, the influence of pH, temperature, solar radiation and UV-B irradiation on phage φ6 viability was also evaluated in order to develop an effective phage therapy protocol. The host range analysis revealed that the phage, besides its host (P. syringae pv. syringae), also infects the Pseudomonas syringae pv. actinidiae CRA-FRU 12.54 and P. syringae pv. actinidiae CRA-FRU 14.10 strains, not infecting strains from the other tested species. Both multiplicities of infection (MOIs) tested, 1 and 100, were effective to inactivate the bacterium, but the MOI 1 (maximum reduction of 3.9 log CFU/mL) was more effective than MOI 100 (maximum reduction of 2.6 log CFU/mL). The viability of phage φ6 was mostly affected by exposure to UV-B irradiation (decrease of 7.3 log PFU/mL after 8 h), exposure to solar radiation (maximum reduction of 2.1 PFU/mL after 6 h), and high temperatures (decrease of 8.5 PFU/mL after 6 days at 37 °C, but a decrease of only 2.0 log PFU/mL after 67 days at 15 °C and 25 °C). The host range, high bacterial control and low rates of development of phage-resistant bacterial clones (1.20 × 10⁻³) suggest that this phage can be used to control P. syringae pv. syringae infections in plants, but also to control infections by P. syringae pv. actinidiae, the causal agent of bacterial canker of kiwifruit. Although the stability of phage φ6 was affected by UV-B and solar radiation, this can be overcome by the application of phage suspensions at the end of the day or at night.

1. Introduction

Pseudomonas syringae pv. syringae is a phytopathogenic bacterium responsible for bacterial canker and blast (stone and pome fruits). This bacterium infects more than 180 species of plants, among them Citrus sp. and Prunus sp. [1]. It affects all commercially grown Prunus species, including peach (Prunus persica), European plum and French prune (P. domestica), Japanese plum (P. salicina), sweet cherry (P. avium), apricot (P. armeniaca), tart cherry (P. cerasus), almond (P. dulcis), and other stone fruits [2]. P. syringae pv. syringae is also responsible for bacterial blast of orange (Citrus sinensis) and mandarin (Citrus rediculate) and black pit of orange fruits, causing economic losses worldwide [3].
P. syringae pv. syringae causes damage especially under cold and humid conditions in spring when the development and spread of the bacterial blast happens quicker and more easily, and when the shoots or fruits are damaged by wind, hail, or thorns [3,4]. The disease symptoms appear as water-soaked lesions extended to the mid-vein and to the twigs surrounding the base of the petiole. Ultimately, the leaves dry and curl, while still firmly attached, and eventually fall without petioles. The necrotic areas on twigs further enlarge and the twigs are eventually killed within three to four weeks [3,4]. This pathovar can be disseminated by wind, rain, and insects, or propagated via either infested wood or nursery stock. Equipment, such as pruning tools and mechanical harvesters, may also carry the phytopathogen from plant to plant in addition to causing entry wounds.
Currently, the management of most fruit tree diseases caused by P. syringae pv. syringae is almost unattainable, due to the lack of effective chemical or biological control measures, little available knowledge of host resistance, and the endophytic nature of the pathogen during some phases of the disease cycle [2]. The available treatments for this disease are still scarce, with the most common involving frequent spraying of the orchards with copper derivatives, in particular cuprous oxide (Cu2O) and/or antibiotics. However, these strategies are not completely effective. Moreover, the massive use of copper and antibiotics can promote the development of resistance in the pathogen and changes in the structure of bacterial communities [5]. One of the most promising alternatives to the use of these strategies is the use of phages.
The use of phages (viruses that infect bacteria) as biocontrol agents was hindered by the advent of antibiotics, but, in recent years, the continuous selection of bacteria resistant to antibiotics or other antimicrobial agents has led to a new emphasis on phage therapy [6,7,8,9,10,11,12]. Phage therapy has several potential advantages over the use of copper compounds and antibiotics. Phages are usually highly specific to a single species or even strain of bacteria and therefore cause less damage to the normal microflora. Phages are self-replicating as well as self-limiting, replicate exponentially as bacteria, and decline when bacterial number decreases [13,14].
Phages have been used as therapeutic or prophylactic agents to control bacterial diseases in plants and there are already some approved applications of phages in the agricultural sector [15,16,17,18]. Moreover, the isolation and characterization of new phages has been described for several pathovars of P. syringae, such as Pseudomonas syringae pv. tomato [19], Pseudomonas syringae pv. phaseolicola [20,21,22], P. syringae pv. syringae [23], Pseudomonas syringae pv. morsprunorum [24], Pseudomonas syringae pv. porri [25], and P. syringae pv. actinidiae [26,27,28,29,30,31]. Although Nordeen et al. (1983) isolated and characterized phages of the phytopathogen P. syringae pv. syringae, they did not evaluate the application of these phages to inactivate this bacterial pathovar [23]. Moreover, to the best of our knowledge, no studies so far evaluated the therapeutic potential of other phages to control P. syringae pv. syringae.
The aim of this study was to evaluate the efficiency of one of the best-studied and already commercially available phages, the phage φ6, to control infections by P. syringae pv syringae. To our best knowledge, phage φ6 was initially characterized with the plant-pathogenic P. syringae pv. phaseolicola HB10Y [20,32], but no inactivation studies were performed by those authors, and was not yet tested to inactivate P. syringae pv. syringae. The phage φ6 is an already genomically characterized phage, that neither codifies for integrase genes, which prevent lysogeny [33,34,35], nor for virulent factors and antibiotic/metals resistance [36], and can thus be considered as safe to be used to control bacterial infections. As one of the major concerns regarding the use of phages to control infections is the emergency of phage-resistant mutants after treatment, the development of resistant mutants of P. syringae pv. syringae to phage φ6 was also evaluated in this study. Additionally, considering that plants are exposed to environmental factors and that the viability of phages can be affected by physico-chemical factors, in this study, the influence of pH, temperature, solar radiation, and UV-B irradiation on phage φ6 stability was also evaluated in order to develop an effective phage therapy strategy.

2. Materials and Methods

2.1. Bacterial Strains and Growth Conditions

The bacterial strain P. syringae pv. syringae (DSM 21482) was purchased from Leibniz-Institute DSMZ—Deutsche Sammlung von Mikroorganismen und Zellkulturen GmmH (Braunschweig, Germany). P. syringae pv. actinidiae strains (CRA-FRU 8.43, 12.54, and 14.10) were purchased from Culture Collection of C.R.A.—Centro di Ricerca per la Frutticoltura (Roma, Italy). Pseudomonas aeruginosa (ATCC 27853), Aeromonas hydrophila (ATCC 7966), Salmonella enterica serovar Typhimurium (ATCC 13311 and ATCC 14028), Escherichia coli (ATCC 25922 and ATCC 13706), and Vibrio parahaemolyticus (DSM 27657) were purchased from ATCC and DSM culture collections, respectively. The other bacterial strains used in this study were isolated in previous research works from water samples collected in Ria de Aveiro (Aveiro, Portugal) [37,38].
All bacteria were grown in Tryptic Soy Broth (TSB, Roseto degli Abruzzi (Te), Italia). The bacterial strains were stored at −80 °C in 10% glycerol. Before each assay, a stock culture of each bacteria was aseptically inoculated in 30 mL of TSB and was grown during 18 h at 25 °C with orbital shaking set at 120 rpm stirring. Then, an aliquot (300 µL) of each bacterial culture was transferred to 30 mL of fresh TSB and grown during 18 h at 25 °C under orbital shaking (120 rpm). The viable cell density was approximately 109 colony-forming units (CFUs)/mL.

2.2. Preparation of Phage φ6 and Enrichment

Phage φ6 (DSM 21518) was purchased from Leibniz-Institute DSMZ—Deutsche Sammlung von Mikroorganismen und Zellkulturen GmmH (Braunschweig, Germany). Phage φ6 is a double-stranded RNA phage and belongs to the family Cystoviridae [39,40]. Phage suspensions were prepared, departing from the phage stock previously prepared in SM buffer (0.1 M NaCl (Sigma, St. Louis MO, USA), 8 mM MgSO4 (Sigma, St. Louis MO, USA), 20 mM Tris-HCl (Sigma, St. Louis MO, USA), 2% (w/v) gelatin, pH 7.5) using P. syringae pv. syringae as the host. Three hundred microliters of the phage stock were added to thirty milliliters of SM buffer and one milliliter of P. syringae pv. syringae in the exponential growth phase. The suspension was grown overnight and incubated at 25 °C under orbital shaking set at 50 rpm. The lysate was centrifuged at 13.000 rpm for 10 min at 4 °C and the supernatant was filtered through a polyethersulphate membrane with a 0.22 µm pore size (Merck-Millipore, Darmstadt, Germany), to remove intact bacteria or bacterial debris. The phage suspension was stored at 4 °C until use was in order and the titer was determined via the double-layer agar method [41]. Successive dilutions of the phage suspension were performed in phosphate buffered saline (PBS; 137 mmol−1 NaCl (Sigma, St. Louis MO, USA), 2.7 mmol−1 KCl (Sigma, St. Louis MO, USA), 8.1 mmol−1 Na2HPO4·2H2O, 1.76 mmol−1 KH2PO4 (Sigma, St. Louis MO, USA), pH 7.4) and 500 μL of each dilution were added to 200 μL of fresh P. syringae pv. syringae culture, mixed with 5 mL of TSB 0.6% top agar layer (30 g/L TSB (Liofilchem, Roseto degli Abruzzi (Te), Italy), 6 g/L agar (Liofilchem, Roseto degli Abruzzi (Te), Italy), 0.05 g/L CaCl2 (Sigma, St. Louis MO, USA), 0.12 g/L MgSO4 (Sigma, St. Louis MO, USA), pH 7.4) and placed over a Petri plate containing solid Tryptic Soy Agar (TSA, Roseto degli Abruzzi (Te), Italy). The plates were incubated at 25 °C for 18 h. The results are expressed as plaque forming units per milliliter (PFU/mL).

2.3. Determination of the Molar Extinction Coefficient of the Isolated Phage φ6 Particles

The molar extinction coefficient of phage φ6 was determined according to [42]. Successive dilutions of phage 6 (108 PFU/mL), using different volumes of the phage suspension, were prepared. After, the absorbance was determined using a spectrophotometer (model Halo DB-20, Livingston, United Kingdom) at 265 nm (wavelength producing the maximum absorption of the phage suspension) and 320 nm (wavelength where there is little light absorption from phage chromophores).

2.4. Phage φ6 Host Range: Spot Test and Efficiency of Plating (EOP) Assays

Phage host range was determine using the bacterial strains listed in Table 1. Phage host range was determined by spot testing according to the procedure described by [43]. Briefly, three milliliters of TSB 0.6% agar, previously inoculated with 300 μL of bacterial culture , were overlaid on solid TSA and spotted with 10 μL of the phage suspension. The plates were incubated at 25 °C and examined for the presence of lysis plaques after 18 h. Bacterial sensitivity to the phage was established by a clear lysis zone at the spot. Depending on the clarity of the spot, bacteria were differentiated according to either a clear lysis zone (+) or no lysis zone (−) (Table 1). The EOP was determined for those bacteria with positive spot tests (occurrence of a clear lysis zone), using the double-layer agar method [41]. The plates were incubated at 25 °C and examined for the presence of plaques after 18 h. The EOP for each bacterial host was calculated by comparison with an efficacy of P. syringae pv. syringae (host) (Table 1). The EOP was calculated as (average PFU on target bacteria/average PFU on host bacteria) x 100 [44,45]. The EOP value obtained with the host strain was considered as EOP = 100%. EOP values are presented in the manuscript as the mean of three independent measurements followed by their standard deviation.

2.5. One-Step Growth Curve

Phage φ6 suspension (final concentration of 106 PFU/mL) was added to 10 mL of the bacterial culture of P. syringae pv. syringae (cell density of 109 CFU/mL) in order to have a MOI of 0.001 and the resulting suspension incubated without shaking during 5 min at 25 °C [46]. The mixture was centrifuged at 10,000 rpm for 5 min, the pellet was re-suspended in 10 mL of TSB, and incubated at 25 °C. Samples (1 mL) were collected at time 0 and at time intervals of 10 min up to 150 min of incubation and immediately tittered by the double-layer agar method [41]. The plates were incubated at 25 °C and examined for the presence of plaques after 18 h. Three independent assays were performed. The results were subsequently plotted to determine the phage eclipse period, latent period, intracellular accumulation period, and burst size. The one-step growth curves data produced was better adjusted via nonlinear fitting the data to a typical sigmoidal curve (or 4-parameter logistic regression model) (Equation (1)):
Log   ( P t ) =   m 1 + m 2 m 1 1 + ( t m 3 ) m 4
where Pt is the phage concentration (PFU/mL) at time t, m1 is the response at t = 0, m2 is the response at t = ∞, m3 is the curve inflection point, m4 is the slope that defines the steepness of the curve, and t is the time (min). Nonlinear fitting of the phage growth data to the model in Equation (2) was performed using the software KaleidaGraph v. 4.5.2 for MacOS X (Synergy Software, Reading PA, USA).

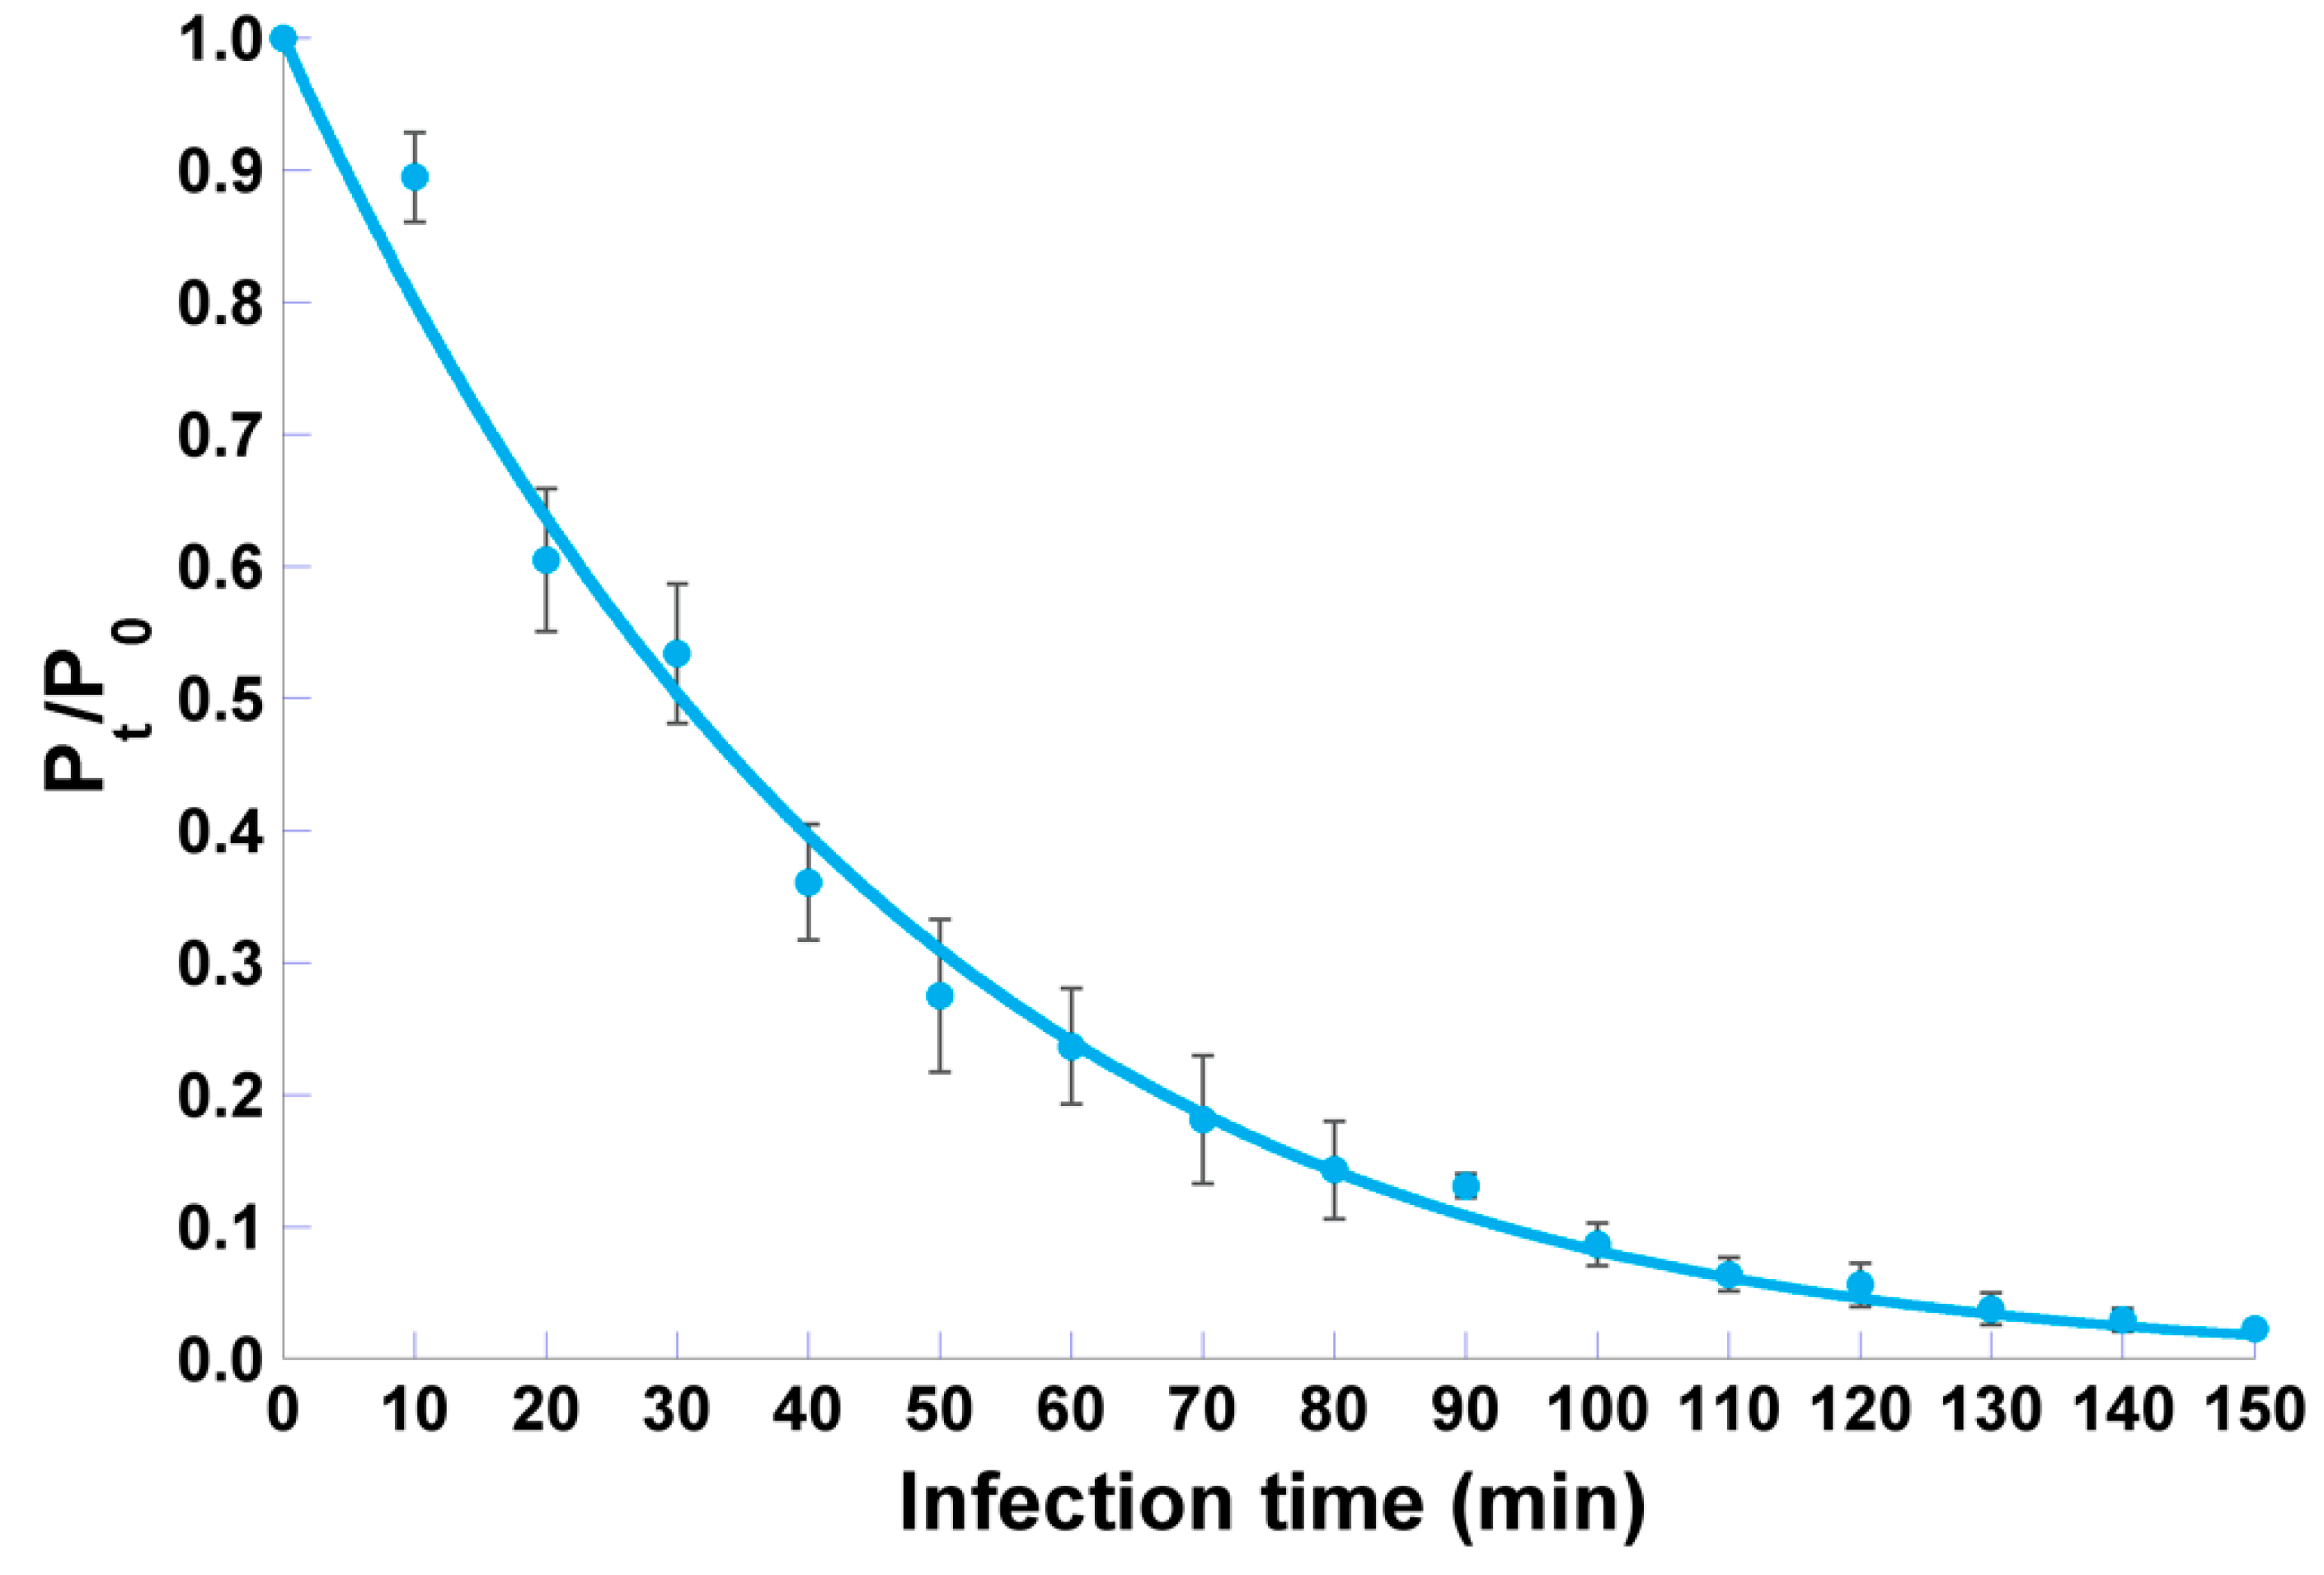
2.6. Adsorption Curve

Phage φ6 suspension (final concentration of 106 PFU/mL) was added to 10 mL of the bacterial culture (final concentration of 109 CFU/mL) to obtain a MOI of 0.001 [47] and the resulting suspension was incubated at 25 °C. The mixture was centrifuged at 10,000 rpm for 5 min and supernatants were immediately filtered through 0.2 µm pore-size filters (Millipore Bedford, MA, USA). The filtrates containing unadsorbed or reversibly adsorbed phage particles were diluted and titrated. The plates were incubated at 25 °C and examined for plaques after 18 h. Adsorption was expressed as the percentage decrease of phage titer in the supernatant, as compared to the time zero. Suspensions of phage without any bacterial cells were used as a no-adsorption standard for calculations [47]. Three independent assays were performed. The adsorption rate was estimated via nonlinear fitting of the experimental data to the model in Equation (2) [48,49,50], viz:
Ln ( P t P 0 ) = δ ( X 0 μ ( t ) ) ( e μ ( t ) · t 1 )
where Pt and P0 are phage concentrations at times t and 0, respectively, δ is the adsorption rate to be estimated, X0 is the concentration of (susceptible, uninfected) bacterial cells at time 0, µ(t) is the bacteria multiplication rate, and t is the infection time. Nonlinear fitting of the adsorption data to the model in Equation (2) was performed using the software KaleidaGraph v. 4.5.2 for MacOS X (Synergy Software, Reading PA, USA).

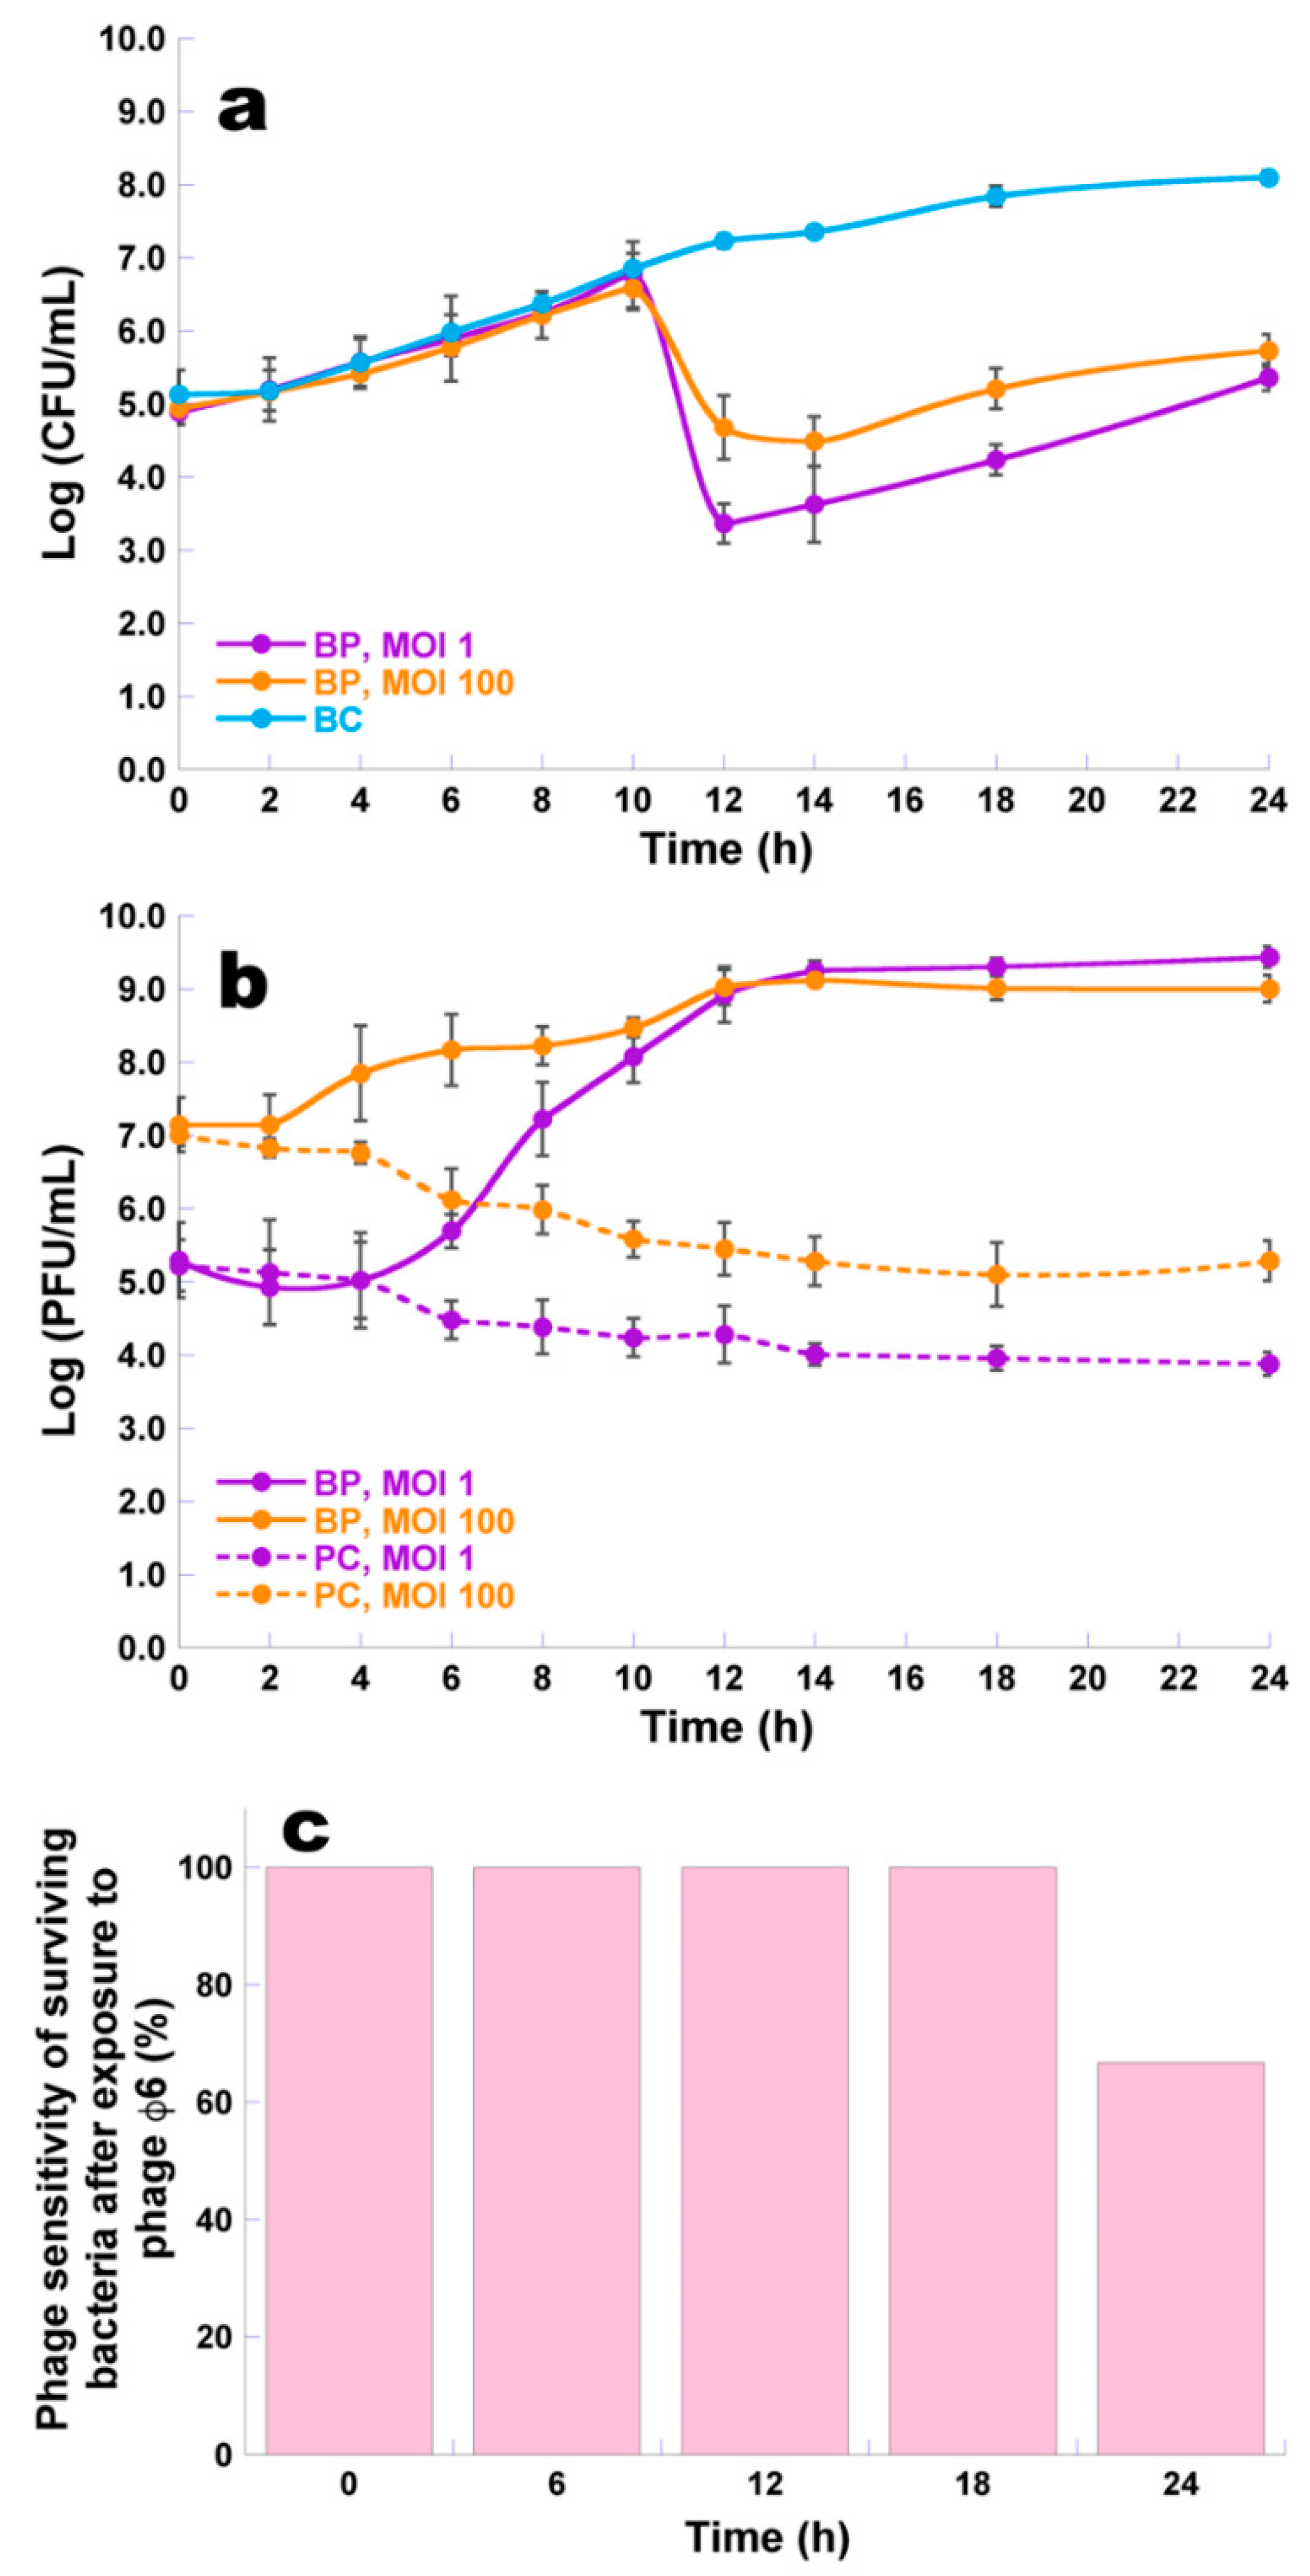
2.7. Bacterial Kill Curves

P. syringae pv. syringae (final concentration of 105 CFU/mL) inactivation by the phage φ6 (final concentrations of 105 and 107 PFU/mL) was evaluated at MOI 1 and MOI 100. For each assay, two control samples were included: The bacterial control (BC) and the phage control (PC). The bacterial controls were inoculated with P. syringae pv. syringae but not with phage φ6, and the phage controls were inoculated with phage φ6 but not with bacterial cells. Controls and test samples were incubated under exactly the same conditions. Aliquots of test samples (BP, bacteria plus phage) and of the bacterial and phage controls were collected at time 0 and after 2, 4, 6, 8, 10, 12, 14, 18, and 24 h of incubation. In all assays, the phage titer was determined in triplicate by the double-layer agar method [41] after an incubation period of 18 h at 25 °C. Bacterial concentration was determined in triplicate in solid TSA medium via the drop-plate method after an incubation period of 48 h at 25 °C. Ten colonies of the test samples (BP), at a MOI of 1, were picked and purified by successive sub-culturing in TSA in order to remove attached phage particles. These colonies were used in further experiments (as described in Section 2.8). Three independent experiments were performed for each condition.

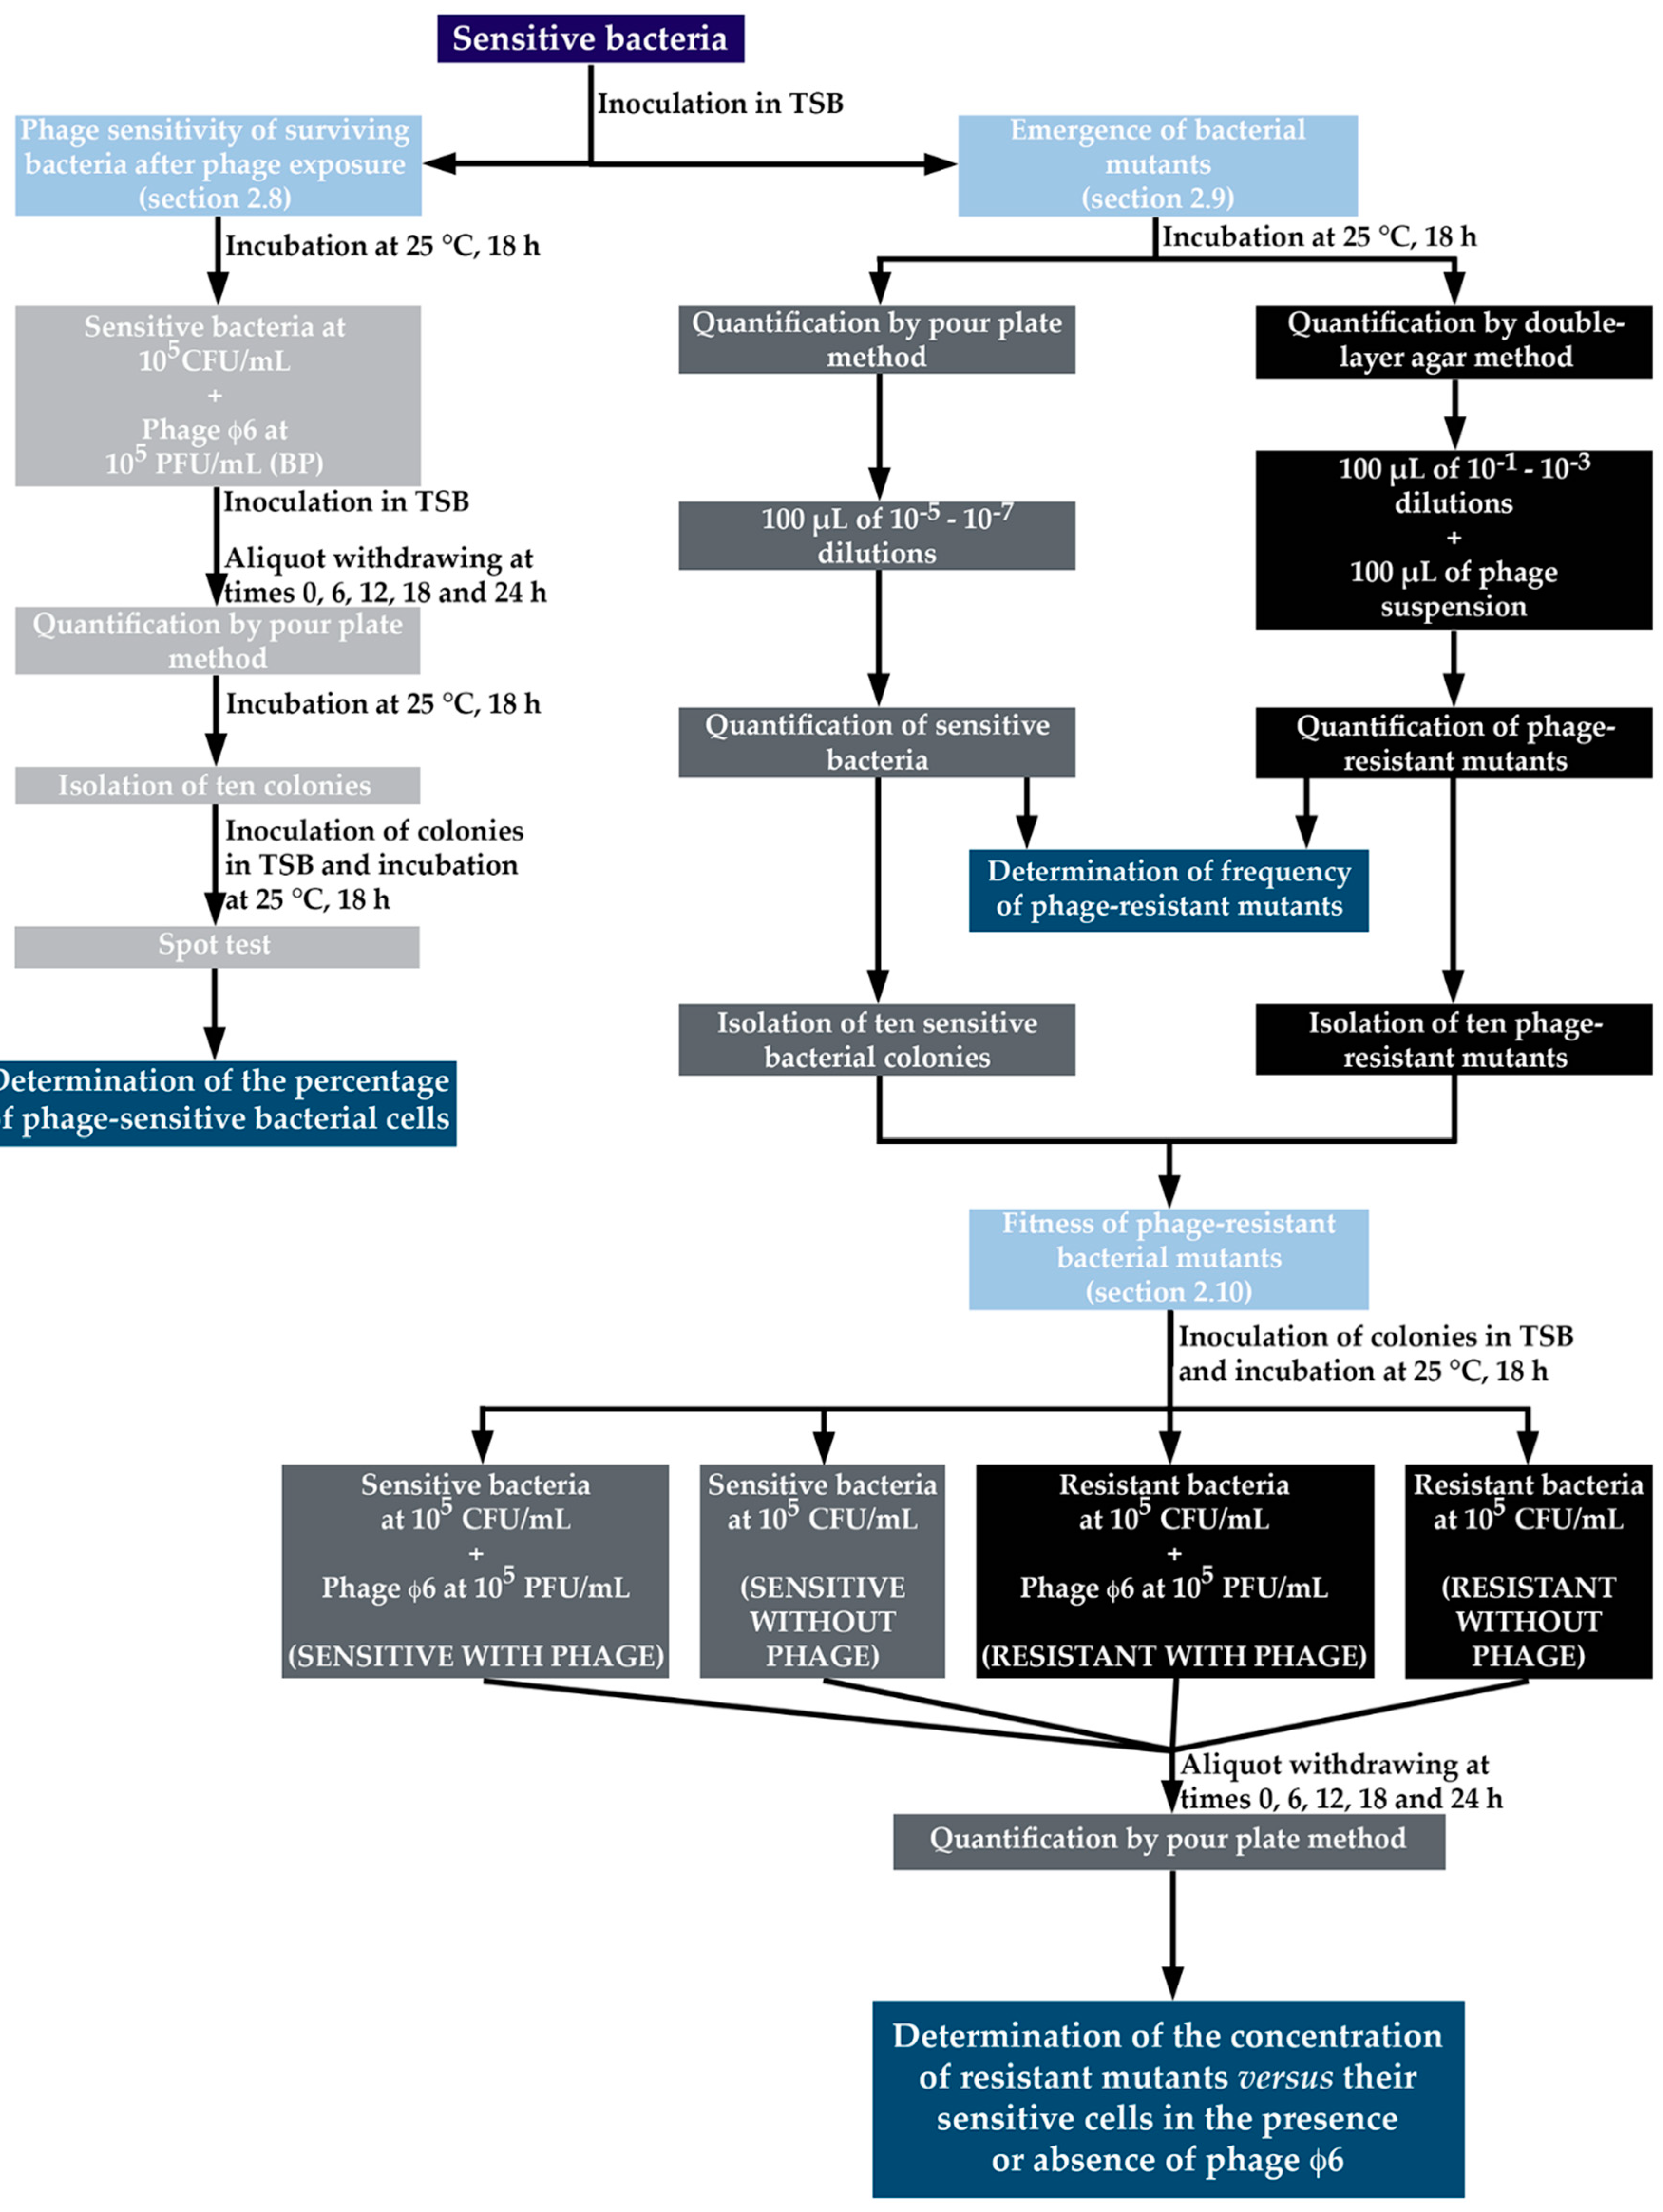
2.8. Phage Sensitivity of Surviving Bacteria after Phage Exposure

The phage sensitivity of surviving bacteria after phage exposure was determined using the killing curves samples collected at time zero and after 6, 12, 18, and 24 h of incubation. The bacterial colonies of the test samples (BP) at a MOI of 1 were used (as described in Section 2.7.) (Figure 1), because this MOI was the best one to control P. syringae pv. syringae. To check whether the bacterial strain remained sensitive to phage φ6 during the bacterial kill assays, 10 isolated colonies (randomly picked) of the bacterial control and test samples at time 0, 6, 12, 18, and 24 h were inoculated separately into TSB and grown at 25 °C during 18 h at 120 rpm and tested using the spot test procedure. Three hundred microliters of bacterial culture previously inoculated with TSB 0.6% agar were overlaid on solid TSA and spotted with 10 μL of the phage φ6 suspension. The plates were incubated at 25 °C and examined for the presence of lysis plaques after 18 h. The percentage of phage sensitivity of surviving bacteria was calculated as (the number of sensitive bacteria (positive spot test) in test samples (BP)/the number of tested colonies)) × 100. Three independent assays were performed.

2.9. Isolation of Phage-Resistant Mutants and Determination of the Frequency of Emergence of Phage-Resistant Bacterial Mutants

The development of resistant mutants of P. syringae pv. syringae to phage φ6 was evaluated according to the procedure described by [51] (Figure 1). To determine the frequency of phage-resistant bacteria, 10 isolated colonies from a plate with sensitive bacteria were selected and inoculated into 10 test tubes with 5 mL of TSB, and grown at 25 °C for 18 h at 120 rpm stirring. Aliquots of 100 µL from the 10−1 to 10−3 dilutions of the bacterial culture and aliquots of 100 µL of the phage from a stock solution of 108 PFU/mL were inoculated into test tubes containing TSB 0.6% agar, plated on TSA plates, and incubated at 25 °C for 48 h. Simultaneously, 100-µL aliquots of 10−5 to 10−7 dilutions of the bacterial culture were plated by incorporation on TSA plates without phage and incubated at 25 °C for 48 h. The calculation of the frequency of P. syringae pv. syringae spontaneous phage-resistant mutants was done by dividing the number of resistant bacteria (obtained from the bacteria that emerge in the presence of phage particles) by the total number of sensitive bacteria (prepared from the culture without phages) [51]. Sensitive and phage-resistant colonies were picked up and purified by successive sub-culturing in TSA in order to remove attached phage particles, and were used in further experiments (as described in Section 2.10). Three independent assays were performed.

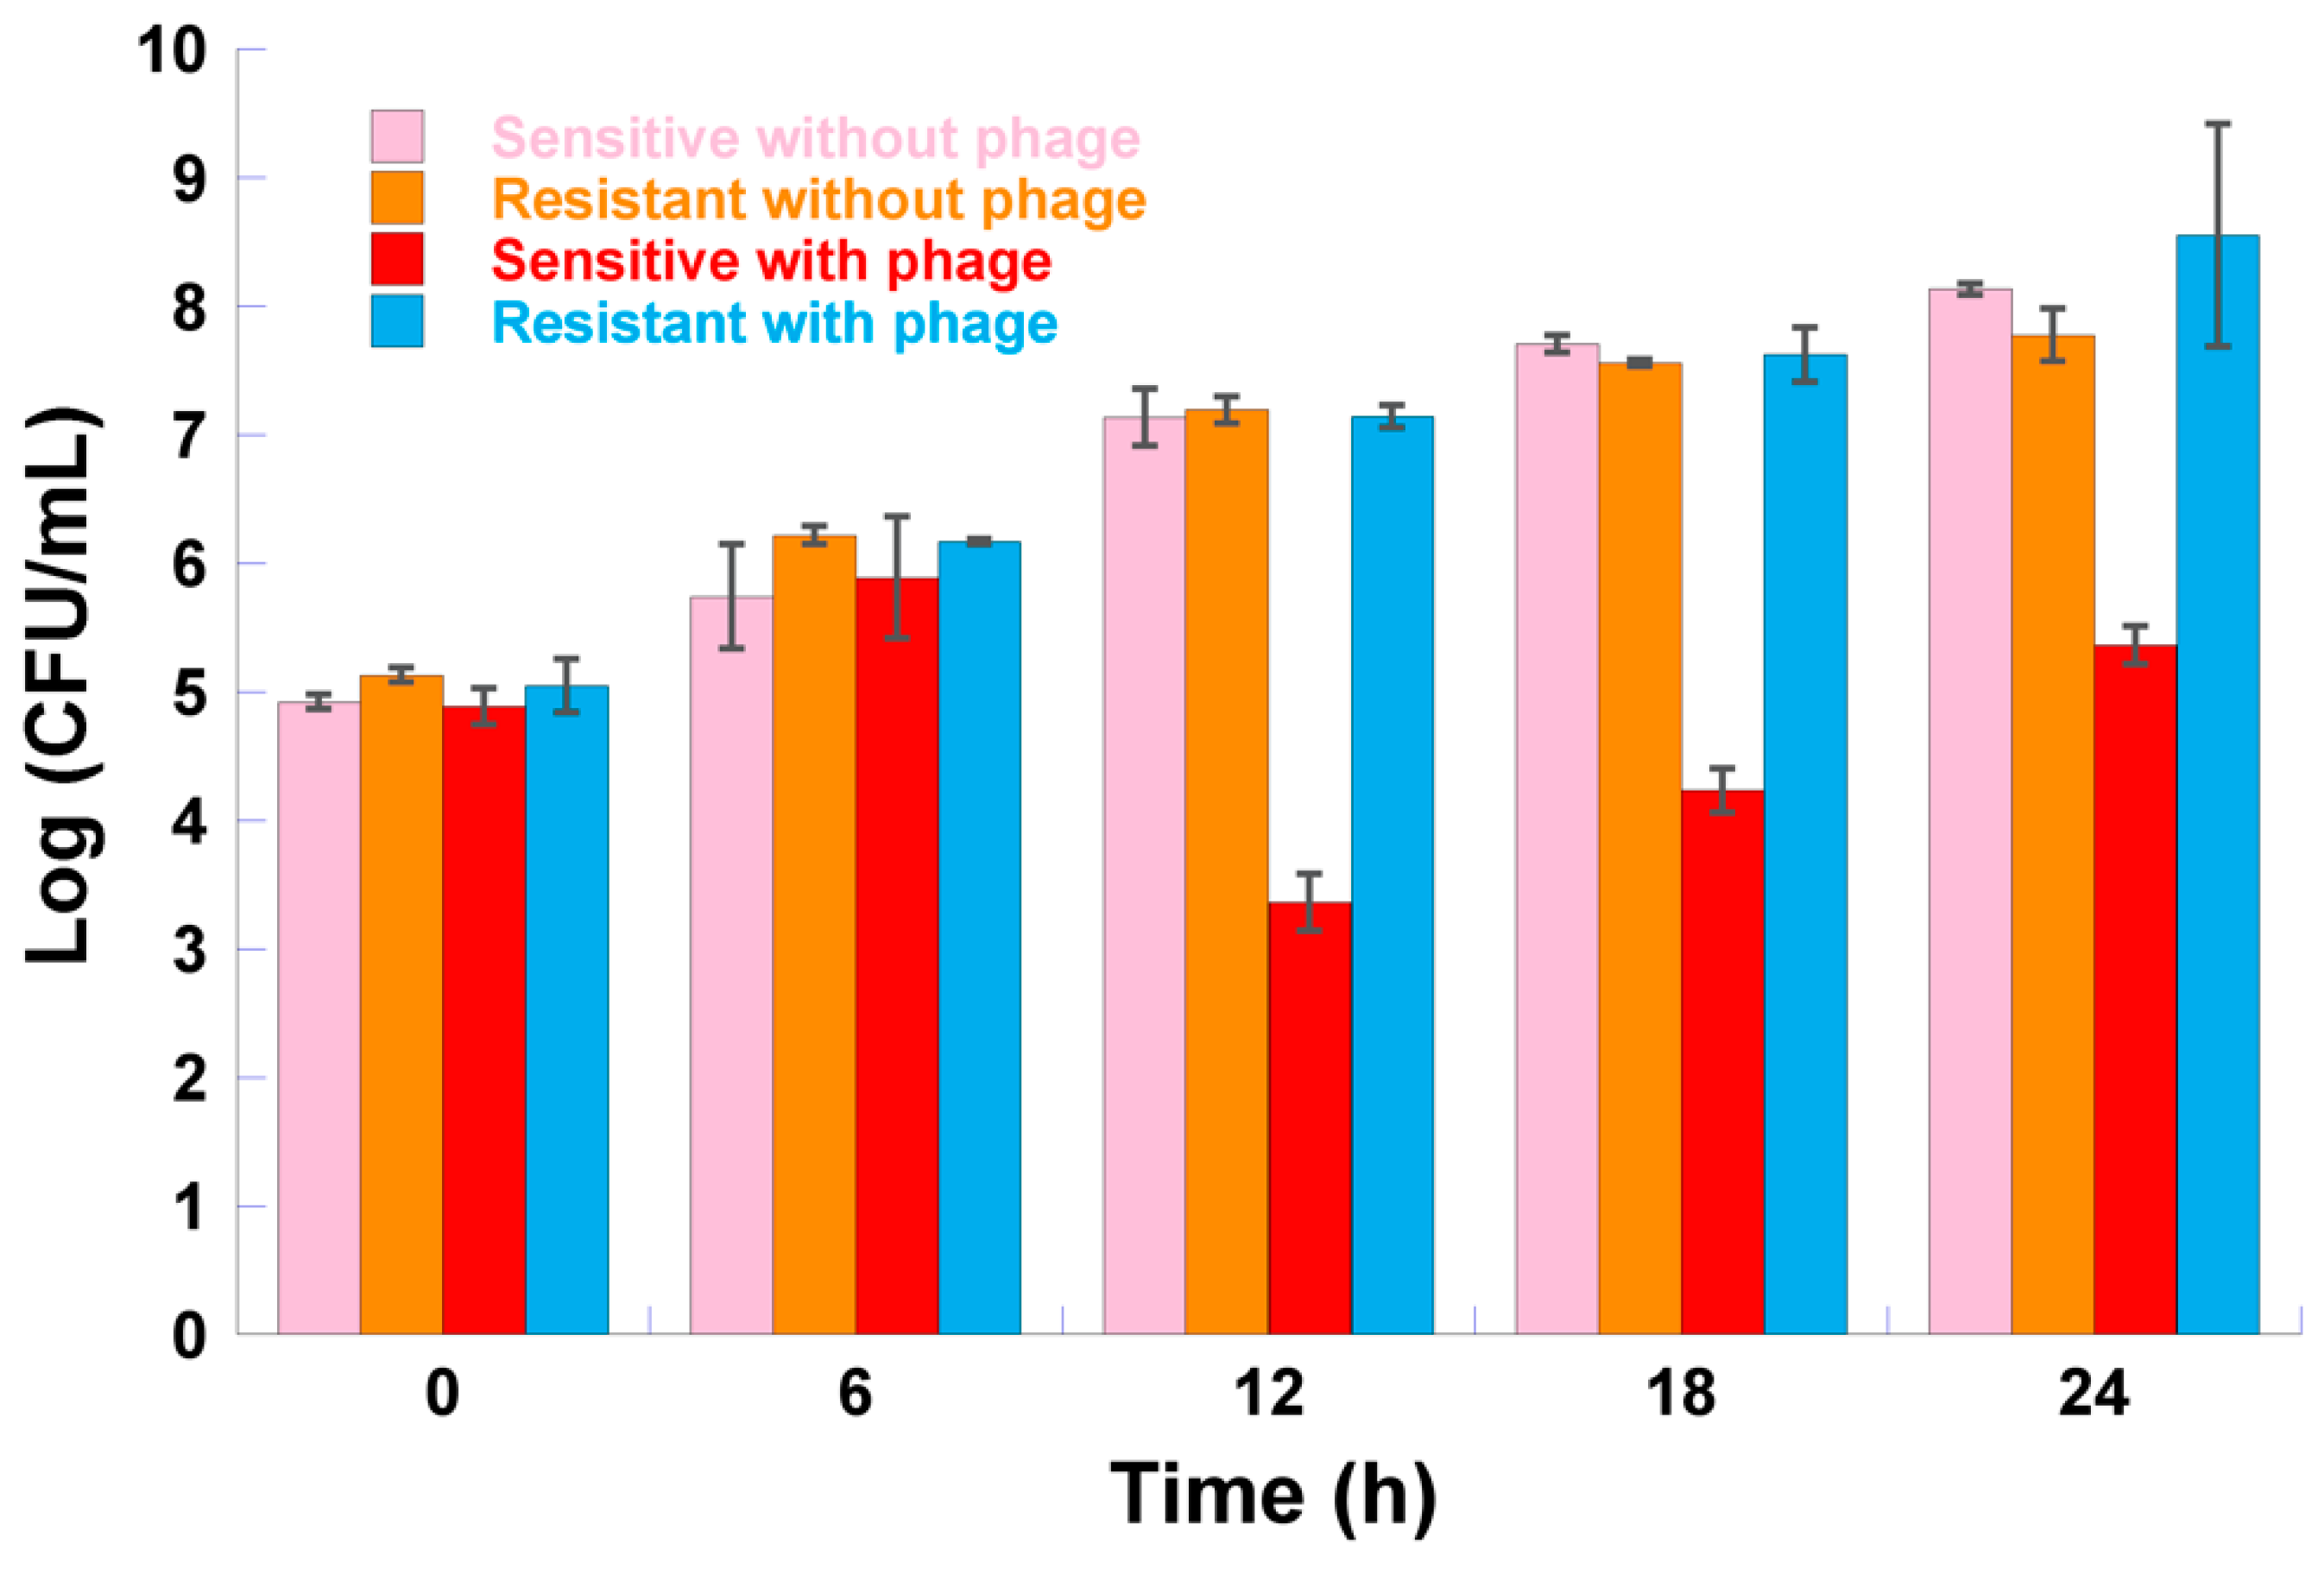
2.10. Fitness of Phage-Resistant Bacterial Mutants

The concentration of the sensitive and resistant bacterial cell populations (isolated after phage exposure in Section 2.9) was quantified in the presence and in the absence of phage φ6, in order to evaluate the cost (“the fitness”) that the bacteria suffers to develop resistance to the phage (Figure 1). The MOI of 1 was selected for these experiments because it was the best condition to control P. syringae pv. syringae. Sensitive P. syringae pv. syringae was added to 2 out of 4 samples in order to obtain a final concentration of 105 CFU/mL. One of the samples inoculated with sensitive P. syringae pv. syringae was inoculated with phage φ6 to obtain a final concentration of 105 PFU/mL (sensitive with phage φ6) and the remaining infected sample did not have phage added (sensitive bacteria without phage). Mutants resistant to phage φ6 were added to 2 out of 4 samples to obtain a final concentration of 105 CFU/mL. One of these samples was inoculated with phage φ6 (resistant bacteria with phage φ6) to obtain a final concentration of 105 PFU/mL and the remaining infected sample did not have phage added (resistant bacteria without phage). Samples were incubated at 25 °C and bacterial concentration (CFU/mL) was determined in triplicate via the drop plate method in solid TSA medium at time 0 and after 6, 12, 18, and 24 h of incubation. The plates were incubated at 25 °C for 48 h. Three independent experiments were performed.

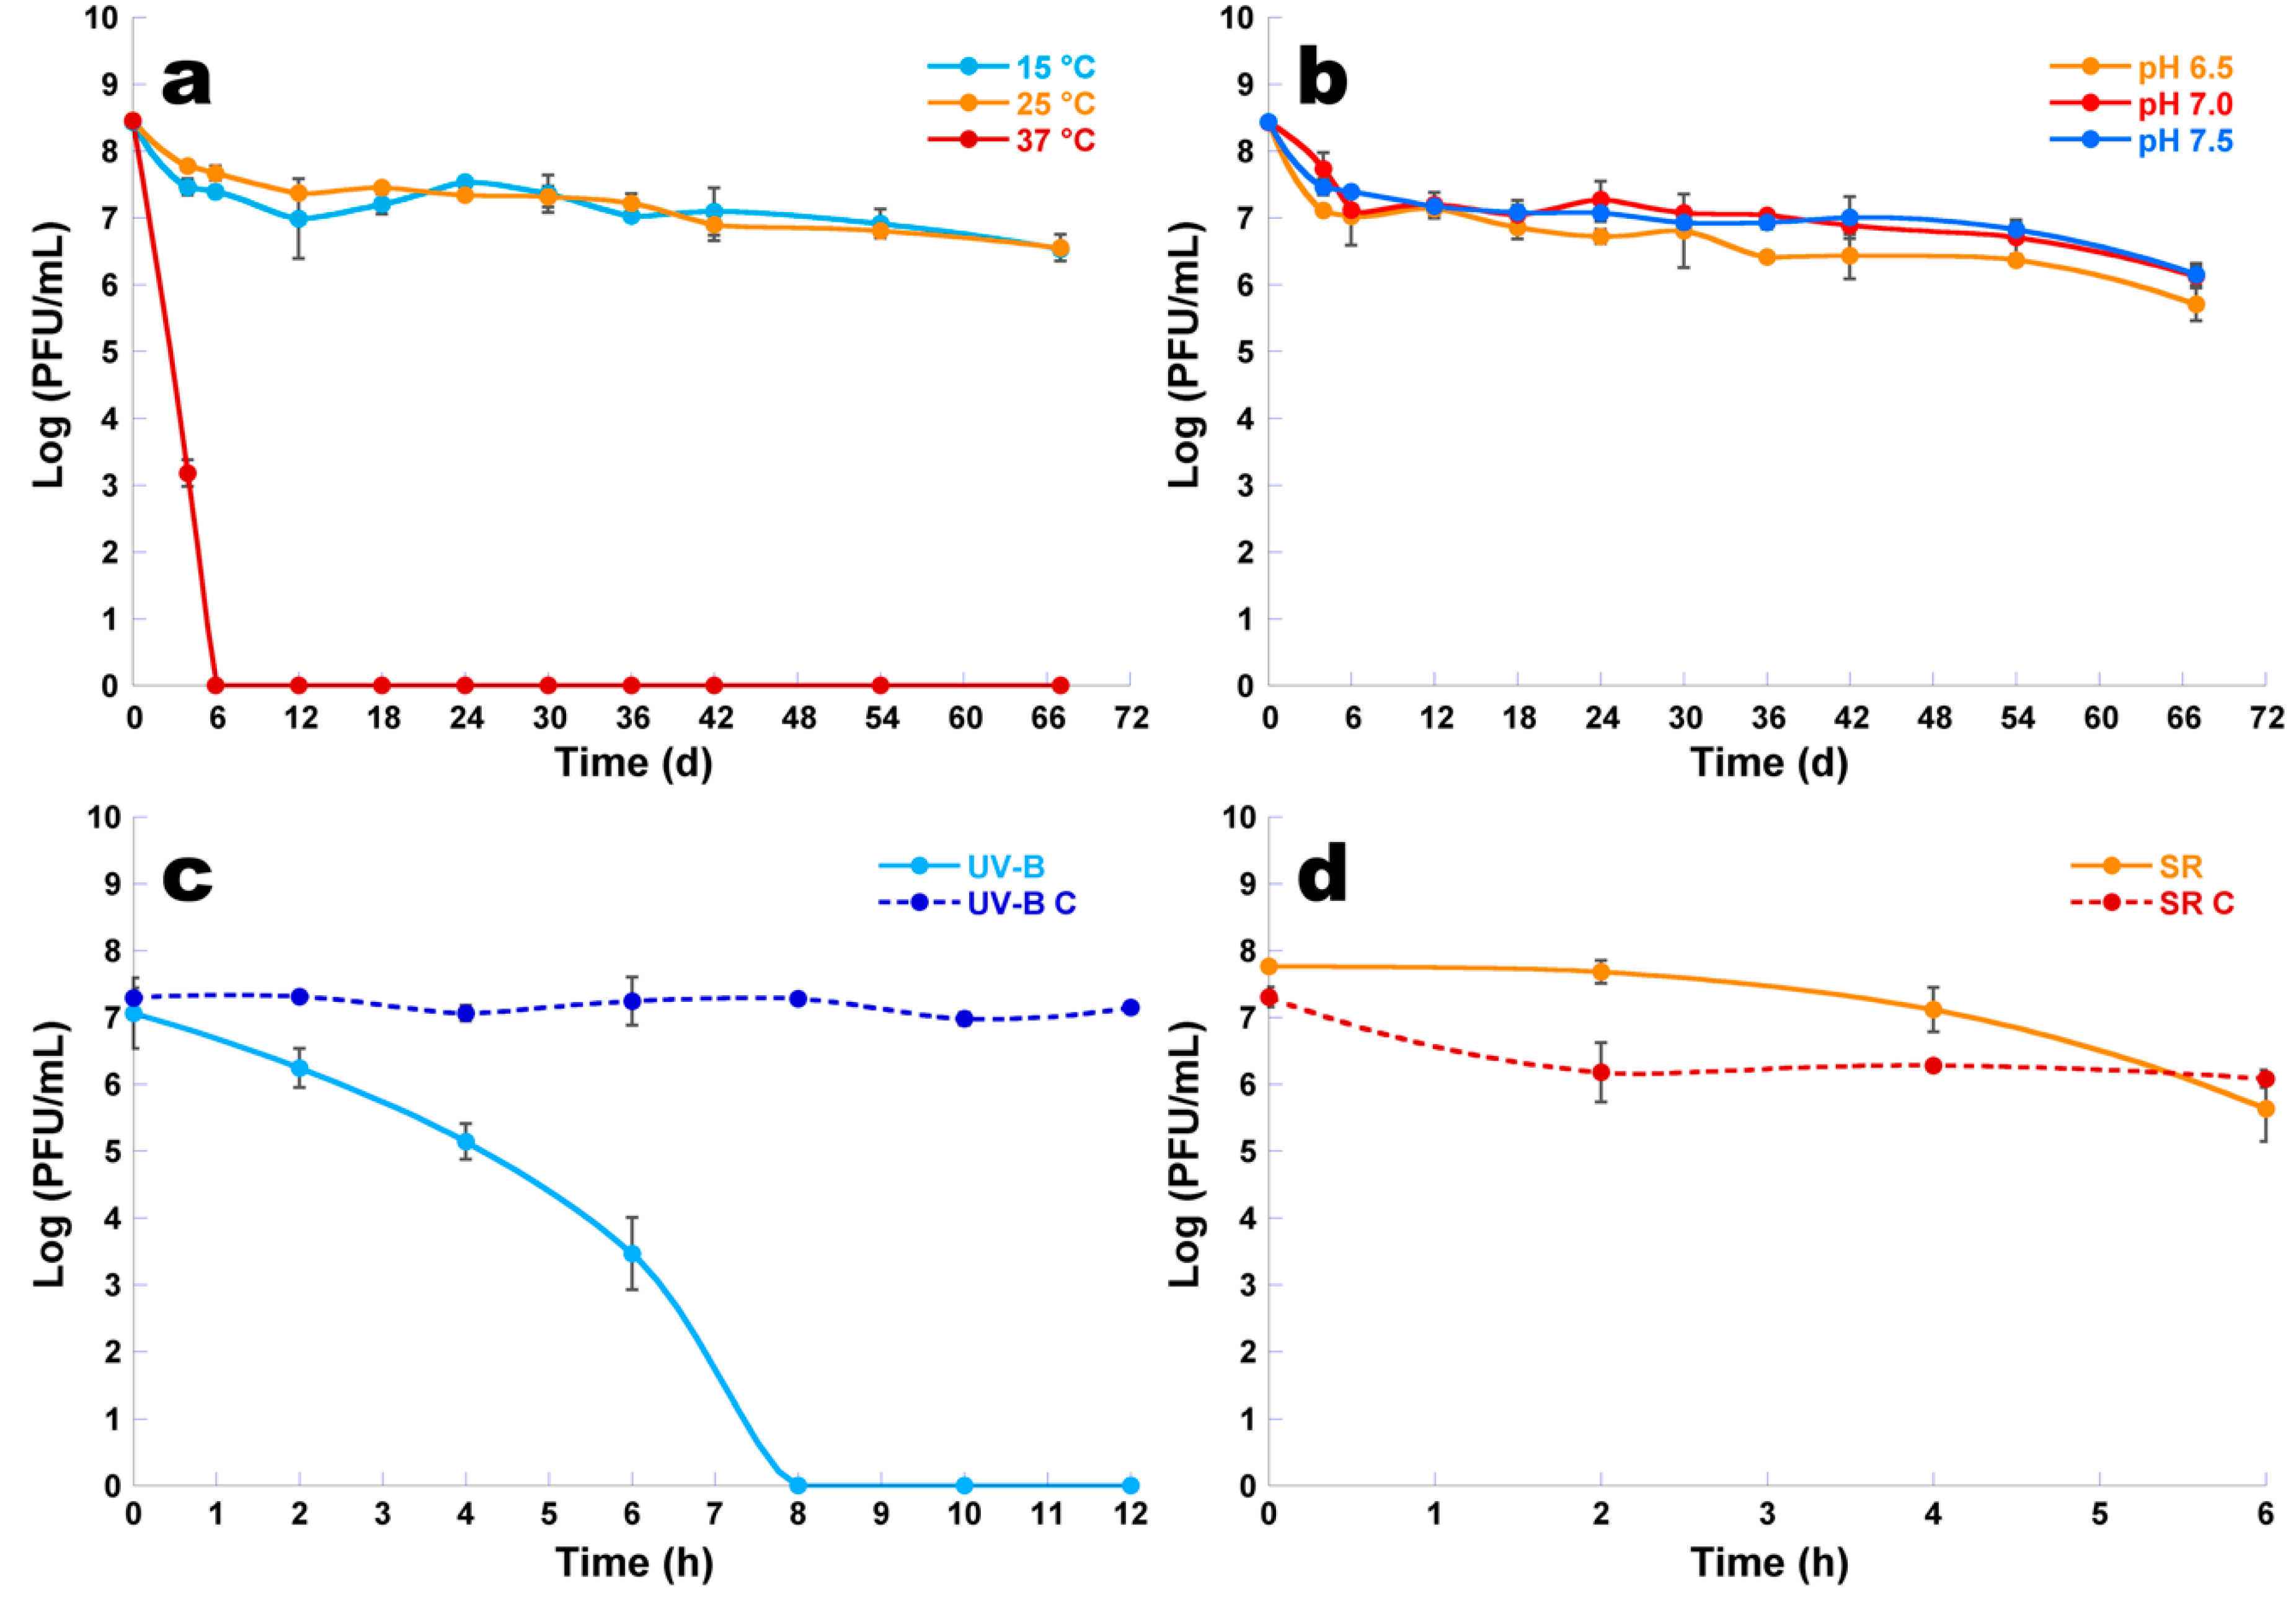
2.11. Assessment of the Effect of Environmental Factors upon Phage φ6 Viability

The effects of temperature, pH, and radiation (sunlight and UV-B light) upon the viability of phage φ6 (final concentration of 107 PFU/mL) was tested in 30 mL of phosphate buffered saline (PBS). In the experiments, to evaluate the effect of pH and temperature, aliquots were collected after 0, 4, 6, 12, 18, 24, 30, 36, 42, 54, and 67 days of incubation. To evaluate the effect of UV-B irradiation, aliquots were collected after 0, 2, 4, 6, 8, 10, and 12 of incubation. To assess the effect of solar radiation, aliquots were collected after 0, 2, 4, and 6 h of exposure. Phage titer was determined in triplicate via the double-layer agar method and plates were incubated at 25 °C for 18 h. Three independent experiments were performed for each condition.

2.11.1. pH Experiments

In order to evaluate the effect of pH upon phage viability, suspensions of phage φ6 were added to sterile PBS with pH values of 6.5, 7.0, and 7.5. During these experiments, the temperature of the samples was kept at 25 °C.

2.11.2. Temperature Experiments

To evaluate the effect of temperature upon phage viability, the samples were maintained at a constant temperature (15, 25, and 37 °C) in an incubating chamber. The experiments were performed in sterile PBS at pH 7.0.

2.11.3. UV-B Irradiation Experiments

In order to evaluate the effect of UV-B irradiation (290–320 nm), an ultra-violet type B lamp TL 20 W/12 RS (Philips, Holland) was used and placed at a distance of 25 cm from the samples. The experiments were performed in sterile PBS at pH 7.0 and at ambient temperature. The control sample (UV-B C) was incubated in the same conditions as the test sample (UV-B) but was not exposed to UV-B radiation.

2.11.4. Solar Radiation Experiments

To evaluate the effect of solar radiation, a suspension of phage φ6 was added to sterile PBS at pH 7.0 and exposed to natural solar radiation. The control sample (SR C) was incubated in the same conditions as the test sample (S) but was not exposed to solar radiation. The experiments were performed under a solar irradiance of 2.82 kWh/m2 in a day with ambient temperature ranging from 14 to 24 °C.

2.12. Statistical Analyses

Statistical analysis of the data was performed using the software GraphPad Prism 7.04 (GraphPad Software, San Diego CA, USA). Normal distribution of the data was checked by a Kolmogorov–Smirnov test and the homogeneity of variance was assessed by the Levene’s test. The significance of bacterial and viral concentrations between treatments, and along the experiments, was tested using two-way ANOVA and the Bonferroni post-hoc test. For different treatments, the significance of differences was evaluated by comparing the result obtained in the test samples with the results obtained for the correspondent control samples, for the different times (Section 3.6). Two-way ANOVA was used to examine differences between the concentration of resistant bacteria and sensitive bacteria in the presence/absence of the phage after 6, 12, 18, and 24 h of incubation (Section 3.8). The significance of the effect of physico-chemical factors on phage φ6 viability and incubation time was assessed by one-way analysis of variance (Section 3.9). Tukey’s multiple comparison test was used for a pairwise comparison of the means. A value of p < 0.05 was considered to be statistically significant.

3. Results

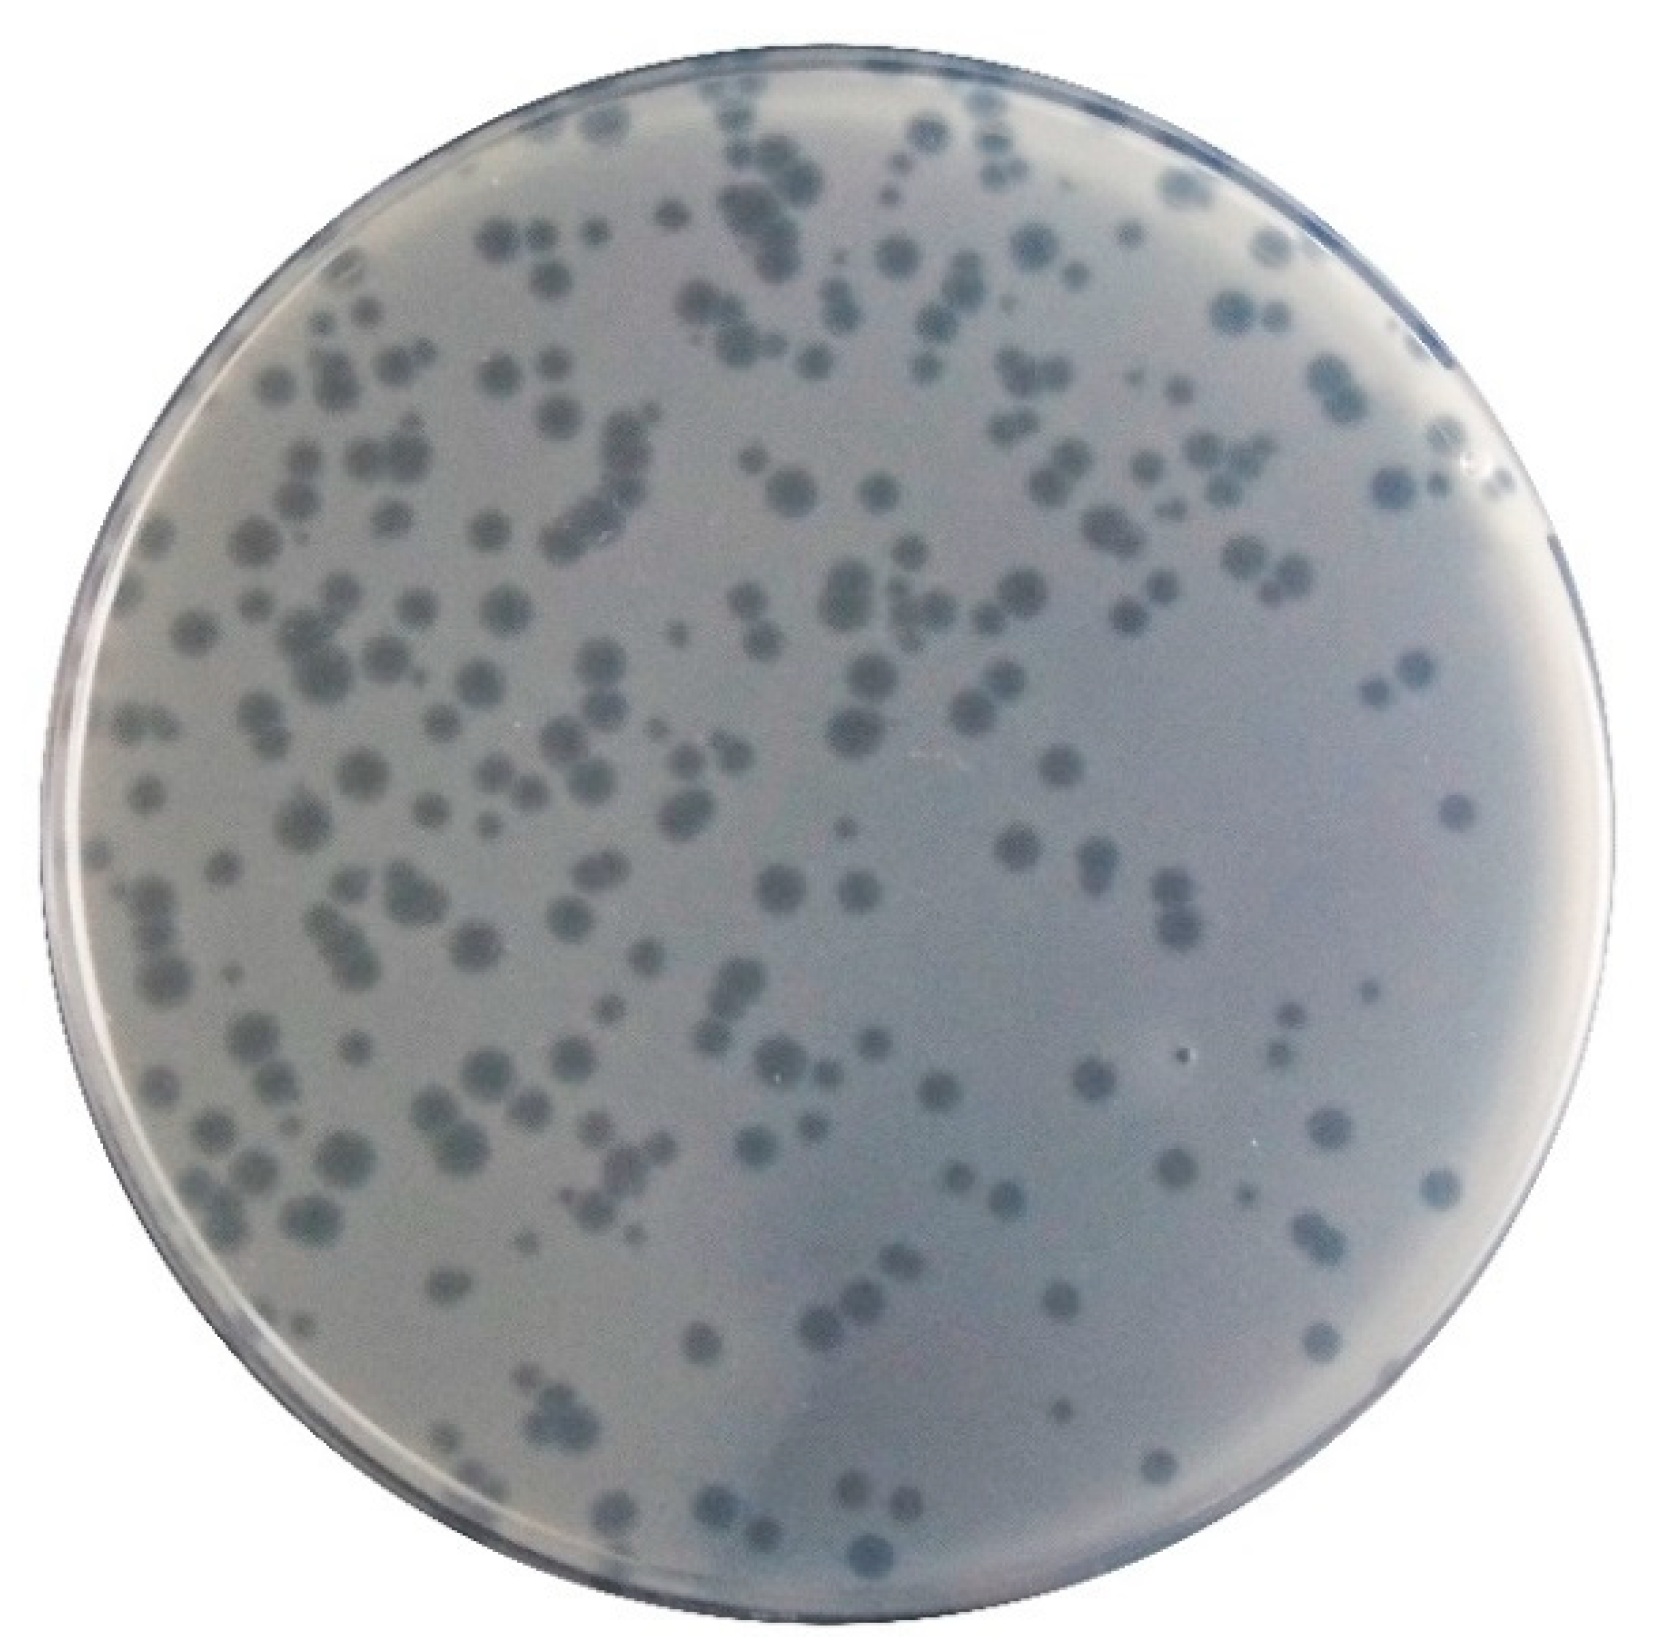
3.1. Phage Preparation and Enrichment

Phage φ6 formed clear plaques on the P. syringae pv. syringae with a diameter of 1 to 2 mm (Figure 2). Phage plaques exhibit a secondary halo in the frontier of the lysis plaque of phage (Figure 2). High titer suspensions (108–109 PFU/mL) were obtained for the phage φ6.

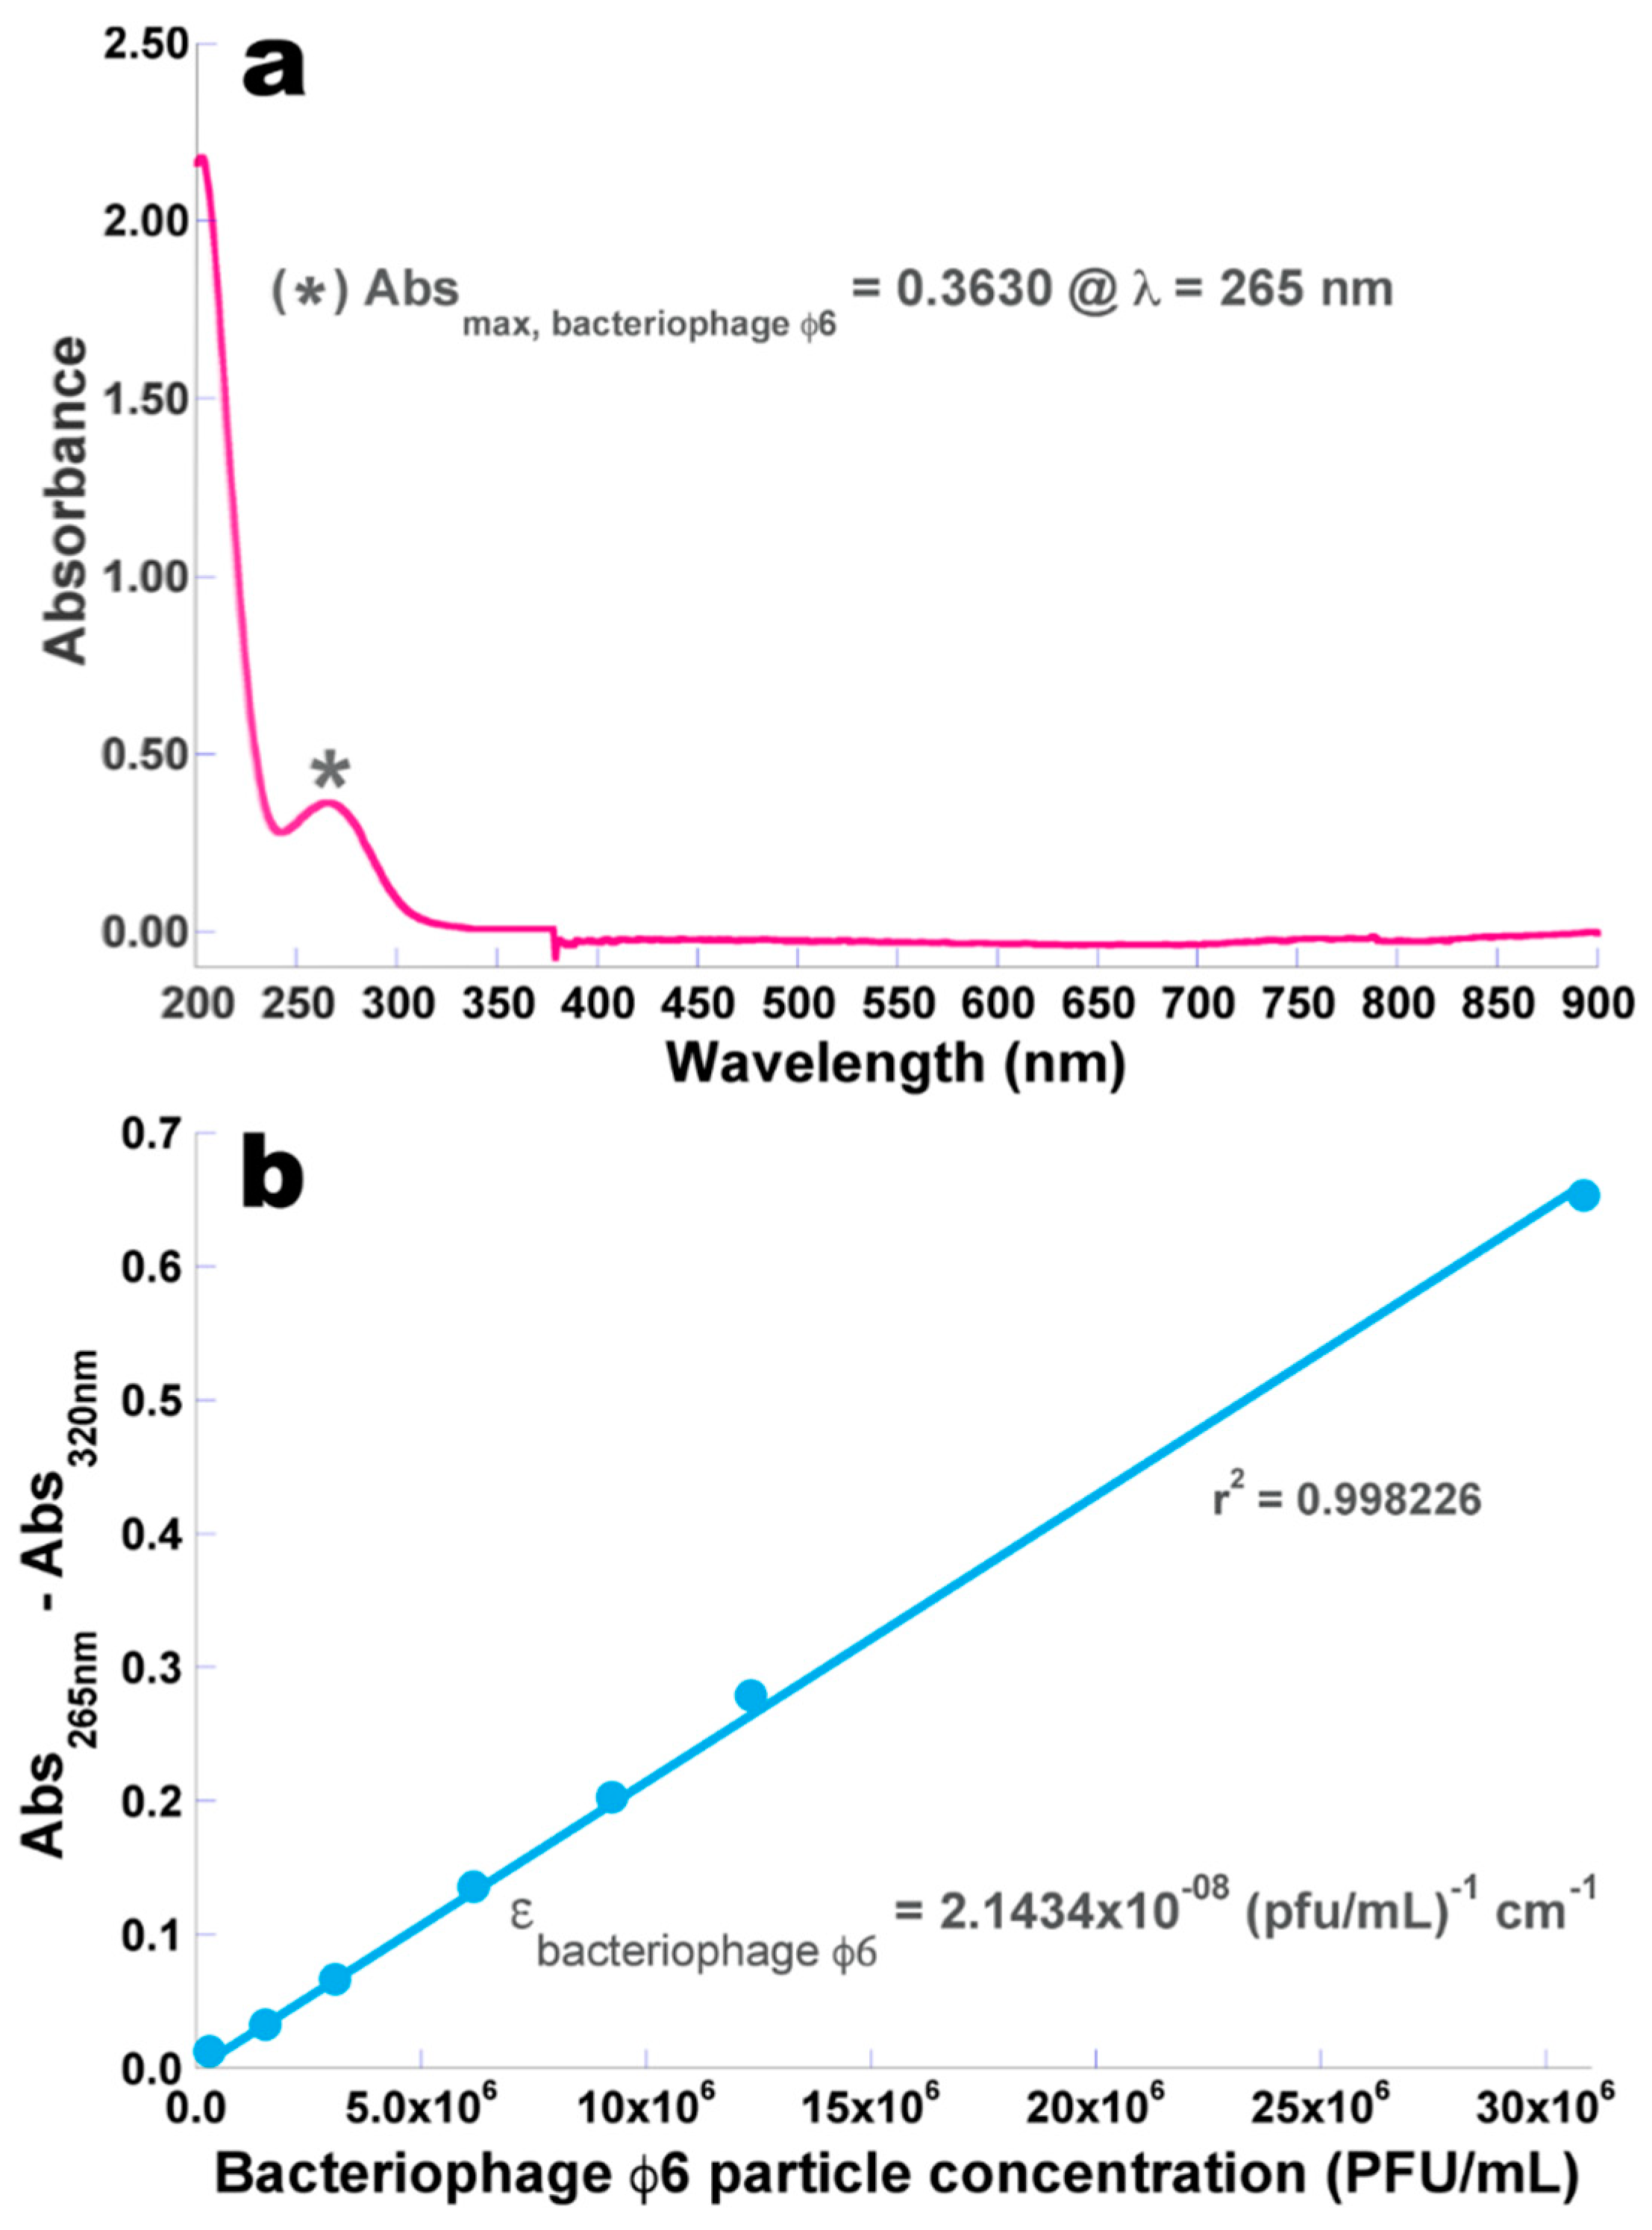
3.2. Determination of the Molar Extinction Coefficient of the Isolated Phage φ6 Particles

The results obtained from the UV-Vis scanning performed to the concentrated phage φ6 suspension are displayed in Figure 3a, whereas the data utilized to prepare the calibration curve relating the phage particle concentration and its corrected absorbance (Figure 3b) are displayed in Table 2.
A pronounced minimum absorption can be observed around 245 nm (indicative of the absence of bacterial cell debris and any other intracytoplasmic proteins and the presence of high concentration of phage virions) (Figure 3a).
A linear fitting of the Beer–Lambert equation was then performed on the experimental data (Abs265 nm–Abs320 nm=ƒ (phage particle concentration, PFU/mL)), allowing determination of the molar extinction coefficient of phage φ6 as ε = 2.1434 × 10⁻⁸ (pfu/mL)−1 cm−1.

3.3. Phage Host Range and Efficiency of Plating (EOP)

The spot tests and EOP results indicated that phage φ6, in addition to P. syringae pv. syringae, formed phage lysis plaques on 2 of the 24 strains tested (Table 1). Phage φ6 infected P. syringae pv. actinidiae CRA-FRU 12.54 and P. syringae pv. actinidiae CRA-FRU 14.10, with an efficiency of 101.3% and 96.8%, respectively.

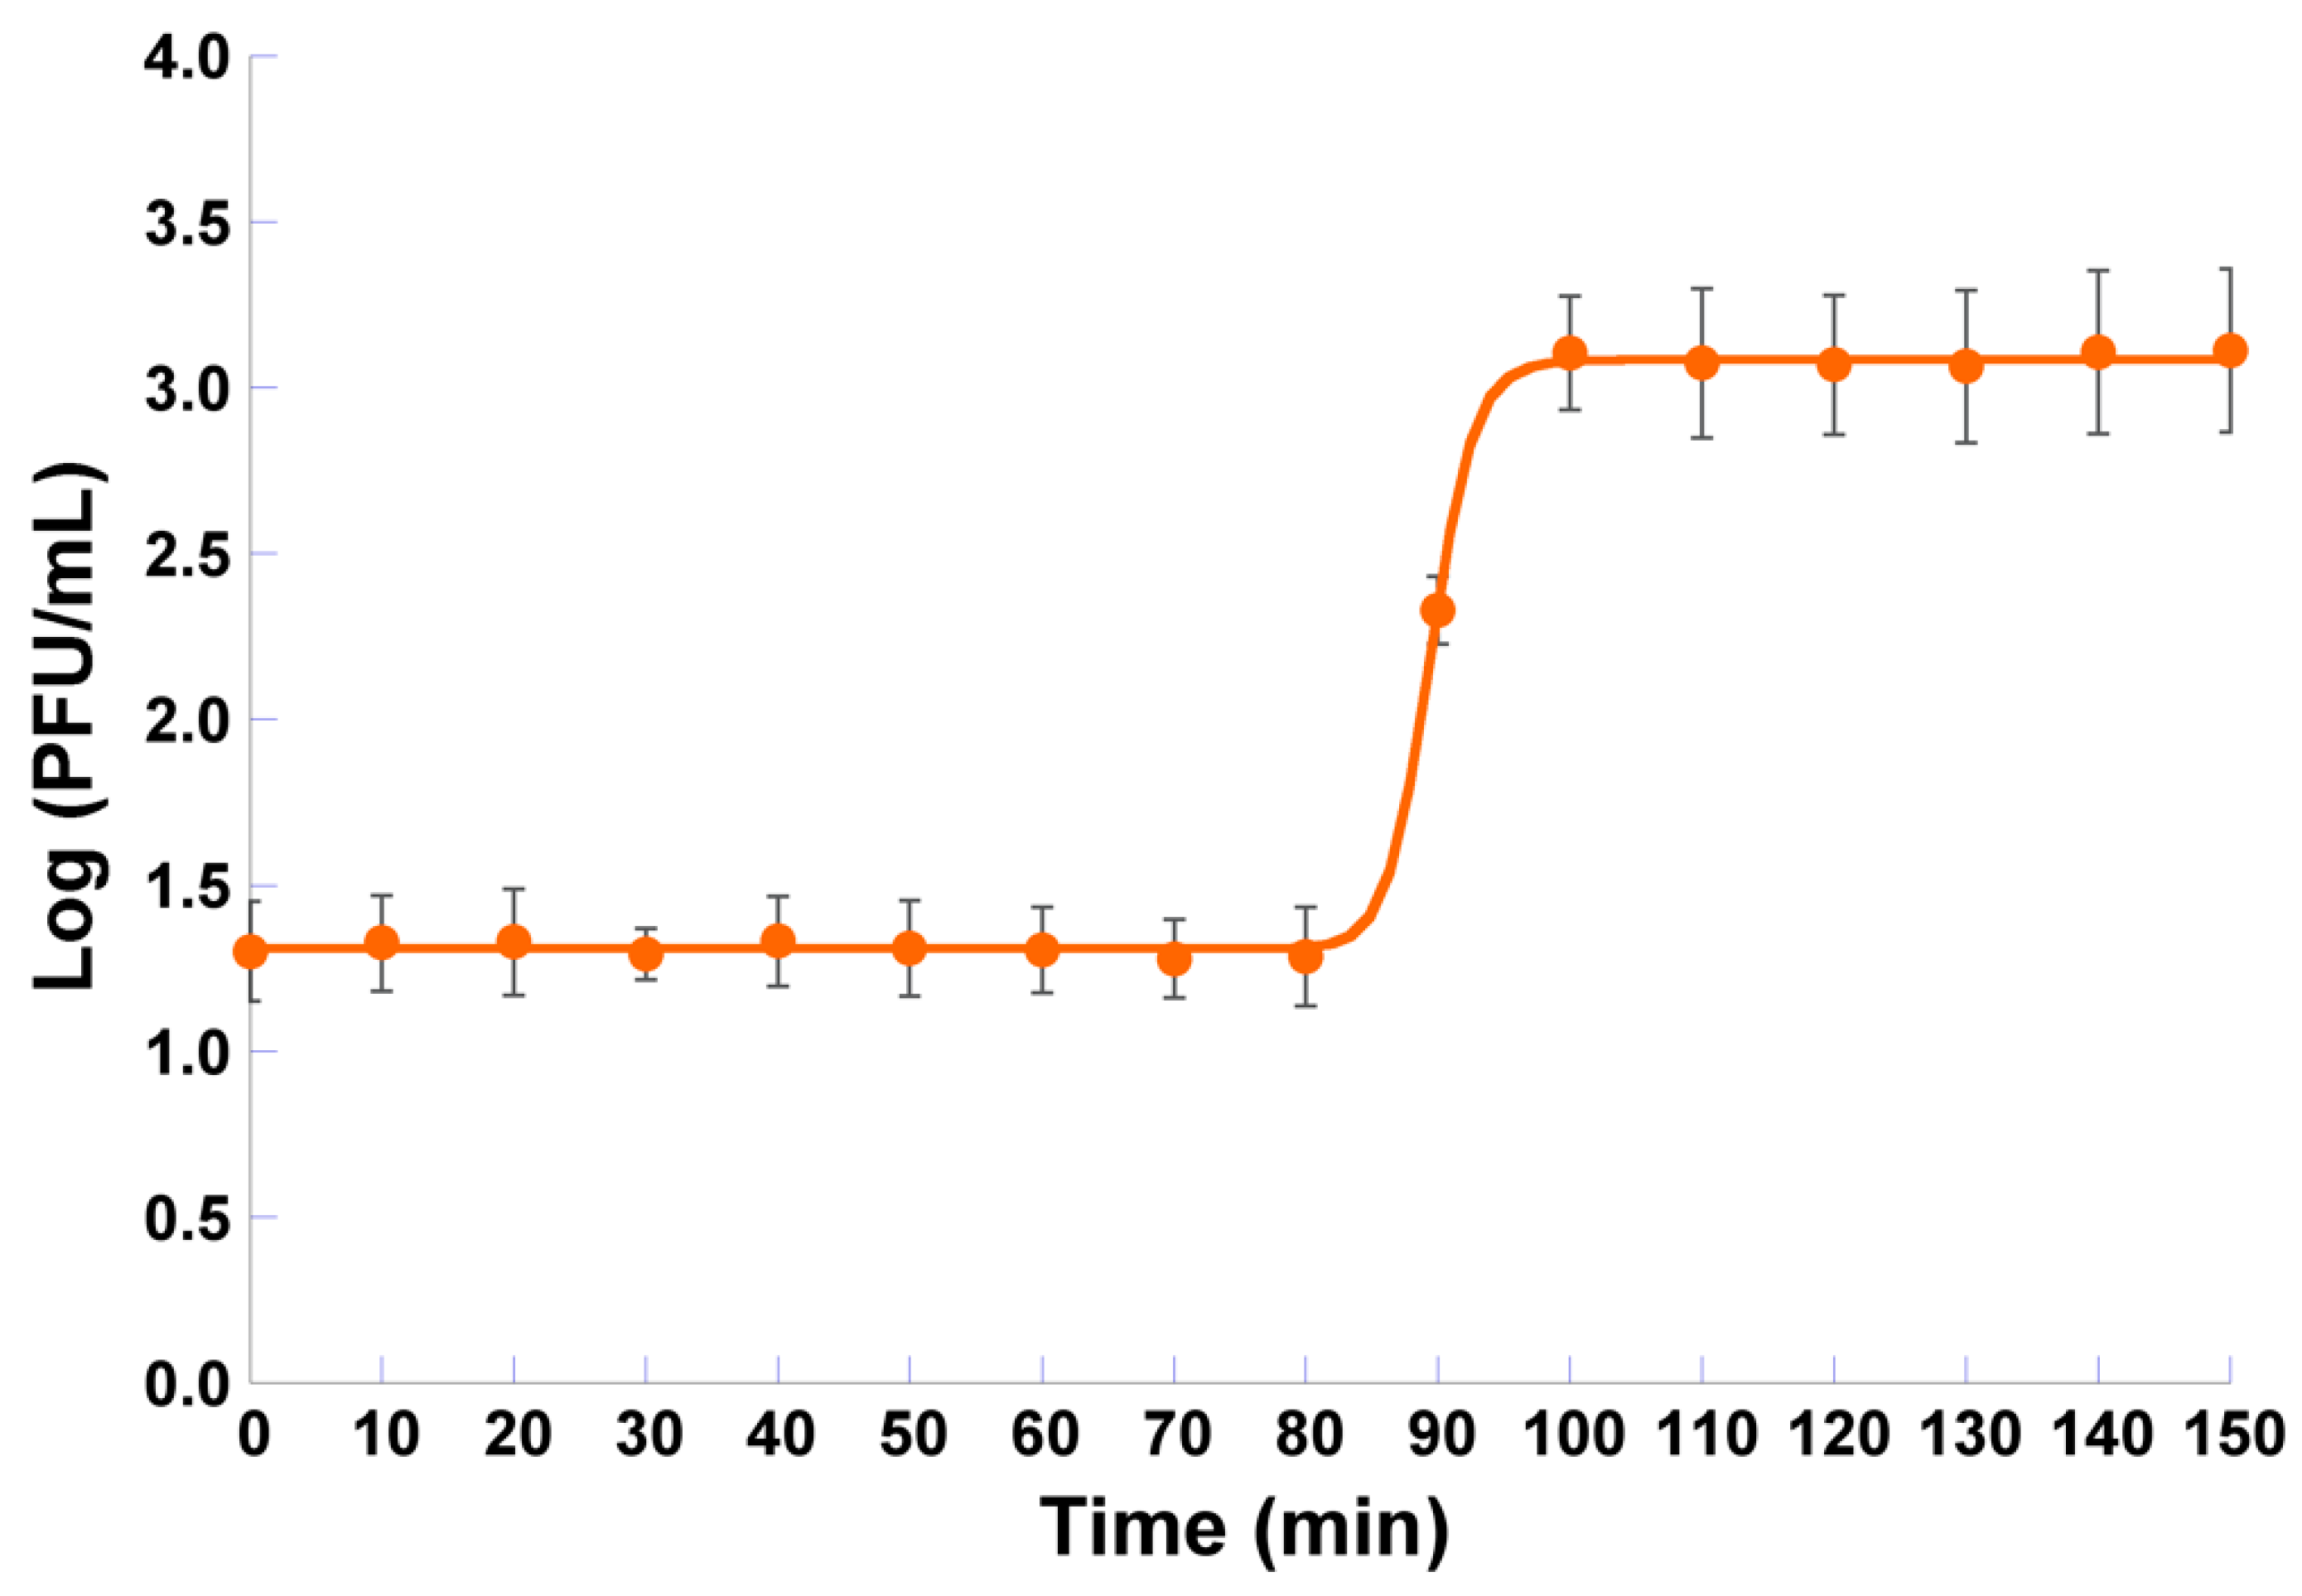
3.4. One-Step Growth Curve Analysis

Non-linear fitting of the one-step growth data to a four-parameter logistic model resulted in a good correlation coefficient (viz. 0.9997) and showed that the eclipse period, latent period, and intracellular accumulation period lasts 80, 100, and 20 min, respectively (Figure 4). The burst size of phage φ6 was 60 ± 1 PFU/host cell (Figure 4).

3.5. Adsorption Curve

Phage φ6 adsorption assays showed that approximately 50% of the phage particles adsorb to P. syringae pv. syringae after 30 min, 75% adsorbed after 60 min, and 95% adsorbed after 120 min (Figure 5).
Nonlinear fitting of the experimental data to the model depicted in Equation (2) resulted in a good correlation coefficient (viz. 0.9951) and allowed determination of the adsorption rate of phage φ6 onto P. syringae pv. syringae cells as δ = (9.495 ± 0.660) × 10−12 PFU−1 CFU−1 mL−1 hr−1 and a bacteria multiplication rate of µ(t) = (2.489 ± 2.055) × 10−3 hr−1.

3.6. Bacterial Kill Curves and Host Sensitivity to Phage φ6

At a MOI of 1 and 100, the maximum P. syringae pv. syringae inactivation with phage φ6 was 3.9 and 2.6 log CFU/mL, respectively (Figure 6a, ANOVA, p < 0.05), achieved after 12 and 24 h of incubation, when compared with those of the bacterial control (BC). During the first 10 h of incubation, the inactivation factor was similar for a MOI of 1 and 100 (ANOVA, p > 0.05). At a MOI of 1, after 12, 14, and 18 h of incubation, the decrease in P. syringae pv. syringae counts (3.9, 3.7, and 3.6 CFU/mL, respectively) was significantly higher (ANOVA, p < 0.05) than that obtained with the MOI of 100 (1.8, 2.1, and 2.6 CFU/mL, respectively). The rates of bacterial reduction at the end of incubation were statistically similar (ANOVA, p > 0.05) for the two MOI values (Figure 6a).
Bacterial density in the BC increased by 3.0 log CFU/mL (ANOVA, p < 0.05) during the 24 h of incubation (Figure 6a). During the 24 h timeframe of the experiments, phage concentration in the controls (PC) decreased (1.3 and 1.7 log PFU/mL, ANOVA, p < 0.05) for the MOI of 1 and 100, respectively (Figure 6b). When phage φ6 was incubated in the presence of its host, a significant increase in the phage particle concentration (4.1 and 1.9 log PFU/mL, ANOVA, p < 0.05) was observed for the MOI of 1 and 100 (Figure 6b).
At time zero and after 6, 12, 18, and 24 h of incubation, 10 colonies of the test sample were isolated, to check whether the P. syringae pv. syringae remained sensitive to phage φ6 during the bacterial kill assays. During the first 18 h of incubation, P. syringae pv. syringae was sensitive to phage φ6. However, after 24 h of incubation, it was observed that only 66.7% of the tested bacteria were sensitive to phage φ6 (Figure 6c).

3.7. Determination of the Frequency of Emergence of Phage-Resistant Bacterial Mutants

The frequency of P. syringae pv. syringae mutants resistant to phage φ6 was (1.20 ± 0.62) × 10−3 (Table 3).

3.8. Fitness of Phage-Resistant Mutants

In the presence of phage φ6, after 6 h of incubation, no differences were found between the concentration of resistant bacteria and the concentration of sensitive bacteria (Figure 7, ANOVA, p < 0.05). However, after 12, 18, and 24 h of incubation, differences were observed between the concentration of resistant bacteria and the concentration of sensitive bacteria. Resistant bacteria reached a higher concentration at 12, 18, and 24 h of incubation when compared to its sensitive counterpart.
In the absence of phage φ6, no differences (Figure 7, ANOVA, p > 0.05) were found between the concentration of resistant bacteria and the concentration of sensitive bacteria.
During the 24 h of incubation, no differences (Figure 7, ANOVA, p > 0.05) were found between the concentration of resistant bacteria in the presence of phage φ6 and the concentration of resistant bacteria in the absence of phage φ6.

3.9. Assessment of the Effect of Environmental Factors upon Phage φ6 Viability

3.9.1. Temperature Experiments

The reduction in the concentration of viable phage φ6 particles was higher at 37 °C than at 15 and 25 °C (Figure 8a, ANOVA, p < 0.05). A maximum decrease of 8.5 log PFU/mL was observed after 6 days when the samples were kept at a temperature of 37 °C, but after only 4 days at this temperature, the decrease was of 5.3 log PFU/mL. When the temperature was decreased to 15 and 25 °C, the rate of maximum reduction slightly decreased to 2.0 log PFU/mL after 67 days of incubation. The difference between these two temperatures was not statistically significant (Figure 8a, ANOVA, p > 0.05).

3.9.2. pH Experiments

When different pH values (6.5, 7, and 7.5) were tested, it was observed that the phage concentration slightly decreased with the decrease of pH; however, the differences among the three values of pH were not statistically significant (Figure 8b, ANOVA, p > 0.05). In the three pH values studied, phage φ6 persisted as viable for at least 67 days at 25 °C (Figure 8b). The abundance of phage φ6 decreased about two orders of magnitude over the 67 days (Figure 8b, ANOVA, p < 0.05).

3.9.3. UV-B Experiments

When phage φ6 was exposed to UV-B irradiation, it was observed that the phage concentration decreased (Figure 8c, ANOVA, p < 0.05) during 12 h of incubation when compared with the phage control (UV-B C). The abundance of phage exposed to UV-B irradiation decreased about 0.8 log PFU/mL after 2 h of incubation, but after 6 h the decrease was of 3.5 log PFU/mL. A maximum decrease of 7.0 log PFU/mL was observed after 8 h when compared with the phage control (UV-B C) (Figure 8c, ANOVA, p < 0.05) (Figure 8c). The concentration of the phage φ6 not exposed to UV-B irradiation (UV-B C) remained constant (Figure 8c, ANOVA, p > 0.05) during 12 h of incubation.

3.9.4. Solar Radiation Experiments

When phage φ6 was exposed to solar radiation, the abundance of phage φ6 decreased 2.1 log PFU/mL (Figure 8d, ANOVA, p < 0.05), when compared with the phage control (SR C). The decrease in phage abundance was 0.6 log PFU/mL (Figure 8d).

4. Discussion

Phage φ6, one of the best-studied phages and a commercially available one, to the best of our knowledge, was only used to control infections by the plant-pathogenic P. syringae pv. phaseolicola [20]. According to our results, this phage can be used also against other Pseudomonas syringae pathovars, such as P. syringae pv. syringae, which are important phytopathogens for the agriculture sector because they can easily infect several horticultural plants [4,52,53,54,55,56], causing severe economic losses worldwide.
Although the major advantage of phage treatment is phage specificity, since the non-target bacterial populations should remain undisturbed, phages should be capable of lysing the majority of strains of a given bacterial species [7,14,57,58,59]. Phage φ6, besides the P. syringae pv. syringae, also infects P. syringae pv. actinidiae CRA-FRU 12.54 and P. syringae pv. actinidiae CRA-FRU 14.10 (Table 1). These results suggest that phage φ6 can be potentially used not only to control the bacterial canker and blast in Citrus species (such as orange and mandarin) and Prunus species (including sweet cherry, apricot, tart cherry, and almond) [2,3], but also to control P. syringae pv. actinidiae, which is the causal agent of the kiwifruit bacterial canker worldwide [60,61]. The effectiveness of phage φ6 was also tested in this study against other species of Pseudomonas and of other bacterial genera, but none of these bacteria were infected by the phage (Table 1). As the host range of phage φ6 is quite narrow, natural non-pathogenic bacteria of infected plants will not be affected by treatment with this phage. However, phage φ6 has been shown to alter its host range, mostly through mutations in its receptor binding proteins [62]. The high mutation rate associated with its RNA-based genome allow it to exploit new niches by infecting closely related Pseudomonas species [53,63]. Nevertheless, in the future, new phages need to be isolated and tested together with phage φ6 in order to produce a cocktail with a broader spectrum of activity to control several pathovars of P. syringae.
As phage φ6 is already available commercially and has been the subject of extensive genomic characterization, with its genome sequence available in the GenBank Genomes database [35], it is possible to assure at the outset that this phage is a safe biological control agent since it does not code for integrase genes nor genes coding for virulence factors and antibiotic resistance [33,34,35,36]. In addition, using the online CRISPR-CAS++ program tool (https://crisprcas.i2bc.paris-saclay.fr/CrisprCasFinder/Index) provided by Institut Pasteur (Paris, France), which enables easy detection of CRISPRs and CAS genes in user-submitted genome sequence data, no CRISPR sequences were detected in the genome of phage φ6 (obtained from https://0-www-ncbi-nlm-nih-gov.brum.beds.ac.uk/genome/4960?genome_assembly_id=456346).
Before the application of phages to inactivate pathogenic bacteria, it is important to characterize in vitro the dynamics of phage–host replication. The first step of phage infection is the attachment of the phage virion onto a susceptible bacterial host cell [64,65,66]. This adsorption process is usually described by mass-action kinetics [67], which implicitly assumes an equal influence of the host density and phage adsorption rate [48,65]. Therefore, an environment with a high bacterial host density can be considered as equivalent to a phage endowed with a high adsorption rate and vice-versa. The result obtained in this study for the phage φ6 adsorption rate (Figure 5) is in close agreement with results published by Shao and Wang (2008), Lindberg et al. (2014), and Santos et al. (2014) for Pseudomonas phages isolated from environmental sources [48,49,68]. The growth characteristics of phage φ6 (Figure 4) showed a relatively high burst size (60 ± 1 PFU/ host cell), indicating that phage φ6 replicates efficiently in P. syringae pv. syringae but needs a long latency period (100 min). Consequently, phage φ6 caused a high reduction in P. syringae pv. syringae growth, but its effect occurs only after 10 h of incubation.
P. syringae pv. syringae was effectively inactivated by phage φ6 (Figure 6a), reaching the maximum of inactivation of ≈4 log CFU/mL after 12 h incubation at a MOI of 1. After that, although some bacteria were not inactivated by the phage, around 3 log CFU/mL, most of the inactivated bacteria did not regrow after treatment. In fact, between 12 and 24 h of phage treatment, the bacterial concentration was significantly lower than that observed for the non-treated cultures (Figure 6a). Vidaver et al. (1973) characterized phage φ6 using the plant-pathogenic P. syringae pv. phaseolicola HB10Y, but no inactivation studies were performed by those authors. To the best of our knowledge, this phage has not yet been tested to inactivate P. syringae pv. syringae [20].
The kinetic theory of phage therapy predicts that the MOI could be critical to the efficiency of bacterial inactivation. It has been shown, both in vitro and in vivo, that the reduction of pathogenic bacteria increases in parallel with the MOI or that bacterial reduction occurs sooner at higher MOI values [69,70,71]. However, other studies [72,73,74] show that precise initial doses of phage may not be essential due to the self-perpetuating nature of phages, revealed by an increasing of phage titers along with bacteria. In the present study, the increase in MOI from 1 to 100 did not promote an increase in the efficiency of phage φ6. The number of phage particles during 24 h of incubation in the presence of the host at a MOI of 1 increased more (by 4.1 log PFU/mL) than at a MOI of 100 (by 1.9 log PFU/mL) (Figure 6b). This confirms the hypothesis that due to the self-perpetuating nature of phages, precise initial doses of phage may not be essential. In fact, this is one of the major advantages of phage treatment relative to chemical antibiotherapy. A high MOI can even be a disadvantage for the success of phage treatment since the bacteria may be inactivated before replicating the phages. This can occur when an overload of phages simultaneously infects a bacterium, leading to lysis due to the presence of high concentrations of lysins, a phenomenon known as “lysis from without” [75,76,77]. This phenomenon can explain the decrease in Pseudomonas syringae pv. syringae inactivation by the phage φ6 at MOI 100 when compared with MOI 1. In fact, at MOI 1, the increase in the phage particle number after 24 h of incubation was significantly higher (100 times higher) than that obtained when MOI 100 was used.
A major concern of bacterial inactivation by phages is the emergence of phage-resistant bacteria [7,8,43,46,51,58,77,78,79]. Phage φ6 did not prevent bacterial regrowth during treatment (Figure 6a). After 24 h of incubation, 66.7% of P. syringae pv. syringae cells were shown to be sensitive to phage φ6 (Figure 6c). However, some of the insensitive bacterial cells may be the result of not having had contact with the phage during the incubation period, not all being phage resistant. In fact, during the bacterial killing assays, it is not possible to know whether the surviving bacteria are really resistant, since the bacteria are collected from liquid medium samples (TSB), containing both phage particles and bacteria, which does not ensure that all tested bacteria were in fact in contact with the phages. The development of resistant mutants, determined only for bacteria that were in contact with the phages, was limited (1.20 × 10⁻³) (Table 3). Although these results are in close agreement with results obtained by other researchers for other Pseudomonas species, viz. P. aeruginosa strain PAO1 and phage PA5P2 (1.7 × 10⁻³) [80], the development of resistant mutants of P. syringae pv. syringae cells for phage φ6 are higher than those obtained by Rombouts et al. (2016) for P. syringae pv. porri and phage KIL3 (1.83 × 10⁻⁶) or phage KIL4 (3.33 × 10⁻⁶) [25], and those obtained by Li et al. (2018) for P. aeruginosa strain PA1 and phage PaP1 (3.0 × 10⁻⁵) [81].
Some authors have suggested that exposure to phage could cost bacteria their fitness, which can lead to their removal from the environment at a faster rate than their wild-type counterparts [82,83]. Recently, Sistrom et al. (2015) showed that P. syringae pv. phaseolicola can evolve resistance to phage φ6 by eliminating type-IV pili, but the phage mutants presented reduced virulence [53]. In our study, the experimental results of the fitness of phage showed that the concentration of sensitive bacteria and resistant mutants, when grown in the absence of phage φ6, are similar (Figure 7). Nevertheless, these experiments were carried out in nutrient-rich (culture) medium and in the absence of competition, from which, according to some authors, the cost of resistance can vary across environmental factors and the degree of competition for resources [84,85]. Meaden et al. (2015) obtained similar results for P. syringae pv. tomato under standard laboratory conditions (in vitro) [86]. However, when the experiments were carried out in tomato plants (Solanum lycopersicum), the phage-resistant bacterial mutants exhibited reduced densities relative to the sensitive bacterial population. In the future, further studies will be needed to evaluate the cost of bacterial resistance to phage φ6 in plants. Moreover, according to several authors, the resistance drawback can be overcome by the use of phage cocktails [43,46,58,79,87,88,89,90,91,92].
In order to implement this treatment in the field, it would be important to evaluate the use of phage φ6 not only as a preventive measure but also to treat active infections. The application of phage φ6 can be done by spraying the outer surface of the plants. Despite the semi-solid state nature of the plant’s tissues, as the phage particles can move in moist environments, besides infecting the bacteria that are on the surface, they can assess and control bacteria that lie within the plant’s tissues during an infection. However, there are no studies reported in the literature regarding this possibility. Although further studies are needed to test this hypothesis, the application of the phages superficially either preventively and/or to treat superficial infections by that phytopathogen seems to be an alternative option to the conventional antimicrobial treatments.
For the design and implementation of an effective phage therapy protocol to control plant diseases, the study of the stability of phages to environmental factors, such as temperature, soil pH, solar, and ultraviolet radiation, is crucial. One important factor that influences phage stability is the pH of the environment [93], influencing attachment, infectivity, intracellular replication, and amplification of phages [94,95,96]. Unfavorable pH values can interfere with the lysozyme enzyme and/or with other phage capsid proteins, thus preventing phage attachment to receptor sites on the host cell [95,96]. In this study, pH values ranging from 6.5 to 7.5 were tested (Figure 8b), which are included within the optimum neutral range of pH values for plant cultivation, and the survival of phage φ6 was not significantly affected. Generally, 10 < pH values < 5 have shown to be less efficient in studies on the lytic activity of phages, with the optimum conditions being around a neutral pH of 6 to 8 [94,97,98]. Since there is a positive correlation between soil pH and pH of fresh leaves [99,100], the range of pH values studied lie within the optimum pH range for the soil in orchards and, consequently, for the surface pH of plant leaves. This is clearly important in the context of a putative phage therapy application in the field.
Temperature is a crucial factor for phage viability in the environment [101,102], playing a fundamental role in the attachment, penetration, and amplification of phage particles in their host cells [93]. At low temperatures, only a few phages’ genetic material enters into bacterial host cells and hence fewer phage particles can be involved in the multiplication phase. On the other hand, high temperatures can promote an extended phage latency period [103]. In this study, phage φ6 was completely inactivated at 37 °C after 6 days of incubation (maximum decrease of 8.5 log PFU/mL) (Figure 8a). However, when the temperature was decreased to 15 and 25 °C, the rate of the maximum reduction in phage viability decreased to 2.0 log PFU/mL after 67 days of incubation. This means that in summer, when temperatures occasionally rise to 37 °C, bacteria may not be inactivated by the phage. However, as the most critical period for plants is autumn/winter and early spring and the infection ability of P. syringae pathovars at temperatures above 25 °C is reduced [104,105,106,107], temperature would not be a problem for the implementation of phage therapy.
Solar radiation or, more specifically, UV irradiation has been recognized as the most important factor for the loss of phage infectivity in the environment [73,74,108,109,110]. Solar radiation can directly affect free viruses by degrading proteins, altering structure, and decreasing infectivity [110]. Shorter wavelengths (UV-B radiation, ranging from 290 to 320 nm) impart irreversible damages to the genomic material and can result in the modification of viral proteins and formation of (lethal) photoproducts [110,111,112]. In fact, the abundance of phage φ6 particles decreased when exposed to solar radiation (decrease of 2.1 log PFU/mL after 6 h of incubation, with a solar radiation of 83.3 kWh/m2/day (data obtained from IPMA—Portuguese Institute of the Sea and the Atmosphere) (Figure 8c,d). Notwithstanding the fact that phage particles are sensitive to UV radiation, their sensitivity to UV wavelengths from solar radiation can be overcome by applying the phages at high titers and at the end of the day or at night, a period during which radiation is limited [74]. The phages can be applied in free form (as a spray of concentrated phage particles or cocktail of phage particles) or trapped within micro- or nanocarriers [42,113,114,115].

5. Conclusions

The results of this study clearly show that the commercially available phage φ6 can be a potential and effective alternative to reduce the concentration of P. syringae pv. syringae. As phage φ6 is sensitive to UV irradiation and solar radiation, they should be applied at the end of the day or during night periods, either in free form as a spray of concentrated phage particles or trapped within micro- or nanocarriers, in order to produce higher bacterial control. Nonetheless, further studies are needed, namely in the field, in order to fully understand the true potential of this phage to control infections caused by P. syringae pathovars.

Author Contributions

L.A.M.P., C.P., V.M.B. and C.F. performed the experiments. C.P. and V.M.B. wrote the paper and L.A.M.P. also contributed to the writing. A.A. supervised the work, revised the paper, and contributed with reagents and analysis tools.

Funding

This research was funded by FCT/MCTES, grant number UID/AMB/50017/2019, and FAPESP, grant number 2018/05522-9.

Acknowledgments

Thanks are due to FCT/MCTES for the financial support to CESAM (UID/AMB/50017/2019), through national funds. Carla Pereira was supported by a Junior Research contract (CEEC Individual/03974/2017) financed by the Portuguese Foundation for Science and Technology (FCT). Project funding by Fundação de Amparo à Pesquisa do Estado de São Paulo (FAPESP, São Paulo, Brazil) (FAPESP Ref. No. 2018/05522-9 (Project PsaPhageKill)) in the form of a BPE fellowship granted to Victor M. Balcão is hereby gratefully acknowledged. This work also received support from the National Council for Scientific and Technological Development (CNPq, São Paulo, Brazil), in the form of Research Productivity (PQ) fellowships granted to Victor M. Balcão (Refs. No. 306113/2014-7 and 308208/2017-0). Thanks are also due to the Department of Biology and University of Aveiro where this research work was carried out.

Conflicts of Interest

The authors declare no conflict of interest.

References

  1. Bradbury, J.F. Guide to Plant Pathogenic Bacteria; CAB International: Farnham Royal, Slough, 1986; ISBN 0851985572. [Google Scholar]
  2. Kennelly, M.M.; Cazorla, F.M.; de Vicente, A.; Ramos, C.; Sundin, G.W. Pseudomonas syringae diseases of fruit trees: Progress toward understanding and control. Plant Dis. 2007, 91, 4–17. [Google Scholar] [CrossRef] [PubMed]
  3. Ivanović, Ž.; Perović, T.; Popović, T.; Blagojević, J.; Trkulja, N.; Hrnčić, S. Characterization of Pseudomonas syringae pv. syringae, causal agent of citrus blast of mandarin in Montenegro. Plant Pathol. J. 2017, 33, 21–33. [Google Scholar] [PubMed]
  4. Pscheidt, J.W.; Ocamb, C.M. Disease Management Handbook; Oregon State University Extension Service/OSU Extension Catalog; Pacific Northwest (PNW): Oregon State University, Corvallis, OR, USA, 2018. [Google Scholar]
  5. Altimira, F.; Yanez, C.; Bravo, G.; Gonzalez, M.; Rojas, L.A.; Seeger, M. Characterization of copper-resistant bacteria and bacterial communities from copper-polluted agricultural soils of central Chile. BMC Microbiol. 2012, 12, 193. [Google Scholar] [CrossRef] [PubMed]
  6. Almeida, A.; Cunha, Â.; Gomes, N.C.M.; Alves, E.; Costa, L.; Faustino, M.A.F. Phage therapy and photodynamic therapy: Low environmental impact approaches to inactivate microorganisms in fish farming plants. Mar. Drugs 2009, 7, 268–313. [Google Scholar] [CrossRef] [PubMed]
  7. Rios, A.C.; Moutinho, C.G.; Pinto, F.C.; Del Fiol, F.S.; Jozala, A.; Chaud, M.V.; Vila, M.M.D.C.; Teixeira, J.A.; Balcao, V.M. Alternatives to overcoming bacterial resistances: State-of-the-art. Microbiol. Res. 2016, 191, 51–80. [Google Scholar] [CrossRef] [PubMed]
  8. Lima, R.; Del Fiol, F.S.; Balcão, V.M. Prospects for the use of new technologies to combat multidrug-resistant bacteria. Front. Pharmacol. 2019, 10, 692. [Google Scholar] [CrossRef]
  9. Vieira, A.; Silva, Y.J.; Cunha, Â.; Gomes, N.C.M.; Ackermann, H.W.; Almeida, A. Phage therapy to control multidrug-resistant Pseudomonas aeruginosa skin infections: In vitro and ex vivo experiments. Eur. J. Clin. Microbiol. Infect. Dis. 2012, 31, 3241–3249. [Google Scholar] [CrossRef]
  10. Silva, Y.; Costa, L.; Pereira, C.; Mateus, C.; Cunha, A.; Calado, R.; Gomes, N.; Pardo, M.; Hernandez, I.; Almeida, A. Phage Therapy as an approach to prevent Vibrio anguillarum infections in fish larvae production. PLoS ONE 2014, 9, e114197. [Google Scholar] [CrossRef]
  11. Silva, Y.; Moreirinha, C.; Pereira, C.; Costa, L.; Rocha, R.J.M.; Cunha, Â.; Gomes, N.C.M.; Calado, R.; Almeida, A. Biological control of Aeromonas salmonicida infection in juvenile Senegalese sole (Solea senegalensis) with phage AS-A. Aquaculture 2016, 450, 225–233. [Google Scholar] [CrossRef]
  12. Pereira, C.; Silva, Y.J.; Santos, A.L.; Cunha, Â.; Gomes, N.C.M.; Almeida, A. Bacteriophages with potential for inactivation of fish pathogenic bacteria: Survival, host specificity and effect on bacterial community structure. Mar. Drugs 2011, 9, 2236–2255. [Google Scholar] [CrossRef]
  13. Park, S.; Nakai, T. Bacteriophage control of Pseudomonas plecoglossicida infection in ayu. Dis. Aquat. Organ. 2003, 53, 33–39. [Google Scholar] [CrossRef] [PubMed]
  14. Hawkins, C.; Harper, D.; Burch, D.; Anggard, E.; Soothill, J. Topical treatment of Pseudomonas aeruginosa otitis of dogs with a bacteriophage mixture: A before/after clinical trial. Vet. Microbiol. 2010, 146, 309–313. [Google Scholar] [CrossRef] [PubMed]
  15. Bae, Y.J.; Wu, J.; Lee, H.J.; Jo, E.J.; Murugaiyan, S.; Chung, E.; Lee, S.W. Biocontrol potential of a lytic bacteriophage PE204 against bacterial wilt of tomato. J. Microbiol. Biotechnol. 2012, 22, 1613–1620. [Google Scholar] [CrossRef] [PubMed]
  16. Lim, T.; Kim, M.; Lee, D.; Lee, Y.; Park, J.; Youn, H.; Lee, H.; Yang, S.; Cho, Y.; Lee, J.; et al. Research in veterinary science use of bacteriophage for biological control of Salmonella Enteritidis infection in chicken. Res. Vet. Sci. 2012, 93, 1173–1178. [Google Scholar] [CrossRef] [PubMed]
  17. Frampton, R.A.; Pitman, A.R.; Fineran, P.C. Advances in bacteriophage-mediated control of plant pathogens. Int. J. Microbiol. 2012, 2012, 1–11. [Google Scholar] [CrossRef]
  18. Czajkowski, R.; Ozymko, Z.; Lojkowska, E. Isolation and characterization of novel soilborne lytic bacteriophages infecting Dickeya spp. biovar 3 (‘D. solani’). Plant Pathol. 2014, 63, 758–772. [Google Scholar] [CrossRef]
  19. Prior, S.E.; Andrews, A.J.; Nordeen, R.O.; Priori, S.E. Characterization of bacteriophages of Pseudomonas syringae pv. tomato. J. Ark. Acad. Sci. 2007, 61, 14. [Google Scholar]
  20. Vidaver, A.K.; Koski, R.K.; Van Etten, J.L. Bacteriophage phi6: A lipid-containing virus of Pseudomonas phaseolicola. J. Virol. 1973, 11, 799–805. [Google Scholar]
  21. Mindich, L.; Qiao, X.; Qiao, J.; Onodera, S.; Romantschuk, M.; Hoogstraten, D. Isolation of additional bacteriophages with genomes of segmented double- stranded RNA. J. Bacteriol. 1999, 181, 4505–4508. [Google Scholar]
  22. Qiao, X.; Sun, Y.; Qiao, J.; Di Sanzo, F.; Mindich, L. Characterization of Φ2954, a newly isolated bacteriophage containing three dsRNA genomic segments. BMC Microbiol. 2010, 10, 55. [Google Scholar] [CrossRef]
  23. Nordeen, R.O.; Morgan, M.K.; Currier, T.C. Isolation and partial characterization of bacteriophages of the phytopathogen Pseudomonas syringae. Appl. Environ. Microbiol. 1983, 45, 1890–1898. [Google Scholar] [PubMed]
  24. Smith, A.R.W.; Zamze, S.E.; Hignett, R.C. Morphology and hydrolytic activity of A7, a typing phage of Pseudomonas syringae pv. morsprunorum. Microbiology 1994, 140, 905–913. [Google Scholar] [CrossRef]
  25. Rombouts, S.; Volckaert, A.; Venneman, S.; Declercq, B.; Vandenheuvel, D.; Allonsius, C.N.; Van Malderghem, C.; Jang, H.B.; Briers, Y.; Noben, J.P.; et al. Characterization of novel bacteriophages for biocontrol of bacterial blight in leek caused by Pseudomonas syringae pv. porri. Front. Microbiol. 2016, 7, 279. [Google Scholar] [CrossRef] [PubMed]
  26. Di Lallo, G.; Evangelisti, M.; Mancuso, F.; Ferrante, P.; Marcelletti, S.; Tinari, A.; Superti, F.; Migliore, L.; D’Addabbo, P.; Frezza, D.; et al. Isolation and partial characterization of bacteriophages infecting Pseudomonas syringae pv. actinidiae, causal agent of kiwifruit bacterial canker. J. Basic Microbiol. 2014, 54, 1210–1221. [Google Scholar] [PubMed]
  27. Yu, J.; Lim, J.; Song, Y.; Heu, S.; Kim, G.; Koh, Y.; Oh, C. Isolation and characterization of bacteriophages against Pseudomonas syringae pv. actinidiae causing bacterial canker disease in kiwifruit. J. Microbiol. Biotechnol. 2016, 26, 385–393. [Google Scholar]
  28. Frampton, R.; Taylor, C.; Holguin Moreno, A.; Visnovsky, S.; Petty, N.; Pitman, A.; Fineran, P. Identification of bacteriophages for biocontrol of the kiwifruit canker phytopathogen Pseudomonas syringae pv. actinidiae. Appl. Environ. Microbiol. 2014, 80, 2216–2228. [Google Scholar] [CrossRef]
  29. Frampton, R.; Acedo, E.L.; Young, V.L.; Chen, D.; Tong, B.; Taylor, C.; Easingwood, R.A.; Pitman, A.R.; Kleffmann, T.; Bostina, M.; et al. Genome, proteome and structure of a T7-like bacteriophage of the kiwifruit canker phytopathogen Pseudomonas syringae pv. actinidiae. Viruses 2015, 7, 3361–3379. [Google Scholar] [CrossRef]
  30. Park, J.; Lim, J.A.; Yu, J.G.; Oh, C.S. Genomic features and lytic activity of the bacteriophage PPPL-1 effective against Pseudomonas syringae pv. actinidiae, a cause of bacterial canker in kiwifruit. J. Microbiol. Biotechnol. 2018, 28, 1542–1546. [Google Scholar]
  31. Yin, Y.; Ni, P.; Deng, B.; Wang, S.; Xu, W.; Wang, D. Isolation and characterisation of phages against Pseudomonas syringae pv. actinidiae. Acta Agric. Scand. Sect. B Soil Plant Sci. 2019, 69, 199–208. [Google Scholar] [CrossRef]
  32. Mindich, L.; Nemhauser, I.; Gottlieb, P.; Romantschuk, M.; Carton, J.; Frucht, S.; Strassman, J.; Bamford, D.H.; Kalkkinen, N. Nucleotide sequence of the large double-stranded RNA segment of bacteriophage phi 6: Genes specifying the viral replicase and transcriptase. J. Virol. 1988, 62, 1180–1185. [Google Scholar]
  33. Wickner, R.B. Double-stranded RNA virus replication and packaging. J. Biol. Chem. 1993, 268, 3797–3800. [Google Scholar] [PubMed]
  34. Wei, H.; Cheng, R.H.; Berriman, J.; Rice, W.J.; Stokes, D.L.; Katz, A.; Morgan, D.G.; Gottlieb, P. Three-dimensional structure of the enveloped bacteriophage Φ12: An incomplete T = 13 lattice is superposed on an enclosed T = 1 shell. PLoS ONE 2009, 4, e6850. [Google Scholar] [CrossRef] [PubMed]
  35. Yang, Y.; Lu, S.; Shen, W.; Zhao, X.; Shen, M.; Tan, Y.; Li, G.; Li, M.; Wang, J.; Hu, F.; et al. Characterization of the first double-stranded RNA bacteriophage infecting Pseudomonas aeruginosa. Sci. Rep. 2016, 6, 38795. [Google Scholar] [CrossRef] [PubMed]
  36. Li, J.; Dennehy, J.J. Differential bacteriophage mortality on exposure to copper. Appl. Environ. Microbiol. 2011, 77, 6878–6883. [Google Scholar] [CrossRef] [PubMed]
  37. Louvado, A.; Coelho, F.J.R.C.; Domingues, P.; Santos, A.L.; Gomes, N.C.M.; Almeida, A.; Cunha, Â. Isolation of surfactant-resistant pseudomonads from the estuarine surface microlayer. J. Microbiol. Biotechnol. 2012, 22, 283–291. [Google Scholar] [CrossRef]
  38. Oliveira, V.; Gomes, N.C.M.; Almeida, A.; Silva, A.M.S.; Simões, M.M.Q.; Smalla, K.; Cunha, Â. Hydrocarbon contamination and plant species determine the phylogenetic and functional diversity of endophytic degrading bacteria. Mol. Ecol. 2014, 23, 1392–1404. [Google Scholar] [CrossRef]
  39. Callanan, J.; Stockdale, S.R.; Shkoporov, A.; Draper, L.A.; Ross, R.P.; Hill, C. RNA phage biology in a metagenomic era. Viruses 2018, 10, 386. [Google Scholar] [CrossRef]
  40. Mäntynen, S.; Sundberg, L.R.; Poranen, M.M. Recognition of six additional cystoviruses: Pseudomonas virus phi6 is no longer the sole species of the family Cystoviridae. Arch. Virol. 2018, 163, 1117–1124. [Google Scholar] [CrossRef]
  41. Adams, M.H. Bacteriophages; Interscience Publishers, Inc.: New York, NY, USA, 1959. [Google Scholar]
  42. Rios, A.; Vila, M.; Lima, R.; Del Fiol, F.; Tubino, M.; Teixeira, J.; Balcão, V. Structural and functional stabilization of bacteriophage particles within the aqueous core of a W/O/W multiple emulsion: A potential biotherapeutic system for the inhalational treatment of bacterial pneumonia. Process Biochem. 2018, 64, 177–192. [Google Scholar] [CrossRef] [Green Version]
  43. Pereira, C.; Moreirinha, C.; Lewicka, M.; Almeida, P.; Clemente, C.; Cunha, Â.; Delgadillo, I.; Romalde, J.L.; Nunes, M.L.; Almeida, A. Bacteriophages with potential to inactivate Salmonella Typhimurium: Use of single phage suspensions and phage cocktails. Virus Res. 2016, 220, 179–192. [Google Scholar] [CrossRef]
  44. Kutter, E. Phage host range and efficiency of plating. In Bacteriophage: Methods and Protocols; Clokie, M.R.K.A.M., Ed.; Humana Press: Totowa, NJ, USA, 2009; pp. 141–149. ISBN 978-1-58829-682-5. [Google Scholar]
  45. Melo, D.R.; Sillankorva, S.; Ackermann, H.; Kropinski, A.M.; Azeredo, J.; Cerca, N. Isolation and characterization of a new Staphylococcus epidermidis broad-spectrum bacteriophage. J. Gen. Virol. 2014, 95, 506–515. [Google Scholar] [CrossRef] [PubMed]
  46. Mateus, L.; Costa, L.; Silva, Y.J.; Pereira, C.; Cunha, A.; Almeida, A. Efficiency of phage cocktails in the inactivation of Vibrio in aquaculture. Aquaculture 2014, 424–425, 167–173. [Google Scholar] [CrossRef]
  47. Stuer-Lauridsen, B.; Janzen, T.; Schnabl, J.; Johansen, E. Identification of the host determinant of two prolate-headed phages infecting Lactococcus lactis. Virology 2003, 309, 10–17. [Google Scholar] [CrossRef]
  48. Shao, Y.; Wang, I.N. Bacteriophage adsorption rate and optimal lysis time. Genetics 2008, 180, 471–482. [Google Scholar] [CrossRef] [PubMed]
  49. Santos, S.B.; Carvalho, C.; Azeredo, J.; Ferreira, E.C. Population dynamics of a Salmonella lytic phage and its host: Implications of the host bacterial growth rate in modelling. PLoS ONE 2014, 9, e102507. [Google Scholar] [CrossRef]
  50. García, R.; Latz, S.; Romero, J.; Higuera, G.; García, K.; Bastías, R. Bacteriophage production models: An overview. Front. Microbiol. 2019, 10, 1–7. [Google Scholar] [CrossRef]
  51. Filippov, A.; Sergueev, K.V.; He, Y.; Huang, X.Z.; Gnade, B.T.; Mueller, A.J.; Fernandez-Prada, C.; Nikolich, M.P. Bacteriophage-resistant mutants in Yersinia pestis: Identification of phage receptors and attenuation for mice. PLoS ONE 2011, 6, e25486. [Google Scholar] [CrossRef]
  52. Moore, L.W. Pseudomonas syringae: Disease and ice nucleation activity. In Ornamentals Northwest Archives; Department of Botany and Plant Pathology, Oregon State University: Corvallis, OR, USA, 1988; Volume 12, pp. 3–16. [Google Scholar]
  53. Sistrom, M.; Park, D.; O’Brien, H.E.; Wang, Z.; Guttman, D.S.; Townsend, J.P.; Turner, P.E. Genomic and gene-expression comparisons among phage-resistant type-IV pilus mutants of Pseudomonas syringae pathovar phaseolicola. PLoS ONE 2015, 10, e0144514. [Google Scholar] [CrossRef]
  54. McGrane, R.; Beattie, G.A. Pseudomonas syringae pv. syringae regulates multiple stages of plant colonization via the bacteriophytochrome BphP1. MBio 2017, 8, e01178-17. [Google Scholar]
  55. He, R.; Liu, P.; Jia, B.; Xue, S.; Wang, X.; Hu, J.; Al Shoffe, Y.; Gallipoli, L.; Mazzaglia, A.; Balestra, G.; et al. Genetic diversity of Pseudomonas syringae pv. actinidiae strains from different geographic Regions in China. Phytopathology 2019, 109, 347–357. [Google Scholar]
  56. Vasebi, Y.; Khakvar, R.; Faghihi, M.M.; Vinatzer, A. Genomic and pathogenic properties of Pseudomonas syringae pv. syringae strains isolated from apricot in East Azerbaijan province. Iran. Biocatal. Agric. Biotechnol. 2019, 19, 101167. [Google Scholar]
  57. Park, S.C.; Nakai, T. infection in ayu Plecoglossus altivelis. Dis. Aquat. Organ. 2003, 53, 33–39. [Google Scholar] [CrossRef] [PubMed]
  58. Pereira, C.; Moreirinha, C.; Lewicka, M.; Almeida, P.; Clemente, C.; Romalde, J.L.; Nunes, M.L.; Almeida, A. Characterization and in vitro evaluation of new bacteriophages for the biocontrol of Escherichia coli. Virus Res. 2017, 227, 171–182. [Google Scholar] [CrossRef] [PubMed]
  59. Pereira, S.; Pereira, C.; Santos, L.; Klumpp, J.; Almeida, A. Potential of phage cocktails in the inactivation of Enterobacter cloacae-An in vitro study in a buffer solution and in urine samples. Virus Res. 2016, 211, 199–208. [Google Scholar] [CrossRef] [PubMed]
  60. Fujikawa, T.; Sawada, H. Genome analysis of the kiwifruit canker pathogen Pseudomonas syringae pv. actinidiae biovar 5. Sci. Rep. 2016, 6, 21399. [Google Scholar] [CrossRef] [PubMed]
  61. McCann, H.C.; Li, L.; Liu, Y.; Li, D.; Pan, H.; Zhong, C.; Rikkerink, E.H.A.; Templeton, M.D.; Straub, C.; Colombi, E.; et al. Origin and evolution of the kiwifruit canker pandemic. Genome Biol. Evol. 2017, 9, 932–944. [Google Scholar] [CrossRef]
  62. Ferris, M.T.; Joyce, P.; Burch, C.L. High frequency of mutations that expand the host range of an RNA virus. Genet. Soc. Am. 2007, 1022, 1013–1022. [Google Scholar] [CrossRef]
  63. Simpson, D.J. The Discovery and Application of Bacteriophage Receptor Binding Proteins. Ph.D. Thesis, University of Alberta, Edmonton, AB, Canada, 2016. [Google Scholar]
  64. Moldovan, R.; Chapman-McQuiston, E.; Wu, X.L. On kinetics of phage adsorption. Biophys. J. 2007, 93, 303–315. [Google Scholar] [CrossRef]
  65. Ceyssens, P. Isolation and Characterization of Lytic Bacteriophages Infecting Pseudomonas aeruginosa. Ph.D. Thesis, Katholieke Inuversiteit Leuven, Leuven, Belgium, 2009. [Google Scholar]
  66. Hyman, P.; Abedon, S.T. Practical methods for determining phage growth parameters. In Bacteriophages: Methods and Protocols, Volume 1: Isolation, Characterization, and Interactions; Humana Press: Totowa, NJ, USA, 2009; Volume 501, ISBN 9781603271646. [Google Scholar]
  67. Storms, Z.J.; Sauvageau, D. Modeling tailed bacteriophage adsorption: Insight into mechanisms. Virology 2015, 485, 355–362. [Google Scholar] [CrossRef] [Green Version]
  68. Lindberg, H.; McKean, K.; Wang, I. Phage fitness may help predict phage therapy efficacy. Bacteriophage 2014, 4, e964081. [Google Scholar] [CrossRef]
  69. ChiHsin, H.; ChongYi, L.; JongKang, L.; ChanShing, L. Control of the eel (Anguilla japonica) pathogens, Aeromonas hydrophila and Edwardsiella tarda, by bacteriophages. J. Fish. Soc. Taiwan 2000, 27, 21–31. [Google Scholar]
  70. Pasharawipas, T.; Manopvisetcharean, J.; Flegel, T. Phage treatment of Vibrio harveyi: A general concept of protection against bacterial infection. Res. J. Microbiol. 2011, 6, 560–567. [Google Scholar] [CrossRef]
  71. Prasad, Y.; Kumar, D.; Sharma, A. Lytic bacteriophages specific to Flavobacterium columnare rescue catfish, Clarias batrachus (Linn.) from columnaris disease. J. Environ. Biol. 2011, 32, 161–168. [Google Scholar] [PubMed]
  72. Nakai, T. Application of bacteriophages for control of infectious diseases in aquaculture. In Bacteriophages in the Control of Food and Waterborne Pathogens; Sabour, P., Griffiths, M., Eds.; ASM Press: Washington, DC, USA, 2010; pp. 257–272. [Google Scholar]
  73. Silva, Y.; Costa, L.; Pereira, C.; Cunha, A.; Calado, R.; Gomes, N.; Almeida, A. Influence of environmental variables in the efficiency of phage therapy in aquaculture. Microb. Biotechnol. 2014, 7, 401–413. [Google Scholar] [CrossRef] [PubMed]
  74. Duarte, J.; Pereira, C.; Moreirinha, C.; Salvio, R.; Lopes, A.; Wang, D.; Almeida, A. New insights on phage efficacy to control Aeromonas salmonicida in aquaculture systems: An in vitro preliminary study. Aquaculture 2018, 495, 970–982. [Google Scholar] [CrossRef]
  75. Arisaka, F.; Kanamaru, S.; Leiman, P.; Rossmann, M.G. The tail lysozyme complex of bacteriophage T4. Int. J. Biochem. Cell Biol. 2003, 35, 16–21. [Google Scholar] [CrossRef]
  76. Abedon, S.T. Lysis from without. Bacteriophage 2011, 1, 46–49. [Google Scholar] [CrossRef]
  77. Lopes, A.; Pereira, C.; Almeida, A. Sequential combined effect of phages and antibiotics on the inactivation of E. coli. Microorganisms 2018, 6, 125. [Google Scholar] [CrossRef]
  78. Levin, B.R.; Bull, J.J. Population and evolutionary dynamics of phage therapy. Nat. Rev. Microbiol. 2004, 2, 20–24. [Google Scholar] [CrossRef]
  79. Gill, J.J.; Hyman, P. Phage choice, isolation, and preparation for phage therapy. Curr. Pharm. Biotechnol. 2010, 11, 2–14. [Google Scholar] [CrossRef]
  80. Wright, R.C.; Friman, V.P.; Smith, M.C.M.; Brockhurst, M.A. Cross-resistance is modular in bacteria–phage interactions. PLoS Biol. 2018, 16, e2006057. [Google Scholar] [CrossRef] [PubMed]
  81. Li, G.; Shen, M.; Yang, Y.; Le, S.; Li, M.; Wang, J.; Zhao, Y.; Tan, Y.; Hu, F.; Lu, S. Adaptation of Pseudomonas aeruginosa to phage PaP1 predation via O-antigen polymerase mutation. Front. Microbiol. 2018, 9, 1170. [Google Scholar] [CrossRef] [PubMed]
  82. Bohannan, B.J.M.; Travisano, M.; Lenski, R.E. Epistatic interactions can lower the cost of resistance to multiple consumers. Evolution 1999, 53, 292–295. [Google Scholar] [CrossRef] [PubMed]
  83. Brockhurst, M.A.; Buckling, A.; Rainey, P.B. The effect of a bacteriophage on diversification of the opportunistic bacterial pathogen, Pseudomonas aeruginosa. Proc. Biol. Sci. 2005, 272, 1385–1391. [Google Scholar] [CrossRef] [PubMed]
  84. Lennon, J.T.; Khatana, S.A.M.; Marston, M.F.; Martiny, J.B.H. Is there a cost of virus resistance in marine cyanobacteria? ISME J. 2007, 1, 300–312. [Google Scholar] [CrossRef]
  85. Quance, M.A.; Travisano, M. Effects of temperature on the fitness cost of resistance to bacteriophage T4 in Escherichia coli. Evolution 2009, 63, 1406–1416. [Google Scholar] [CrossRef]
  86. Meaden, S.; Paszkiewicz, K.; Koskella, B. The cost of phage resistance in a plant pathogenic bacterium is context-dependent. Evolution 2015, 69, 1321–1328. [Google Scholar] [CrossRef]
  87. Sandeep, K. Bacteriophage precision drug against bacterial infections. Curr. Sci. 2006, 90, 631–633. [Google Scholar]
  88. Scott, A.E.; Timms, A.R.; Connerton, P.L.; Carrillo, C.L.; Radzum, K.A.; Connerton, I.F. Genome dynamics of Campylobacter jejuni in response to bacteriophage predation. PLoS Pathog. 2007, 3, 1142–1151. [Google Scholar] [CrossRef]
  89. Hooton, S.P.T.; Atterbury, R.J.; Connerton, I.F. Application of a bacteriophage cocktail to reduce Salmonella Typhimurium U288 contamination on pig skin. Int. J. Food Microbiol. 2011, 151, 157–163. [Google Scholar] [CrossRef]
  90. Pereira, C.; Moreirinha, C.; Rocha, R.J.M.; Calado, R.; Romalde, J.L.; Nunes, M.L.; Almeida, A. Application of bacteriophages during depuration reduces the load of Salmonella Typhimurium in cockles. Food Res. Int. 2016, 90, 73–84. [Google Scholar] [CrossRef] [PubMed]
  91. Pereira, C.; Moreirinha, C.; Teles, L.; Rocha, R.J.M.; Calado, R.; Romalde, J.L.; Nunes, M.L.; Almeida, A. Application of phage therapy during bivalve depuration improves Escherichia coli decontamination. Food Microbiol. 2017, 61, 102–112. [Google Scholar] [CrossRef] [PubMed]
  92. Costa, P.; Pereira, C.; Gomes, A.; Almeida, A. Efficiency of single phage suspensions and phage cocktail in the inactivation of Escherichia coli and Salmonella Typhimurium: An in vitro preliminary study. Microorganisms 2019, 7, 94. [Google Scholar] [CrossRef] [PubMed]
  93. Jończyk, E.; Kłak, M.; Międzybrodzki, R.; Górski, A. The influence of external factors on bacteriophages—Review. Folia Microbiol. 2011, 56, 191–200. [Google Scholar] [CrossRef] [PubMed]
  94. Pirisi, A. Phage therapy—advantages over antibiotics? Lancet 2000, 356, 1418. [Google Scholar] [CrossRef]
  95. Leverentz, B.; Conway, W.S.; Alavidze, Z.; Janisiewicz, W.J.; Fuchs, Y.; Camp, M.J.; Chighladze, E.; Sulakvelidze, A. Examination of bacteriophage as a biocontrol method for Salmonella on fresh-cut fruit: A model study. J. Food Prot. 2001, 64, 1116–1121. [Google Scholar] [CrossRef] [PubMed]
  96. Leverentz, B.; Conway, W.S.; Janisiewicz, W.; Camp, M.J. Optimizing concentration and timing of a phage spray application to reduce Listeria monocytogenes on honeydew melon tissue. J. Food Prot. 2004, 67, 1682–1686. [Google Scholar] [CrossRef] [PubMed]
  97. Nakai, T.; Sugimoto, R.; Park, K.H.; Matsuoka, S.; Mori, K.; Nishioka, T.; Maruyama, K. Protective effects of bacteriophage on experimental Lactococcus garvieae infection in yellowtail. Dis. Aquat. Organ. 1999, 37, 33–41. [Google Scholar] [CrossRef] [PubMed]
  98. Endersen, L.; Buttimer, C.; Nevin, E.; Coffey, A.; Neve, H.; Oliveira, H.; Lavigne, R.; O’Mahony, J. Investigating the biocontrol and anti-biofilm potential of a three phage cocktail against Cronobacter sakazakii in different brands of infant formula. Int. J. Food Microbiol. 2017, 253, 1–11. [Google Scholar] [CrossRef]
  99. Cornelissen, J.; Sibma, F.; Van Logtestijn, R.; Broekman, R.; Thompson, K. Leaf pH as a plant trait: Species-driven rather than soil-driven variation. Funct. Ecol. 2011, 25, 449–455. [Google Scholar] [CrossRef]
  100. Masoero, G.; Cugnetto, A. The raw pH in plants: A multifaceted parameter. J. Agron. Res. 2018, 1, 18. [Google Scholar] [CrossRef]
  101. Nasser, A.M.; Oman, S.D. Quantitative assessment of the inactivation of pathogenic and indicator viruses in natural water sources. Water Res. 1999, 33, 1748–1752. [Google Scholar] [CrossRef]
  102. Olson, M.R.; Axler, R.P.; Hicks, R.E. Effects of freezing and storage temperature on MS2 viability. J. Virol. Methods 2004, 122, 147–152. [Google Scholar] [CrossRef] [PubMed]
  103. Tey, B.T.; Ooi, S.T.; Yong, K.C.; Yeen, M.; Ng, T.; Ling, T.C.; Siang Tan, W. Production of fusion m13 phage bearing the di-sulphide constrained peptide sequence (C-WSFFSNI-C) that interacts with hepatitis B core antigen. Afr. J. Biotechnol. 2009, 8, 268–273. [Google Scholar]
  104. Fox, A. Renewed fears as Psa devastates european orchards, 2011. Available online: http://www.stuff.co.nz/business/farming/5050782/Renewed-fears-as-PSA-devastates-European-orchards (accessed on 1 May 2019).
  105. CABI. Pseudomonas syringae pv. actinidiae (bacterial canker of kiwifruit), 2015. Available online: https://www.cabi.org/isc/datasheet/45002 (accessed on 1 May 2019).
  106. Das, Q.; Islam, M.R.; Marcone, M.F.; Warriner, K.; Diarra, M.S. Potential of berry extracts to control foodborne pathogens. Food Control 2017, 73, 650–662. [Google Scholar] [CrossRef]
  107. Kiwifruit Vine Health. Psa-V Seasonal management wall chart 2018-19. Available online: https://www.kvh.org.nz/vdb/document/99346 (accessed on 1 May 2019).
  108. Wommack, K.E.; Hill, R.T.; Muller, T.A.; Colwell, R.R. Effects of sunlight on bacteriophage viability and structure. Appl. Environ. Microbiol. 1996, 62, 1336–1341. [Google Scholar] [PubMed]
  109. Lytle, C.D.; Sagripanti, J.L. Predicted inactivation of viruses of relevance to biodefense by solar radiation. J. Virol. 2005, 79, 14244–14252. [Google Scholar] [CrossRef] [PubMed]
  110. Mojica, K.D.A.; Brussaard, C.P.D. Factors affecting virus dynamics and microbial host-virus interactions in marine environments. FEMS Microbiol. Ecol. 2014, 89, 495–515. [Google Scholar] [CrossRef] [Green Version]
  111. Hotze, E.M.; Badireddy, A.R.; Chellam, S.; Wiesner, M.R. Mechanisms of bacteriophage inactivation via singlet oxygen generation in UV illuminated fullerol suspensions. Environ. Sci. Technol. 2009, 43, 6639–6645. [Google Scholar] [CrossRef]
  112. Rule Wigginton, K.; Menin, L.; Montoya, J.P.; Kohn, T. Oxidation of virus proteins during UV (254) and singlet oxygen mediated inactivation. Environ. Sci. Technol. 2010, 44, 5437–5443. [Google Scholar] [CrossRef]
  113. Balcao, V.M.; Barreira, S.V.P.; Nunes, T.M.; Chaud, M.V.; Tubino, M.; Vila, M.M.D.C. Carbohydrate hydrogels with stabilized phage particles for bacterial biosensing: Bacterium diffusion studies. Appl. Biochem. Biotechnol. 2014, 172, 1194–1214. [Google Scholar] [CrossRef] [PubMed]
  114. Balcão, V.M.; Glasser, C.A.; Chaud, M.V.; del Fiol, F.S.; Tubino, M.; Vila, M.M.D.C. Biomimetic aqueous-core lipid nanoballoons integrating a multiple emulsion formulation: A suitable housing system for viable lytic bacteriophages. Colloids Surfaces B Biointerfaces 2014, 123, 478–485. [Google Scholar] [CrossRef] [PubMed]
  115. Balcao, V.M.; Vila, M.M.D.C. Structural and functional stabilization of protein entities: State-of-the-art. Adv. Drug Deliv. Rev. 2015, 93, 25–41. [Google Scholar] [CrossRef] [PubMed]
Figure 1. Design of the experimental work performed to test the “phage sensitivity of surviving bacteria after phage exposure” (Section 2.8), “emergence of bacterial resistances to phage” (Section 2.9), and “fitness of phage-resistant bacterial mutants” (Section 2.10). TSB: Tryptic Soy Broth.
Microorganisms 07 00286 g001
Figure 2. Morphology of the phage φ6 lysis plaques on its bacterial host.
Microorganisms 07 00286 g002
Figure 3. Wavelength screening of phage φ6 suspension allowing observation of the wavelength producing maximum absorption of phage φ6 particles (a) and the calibration curve produced for the relationship between the concentration of (whole) phage particles in suspension and the absorption of the suspension at 265 nm corrected for cell debris and other intracytoplasmic proteins at a wavelength of 320 nm (b).
Microorganisms 07 00286 g003
Figure 4. One-step growth curve of phage φ6 in the presence of P. syringae pv. syringae as the host. Values represent the mean of three experiments; Error bars represent the standard deviation.
Microorganisms 07 00286 g004
Figure 5. Adsorption curve of phage φ6 particles onto P. syringae pv. syringae host cells, allowing calculation of the phage particles’ adsorption rate following non-linear fitting of a logarithmic function to the experimental data. Error bars represent the standard deviation
Microorganisms 07 00286 g005
Figure 6. Inactivation of P. syringae pv. syringae by phage φ6 at a multiplicity of infection (MOI) of 1 and 100 during 24 h. (a) Bacterial concentration: BC, bacteria control; BP, bacteria plus phage; (b) Phage concentration: PC, phage control; BP, bacteria plus phage; (c) Percentage of phage sensitivity of surviving bacteria after phage exposure of P. syringae pv. syringae cells sensitive to phage φ6 at a MOI of 1, after 0, 6, 12, 18, and 24 h of incubation, following spot testing of randomly chosen bacterial colonies. Values represent the mean of three independent assays; Error bars represent the standard deviation.
Microorganisms 07 00286 g006
Figure 7. P. syringae pv. syringae concentration of resistant mutants versus their sensitive cells in the presence or absence of phage φ6 at a multiplicity of infection (MOI) of 1 after 6, 12, 18, and 24 h of incubation. Values represent the mean of three independent assays; error bars represent the standard deviation.
Microorganisms 07 00286 g007
Figure 8. Survival of phage φ6 following exposure to different temperature values (a), different pH values (b), UV-B irradiation (c), and solar radiation (d). Values represent the mean of three independent experiments; error bars represent the standard deviation. UV-B: phage exposed to UV-B irradiation; UV-B C: phage control—phage not exposed to UV-B irradiation; SR: phage exposed to solar radiation; SR C: phage control—phage not exposed to solar radiation.
Microorganisms 07 00286 g008
Table 1. Host range of phage φ6 determined on 25 bacterial strains. Clear lysis zone (+) and not lysis zone (−). The plating with the host strain was considered as EOP = 100%. EOP: Efficiency of Plating.
StrainsSpot TestEOP (%)
Pseudomonas syringae pv. syringae DSM 21482+100 (host)
Pseudomonas syringae pv. actinidiae CRA-FRU 8.430
Pseudomonas syringae pv. actinidiae CRA-FRU 12.54+101.3
Pseudomonas syringae pv. actinidiae CRA-FRU 14.10+96.8
Pseudomonas aeruginosa ATCC 278530
Pseudomonas aeruginosa0
Pseudomonas gingeri0
Pseudomonas putida JQ6190280
Pseudomonas putida JQ8248560
Pseudomonas sp. JX0474340
Pseudomonas sp. EF6279980
Pseudomonas sp. AF4118530
Pseudomonas sp. HF6791420
Pseudomonas sp. AB7729430
Pseudomonas sp. EU3063380
Pseudomonas sp. AY3322070
Pseudomonas sp. JN0333600
Pseudomonas stutzeri EU1679400
Pseudomonas rhodesiae JX9941520
Escherichia coli ATCC 137060
Escherichia coli ATCC 259220
Salmonella Typhimurium ATCC 133110
Salmonella Typhimurium ATCC 140280
Aeromonas hydrophila ATCC 79660
Vibrio parahaemolyticus DSM 276570
Table 2. Data utilized to prepare a calibration curve aiming at determining the molar extinction coefficient of phage φ6 (whole) particles.
Sample Volume of Concentrated Phage Suspension (µL)Final Volume of Dilution (µL)Number of Phage Particles in the Sample Volume of Concentrated Phage SuspensionPhage Particle Concentration (PFU/mL)Abs265 nmAbs320 nmAbs265 nm–Abs320 nm
530009.2500 × 1053.0833 × 1050.01300.00000.0130
1030001.8500 × 1066.1666 × 1050.01100.01100.0000
2530004.6250 × 1061.5416 × 1060.03400.00100.0330
5030009.2500 × 1063.0833 × 1060.07100.00400.0670
10030001.8500 × 1076.1666 × 1060.15100.01500.1360
15030002.7750 × 1079.2500 × 1060.23000.02700.2030
20030003.7000 × 1071.2333 × 1070.31800.03900.2790
50030009.2500 × 1073.0833 × 1070.76400.11100.6530
Table 3. Frequency of emergence of P. syringae pv. syringae spontaneous phage-resistant mutants.
Control Sample (CFU/mL)Sample Treated with Phage φ6 (CFU/mL)Frequency of Phage-Resistant Bacterial Mutants
(1.47 ± 0.19) × 108(1.75 ± 0.12) × 105(1.20 ± 0.62) × 103

