Article

Comparative Gut Microbiome Differences between Ferric Citrate and Calcium Carbonate Phosphate Binders in Patients with End-Stage Kidney Disease

1
Division of Nephrology, Department of Internal Medicine, Kaohsiung Medical University Hospital, Kaohsiung Medical University, Kaohsiung 807, Taiwan
2
Graduate Institute of Clinical Medicine, College of Medicine, Kaohsiung Medical University, Kaohsiung 807, Taiwan
3
Faculty of Medicine, College of Medicine, Kaohsiung Medical University, Kaohsiung 807, Taiwan
4
Department of Internal Medicine, National Taiwan University College of Medicine, Taipei 106, Taiwan
5
Faculty of Renal Care, College of Medicine, Kaohsiung Medical University, Kaohsiung 807, Taiwan
6
Department of Microbiology and Immunology, Kaohsiung Medical University, Kaohsiung 807, Taiwan
7
Department of Family Medicine, Kaohsiung Medical University Hospital, Kaohsiung 807, Taiwan
8
Division of Nephrology, Taipei Tzu Chi Hospital, Buddhist Tzu Chi Medical Foundation, School of Medicine, Tzu Chi University, Hualien 970, Taiwan
9
Institute of Surgical Sciences, Uppsala University, 75185 Uppsala, Sweden
10
Institute of Biomedical Informatics, Medical College, National Yang-Ming University, Taipei 112, Taiwan
11
Department of Medical Research, Division of Translational Research, Taipei Veterans General Hospital, Taipei 112, Taiwan
12
Department of Public Health, China Medical University, Taichung 406, Taiwan
13
National Institute of Cancer Research, National Health Research Institutes, Miaoli 350, Taiwan
*
Author to whom correspondence should be addressed.
Submission received: 14 November 2020 / Revised: 16 December 2020 / Accepted: 17 December 2020 / Published: 20 December 2020

Abstract

:
Gut dysbiosis in patients with chronic kidney disease (CKD) may induce chronic inflammation and increase morbidity. Phosphate-binding agents, generally used in patients with CKD, may potentially change the composition of the gut microbiota. This study aimed to compare the microbiota composition in hemodialysis patients treated with ferric citrate or calcium carbonate. The stool microbiota was investigated in hemodialysis patients treated with ferric citrate (n = 8) and calcium carbonate (n = 46) using 16S rRNA gene amplicon sequencing profiling using linear discriminant analysis of effect size. Further predictive functional profiling of microbial communities was obtained with Tax4Fun in R. Hemodialysis patients treated with calcium carbonate had a significantly reduced microbial species diversity (Shannon index and Simpson index) and an increased microbial alteration ratio compared with patients treated with ferric citrate. A distinct microbial community structure was found in patients treated with ferric citrate, with an increased abundance of the Bacteroidetes phylum and a decreased abundance of the phylum Firmicutes. Members of the order Lactobacillales were enriched in patients treated with calcium carbonate, whereas taxa of the genera Ruminococcaceae UCG-004, Flavonifractor, and Cronobacter were enriched in patients treated with ferric citrate phosphate binder. In conclusion, Ferric citrate therapy results in a more diverse microbiome community compared to calcium carbonate therapy in hemodialysis patients with phosphate binder treatment. The gut microbiome reflects the phosphate binder choice in hemodialysis patients, further affecting the physiological environment in the gastrointestinal tract.

1. Introduction

Patients with chronic kidney disease (CKD) are often treated with oral phosphate binders such as iron or calcium-containing phosphate binders to control hyperphosphatemia [1]. Oral phosphate binders were used to prevent the dietary phosphate absorption within the gastrointestinal tract by exchanging an active cation with anion phosphate to make a non-absorbable compound excreted in the feces [2]. Long-term treatment could lead to gut microbial composition changes by lowering the intestinal phosphate burden [3,4]. However, the influence of iron and calcium-containing phosphate binders on the gut microbiome is still unknown. Different groups of phosphate binders that can act differently on the gut microbiome have not been investigated.
An increased microbiome diversity was observed after ferric citrate treatment in a CKD animal model. Moreover, ferric citrate treatment increased levels of tryptophanase-possessing bacteria (Verrucomicrobia, Clostridiaceae, and Enterobacteriaceae) [5]. However, as the gut microbiota of rats and humans are different, the impact of ferric citrate therapy in hemodialysis (HD) patients warrants further investigation. Therefore, this study aimed to explore and compare the biodiversity and composition of the gut microbiome communities in HD patients with two different phosphate binders treatment (ferric citrate versus calcium carbonate). The study findings could potentially contribute to integrating personalized medicine in phosphate binder treatment.

2. Materials and Methods

2.1. Study Participants

From August 2016 through September 2017, 85 participants were recruited from the Kaohsiung Medical University Hospital HD unit. Eligible participants were aged between 30 and 80 years and received regular HD three times per week for more than 90 days. Each HD section was 3.5–4 h with high-flux dialyzers, with a blood flow rate between 250 and 300 mL/min, dialysate flow of 500 mL/min, and single pool Kt/V was more than 1.2 per week. Participants with partial or total colectomy or participants who were prescribed antibiotics within three months before enrollment were not enrolled in our study. Participants who used more than one type of phosphate binder were excluded (n = 31). Fecal samples were collected for fecal microbiota analysis by high-throughput 16S ribosomal RNA gene sequencing of ferric citrate (n = 8) and calcium carbonate (n = 46) users. All participants were treated with the single phosphate binder (ferric citrate or calcium carbonate) for at least two months.

2.2. Ethical Considerations

The study protocols were approved by the Ethics Committee of Kaohsiung Medical University Hospital (KMUHIRB-E(I)-20160095 approved on 8 August 2016 and KMUHIRB-E(I)-20180118 approved on 26 April 2018), and all participants provided written informed consent.

2.3. Comorbidity, Laboratory and Clinical Variables

Sociodemographic data, age, sex, dialysis vintage, arteriovenous shunt type, medical history, medications, and biochemical data were obtained for all participants from electronic health care system records. The definition of hypertension was 140/90 mmHg or higher or taking antihypertensive drugs. Diabetes was defined as HbA1C 6.5% or higher or taking antidiabetics. History of dyslipidemia, coronary artery disease, and cerebrovascular disease was based on physician diagnosis. Blood samples were obtained after overnight fasting through the arteriovenous fistula or graft immediately before their scheduled HD session at a single midweek dialysis session. Biochemical data for HD patients included serum values for hemoglobin, albumin, alkaline phosphatase, ion calcium, phosphate, magnesium, parathyroid hormone, and aluminum from routine blood samples obtained less than 30 days before stool sample collection. A licensed dietitian also recorded a modified short-form food frequency dietary questionnaire.

2.4. Fecal Sample Collection and Bacterial 16S rRNA Amplicon Sequencing and Processing

The stool samples were frozen immediately and delivered using cooler bags within 24 h to the laboratory (Germark Biotechnology, Taichung, Taiwan). DNA was extracted using a QIAamp DNA Stool Mini Kit (Qiagen, Germantown, MD, USA) and stored at −80 °C for 16S rRNA gene sequencing (at least 500 ng per sample). The DNA quality and concentration were measured by agarose gel electrophoresis and NanoDrop ND-1000 (Thermo Fisher Scientific, Waltham, MA, USA) with standards of ≥500 ng, 260/280 ratio of 1.7–1.8, and 260/230 ratio of 1.8–2.2 before downstream processing. The extracted DNA was used as the template to amplify the variable regions 3 and 4 (V3–V4) of the 16S rRNA gene using barcode-indexed PCR primers (341F and 805R) [6]. Library construction and sequencing of amplicon DNA samples were conducted by Genomics BioScience (Taipei, Taiwan). A pair-end sequencing library (insert size of 465 bp for each sample) was constructed with the sheared fragments using the TruSeq Nano DNA Library Prep kit (Illumina, San Diego, CA, USA). The purified amplicons with different index sequences were pooled in equimolar amounts and then sequenced on the Illumina MiSeq sequencer with the MiSeq Reagent Kit v3 (Illumina, San Diego, CA, USA). To reduce batch effects, all samples were sequenced simultaneously in the same laboratory (Germark Biotechnology, Taichung, Taiwan,).
The 16S-amplicon processing pipeline was modified from 16S Bacteria/Archaea SOP v1 of Microbiome Helper workflows [7]. Paired-end reads were merged raw reads using Paired-End reAd mergeR (PEAR; version 0.9.8) [8] and filtered low-quality reads by thresholds of sequence length ≥400 bp and quality score of 90% bases of reads ≥20. Processing the raw sequencing reads was demultiplexed and quality filtered using Quantitative Insight Into Microbial Ecology (QIIME; version 1.9.1) software [9].
After filtering, the sequences with 97% similarity of operational taxonomic units (OTU) from SILVA (version 123) taxonomic database [10,11] were clustered using the UCLUST algorithm [12] with a 97% sequence identity threshold. Reads were dereplicated, and singletons were discarded. The final OTU table was rarefied into minimum sequencing depth in the dataset.

2.5. Statistical and Bioinformatics Analyses of Microbiota

Differences in demographic characteristics between the two phosphate binder groups were determined using Student’s t-test or chi-squared test, as appropriate. The α-diversity (i.e., bacterial diversity within one sample) was determined by the Shannon index and Simpson index using the R “vegan” package. The β-diversity (i.e., diversity in bacterial composition between samples) was estimated by computing the Bray-Curtis distance and was visualized through a Principal Coordinates Analysis (PCoA) to evaluate the differences and similarities of bacterial communities [13]. Sample-grouped heterogeneity of β-diversity analysis was examined using analysis of similarity (Permutational multivariate analysis of variance using distance matrices (PERMANOVA)) with 104 bootstrap replications. The microbial alteration ratio modified from the microbial dysbiosis index (MDI) [14] was defined as the log10 of the total abundance in organisms increased in calcium carbonate users divided by the total abundance of organisms decreased in ferric citrate users.
Co-correlation analysis was used to determine the relationships within a complex community. Bacteria work as functional groups (guilds) in the gut ecosystem, which leads to a microbiota community structure that can be evaluated using the Sparse Correlations for Compositional data (SparCC) algorithm by calculating the most abundant OTUs that are shared by at least 20% of the samples. Then, a co-occurrence network is built from the SparCC calculations [15]. The p-values were calculated using a bootstrap procedure with 100 random permutations and iterations for each SparCC calculation, and then correlation matrices were computed from the resampled data matrices. Once the bootstrapped correlation scores were computed, only OTUs with correlation scores higher than 0.3 were classified into co-abundance groups (CAGs); these coefficients were also used to assess the length of edges on the network. The latter was conducted with the fast greedy modularity optimization algorithm to identify clusters in the network. An undirected network, weighted by SparCC correlation magnitude, was generated using the R “igraph” package. Nodes with <5 connection degrees were removed from the network, and hub nodes from each cluster were extracted for further community structure analyses [16]. The closeness and eigenvector of the nodes were calculated to measure node centralities in each network. Significant associations were defined as positive SparCC correlations with a p-value < 0.05.
Differential abundance analysis was performed based on the relative abundance levels of the top genera, families, and orders distinctly distributed between the two phosphate binders. We further analyzed the bacterial community difference between phosphate binder groups by the linear discriminant analysis (LDA) of effect size (LEfSe) analysis at the OTU level with more than 0.1% relative abundances and present in >30% of samples to determine the most discriminatory taxa among phosphate binder users. The LEfSe analysis employed the non-parametric factorial Kruskal-Wallis test or Wilcoxon rank-sum test and LDA to identify differentially abundant taxa between the two phosphate binder groups. Only taxa with an LDA score more significant than two or less than two at a p < 0.05 were considered significantly enriched. All statistical tests were two-tailed, and p < 0.05 was considered statistically significant. Furthermore, the heat tree method was used to compare the abundance of different taxonomic levels for each pair of factors in a metadata variable. A hierarchical structure of taxonomic classifications to quantitatively (median abundance) and statistically (non-parameter Wilcoxon rank-sum test) depict taxa differences among communities was performed using R “metacoder” package [17]. Statistical analyses were performed using R statistical software (version 3.5.1).

2.6. Functional Annotation

Predicted functional genes were aligned to the Kyoto Encyclopedia of Genes and Genomes (KEGG) database and annotated by KEGG orthology (KO) using the R “Tax4Fun” package [18]. The KEGG metabolic modules were retrieved from the KEGG MODULE database, mapped with KOs, and calculated the differential abundance between two phosphate binders by Wilcoxon rank-sum test. KEGG modules were deemed present when ≥30% of the enzymes were recovered after manual removing overly “promiscuous” enzymes (that is, present in multiple modules) before the abundance calculation.
In total, 85 HD patients provided a stool sample. After excluding participants who used two types of phosphate binders (n = 31), HD patients taking ferric citrate (n = 8) and calcium carbonate phosphate binders (n= 46) were compared, as shown in Figure S1. The baseline characteristics of the enrolled HD patients are reported in Table 1. The mean age was 55.8 years in the ferric citrate group and 61.5 years in the calcium carbonate group, with a mean HD duration of 91.5 months in ferric citrate users and 84.11 months in calcium carbonate users. The two groups were similar in age, gender, cause of end-stage renal disease, HD arteriovenous shunt type, comorbidities, medications known to affect the gut microbiota, the dietary consumption patterns of vegetables or fruits, and Bristol stool scale. In addition, there was no significant difference in hemoglobin, albumin, alkaline phosphatase ion calcium, phosphate, and parathyroid hormone level between groups, as shown in Table 1.

3. Results

3.1. Patient Characteristics

In total, 85 HD patients provided a stool sample. After excluding participants who used two types of phosphate binders (n = 31), HD patients taking ferric citrate (n = 8) and calcium carbonate phosphate binders (n = 46) were compared (Figure S1). The baseline characteristics of the enrolled HD patients are reported in Table 1. The mean age was 55.8 years in the ferric citrate group and 61.5 years in the calcium carbonate group, with a mean HD duration of 91.5 months in ferric citrate users and 84.11 months in calcium carbonate users. The two groups were similar in age, gender, cause of end-stage renal disease, HD arteriovenous shunt type, comorbidities, medications known to affect the gut microbiota, the dietary consumption patterns of vegetables or fruits, and Bristol stool scale. In addition, there was no significant difference in hemoglobin, albumin, alkaline phosphatase ion calcium, phosphate, and parathyroid hormone level between groups, as shown in Table 1.

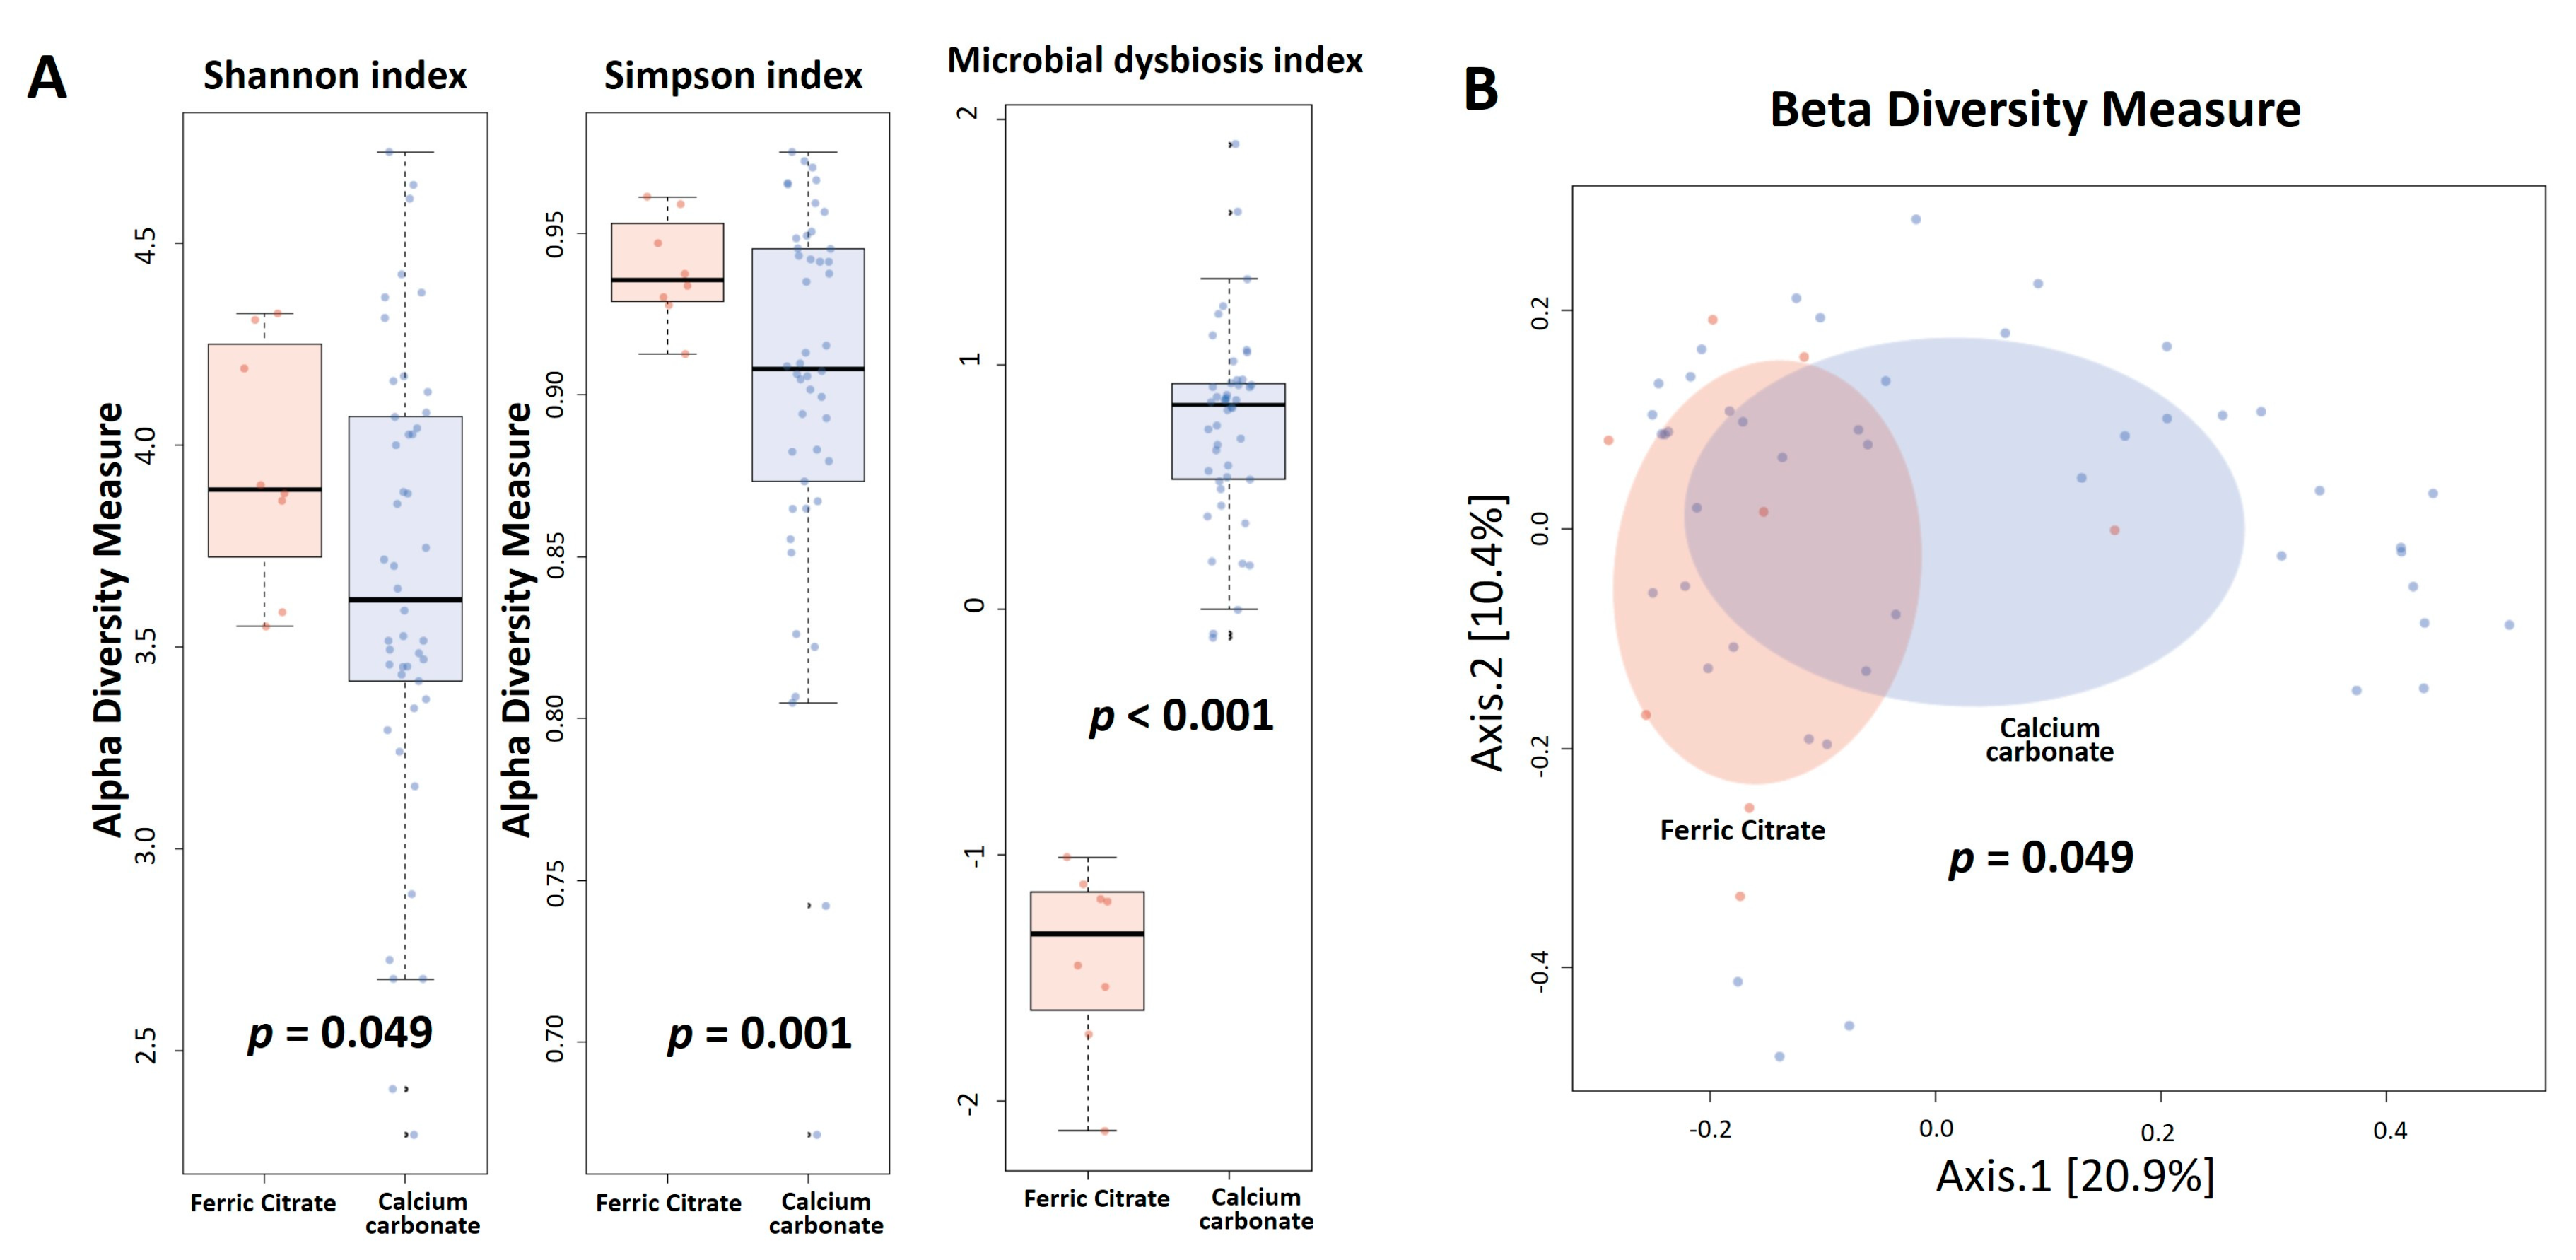
3.2. Gut Microbiota Profile Differs between Ferric Citrate and Calcium Carbonate Treatment

No differences in gene rarefaction were found between two phosphate binders (Figure S2). To evaluate alterations in the microbiota structure between treatments, microbial α diversity (i.e., within-sample diversity) and β diversity (i.e., diversity between samples) were measured, with a significant decrease in the α diversity using the Shannon index (p = 0.049) and Simpson index (p = 0.001) in the calcium carbonate group (Figure 1A). The microbial alteration ratio was higher in calcium carbonate users compared to ferric citrate users (p < 0.001), as shown in Figure 1A. β diversity (bacterial community) was calculated using Bray-Curtis distance metrics and visualized in PCoA plots, with the microbiota composition of ferric citrate users significantly different from that of calcium carbonate users (PERMANOVA, p = 0.049) (Figure 1B).

3.3. Co-Occurrence Pattern Analysis of the Intestinal Ecosystems of Ferric Citrate Users or Calcium Carbonate Users

For visualization of the internal interactions and further measurement of the microbial community, SparCC was used to calculate the Spearman correlation coefficient with the corresponding p-value between every two taxa. Co-occurrence analysis was used to investigate the potential relationships between different taxa in ferric citrate and calcium carbonate users. Each node in the network indicates a bacterial genus (Figures S3 and S4, Tables S1 and S2). The complexity and composition of the networks were similar for both phosphate binder groups. The highest identifying hub species within each ecosystem showed that Bacteroidetes was a potential keystone phylum determining the network in both phosphate binder groups. The identified centers (hubs) of core microbes included the species belong to genera Bacteroides in ferric citrate users and the species belong to genera Prevotella 9 in calcium carbonate users (Tables S1 and S2).

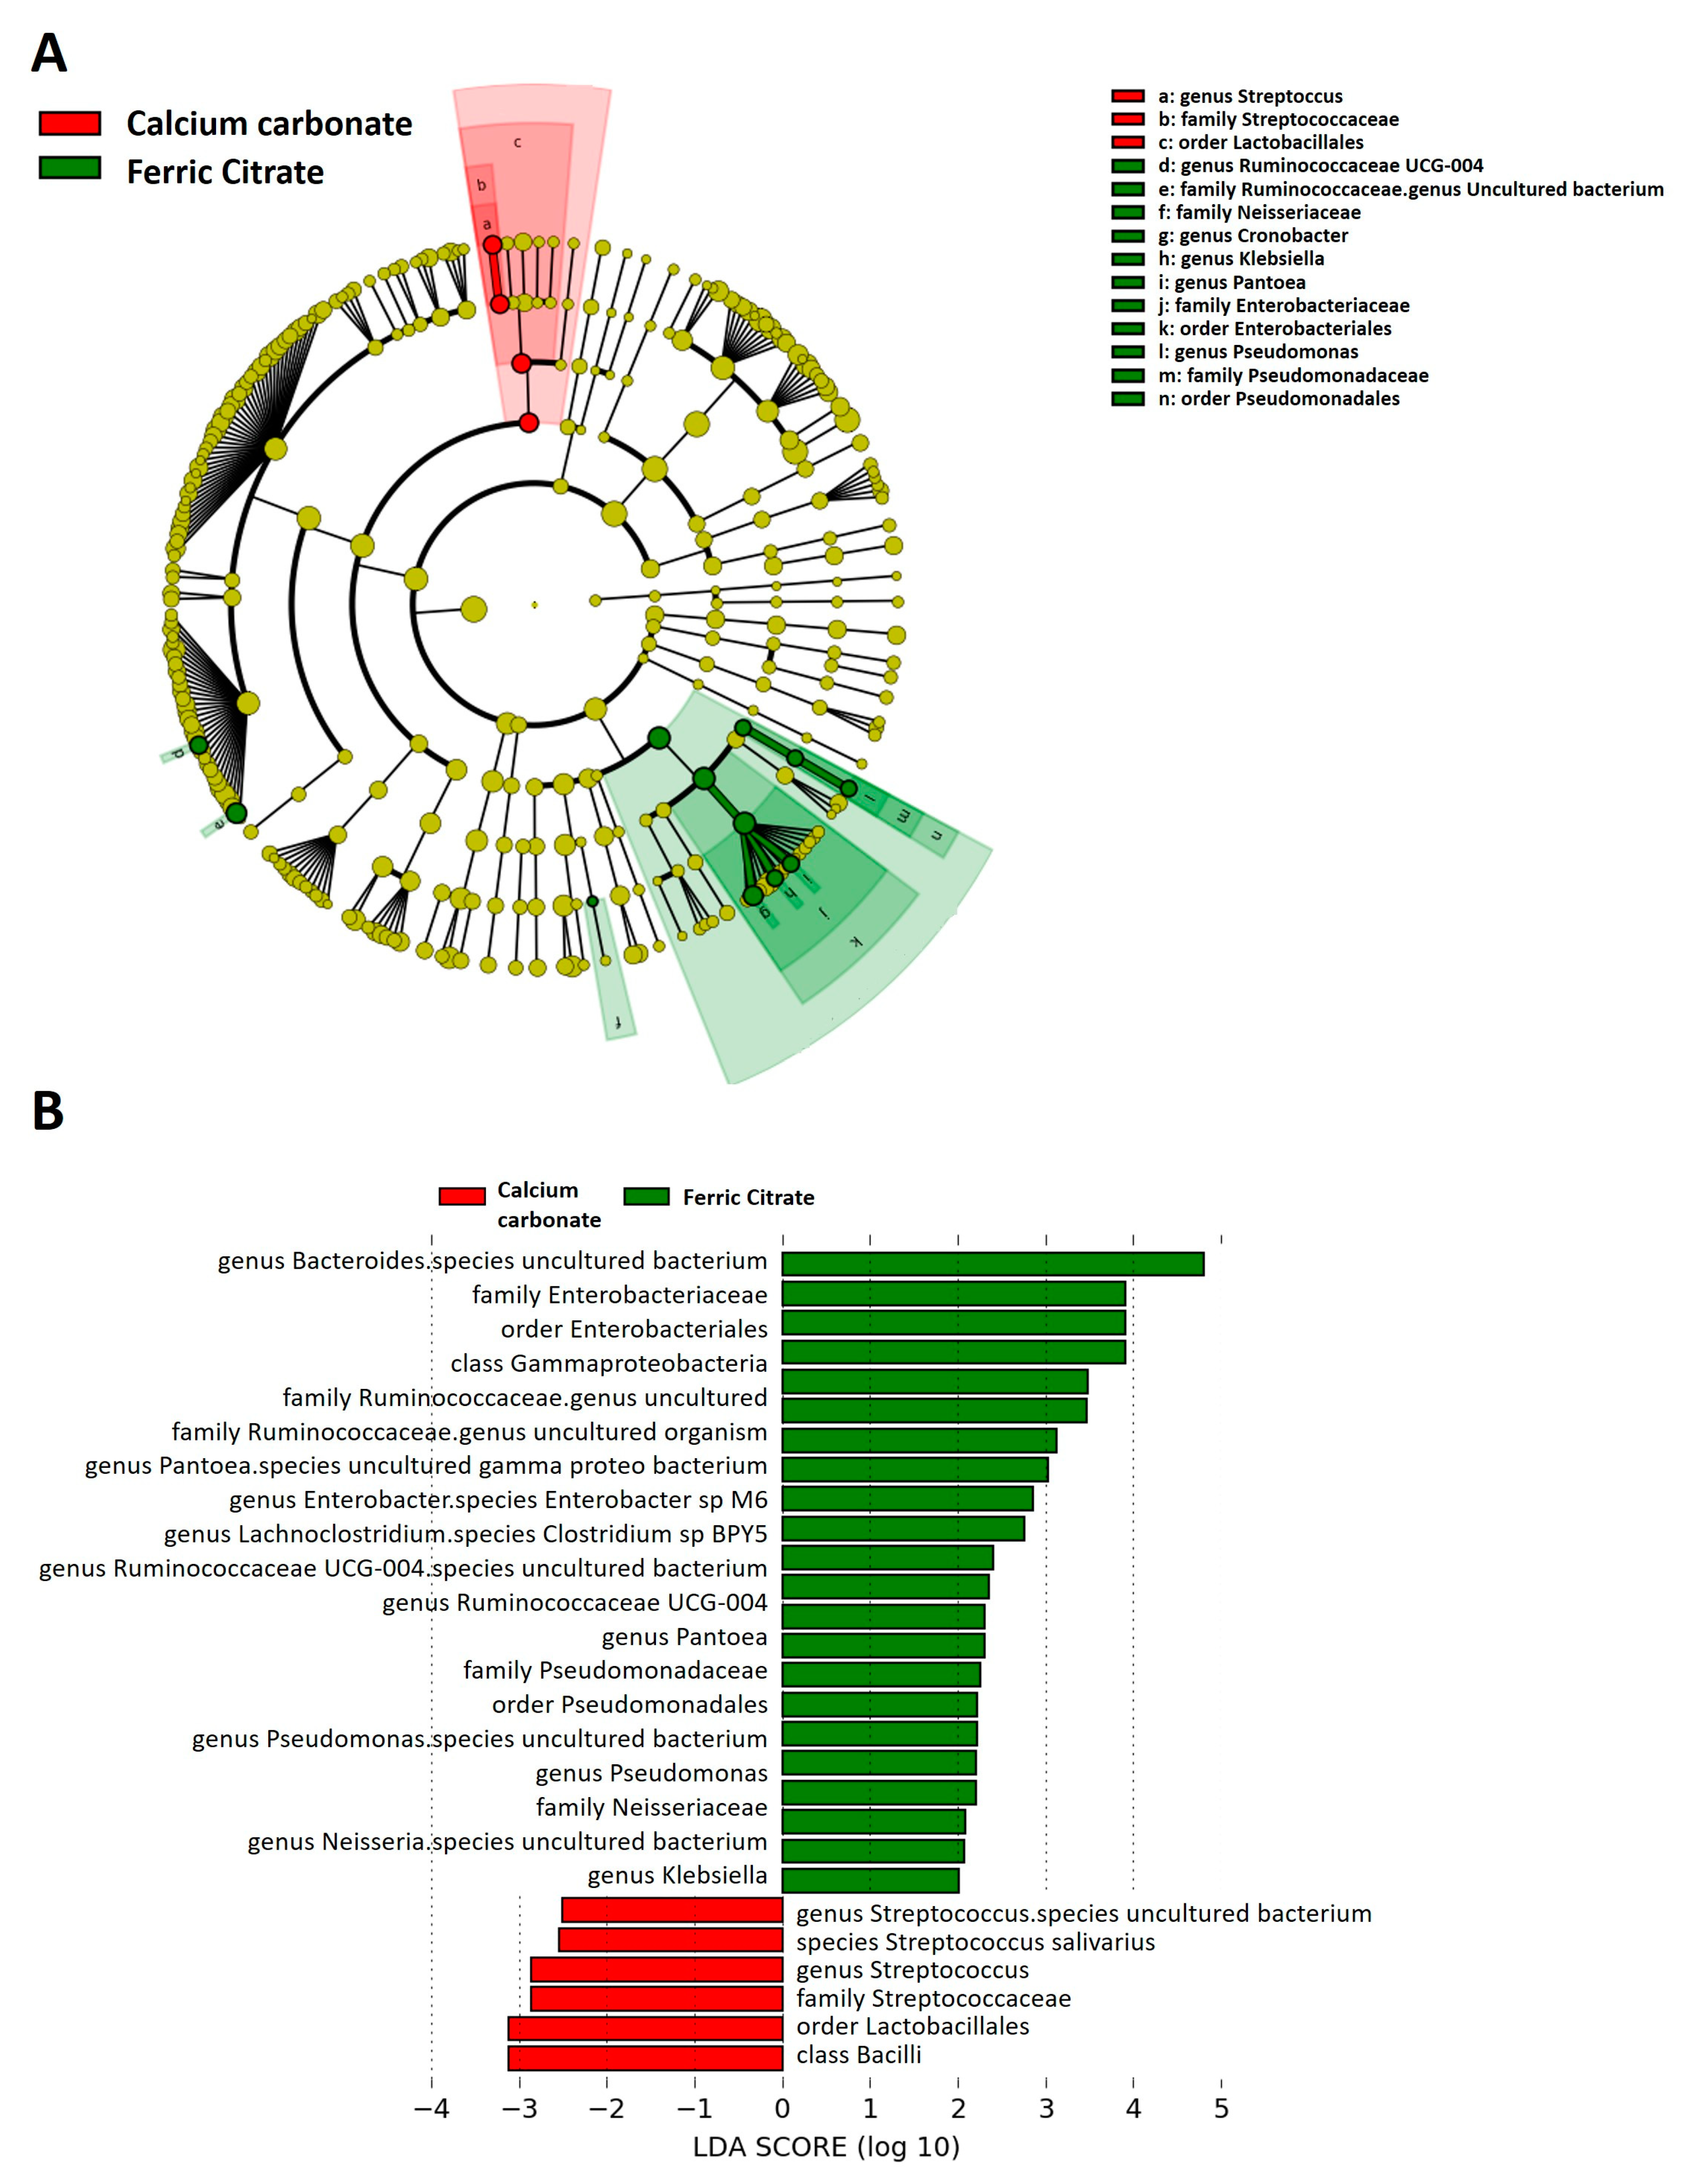
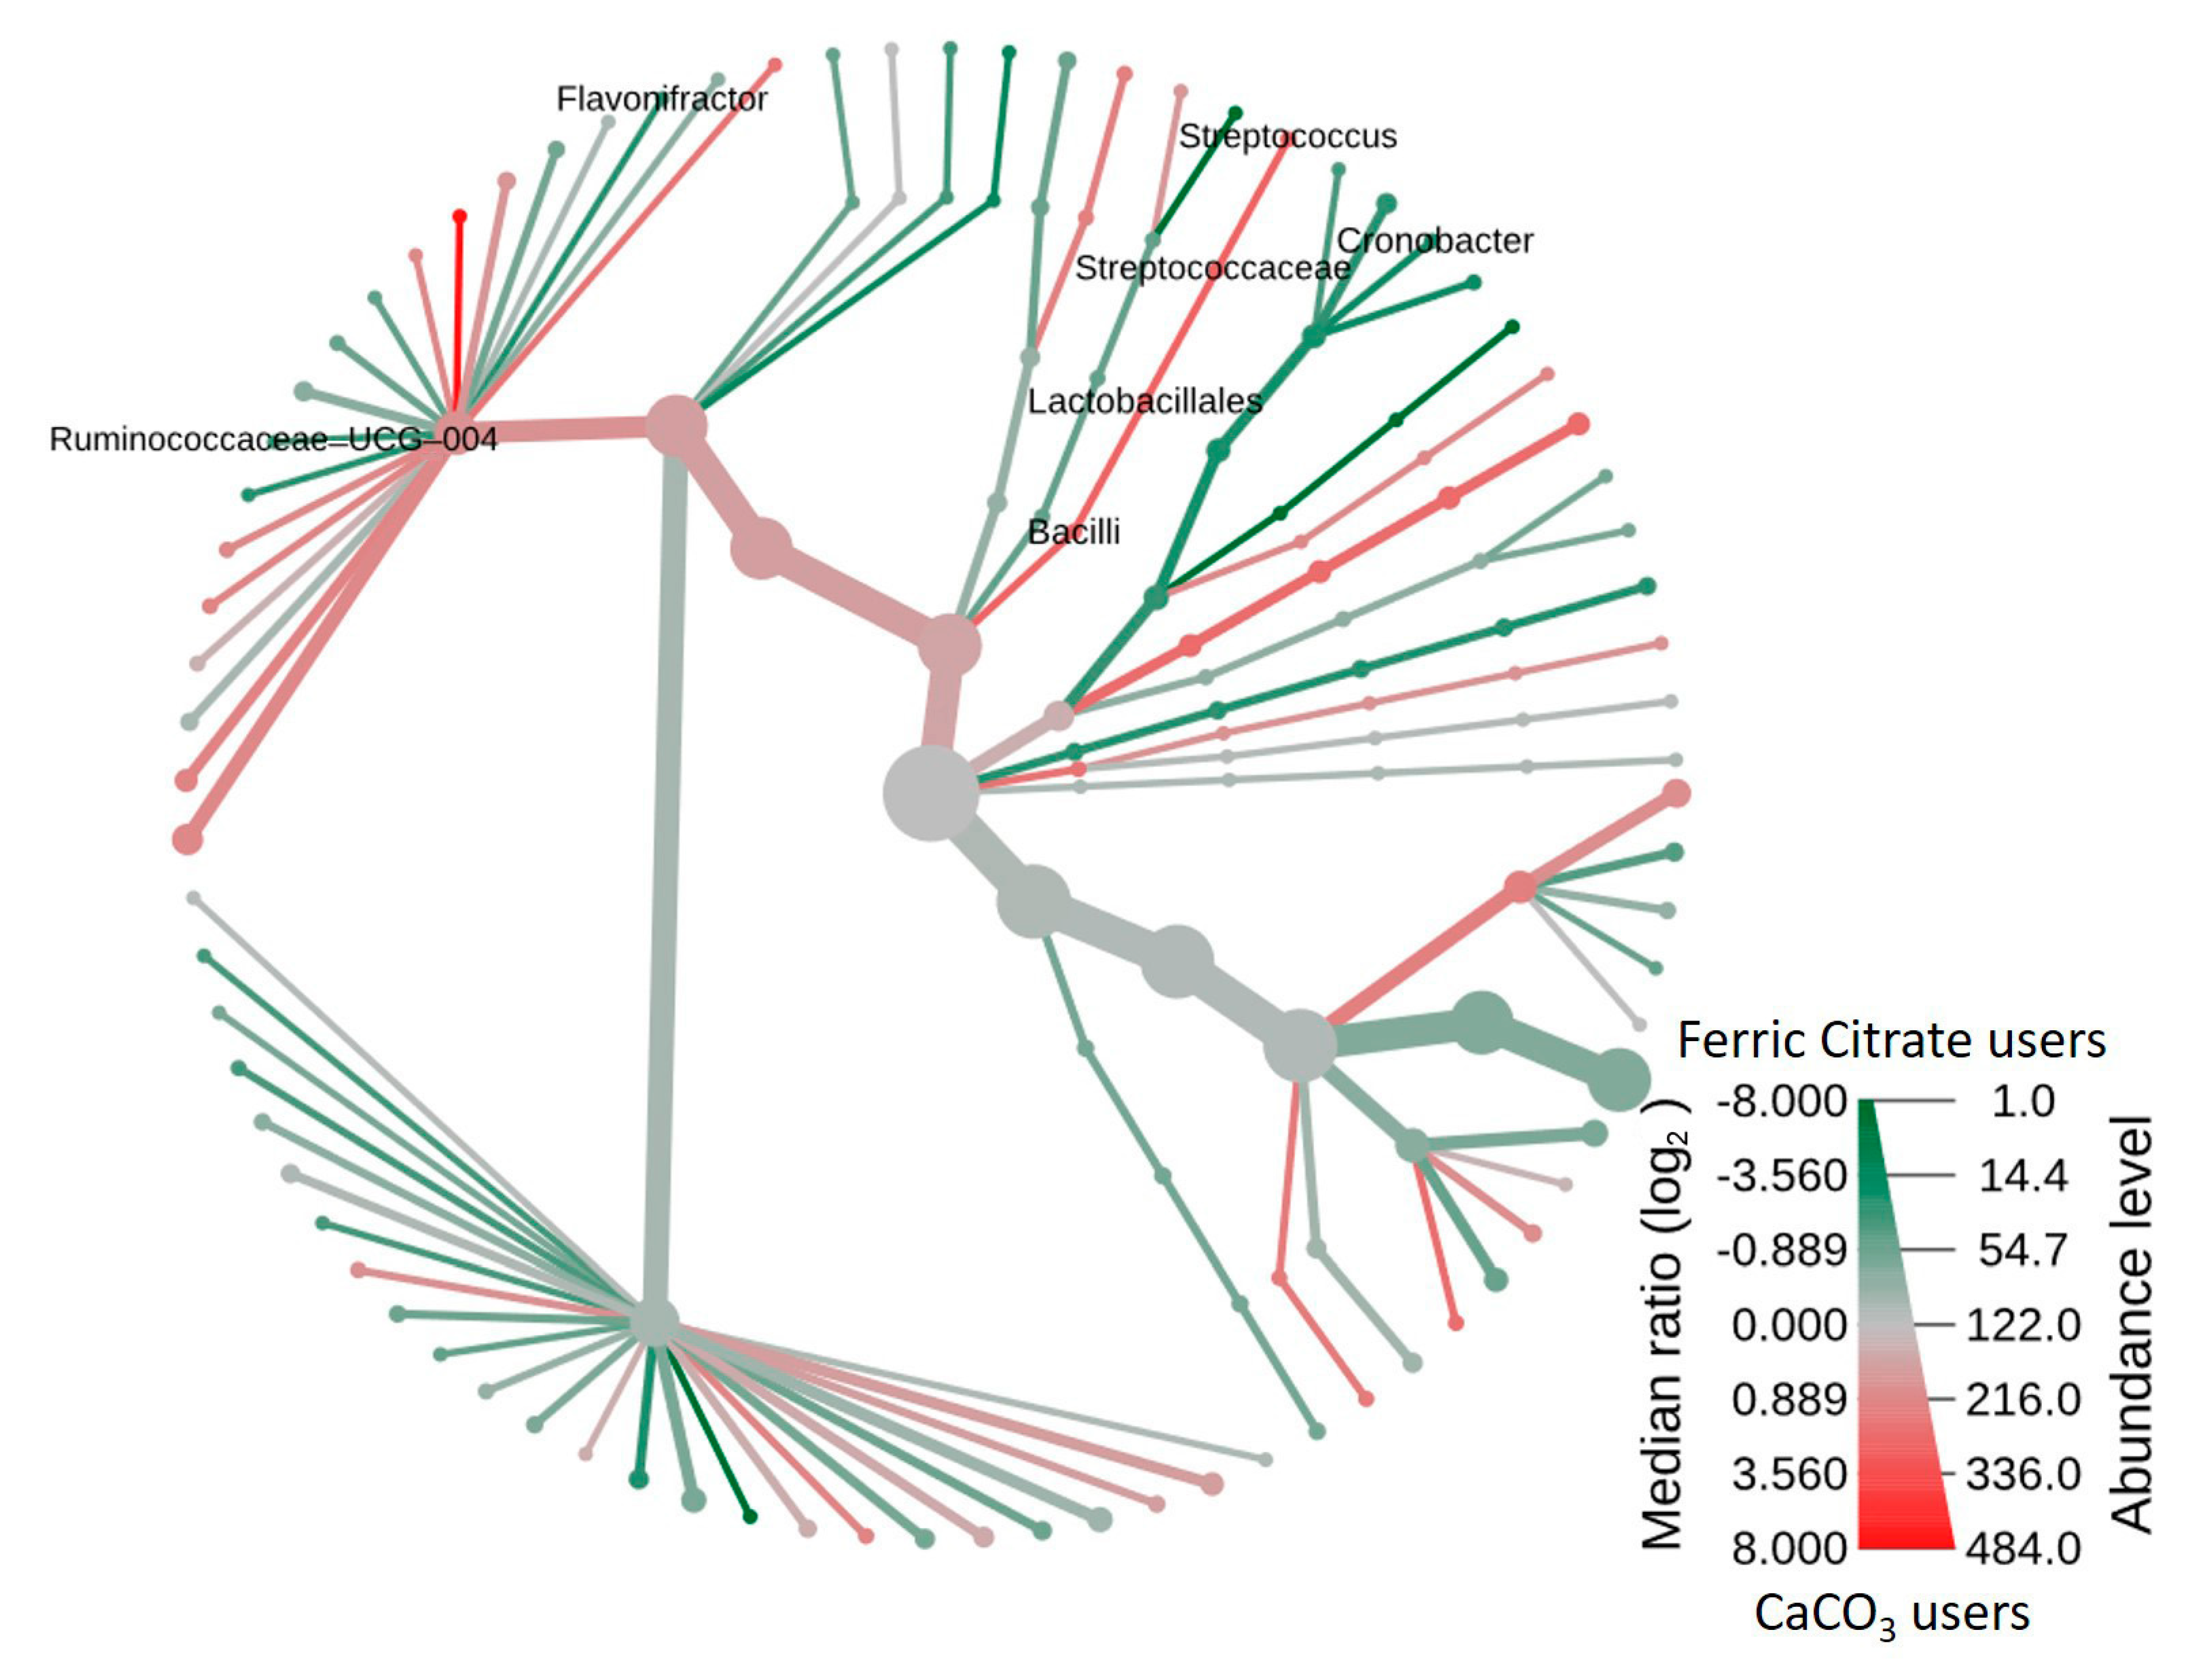
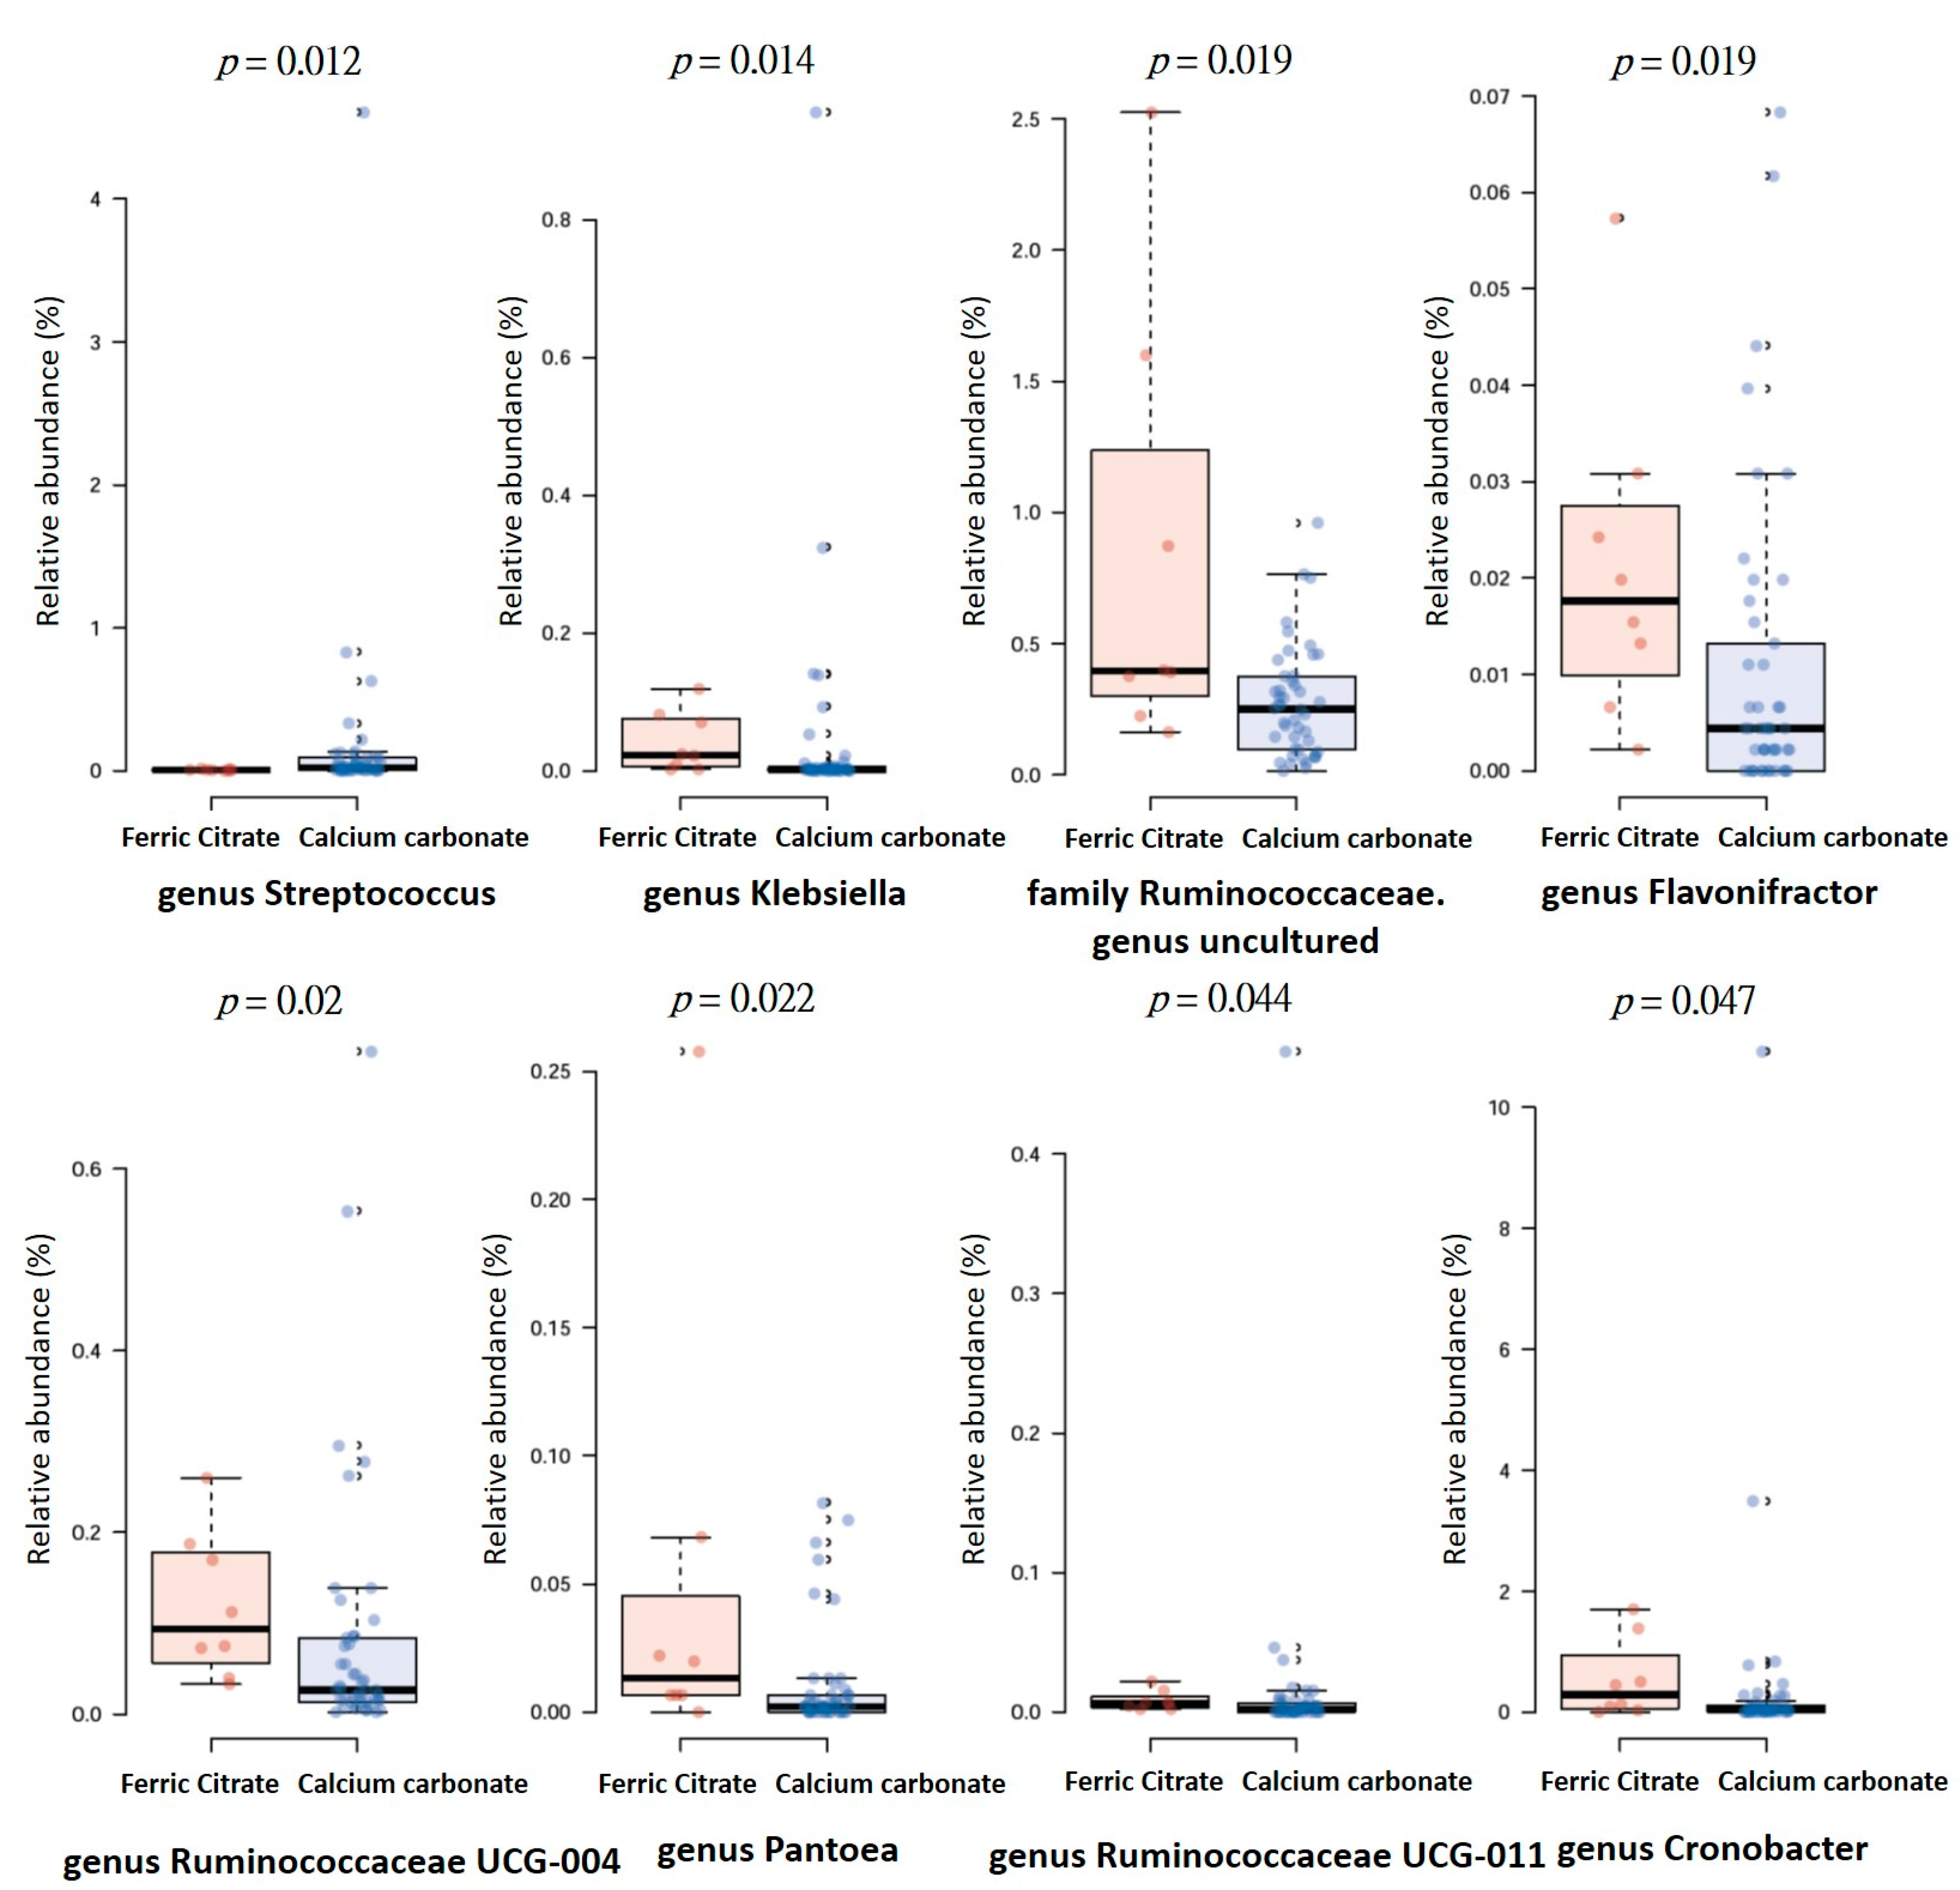
3.4. Specific Microbial Taxa are Associated with Different Phosphate Binders

To identify the significant differentiating taxa between study groups, we performed a discriminant analysis using LEfSe and cladogram, showing enrichment in Gammaproteobacteria taxa in ferric citrate users, including the genera Pantoea, Enterobacter, Neisseria, and Klebsiella (all from order Enterobacterales) and the genus Pseudomonas (family Pseudomonadaceae); the genera Bacteroides (phylum Bacteroidetes), Lachnoclostridium, Ruminococcaceae UCG-004 (phylum Firmicutes) (Figure 2A,B). Streptococcus and Lactobacillales, belonging to the phylum of Bacilli as well as lactate producing bacteria, were enriched in the fecal microbiota of HD patients treated with calcium carbonate (Figure 2A,B). After linear discriminant analysis, the differentially enriched relative abundance demonstrated increased genus Streptococcus, family Streptococcaceae, and order Lactobacillales in calcium carbonate users (Figure S5). Regarding ferric citrate users, increased relative taxa abundance of family Bacteroidaceae was observed (Figure S5).
Furthermore, the heat tree method showed that compared to the ferric citrate users, the most abundant taxa among calcium carbonate users was class Bacilli, order Lactobacillales, family Streptoccaceae, genus Streptococcus, and species Streptococcus salivarius (Figure 3), whereas genus Ruminococcaceae UCG-004, Flavonifractor, and Cronobacter were enriched in ferric citrate phosphate binder users (Figure 3). The top eight genera abundance difference demonstrated the specific microbial features at the genus level associated with phosphate binder exposure, with significantly increased genera Klebsiella, Flavonifractor, Pantoea, Cronobacter, Ruminococcaceae UCG-004, Ruminococcaceae UCG-011, and one Ruminococcaceae with the unclassified genus in ferric citrate users, whereas calcium carbonate users had a higher relative abundance of genus Streptococcus (Figure 4).

3.5. Functional Characterization of the Microbiome in Different Phosphate Binder Users

To characterize the distinct functions of the gut microbiota, we performed functional annotations of the metagenome to KEGG modules. The predicted KEGG modules that were significantly enriched in calcium carbonate users related to metabolism, including pantothenate biosynthesis, C1-unit interconversion, and formaldehyde assimilation (serine pathway) (Figure S6). In contrast, the predicted KEGG modules significantly enriched in ferric citrate users included cholesterol biosynthesis, clavaminate biosynthesis, enterotoxigenic Escherichia coli pathogenicity signature, and vibrio cholera pathogenicity signature (Figure S6).

4. Discussion

In our study, the stool microbial communities in HD patients receiving ferric citrate and calcium carbonate were structurally different, with reduced microbial species diversity and increased microbial dysbiosis index in calcium carbonate users. The distinctiveness of the microbiota was confirmed by β diversity analysis (Bray-Curtis dissimilarity metrics), demonstrating the clustering of samples according to two different phosphate binders, with the microbial communities in both groups containing higher levels of Bacteroidetes and lower levels of Firmicutes, similar to the microbial communities identified in rats with CKD [5]. In terms of the stool microbiota composition, calcium carbonate users had more bacteria from order Bacilli to species Streptococcus salivarius; specifically, genus Streptococcus was enriched in calcium carbonate users, while the genus Ruminococcaceae UCG-004, Flavonifractor, and Cronobacter were enriched in ferric citrate users.
The co-occurrence analysis identifies groups of organisms that may have commensal interactions with each other or, conversely, organisms that may be antagonistic to each other in a given environmental setting. Centralized modules within a correlation network may also indicate “hub species”: organisms whose presence may be crucial to the stability of a community [16]. Here, we found hub species among two phosphate binders belong to two essential genera Bacteroides and Prevotella and may represent different enterotypes (Bacteroides/Prevotella). These hub species are vital to preserving their ecological communities’ organization and diversity through biotic interactions with other ecosystem members [19]. The identified hub species in the co-occurrence network showed the species belong to genera Bacteroides in ferric citrate users and the species belong to genera Prevotella 9 in calcium carbonate users. The dominant hub species belong to genera Bacteroides in ferric citrate users may explain by the iron-containing environment in the gut [20]. The gut anti-acid effect by calcium carbonate may explain the dominant hub species belong to genera Prevotella in our study [21]. Thus, relatively small differences in individual diets or drugs could affect hub species, which may be essential to organize gut microbial consortia into distinct types of communities, or “enterotypes” [22,23]. As demonstrated in our study, the different phosphate binders treatment could present different hub species in HD patients.
Iron-based phosphate binders had been proposed to alter the gut microbiota [24]. Limited evidence demonstrated calcium-based phosphate binders’ effect on the gut microbiota in the literature [24]. In our study, Bacteroidaceae, a typical and large family of gastrointestinal Gram-negative bacteria, was enriched in ferric citrate users. Genus Bacteroides was also identified as hub taxa in the co-occurrence analysis of ferric citrate users, whereas Streptococcaceae, a family of Gram-positive bacteria, was predominant in calcium carbonate users. In particular, Streptococcus salivarius, which needs calcium carbonate as essential material [25] and can produce active urease [26], was more relatively abundant in calcium carbonate users. Importantly, Streptococcus is associated with hypertension [27], atherosclerotic cardiovascular diseases [28], heart failure [29], and atrial fibrillation [30], which are key comorbidities in HD patients. Furthermore, the functional prediction of the gut microbiome demonstrated an increased pathogenicity signature of enterotoxigenic Escherichia coli among KEGG modules.
Interestingly, citrate is a common biomolecule that chelates Fe(III) and can be used by some bacteria (e.g., Escherichia coli [31,32] and Bacillus cereus [33]) as an iron-chelating molecule to fulfill their nutritional requirement for iron. The receptors specific for the uptake of ferric citrate are typically grouped with iron-loaded siderophore receptors on the bacterial cell surface [34]. In our study, Cronobacter, present in the siderophore-mediated iron acquisition system [28], was enriched in ferric citrate users, confirming the link between ferric citrate exposure and Gram-negative bacteria richness.
In a recent study of 5/6 nephrectomized rats that underwent 6 weeks of a 4% ferric citrate diet, the ferric citrate diet increased fecal α-diversity (species richness), reduced the relative abundance of Firmicutes, and increased the relative abundance of the Akkermansia genus and the Clostridiaceae and Enterobacteriaceae families compared to the untreated CKD rats [5]. We also demonstrated the increased α-diversity in ferric citrate users as well as lower MDI. Comparing the specific taxa between phosphate binders, ferric citrate users had a lower relative abundance of Firmicutes and a higher relative abundance of Bacteroidetes; however, there was no difference in family Enterobacteriaceae Figure S5 or Clostridiaceae (p = 0.428); rather, there was an increased relative abundance of family Bacteroidaceae, and genus Ruminococcaceae UCG-004, Flavonifractor, and Cronobacter in ferric citrate users. In this study, identifying the phosphate binder effect on the gut opens a new era in nephrology, filling the existing gap in the interpretation of the beneficial effects of phosphate binders.
Oral iron supplementation can reduce beneficial bacterial such as Bifidobacteriaceae and Lactobacillaceae and increase gut permeability [35]. Contrary to our results, an in vitro study on Caco-2 cells incubated with ferric citrate/ferrous sulfate and human microbiota showed diminished levels of Lactobacillaceae and Bifidobacteriaceae [36]. In normal and CKD rats treated with ferric citrate, decreased Lactobacillaceae levels were observed [5]. In our study, there was no difference in the microbiome family Bifidobacteriaceae (p = 0.240) between treatments, with an extremely low abundance of Lactobacillaceae but a more significant difference between two phosphate binders, including genera Ruminococcaceae UCG-004, Flavonifractor, Cronobacter, and Streptococcus. Dietary iron depletion reduced Ruminococcaceae in a mouse model [37], and the oral administration of liquid iron increased Ruminococcaceae in a rat model [38], suggesting the detrimental effects of excess iron on gut health. The Ruminococcaceae family degrades mucus, and complex carbohydrates can produce butyrate production [22,39] and are negatively associated with pulse wave velocity [40], which is an indicator of arterial stiffness, whereas the genus Flavonifractor potentially induces oxidative stress and inflammation via cleavage of the flavonoid C-ring and degeneration of quercetin [41,42]. A positive correlation between Flavonifractor and circulating inflammatory markers were also found [43]. However, ferric citrate treatment did not promote inflammation in a randomized clinical trial of dialysis patients [44].
Evaluation of the KEGG modules functional prediction showed the enriched function of cofactor and vitamin biosynthesis in calcium carbonate users compared to ferric citrate users, such as pantothenate biosynthesis and C1-unit interconversion. Pantothenate (Pantothenic acid), a water-soluble vitamin B5, is involved in the synthesis of coenzyme-A, lipids, proteins, carbohydrates, neurotransmitters, steroid hormones, and hemoglobin [45,46]. C1-unit is produced from the degradation of amino acids, glycine, serine, histidine, and tryptophan, and is involved in folate synthesis [47]. Formaldehyde assimilation (serine cycle) is involved in methanol and carbon metabolism [48,49]. Regarding the functional prediction of ferric citrate users, cholesterol biosynthesis and clavaminate biosynthesis were enriched. Several studies have confirmed that gut microbiota plays a crucial role in cholesterol metabolism [50,51]. Clavaminate synthase contains nonheme iron, which corresponds to ferric citrate treatment in our study [52].
In this study, LEfSe analysis was performed. However, one drawback is that the discriminant analysis is quite sensitive to outliers, so we also demonstrated the selected taxa’s box plot after linear discriminant analysis (Figure S5). Interestingly, we only found genus Streptococcus, family Streptococcaceae, and order Lactobacillales enriched abundance in calcium carbonate users, and family Bacteroidaceae enriched abundance in ferric citrate users. Some limitations should be acknowledged. First, cross-sectional studies provide an overview of the relative abundance of bacterial taxa at a single time point rather than capture the complex dynamics of the microbial ecosystems in the gut of HD patients with different phosphate binders. Second, confounders cannot be excluded, and statistical correlations between phosphate binders and gut microbiota profiles do not necessarily implicate a causal inference. Phosphate control treatments are essential for HD patients in daily practice, so it was challenging to include subjects without a phosphate binder. Thus, the comparison of the gut microbiota before and after phosphate binder treatment is difficult. However, further studies to compare microbiota composition between phosphate binder naïve treatment patients are still needed to elucidate the causal relationship.
Furthermore, the dietary information obtained from the questionnaire is subjective to recall bias. Our diet questionnaire was also limited to record the citrate intake among participants. The precision of dietary intake can benefit from having more objective dietary records. Third, other phosphate binders (e.g., lanthanum carbonate, sevelamer hydrochloride/carbonate, or sucroferric oxyhydroxide) that potentially affect gut microbiota were not evaluated in this study [24,53,54]. Fourth, the study was performed on Asian HD patients whose diet may be different from other populations. Last, to avoid the mixed effect of different phosphate binders on gut microbiota, participants ≥ two phosphate binders exposure were excluded. Furthermore, participants with ferric citrate or calcium carbonate treatment for more than two months can represent a single phosphate binder user in our study. Nevertheless, we only have a limited sample size with only eight ferric citrate users, so the results should be interpreted cautiously.

5. Conclusions

This study demonstrated that the diversity and composition of the gut microbiota were different in ferric citrate and calcium carbonate phosphate binders, confirming that different phosphate binders have additional effects, which may be mediated by the selective modulation of the microbiota. Further investigations are warranted for the cause–effect role of ferric citrate phosphate binder treatment on gut microbiota and subsequent manipulation of different phosphate binders to improve abnormal gut microbiota, thereby present promising targets for future studies.

Supplementary Materials

The following are available online at https://0-www-mdpi-com.brum.beds.ac.uk/2076-2607/8/12/2040/s1, Figure S1: Enrollment of study participants, Figure S2: Rarefaction curves show the number of sequence reads and their corresponding number of OTUs, Figure S3: Core microbiota associated with ferric citrate phosphate binder used in hemodialysis patients. The name of the microbiome was summarized in Table S1, Figure S4: Core microbiota associated with calcium carbonate used in hemodialysis patients. The name of the microbiome was summarized in Table S2, Figure S5: The relative abundance of the specific genus (A), family (B), and order (C) differentially enriched in the clinical settings after linear discriminant analysis, Figure S6: Functional classification of the predicted metagenome content of the microbiota of two different phosphate binders using KO modules. The relative abundances of modules were compared between hemodialysis patients with ferric citrate phosphate binder used or calcium carbonate phosphate binder used. Significance was considered for p < 0.05, Table S1: Summary table of core microbiota associated with ferric citrate phosphate binder used in hemodialysis patients, Table S2: Summary table of core microbiota associated with calcium carbonate phosphate binder used in hemodialysis patients.

Author Contributions

Conceptualization, P.-H.W., Y.-T.L., Y.-W.C. and M.-C.K.; Methodology, P.-H.W., Y.-T.L. and P.-Y.L.; Software, P.-H.W., Y.-T.L. and P.-Y.L.; Validation, P.-H.W. and P.-Y.L.; Formal analysis, P.-H.W., Y.-T.L. and P.-Y.L.; Investigation, P.-H.W., Y.-T.L., P.-Y.L., Y.-W.C., M.-C.K. and C.-Y.W.; Resources, Y.-W.C. and M.-C.K; Data curation, P.-H.W. and P.-Y.L.; Writing—original draft preparation, P.-H.W. and P.-Y.L.; Writing—review and editing, Y.-W.C., M.-C.K., W.-C.H., T.-Y.L., S.-C.H. and R.A.D.; Visualization, P.-H.W.; Supervision, Y.-W.C., M.-C.K. and C.-Y.W.; Project administration, P.-H.W.; Funding acquisition, P.-H.W. and Y.-T.L. All authors have read and agreed to the published version of the manuscript.

Funding

The study was funded by grants from the Ministry of Science and Technology, Taiwan (MOST 105-2628-B-037-005-MY2, MOST 106-2314-B-037-054, and MOST 107-2314-B-037-104), Kaohsiung Medical University Hospital, Taiwan (KMUH105-5R15, KMUH106-6R17, KMUH107-7R16, KMUH107-7R78, KMUH108-8M11, and KMUH108-8R70), and Kaohsiung Medical University, Taiwan (KMU-Q108024 and KMU-Q108027), and Kaohsiung Medical University “Aim for the Top Universities Grant, grant No. KMU-TP104PR25, No. KMU-TP104PR26”.

Acknowledgments

We acknowledge Germark Biotechnology Lab for the stool sample analysis of gut microbiota.

Conflicts of Interest

The authors declare no conflict of interest.

References

  1. Ketteler, M.; Block, G.A.; Evenepoel, P.; Fukagawa, M.; Herzog, C.A.; McCann, L.; Moe, S.M.; Shroff, R.; Tonelli, M.A.; Toussaint, N.D.; et al. Diagnosis, Evaluation, Prevention, and Treatment of Chronic Kidney Disease-Mineral and Bone Disorder: Synopsis of the Kidney Disease: Improving Global Outcomes 2017 Clinical Practice Guideline Update. Ann. Intern. Med. 2018, 168, 422–430. [Google Scholar] [CrossRef] [PubMed]
  2. Barreto, F.C.; Barreto, D.V.; Massy, Z.A.; Drueke, T.B. Strategies for Phosphate Control in Patients With CKD. Kidney Int. Rep. 2019, 4, 1043–1056. [Google Scholar] [CrossRef] [PubMed] [Green Version]
  3. Vaziri, N.D.; Wong, J.; Pahl, M.; Piceno, Y.M.; Yuan, J.; DeSantis, T.Z.; Ni, Z.; Nguyen, T.H.; Andersen, G.L. Chronic kidney disease alters intestinal microbial flora. Kidney Int. 2013, 83, 308–315. [Google Scholar] [CrossRef] [PubMed] [Green Version]
  4. Rahbar Saadat, Y.; Niknafs, B.; Hosseiniyan Khatibi, S.M.; Ardalan, M.; Majdi, H.; Bahmanpoor, Z.; Abediazar, S.; Zununi Vahed, S. Gut microbiota; an overlooked effect of phosphate binders. Eur. J. Pharmacol. 2019, 868, 172892. [Google Scholar] [CrossRef]
  5. Lau, W.L.; Vaziri, N.D.; Nunes, A.C.F.; Comeau, A.M.; Langille, M.G.I.; England, W.; Khazaeli, M.; Suematsu, Y.; Phan, J.; Whiteson, K. The Phosphate Binder Ferric Citrate Alters the Gut Microbiome in Rats with Chronic Kidney Disease. J. Pharmacol. Exp. Ther. 2018, 367, 452–460. [Google Scholar] [CrossRef] [Green Version]
  6. Herlemann, D.P.; Labrenz, M.; Jurgens, K.; Bertilsson, S.; Waniek, J.J.; Andersson, A.F. Transitions in bacterial communities along the 2000 km salinity gradient of the Baltic Sea. ISME J. 2011, 5, 1571–1579. [Google Scholar] [CrossRef] [Green Version]
  7. Comeau, A.M.; Douglas, G.M.; Langille, M.G. Microbiome Helper: A Custom and Streamlined Workflow for Microbiome Research. mSystems 2017, 2. [Google Scholar] [CrossRef] [Green Version]
  8. Zhang, J.; Kobert, K.; Flouri, T.; Stamatakis, A. PEAR: A fast and accurate Illumina Paired-End reAd mergeR. Bioinformatics 2014, 30, 614–620. [Google Scholar] [CrossRef] [Green Version]
  9. Caporaso, J.G.; Kuczynski, J.; Stombaugh, J.; Bittinger, K.; Bushman, F.D.; Costello, E.K.; Fierer, N.; Pena, A.G.; Goodrich, J.K.; Gordon, J.I.; et al. QIIME allows analysis of high-throughput community sequencing data. Nat. Methods 2010, 7, 335–336. [Google Scholar] [CrossRef] [Green Version]
  10. Quast, C.; Pruesse, E.; Yilmaz, P.; Gerken, J.; Schweer, T.; Yarza, P.; Peplies, J.; Glockner, F.O. The SILVA ribosomal RNA gene database project: Improved data processing and web-based tools. Nucleic Acids Res. 2013, 41, D590–D596. [Google Scholar] [CrossRef]
  11. Yilmaz, P.; Parfrey, L.W.; Yarza, P.; Gerken, J.; Pruesse, E.; Quast, C.; Schweer, T.; Peplies, J.; Ludwig, W.; Glockner, F.O. The SILVA and “All-species Living Tree Project (LTP)” taxonomic frameworks. Nucleic Acids Res. 2014, 42, D643–D648. [Google Scholar] [CrossRef] [PubMed] [Green Version]
  12. Edgar, R.C. Search and clustering orders of magnitude faster than BLAST. Bioinformatics 2010, 26, 2460–2461. [Google Scholar] [CrossRef] [PubMed] [Green Version]
  13. Lozupone, C.A.; Hamady, M.; Kelley, S.T.; Knight, R. Quantitative and qualitative beta diversity measures lead to different insights into factors that structure microbial communities. Appl. Environ. Microbiol. 2007, 73, 1576–1585. [Google Scholar] [CrossRef] [PubMed] [Green Version]
  14. Gevers, D.; Kugathasan, S.; Denson, L.A.; Vazquez-Baeza, Y.; Van Treuren, W.; Ren, B.; Schwager, E.; Knights, D.; Song, S.J.; Yassour, M.; et al. The treatment-naive microbiome in new-onset Crohn’s disease. Cell Host Microbe 2014, 15, 382–392. [Google Scholar] [CrossRef] [Green Version]
  15. Friedman, J.; Alm, E.J. Inferring correlation networks from genomic survey data. PLoS Comput. Biol. 2012, 8, e1002687. [Google Scholar] [CrossRef] [Green Version]
  16. Berry, D.; Widder, S. Deciphering microbial interactions and detecting keystone species with co-occurrence networks. Front. Microbiol. 2014, 5, 219. [Google Scholar] [CrossRef] [Green Version]
  17. Foster, Z.S.; Sharpton, T.J.; Grunwald, N.J. Metacoder: An R package for visualization and manipulation of community taxonomic diversity data. PLoS Comput. Biol. 2017, 13, e1005404. [Google Scholar] [CrossRef] [Green Version]
  18. Asshauer, K.P.; Wemheuer, B.; Daniel, R.; Meinicke, P. Tax4Fun: Predicting functional profiles from metagenomic 16S rRNA data. Bioinformatics 2015, 31, 2882–2884. [Google Scholar] [CrossRef]
  19. Trosvik, P.; de Muinck, E.J. Ecology of bacteria in the human gastrointestinal tract--identification of keystone and foundation taxa. Microbiome 2015, 3, 44. [Google Scholar] [CrossRef] [Green Version]
  20. Rocha, E.R.; de Uzeda, M.; Brock, J.H. Effect of ferric and ferrous iron chelators on growth of Bacteroides fragilis under anaerobic conditions. FEMS Microbiol. Lett. 1991, 68, 45–50. [Google Scholar] [CrossRef]
  21. Svensater, G.; Larsson, U.B.; Greif, E.C.; Cvitkovitch, D.G.; Hamilton, I.R. Acid tolerance response and survival by oral bacteria. Oral Microbiol. Immunol. 1997, 12, 266–273. [Google Scholar] [CrossRef] [PubMed]
  22. Arumugam, M.; Raes, J.; Pelletier, E.; Le Paslier, D.; Yamada, T.; Mende, D.R.; Fernandes, G.R.; Tap, J.; Bruls, T.; Batto, J.M.; et al. Enterotypes of the human gut microbiome. Nature 2011, 473, 174–180. [Google Scholar] [CrossRef] [PubMed]
  23. Fisher, C.K.; Mehta, P. Identifying keystone species in the human gut microbiome from metagenomic timeseries using sparse linear regression. PLoS ONE 2014, 9, e102451. [Google Scholar] [CrossRef] [PubMed]
  24. Biruete, A.; Hill Gallant, K.M.; Lindemann, S.R.; Wiese, G.N.; Chen, N.X.; Moe, S.M. Phosphate Binders and Nonphosphate Effects in the Gastrointestinal Tract. J. Ren. Nutr. 2020, 30, 4–10. [Google Scholar] [CrossRef]
  25. Burton, J.P.; Chilcott, C.N.; Moore, C.J.; Speiser, G.; Tagg, J.R. A preliminary study of the effect of probiotic Streptococcus salivarius K12 on oral malodour parameters. J. Appl. Microbiol. 2006, 100, 754–764. [Google Scholar] [CrossRef] [PubMed]
  26. Chen, Y.Y.; Weaver, C.A.; Burne, R.A. Dual functions of Streptococcus salivarius urease. J. Bacteriol. 2000, 182, 4667–4669. [Google Scholar] [CrossRef] [PubMed] [Green Version]
  27. Yan, Q.; Gu, Y.; Li, X.; Yang, W.; Jia, L.; Chen, C.; Han, X.; Huang, Y.; Zhao, L.; Li, P.; et al. Alterations of the Gut Microbiome in Hypertension. Front. Cell. Infect. Microbiol. 2017, 7, 381. [Google Scholar] [CrossRef] [Green Version]
  28. Jie, Z.; Xia, H.; Zhong, S.L.; Feng, Q.; Li, S.; Liang, S.; Zhong, H.; Liu, Z.; Gao, Y.; Zhao, H.; et al. The gut microbiome in atherosclerotic cardiovascular disease. Nat. Commun. 2017, 8, 845. [Google Scholar] [CrossRef] [Green Version]
  29. Cui, X.; Ye, L.; Li, J.; Jin, L.; Wang, W.; Li, S.; Bao, M.; Wu, S.; Li, L.; Geng, B.; et al. Metagenomic and metabolomic analyses unveil dysbiosis of gut microbiota in chronic heart failure patients. Sci. Rep. 2018, 8, 635. [Google Scholar] [CrossRef]
  30. Zuo, K.; Li, J.; Li, K.; Hu, C.; Gao, Y.; Chen, M.; Hu, R.; Liu, Y.; Chi, H.; Wang, H.; et al. Disordered gut microbiota and alterations in metabolic patterns are associated with atrial fibrillation. Gigascience 2019, 8. [Google Scholar] [CrossRef] [Green Version]
  31. Braun, V. Surface signaling: Novel transcription initiation mechanism starting from the cell surface. Arch. Microbiol. 1997, 167, 325–331. [Google Scholar] [CrossRef] [PubMed]
  32. Angerer, A.; Braun, V. Iron regulates transcription of the Escherichia coli ferric citrate transport genes directly and through the transcription initiation proteins. Arch. Microbiol. 1998, 169, 483–490. [Google Scholar] [CrossRef] [PubMed]
  33. Fukushima, T.; Sia, A.K.; Allred, B.E.; Nichiporuk, R.; Zhou, Z.; Andersen, U.N.; Raymond, K.N. Bacillus cereus iron uptake protein fishes out an unstable ferric citrate trimer. Proc. Natl. Acad. Sci. USA 2012, 109, 16829–16834. [Google Scholar] [CrossRef] [PubMed] [Green Version]
  34. Wagegg, W.; Braun, V. Ferric citrate transport in Escherichia coli requires outer membrane receptor protein fecA. J. Bacteriol. 1981, 145, 156–163. [Google Scholar] [CrossRef] [Green Version]
  35. Kortman, G.A.M.; Reijnders, D.; Swinkels, D.W. Oral iron supplementation: Potential implications for the gut microbiome and metabolome in patients with CKD. Hemodial. Int. 2017, 21, S28–S36. [Google Scholar] [CrossRef] [Green Version]
  36. Kortman, G.A.; Dutilh, B.E.; Maathuis, A.J.; Engelke, U.F.; Boekhorst, J.; Keegan, K.P.; Nielsen, F.G.; Betley, J.; Weir, J.C.; Kingsbury, Z.; et al. Microbial Metabolism Shifts Towards an Adverse Profile with Supplementary Iron in the TIM-2 In vitro Model of the Human Colon. Front. Microbiol. 2015, 6, 1481. [Google Scholar] [CrossRef] [Green Version]
  37. Pereira, D.I.; Aslam, M.F.; Frazer, D.M.; Schmidt, A.; Walton, G.E.; McCartney, A.L.; Gibson, G.R.; Anderson, G.J.; Powell, J.J. Dietary iron depletion at weaning imprints low microbiome diversity and this is not recovered with oral Nano Fe(III). Microbiologyopen 2015, 4, 12–27. [Google Scholar] [CrossRef]
  38. Fang, S.; Zhuo, Z.; Yu, X.; Wang, H.; Feng, J. Oral administration of liquid iron preparation containing excess iron induces intestine and liver injury, impairs intestinal barrier function and alters the gut microbiota in rats. J. Trace Elem. Med. Biol. 2018, 47, 12–20. [Google Scholar] [CrossRef]
  39. Louis, P.; Scott, K.P.; Duncan, S.H.; Flint, H.J. Understanding the effects of diet on bacterial metabolism in the large intestine. J. Appl. Microbiol. 2007, 102, 1197–1208. [Google Scholar] [CrossRef]
  40. Menni, C.; Lin, C.; Cecelja, M.; Mangino, M.; Matey-Hernandez, M.L.; Keehn, L.; Mohney, R.P.; Steves, C.J.; Spector, T.D.; Kuo, C.F.; et al. Gut microbial diversity is associated with lower arterial stiffness in women. Eur. Heart J. 2018, 39, 2390–2397. [Google Scholar] [CrossRef] [Green Version]
  41. Boots, A.W.; Haenen, G.R.; Bast, A. Health effects of quercetin: From antioxidant to nutraceutical. Eur. J. Pharmacol. 2008, 585, 325–337. [Google Scholar] [CrossRef] [PubMed]
  42. He, Z.; Shao, T.; Li, H.; Xie, Z.; Wen, C. Alterations of the gut microbiome in Chinese patients with systemic lupus erythematosus. Gut Pathog. 2016, 8, 64. [Google Scholar] [CrossRef] [PubMed] [Green Version]
  43. Huang, S.; Mao, J.; Zhou, L.; Xiong, X.; Deng, Y. The imbalance of gut microbiota and its correlation with plasma inflammatory cytokines in pemphigus vulgaris patients. Scand. J. Immunol. 2019, 90, e12799. [Google Scholar] [CrossRef] [PubMed] [Green Version]
  44. Van Buren, P.N.; Lewis, J.B.; Dwyer, J.P.; Greene, T.; Middleton, J.; Sika, M.; Umanath, K.; Abraham, J.D.; Arfeen, S.S.; Bowline, I.G.; et al. The Phosphate Binder Ferric Citrate and Mineral Metabolism and Inflammatory Markers in Maintenance Dialysis Patients: Results From Prespecified Analyses of a Randomized Clinical Trial. Am. J. Kidney Dis. 2015, 66, 479–488. [Google Scholar] [CrossRef] [PubMed] [Green Version]
  45. Clase, C.M.; Ki, V.; Holden, R.M. Water-soluble vitamins in people with low glomerular filtration rate or on dialysis: A review. Semin. Dial. 2013, 26, 546–567. [Google Scholar] [CrossRef] [Green Version]
  46. Kosmadakis, G.; Da Costa Correia, E.; Carceles, O.; Somda, F.; Aguilera, D. Vitamins in dialysis: Who, when and how much? Ren. Fail. 2014, 36, 638–650. [Google Scholar] [CrossRef]
  47. Gorelova, V.; Bastien, O.; De Clerck, O.; Lespinats, S.; Rebeille, F.; Van Der Straeten, D. Evolution of folate biosynthesis and metabolism across algae and land plant lineages. Sci. Rep. 2019, 9, 5731. [Google Scholar] [CrossRef] [Green Version]
  48. Yurimoto, H.; Kato, N.; Sakai, Y. Assimilation, dissimilation, and detoxification of formaldehyde, a central metabolic intermediate of methylotrophic metabolism. Chem. Rec. 2005, 5, 367–375. [Google Scholar] [CrossRef]
  49. Hanson, R.S.; Hanson, T.E. Methanotrophic bacteria. Microbiol. Rev. 1996, 60, 439–471. [Google Scholar] [CrossRef]
  50. Molinero, N.; Ruiz, L.; Sanchez, B.; Margolles, A.; Delgado, S. Intestinal Bacteria Interplay With Bile and Cholesterol Metabolism: Implications on Host Physiology. Front. Physiol. 2019, 10, 185. [Google Scholar] [CrossRef] [Green Version]
  51. Kriaa, A.; Bourgin, M.; Potiron, A.; Mkaouar, H.; Jablaoui, A.; Gerard, P.; Maguin, E.; Rhimi, M. Microbial impact on cholesterol and bile acid metabolism: Current status and future prospects. J. Lipid Res. 2019, 60, 323–332. [Google Scholar] [CrossRef] [PubMed] [Green Version]
  52. Zhou, J.; Kelly, W.L.; Bachmann, B.O.; Gunsior, M.; Townsend, C.A.; Solomon, E.I. Spectroscopic studies of substrate interactions with clavaminate synthase 2, a multifunctional alpha-KG-dependent non-heme iron enzyme: Correlation with mechanisms and reactivities. J. Am. Chem. Soc. 2001, 123, 7388–7398. [Google Scholar] [CrossRef] [PubMed]
  53. Iguchi, A.; Yamamoto, S.; Oda, A.; Tanaka, K.; Kazama, J.J.; Saeki, T.; Yamazaki, H.; Ishioka, K.; Suzutani, T.; Narita, I. Effect of sucroferric oxyhydroxide on gastrointestinal microbiome and uremic toxins in patients with chronic kidney disease undergoing hemodialysis. Clin. Exp. Nephrol. 2020, 24, 725–733. [Google Scholar] [CrossRef] [PubMed]
  54. Bennis, Y.; Cluet, Y.; Titeca-Beauport, D.; El Esper, N.; Urena, P.; Bodeau, S.; Combe, C.; Dussol, B.; Fouque, D.; Choukroun, G.; et al. The Effect of Sevelamer on Serum Levels of Gut-Derived Uremic Toxins: Results from In Vitro Experiments and A Multicenter, Double-Blind, Placebo-Controlled, Randomized Clinical Trial. Toxins 2019, 11, 279. [Google Scholar] [CrossRef] [PubMed] [Green Version]
Figure 1. Hemodialysis patients with calcium carbonate phosphate binders had lower α diversity (Shannon index and Simpson index), higher microbial dysbiosis index (A), and different β diversity (Bray-Curtis distance metrics) (B) compared to the ferric citrate phosphate binders used.
Microorganisms 08 02040 g001
Figure 2. Linear discriminant analysis Effect Size (LEfSe) showing microbiome differences between ferric citrate and calcium carbonate phosphate binder users at various taxonomic levels. (A) Cladogram demonstrating microbiome differences at various phylogenic levels, (B) LEfSe analysis with linear discriminant analysis (LDA) score representing statistical and biological differences in taxa between groups. Green indicates taxa enriched in a ferric citrate group and red indicates taxa enriched in a calcium carbonate phosphate binder group.
Microorganisms 08 02040 g002
Figure 3. Heat tree depicting the effects of phosphate binder treatment on the intestinal microbiomes of hemodialysis patients. In comparison between ferric citrate and calcium carbonate phosphate binder, members of the class Bacilli were prominent in calcium-containing phosphate binder, whereas taxa of the genus Ruminococcaceae UCG-004, Flavonifractor, and Cronobacter were enriched in ferric citrate phosphate binder users. The heat tree was generated using Metacoder.
Microorganisms 08 02040 g003
Figure 4. The distribution of top eight genera abundance difference between hemodialysis patients with ferric citrate or calcium carbonate phosphate binders treatment.
Microorganisms 08 02040 g004
Table 1. Baseline characteristics of hemodialysis patients with different phosphate binders used.
Baseline CharacteristicsFerric Citrate Phosphate Binder (n = 8)Calcium Carbonate Phosphate Binder (n = 46)p-value
Age (years)55.8 ± 11.861.5 ± 10.90.178
Male5 (62.5%)25 (54.3%)0.668
Dialysis vintage (months)91.5 ± 80.4584.11 ± 69.530.787
Arteriovenous fistula7 (87.5%)44 (95.7%)0.353
Cause of ESRD
 Hypertension0 (0.0%)10 (21.7%)0.144
 Diabetes mellitus3 (37.5%)12 (26.1%)0.506
 Glomerulonephritis1 (12.5%)14 (30.4%)0.296
 Others *4 (50.0%)10 (21.7%)0.092
Comorbidities
 Diabetes mellitus3 (37.5%)15 (32.6%)0.786
 Hypertension7 (87.5%)38 (82.6%)0.732
 Dyslipidemia2 (25.0%)14 (30.4%)0.756
 Coronary artery disease1 (12.5%)3 (6.5%)0.551
 Cerebrovascular disease1 (12.5%)10 (21.7%)0.549
 Parathyroidectomy2 (25.0%)8 (17.4%)0.609
Medications
 Antiplatelet3 (37.5%)13 (28.3%)0.597
 Antihypertensive drugs5 (62.5%)25 (54.3%)0.668
 Diabetes treatment medications1 (12.5%)13 (28.3%)0.348
Clinical laboratory data
 Hemoglobin (g/dL)10.83 ± 1.3810.89 ± 0.990.870
 Albumin (g/dl)3.87 ± 0.383.92 ± 0.340.672
 Alkaline phosphatase (IU/L)66.96 ± 15.3576.25 ± 26.980.350
 Ion calcium (mg/dL)61.5 ± 10.9471.06 ± 28.640.359
 Phosphate (mg/dL)5.13 ± 0.756.88 ± 8.680.575
 Parathyroid hormone (pg/mL)403.15 ± 206.76283.16 ± 277.950.250
 Aluminum (ng/mL)13.25 ± 5.4413.28 ± 6.470.991
 Magnesium (mg/dL)2.66 ± 0.428.44 ± 21.540.455
 Single pool Kt/V1.44 ± 0.151.53 ± 0.240.298
Dietary intake (serving/day)
 Meat0.7 ± 0.380.8 ± 0.540.760
 Vegetable1.3 ± 0.521.3 ± 0.600.852
 Fruit0.9 ± 0.621.1 ± 0.890.903
Bristol stool scale4.5 ± 1.603.74 ± 1.820.273
* Other causes of end-stage renal disease include polycystic kidney disease, tumor, systemic lupus erythematosus, gout, and interstitial nephritis. Abbreviation: ESRD, end-stage renal disease.
Publisher’s Note: MDPI stays neutral with regard to jurisdictional claims in published maps and institutional affiliations.

