Gene Expression Profile of Mexican Lime (Citrus aurantifolia) Trees in Response to Huanglongbing Disease caused by Candidatus Liberibacter asiaticus

 , , and
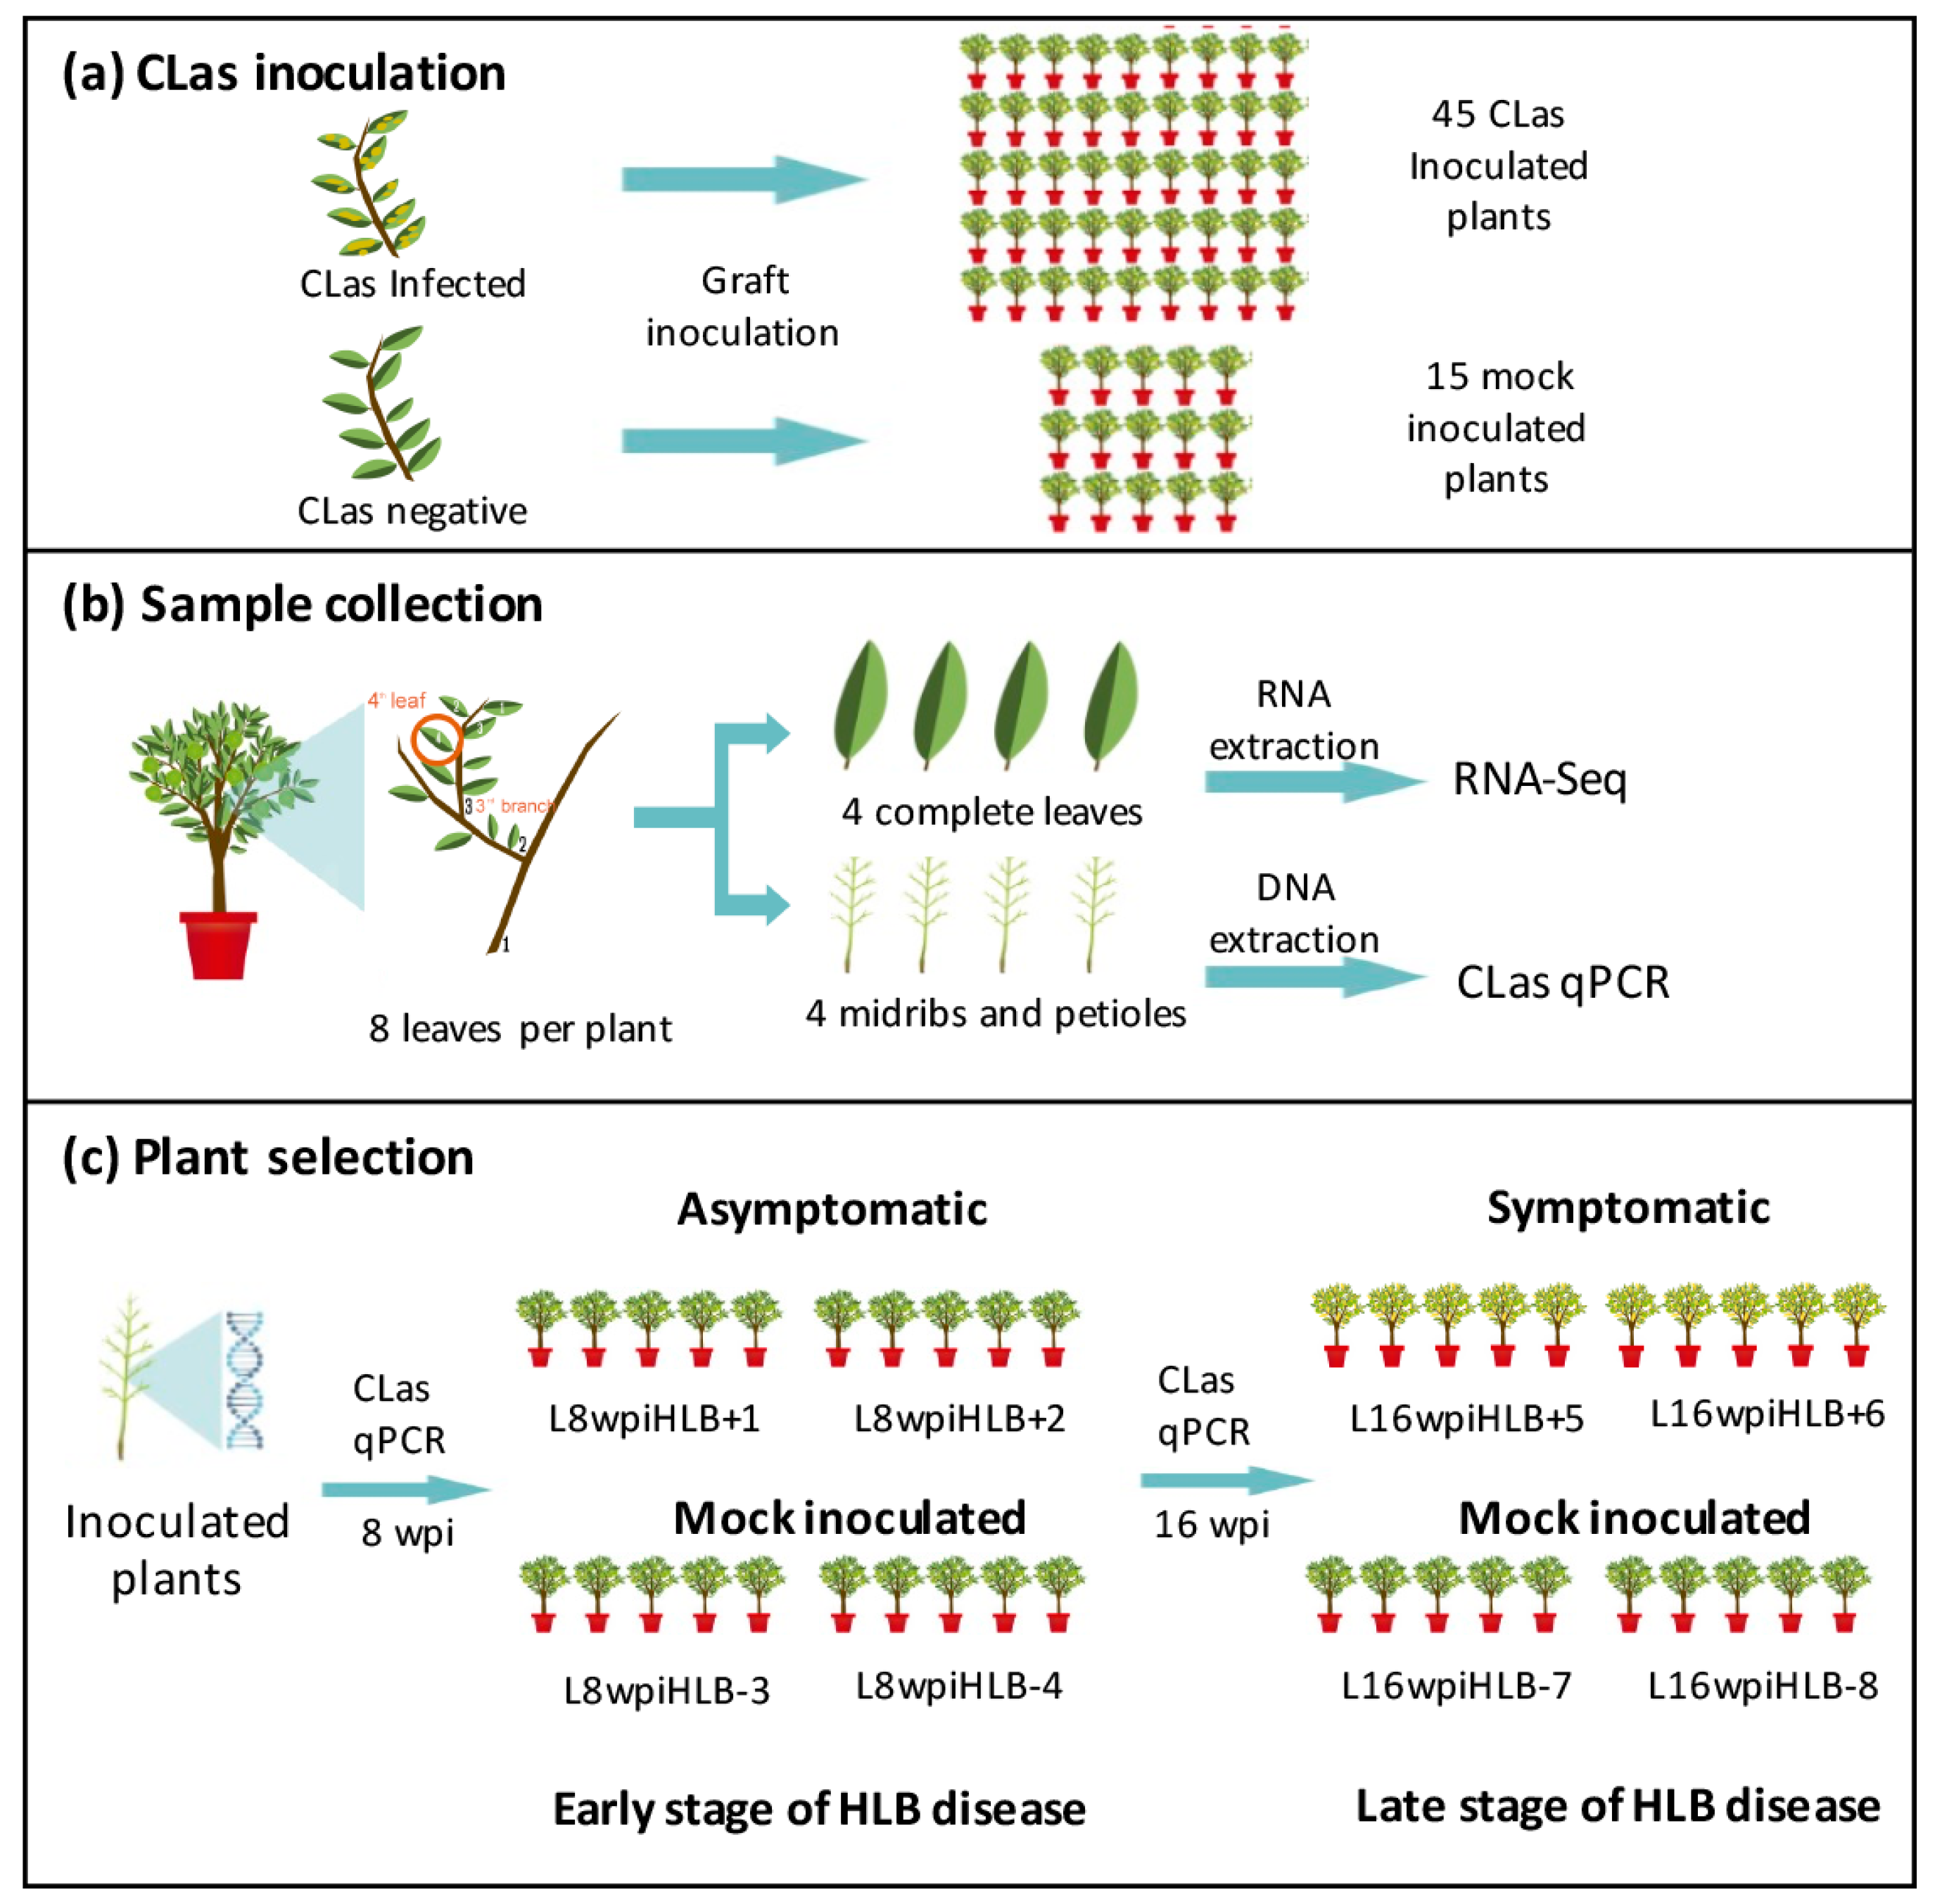
Abstract
:1. Introduction
2. Materials and Methods
2.1. Plant Material and Experimental Design
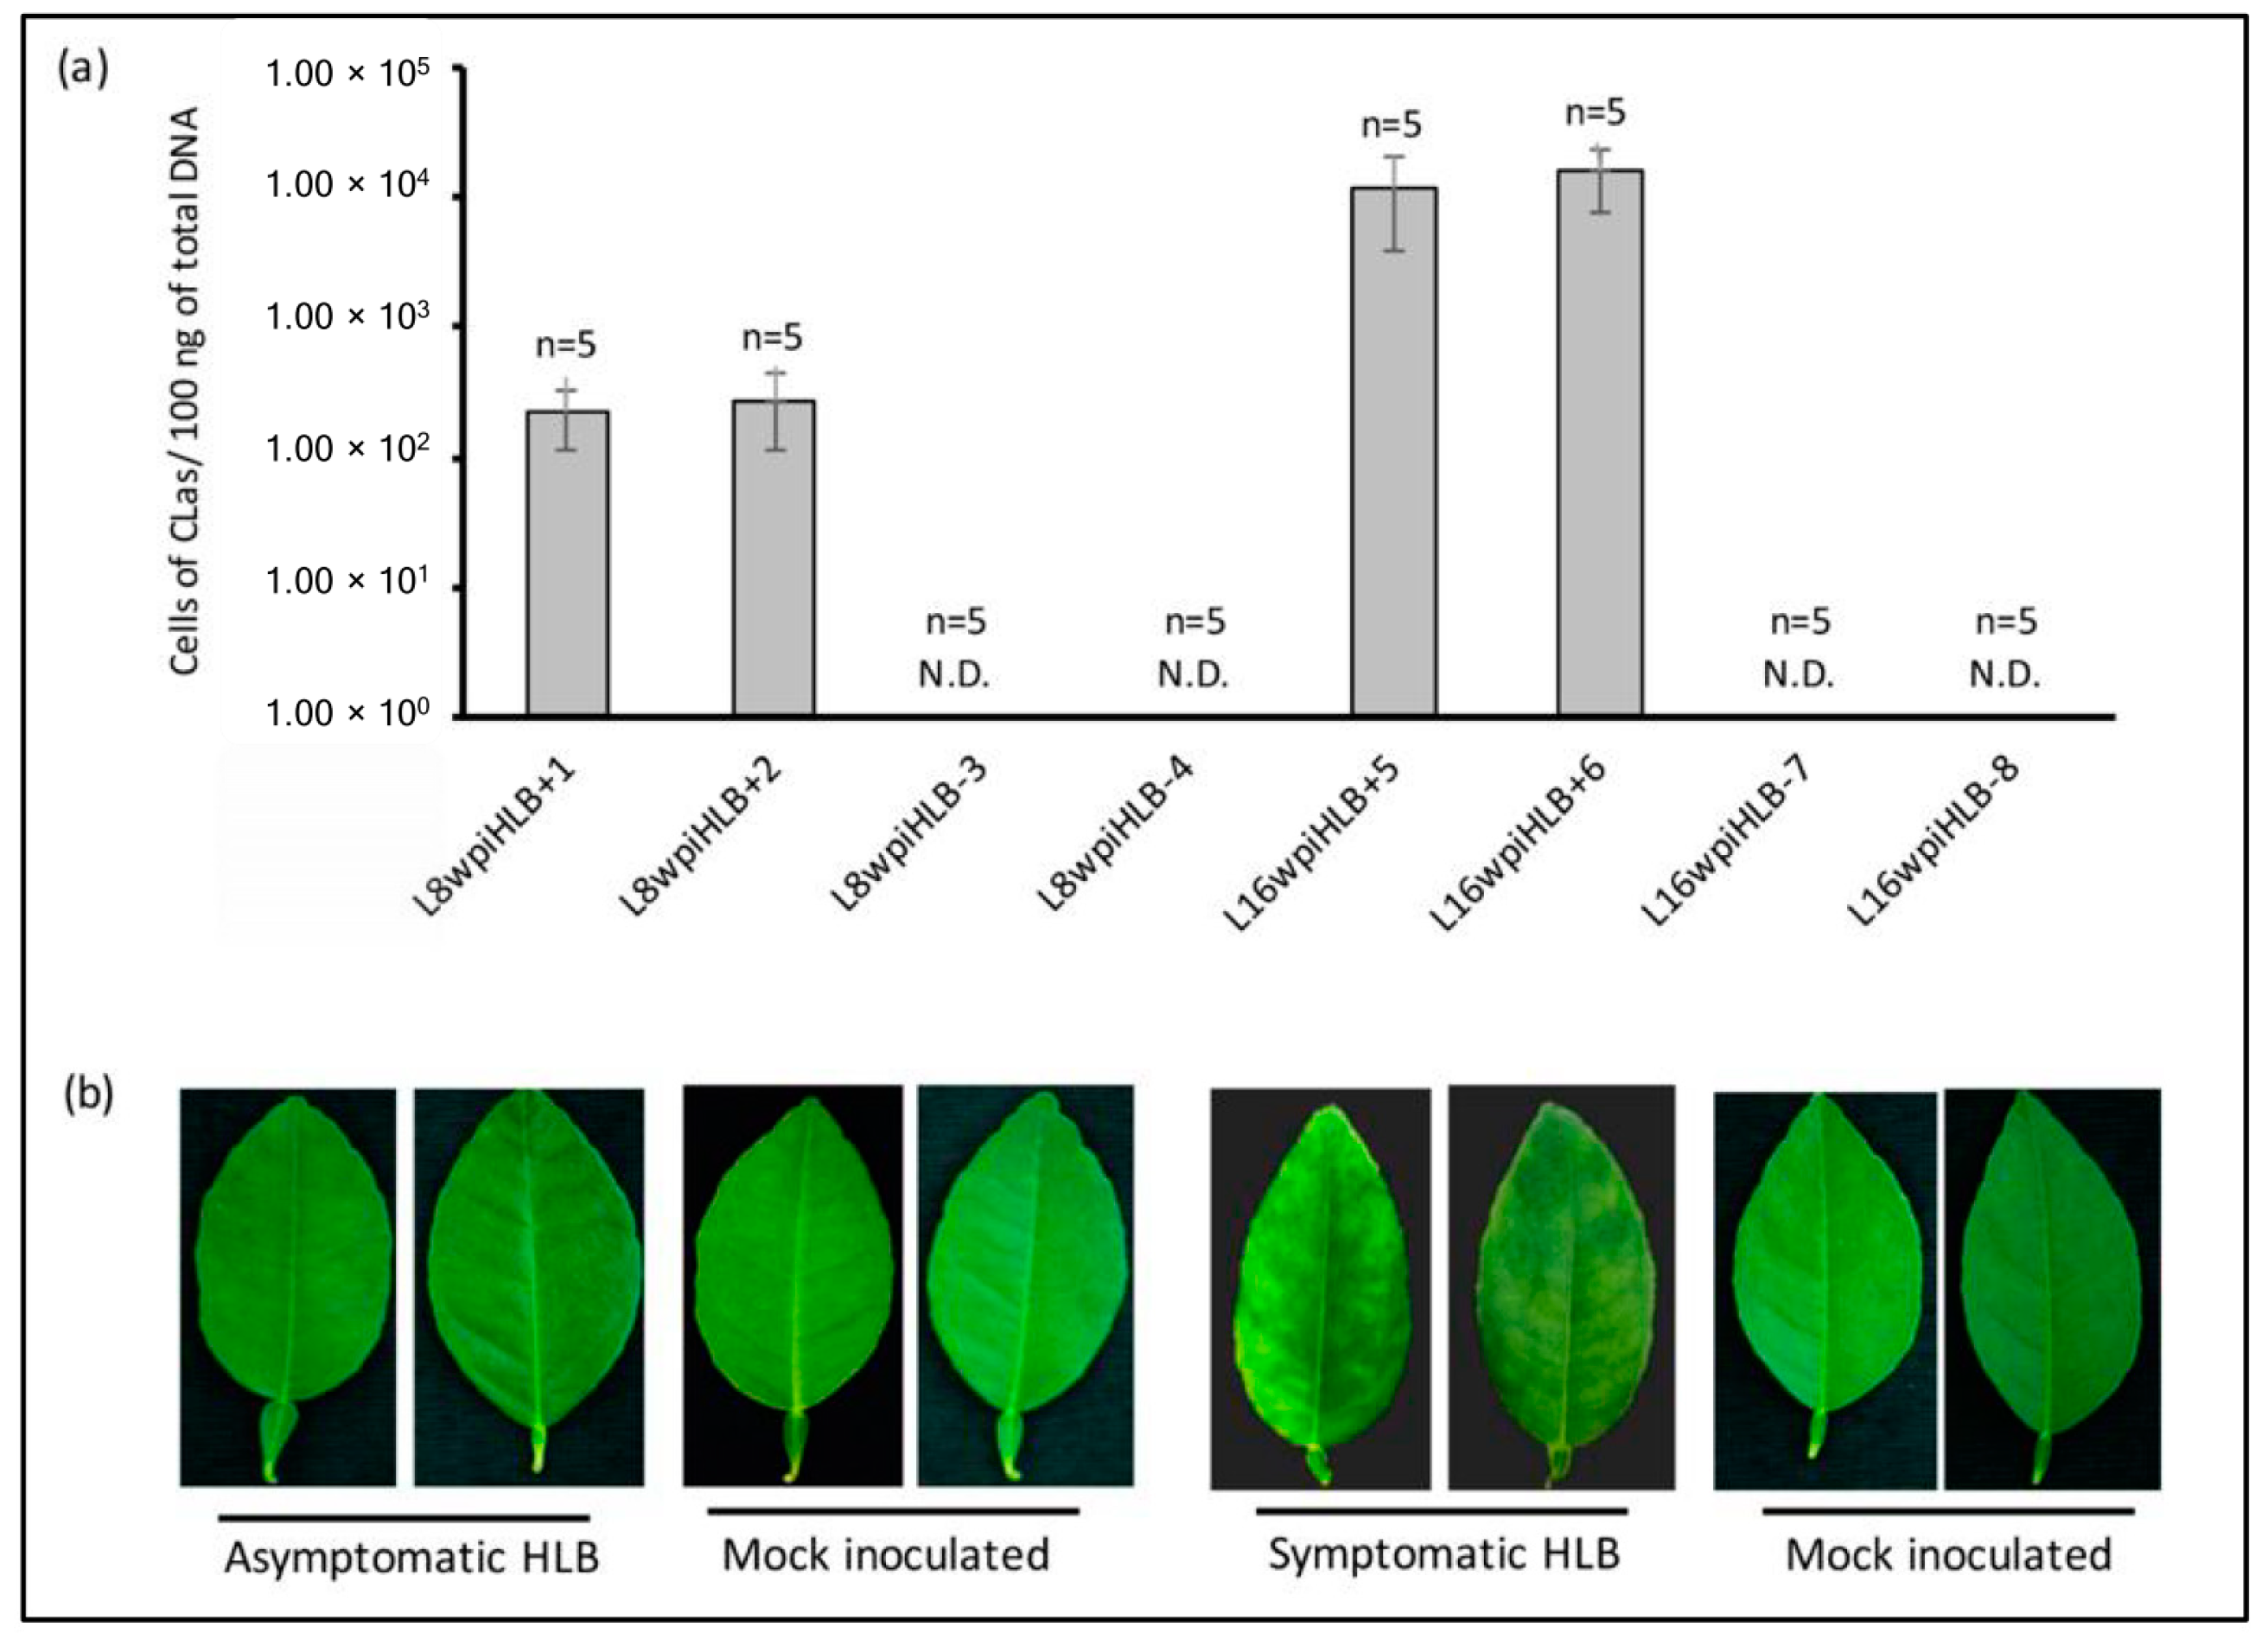
2.2. Determination of CLas Titer by Quantitative PCR (qCPR)
2.3. RNA Isolation and Sequencing
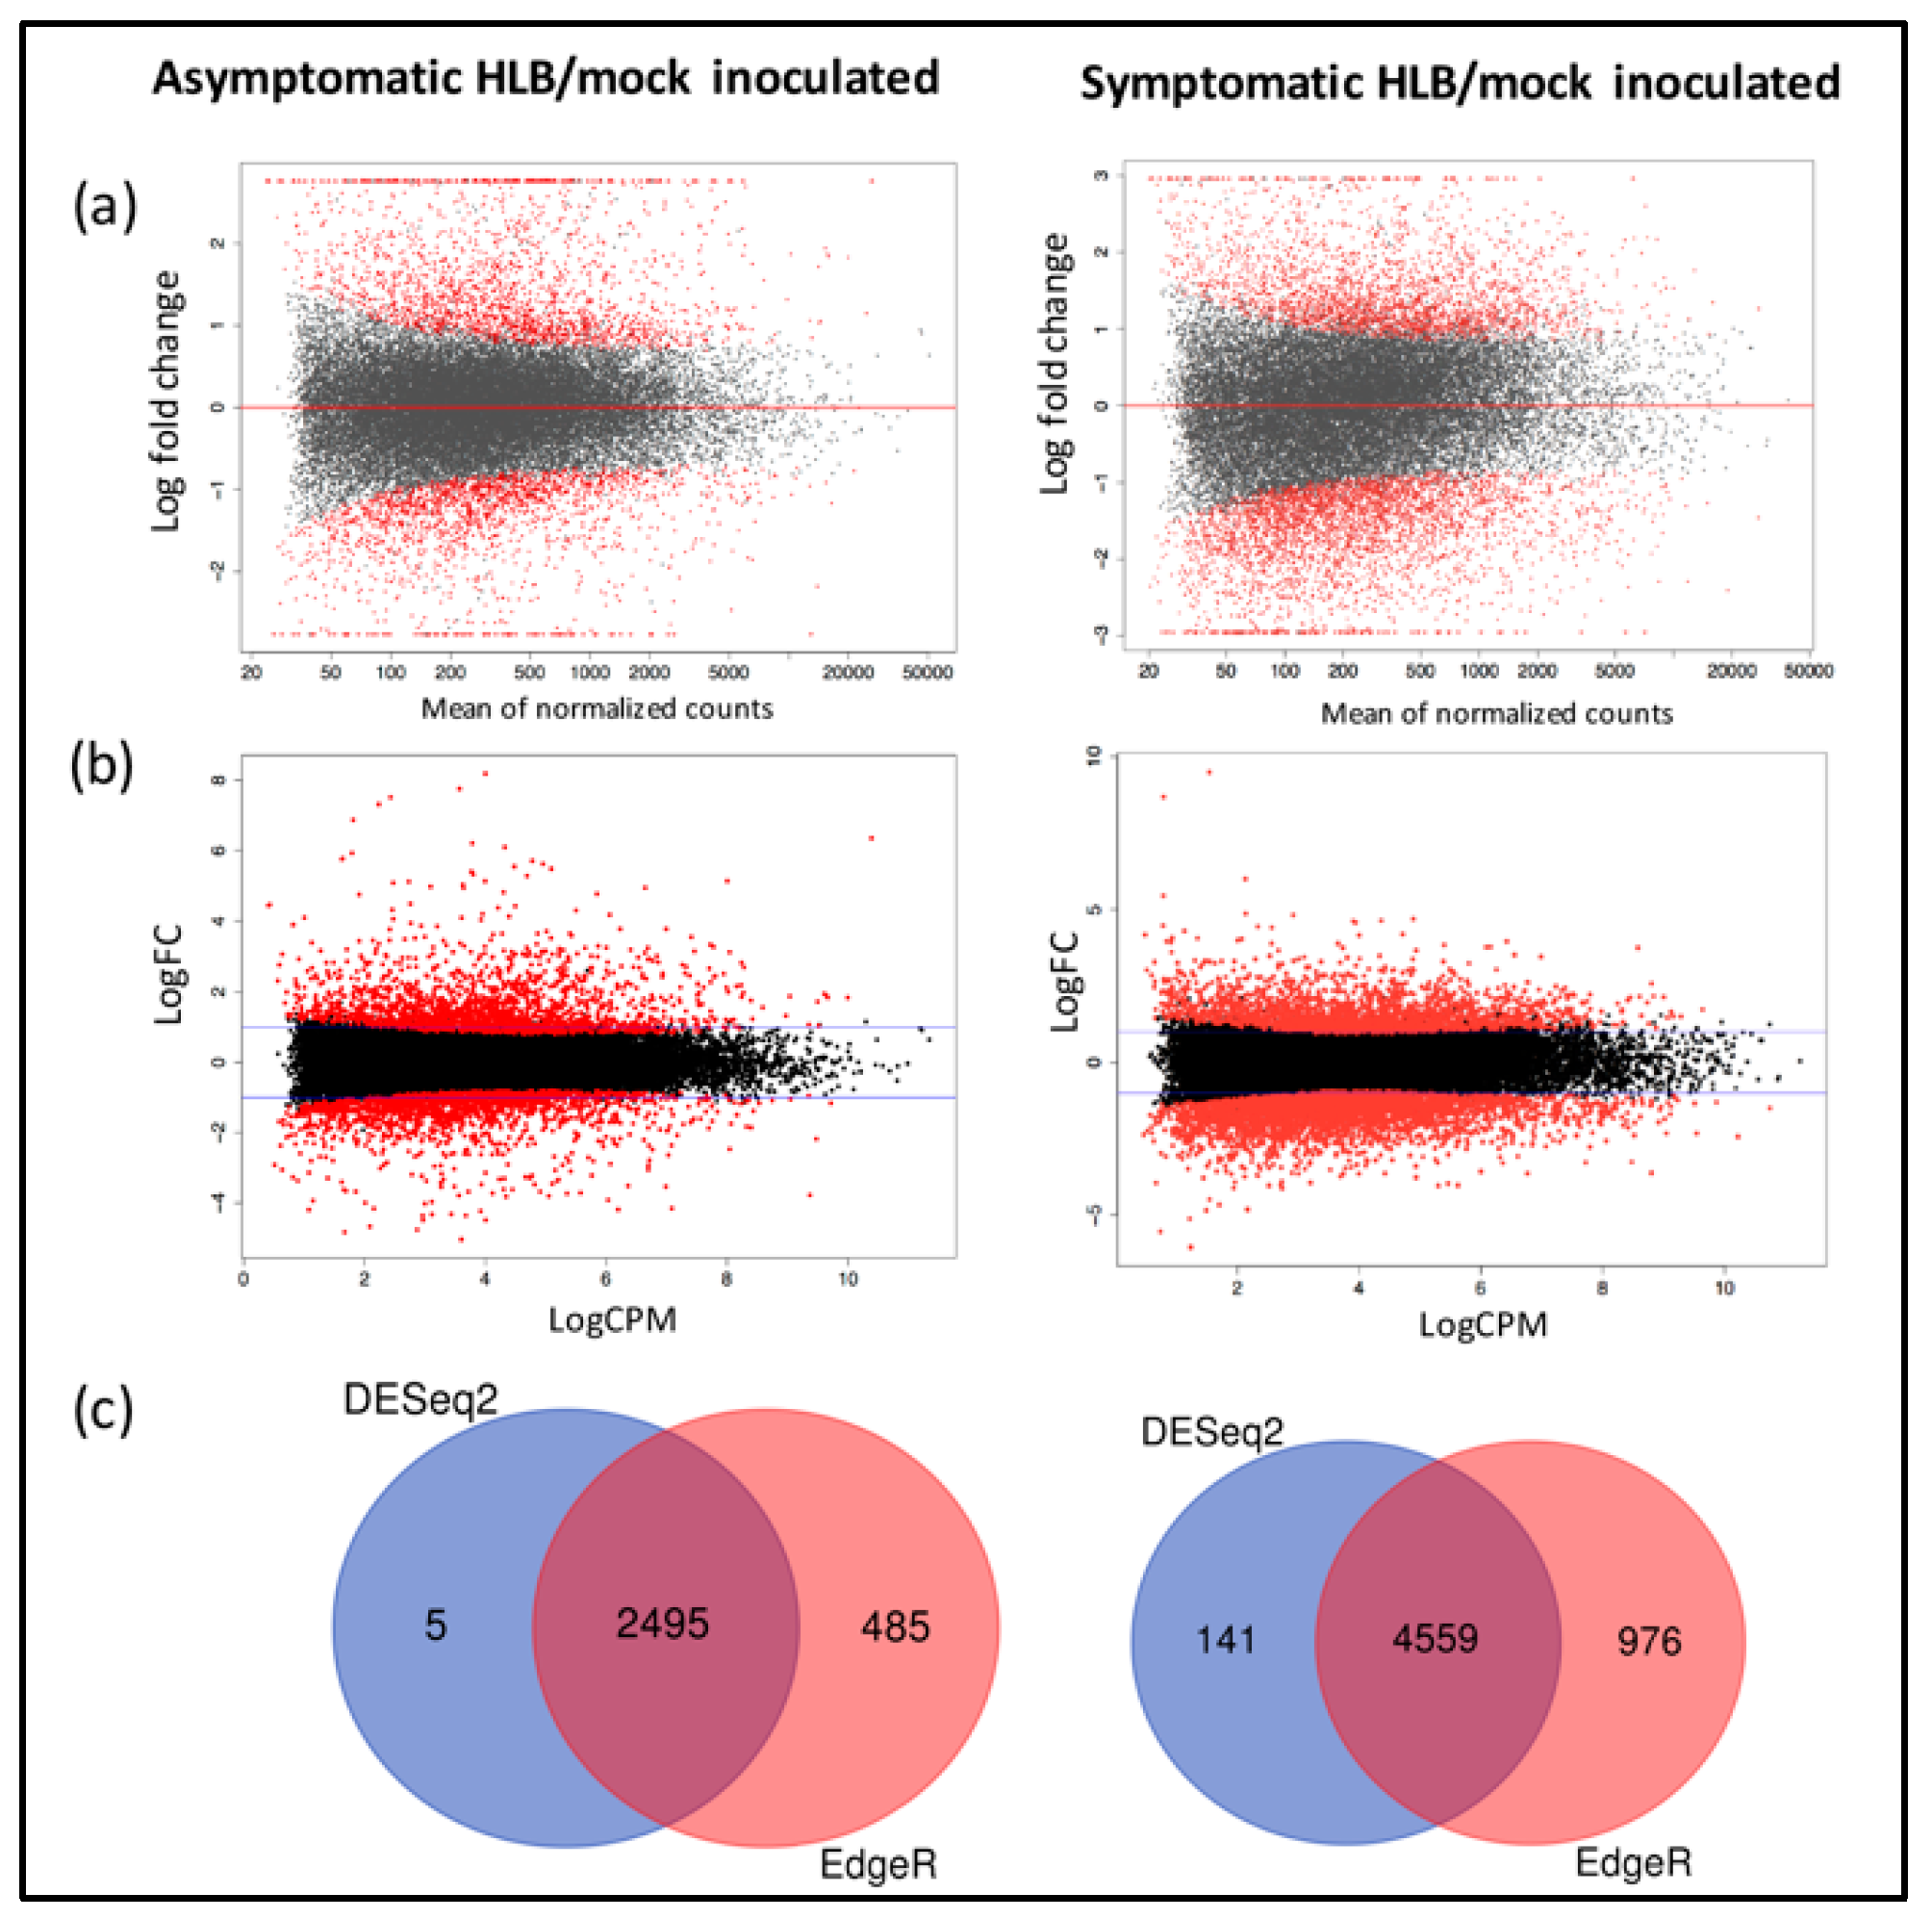
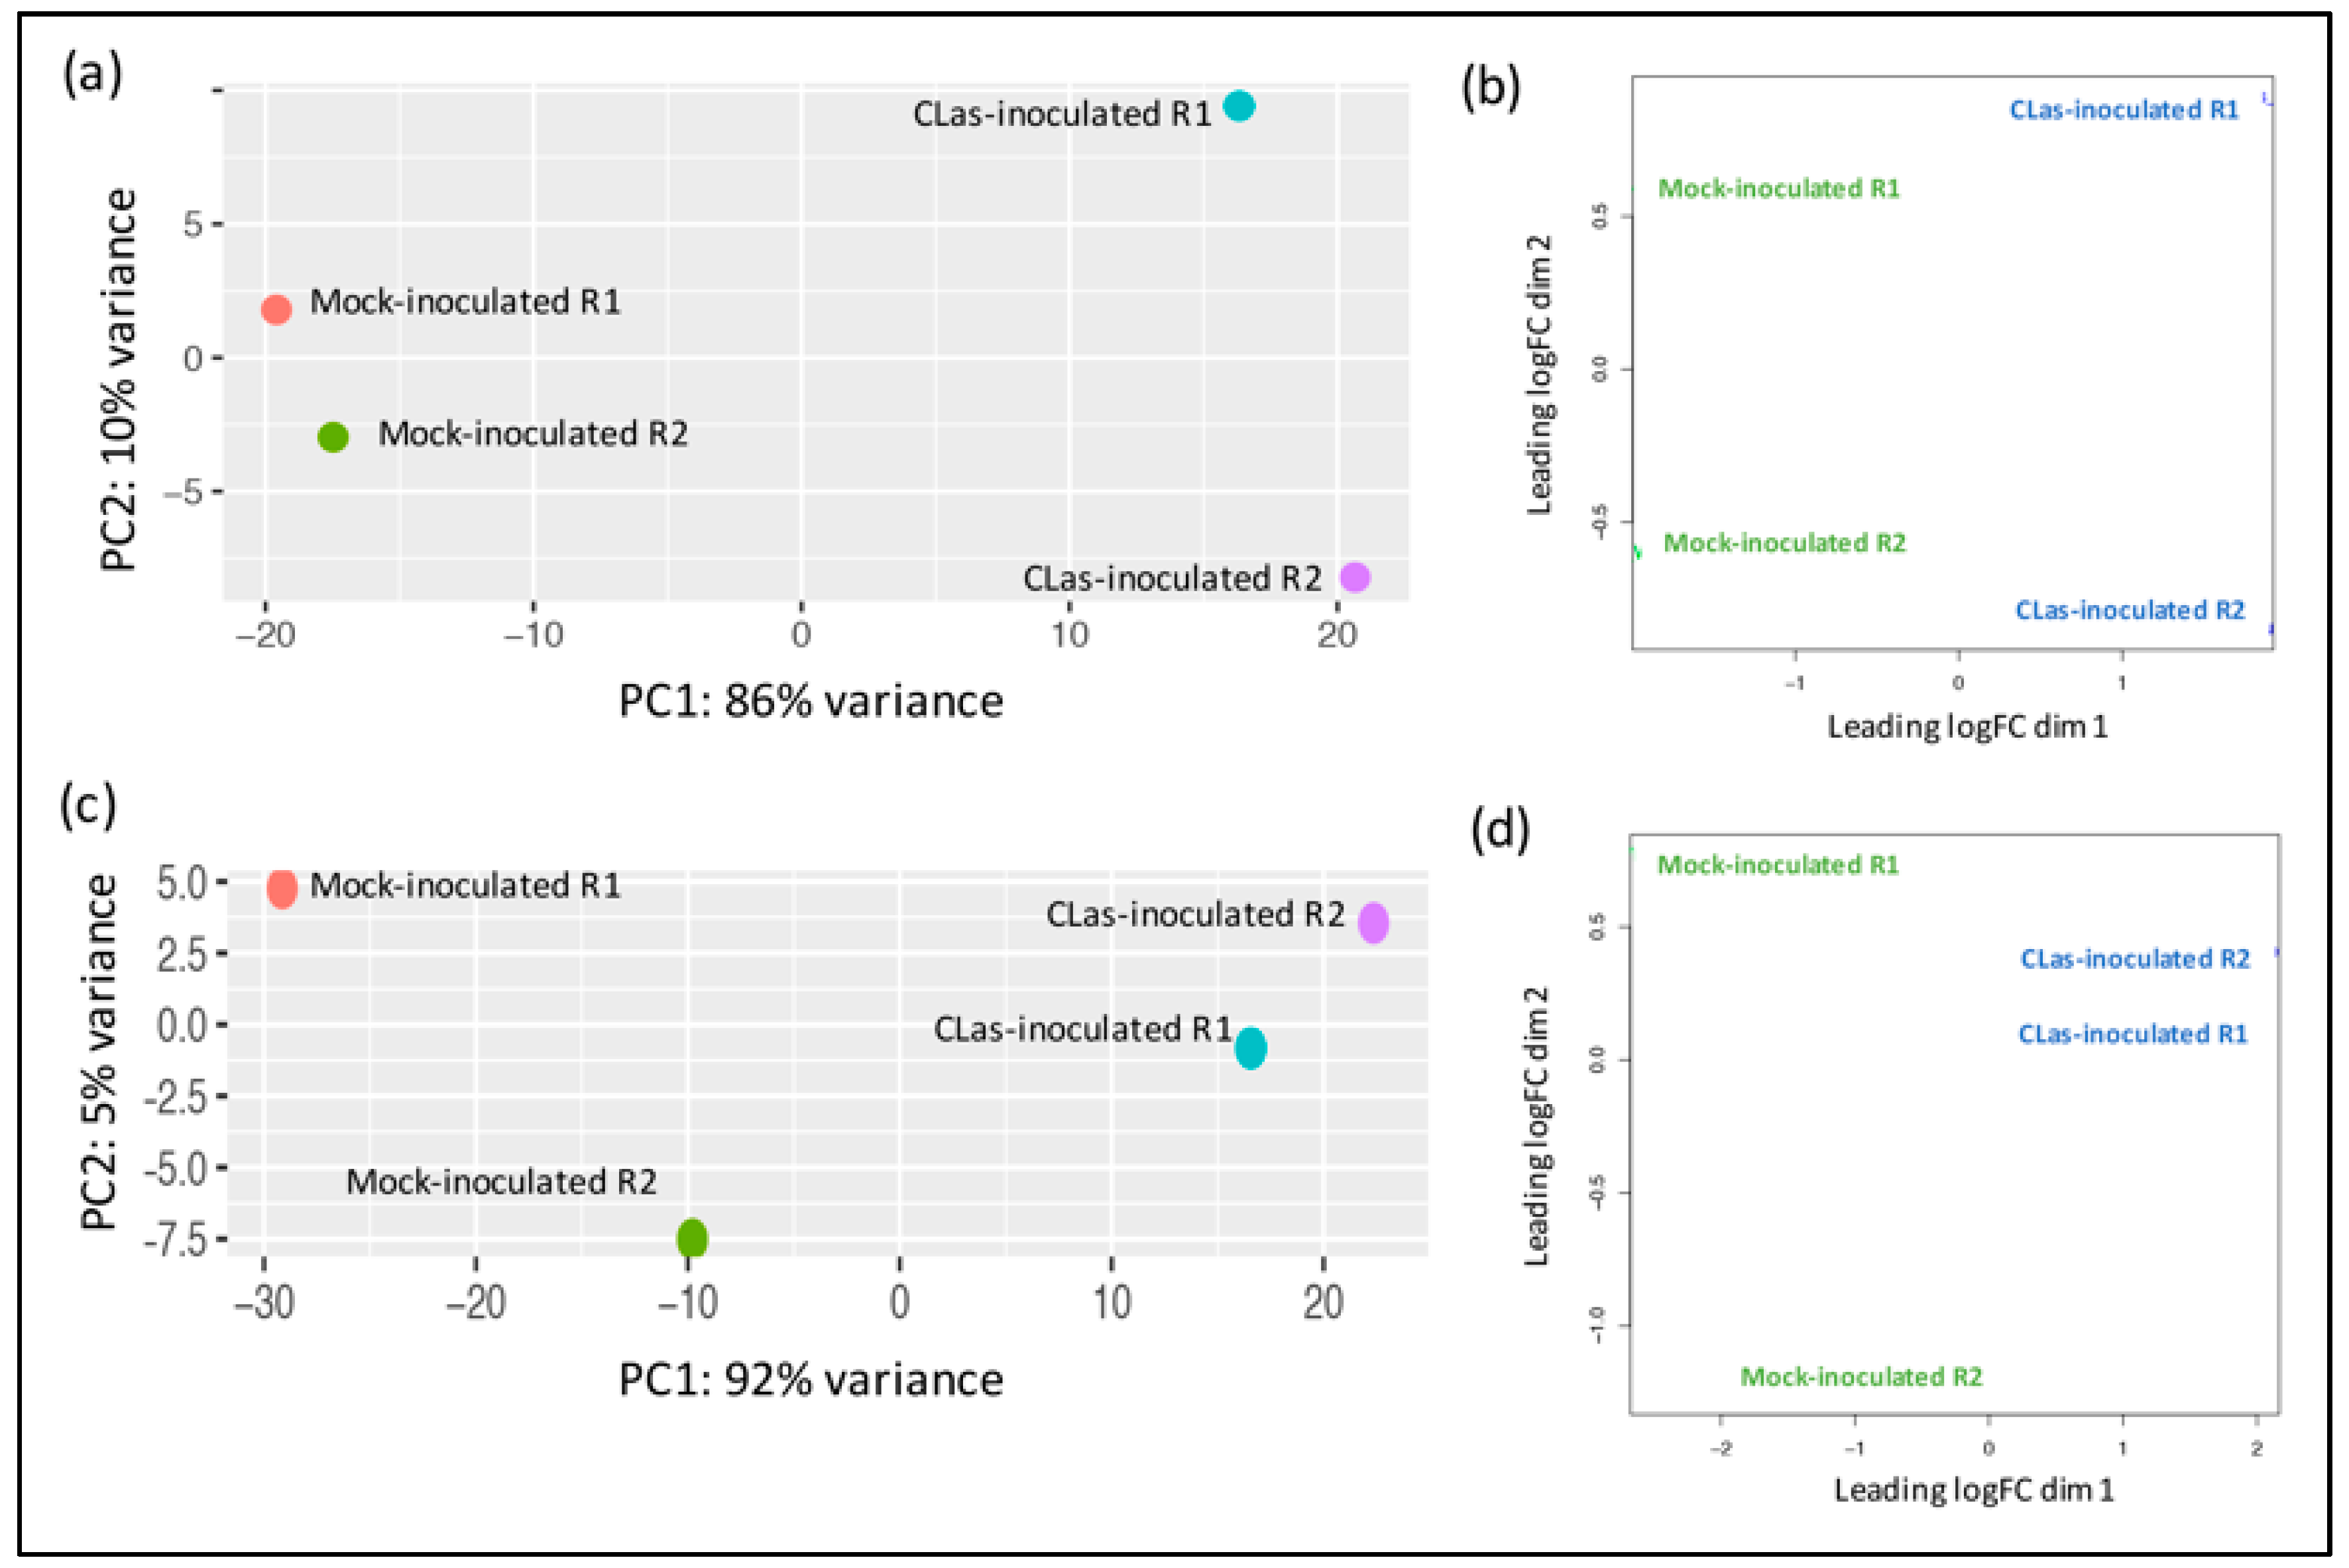
2.4. Differential Expression Analysis
2.5. Gene Expression Validation
3. Results
3.1. Selection of Samples for RNA-seq Analysis
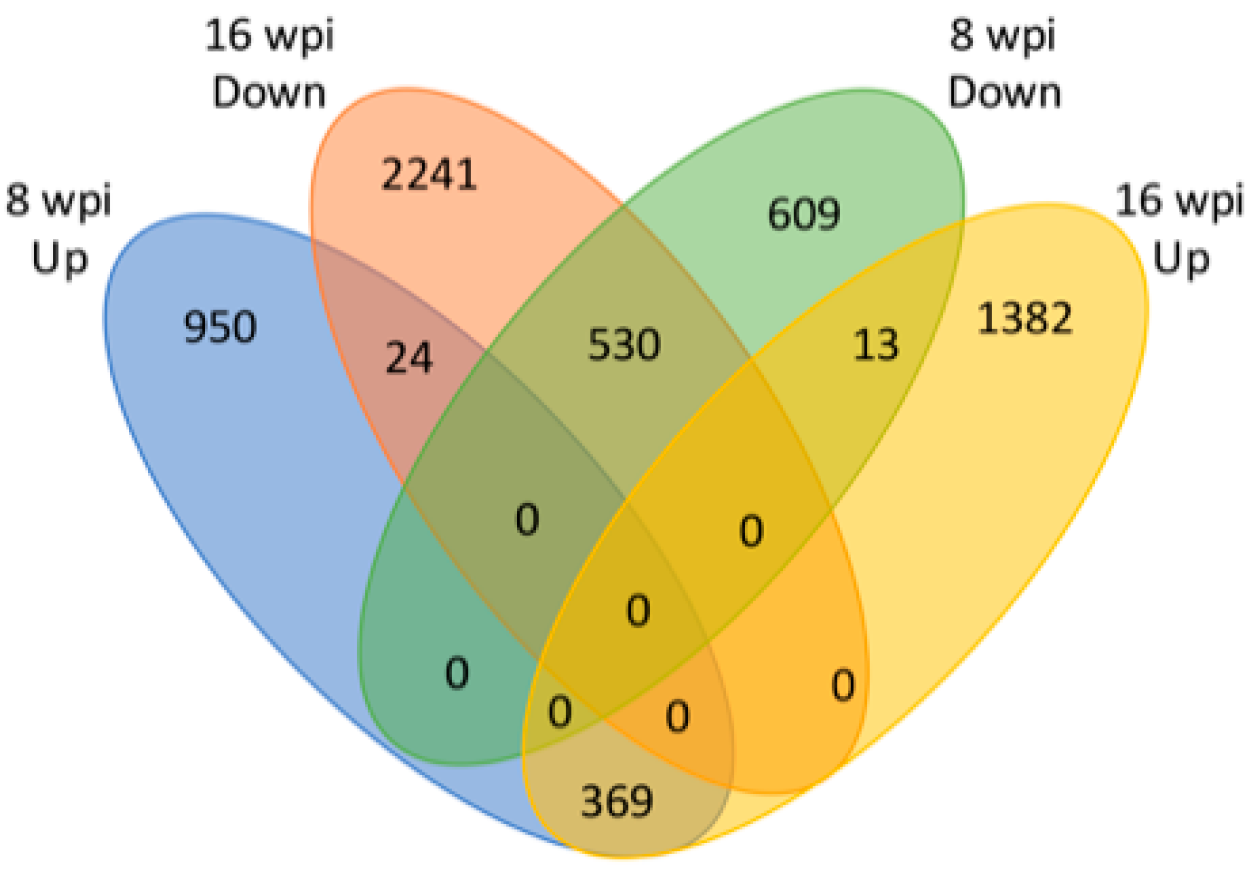
3.2. Identification of Differentially Expressed Genes
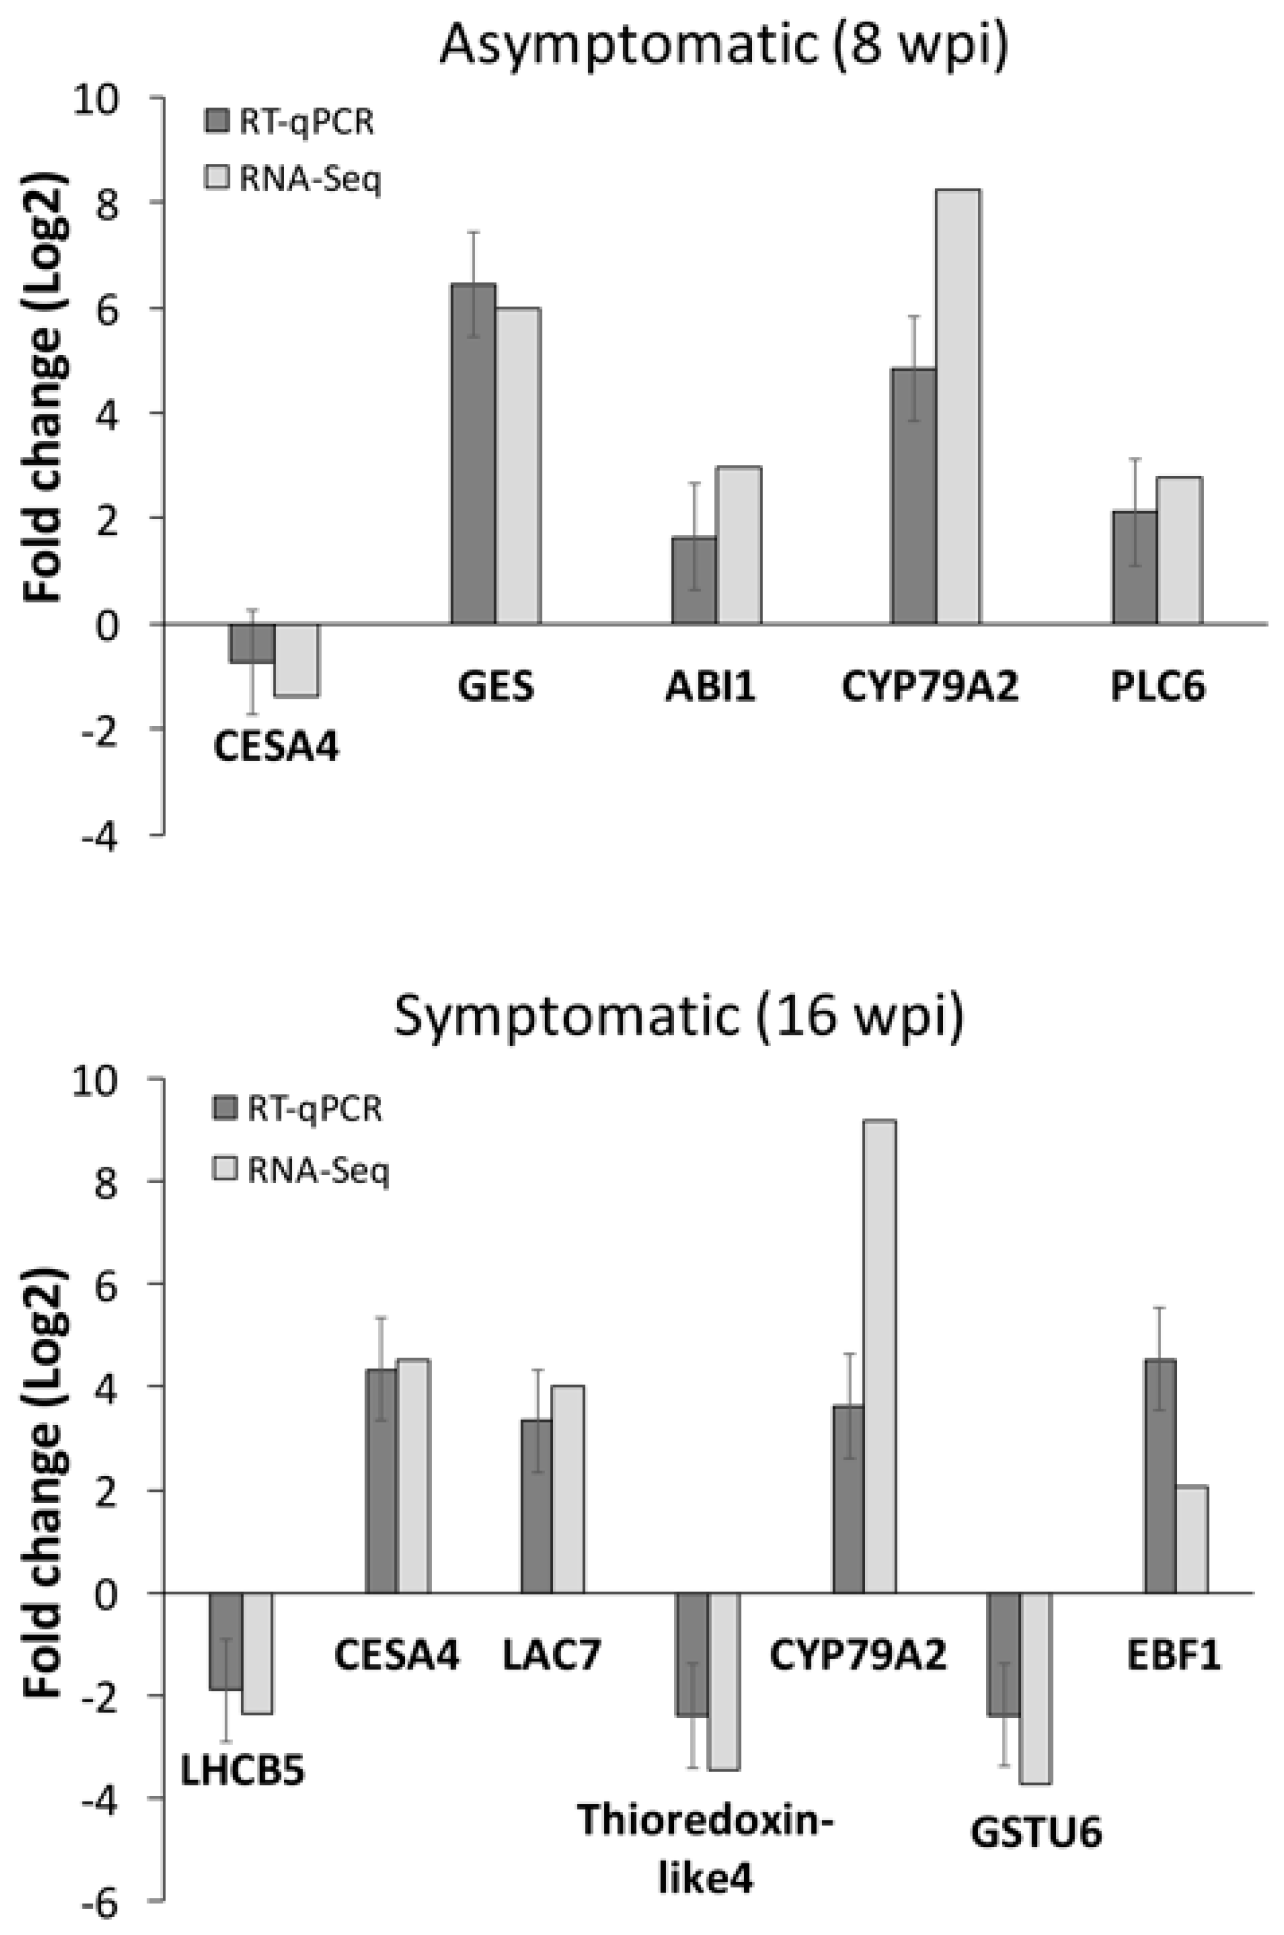
3.3. RNA-seq Data Validation by RT-qPCR
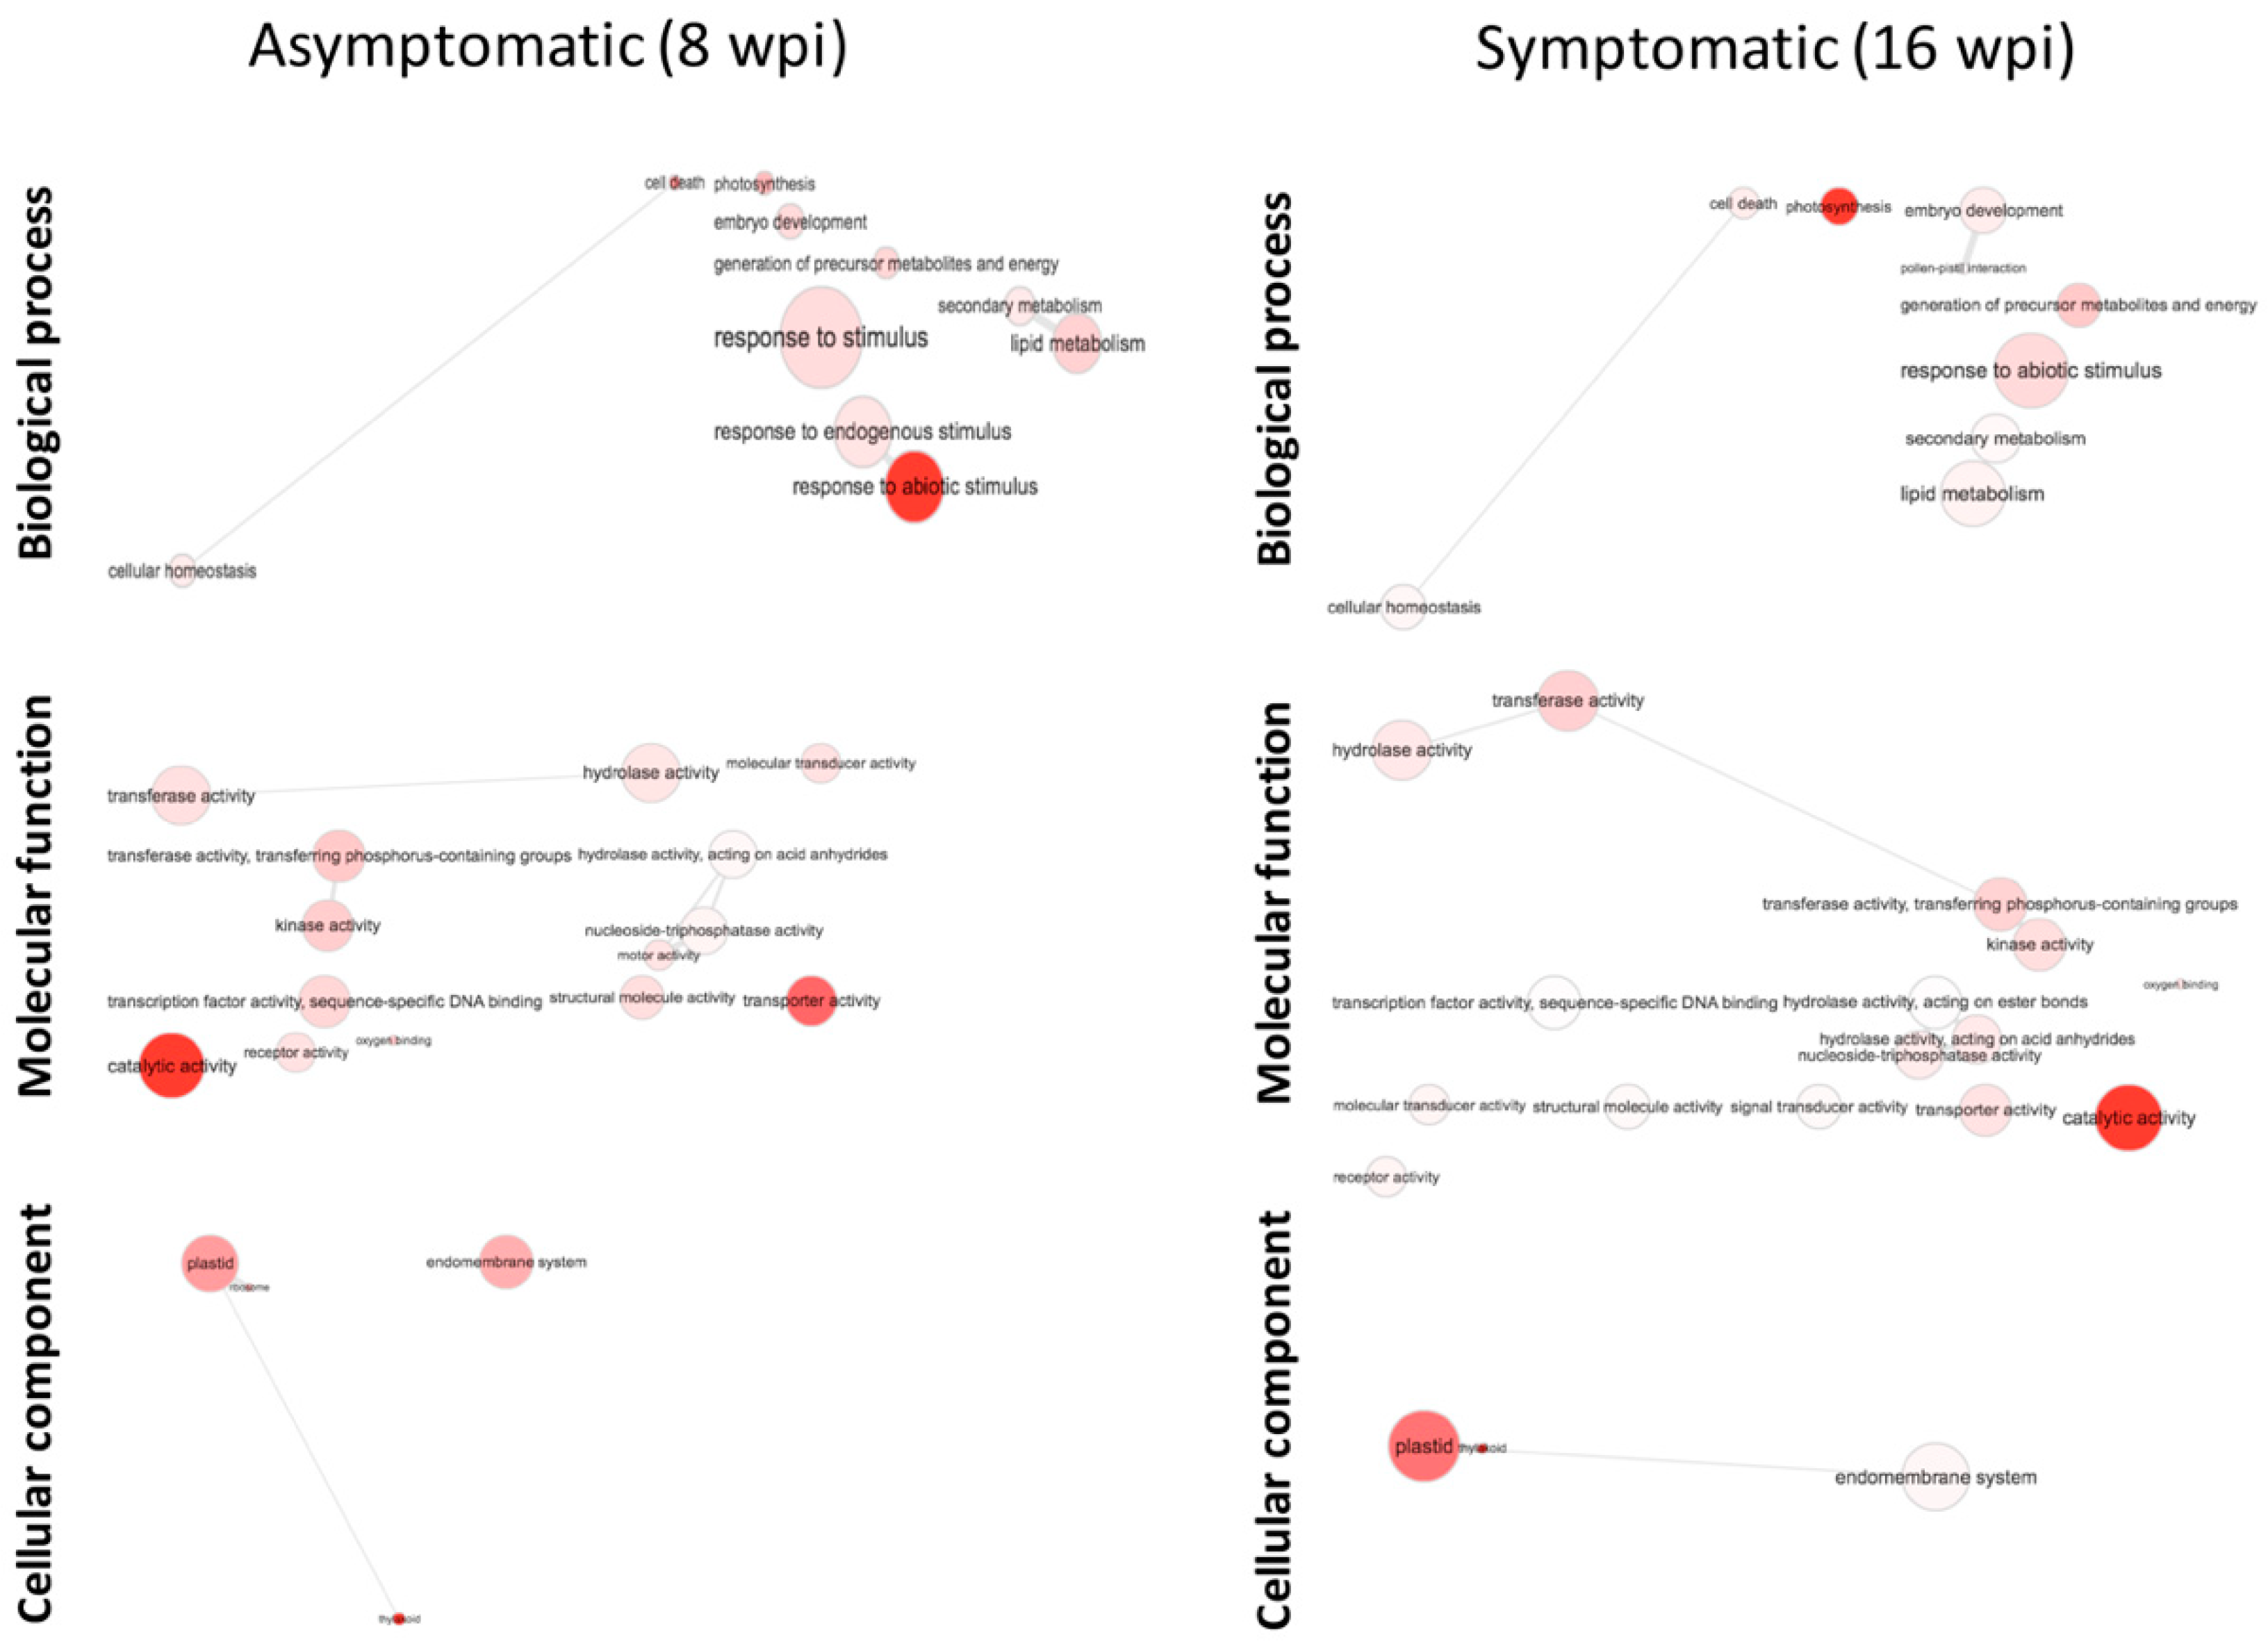
3.4. Functional Classification of DEGs
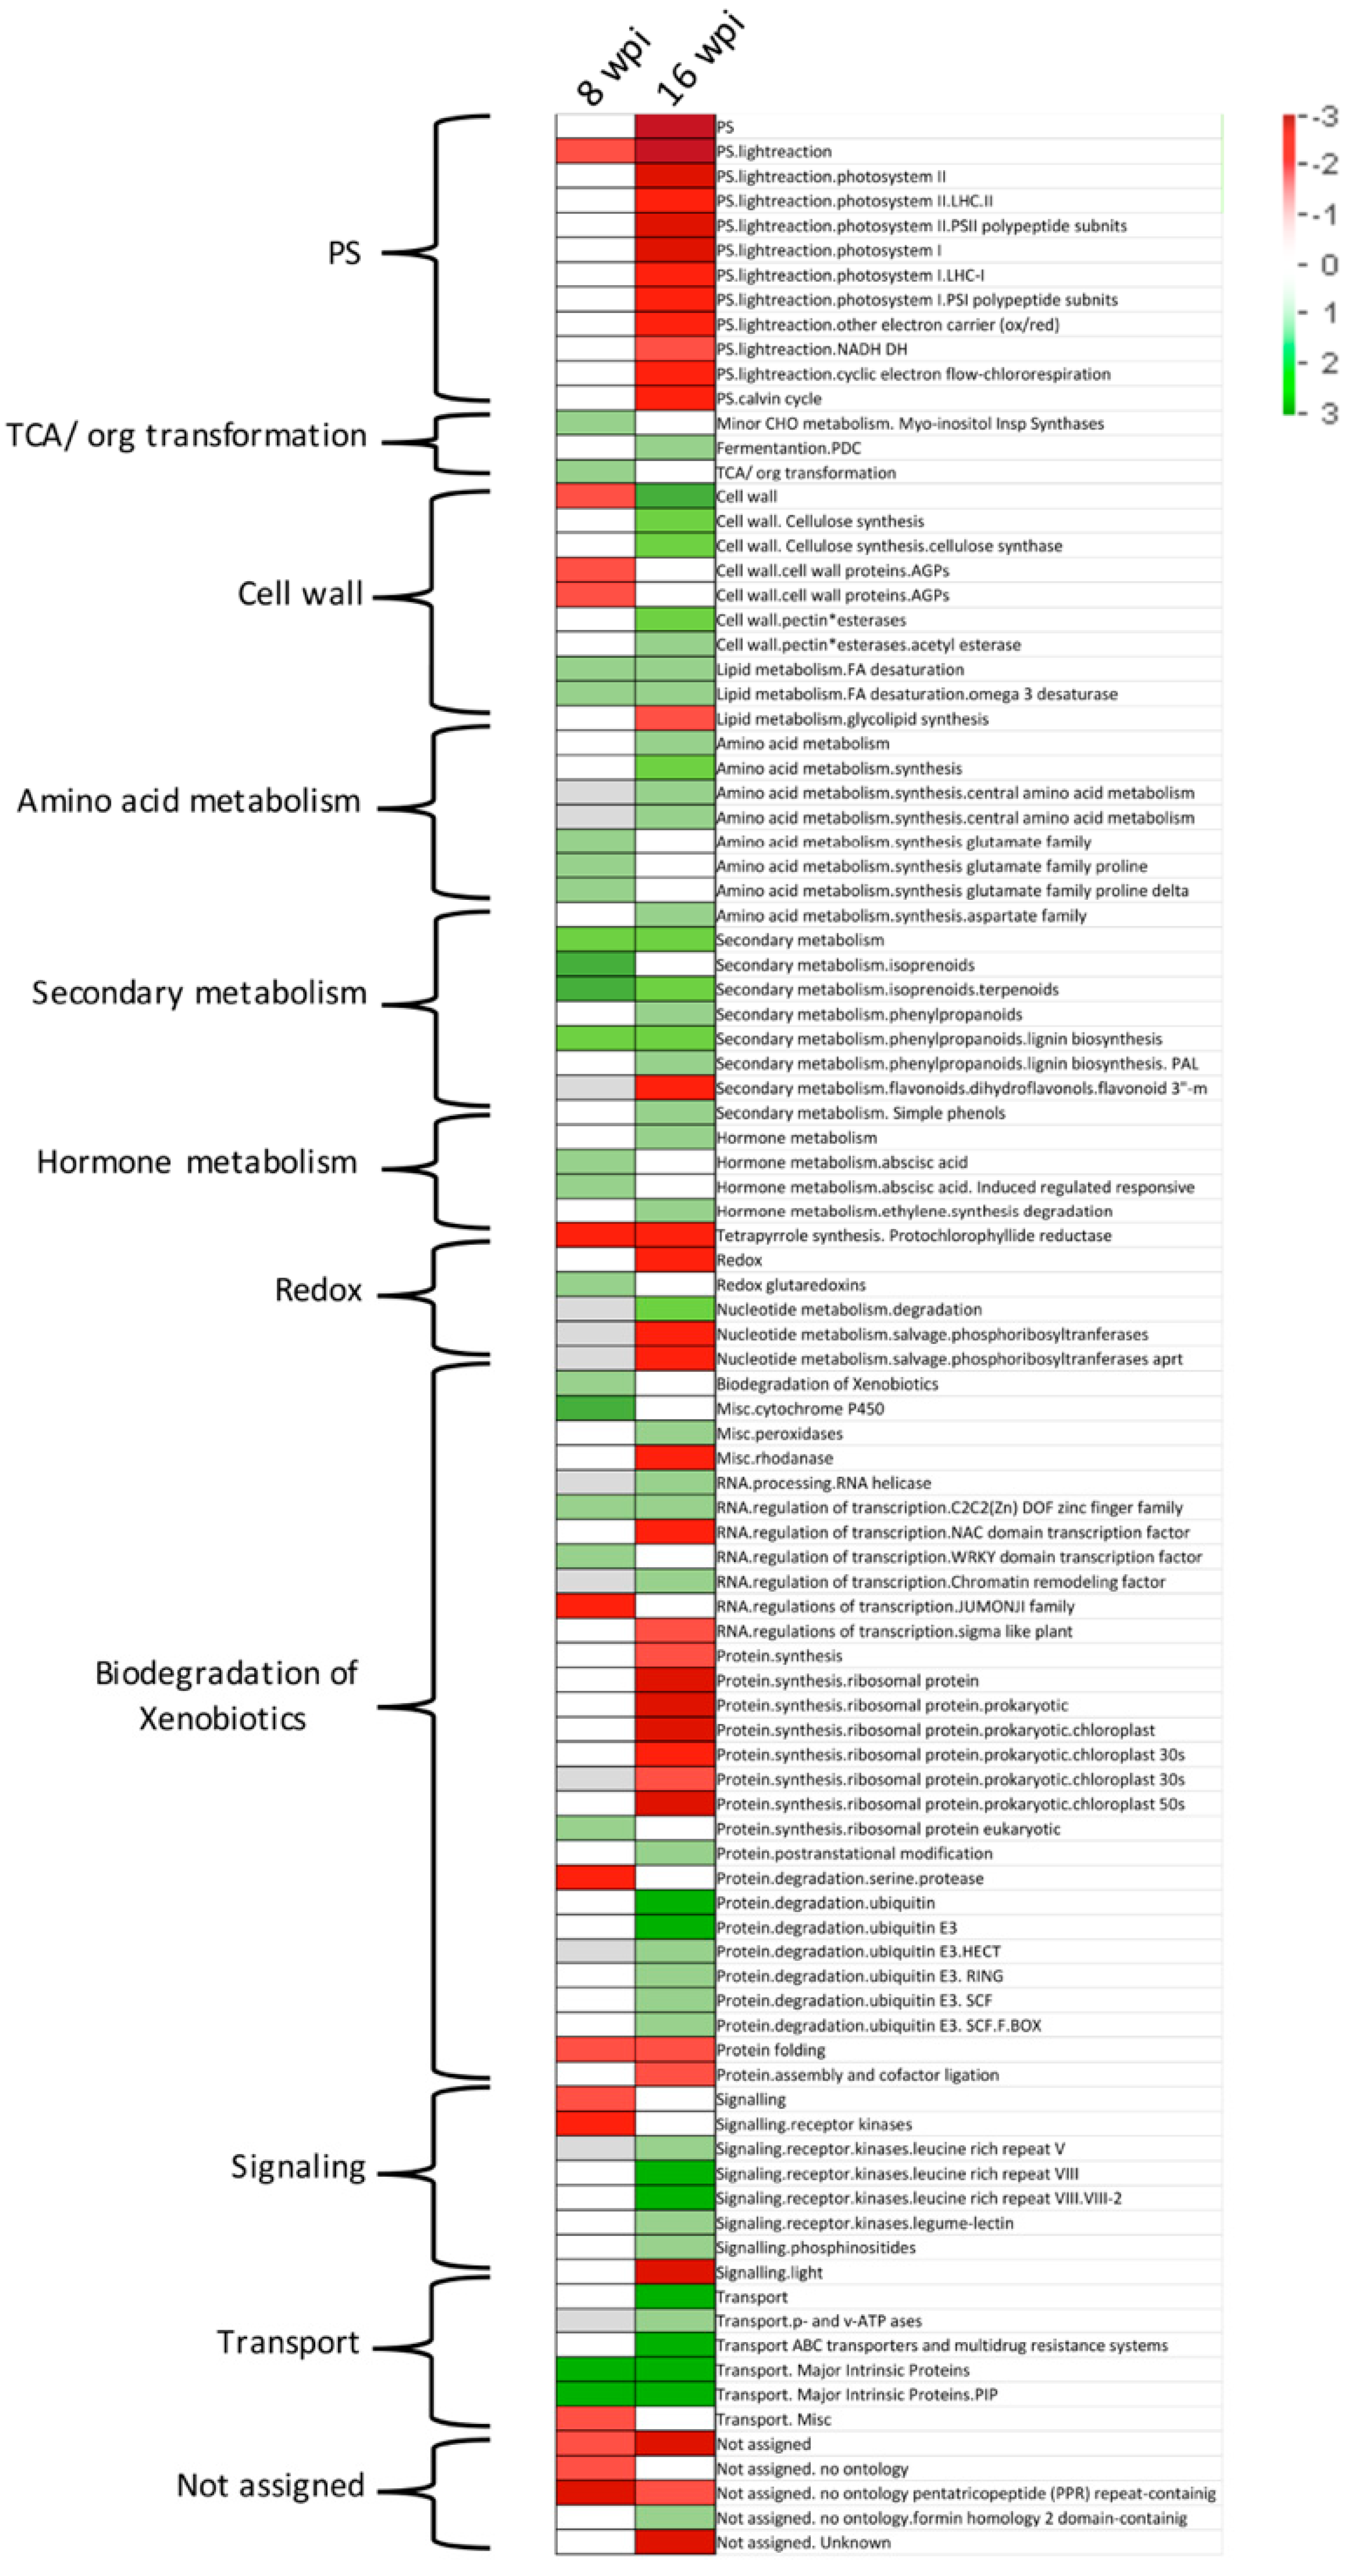
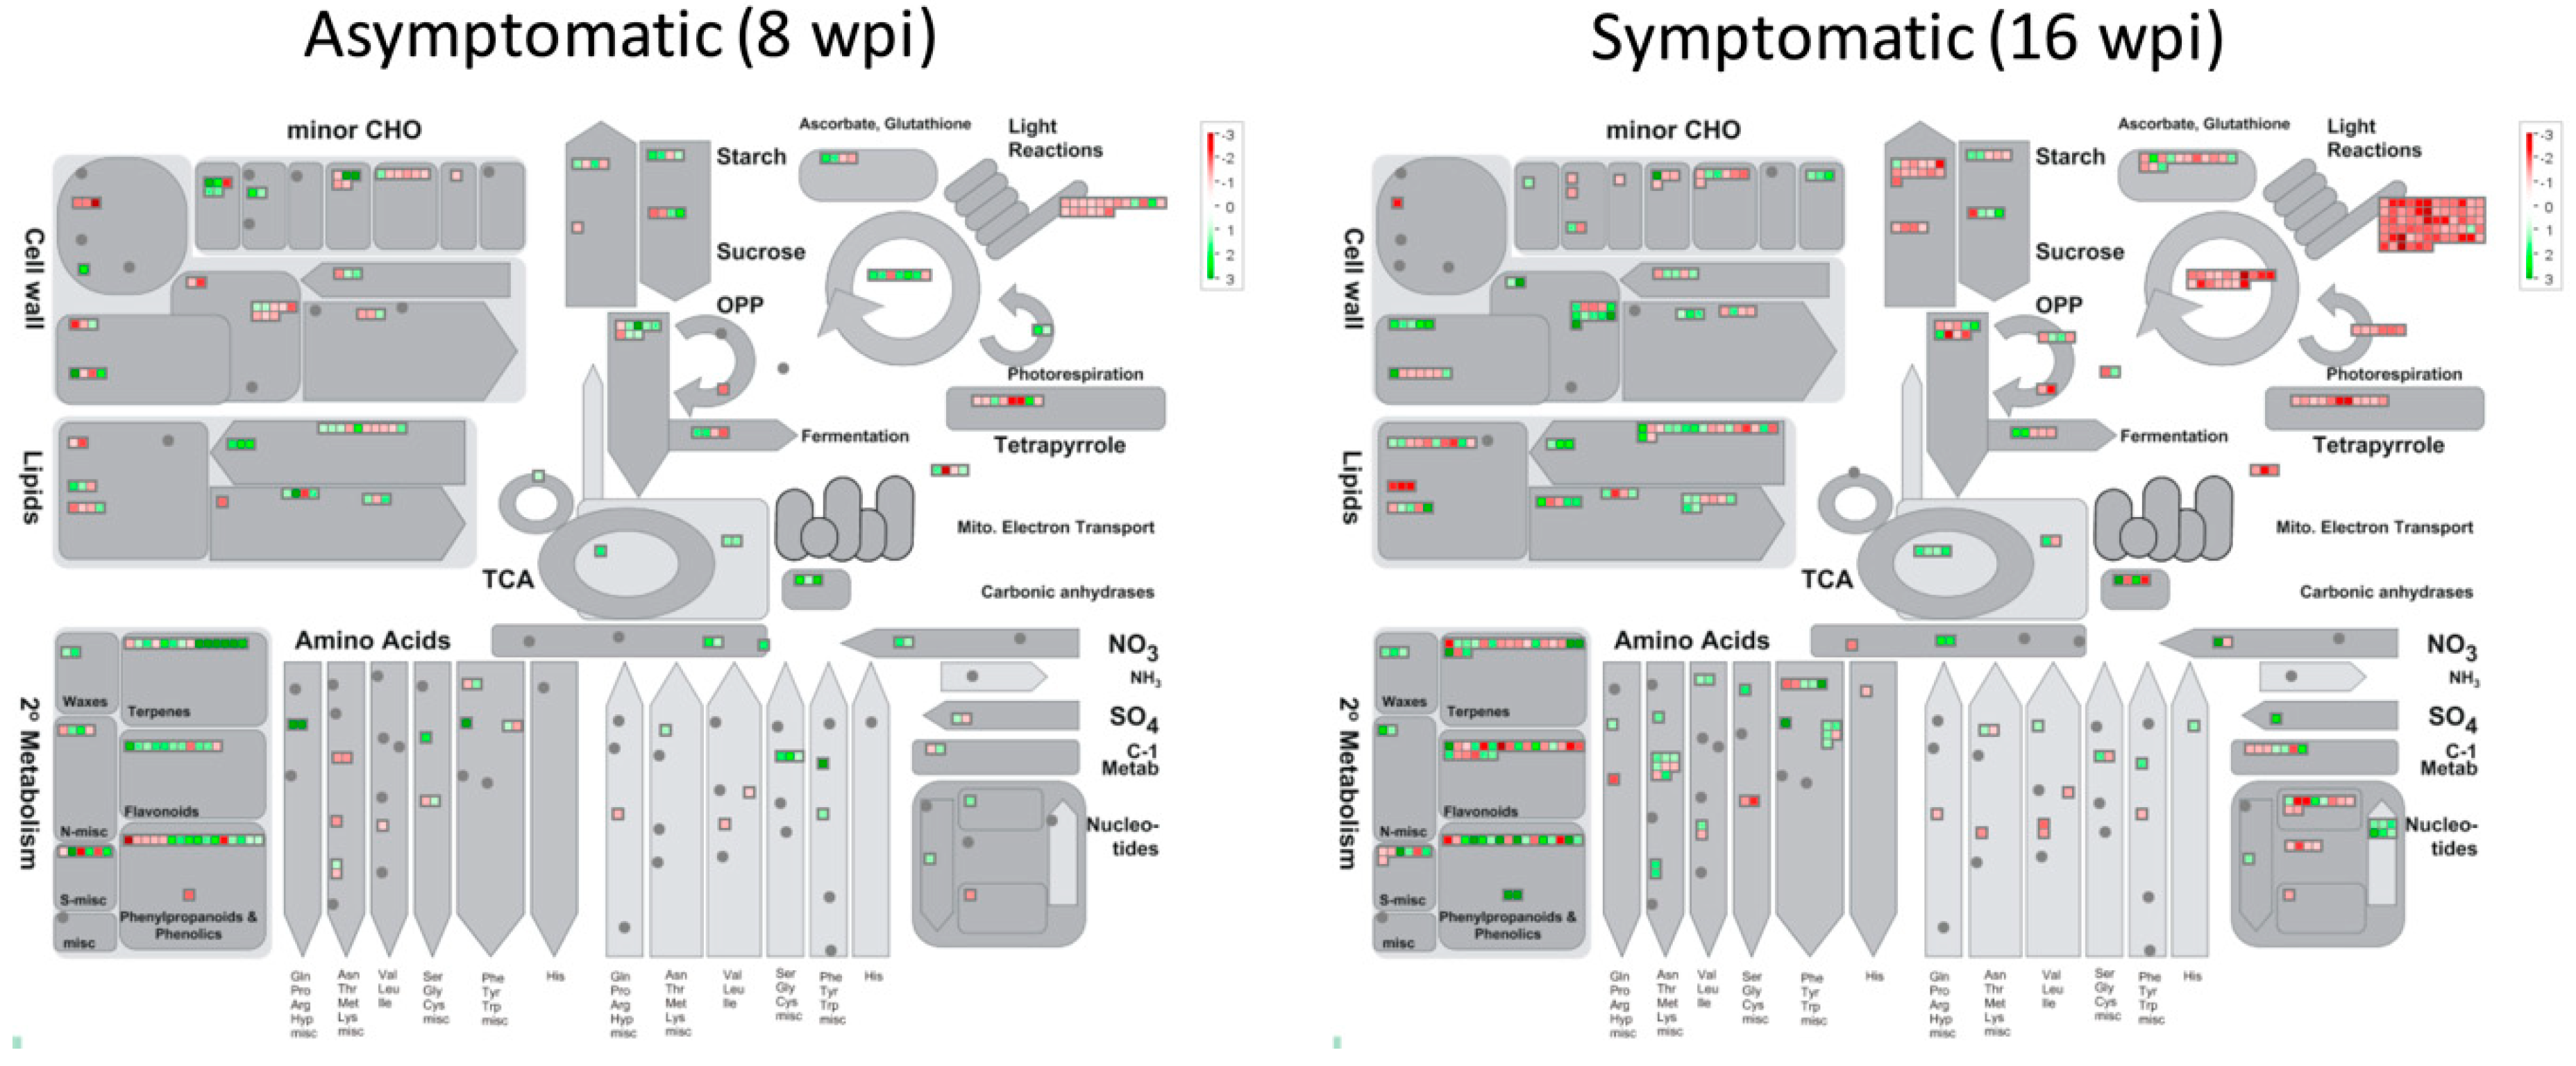
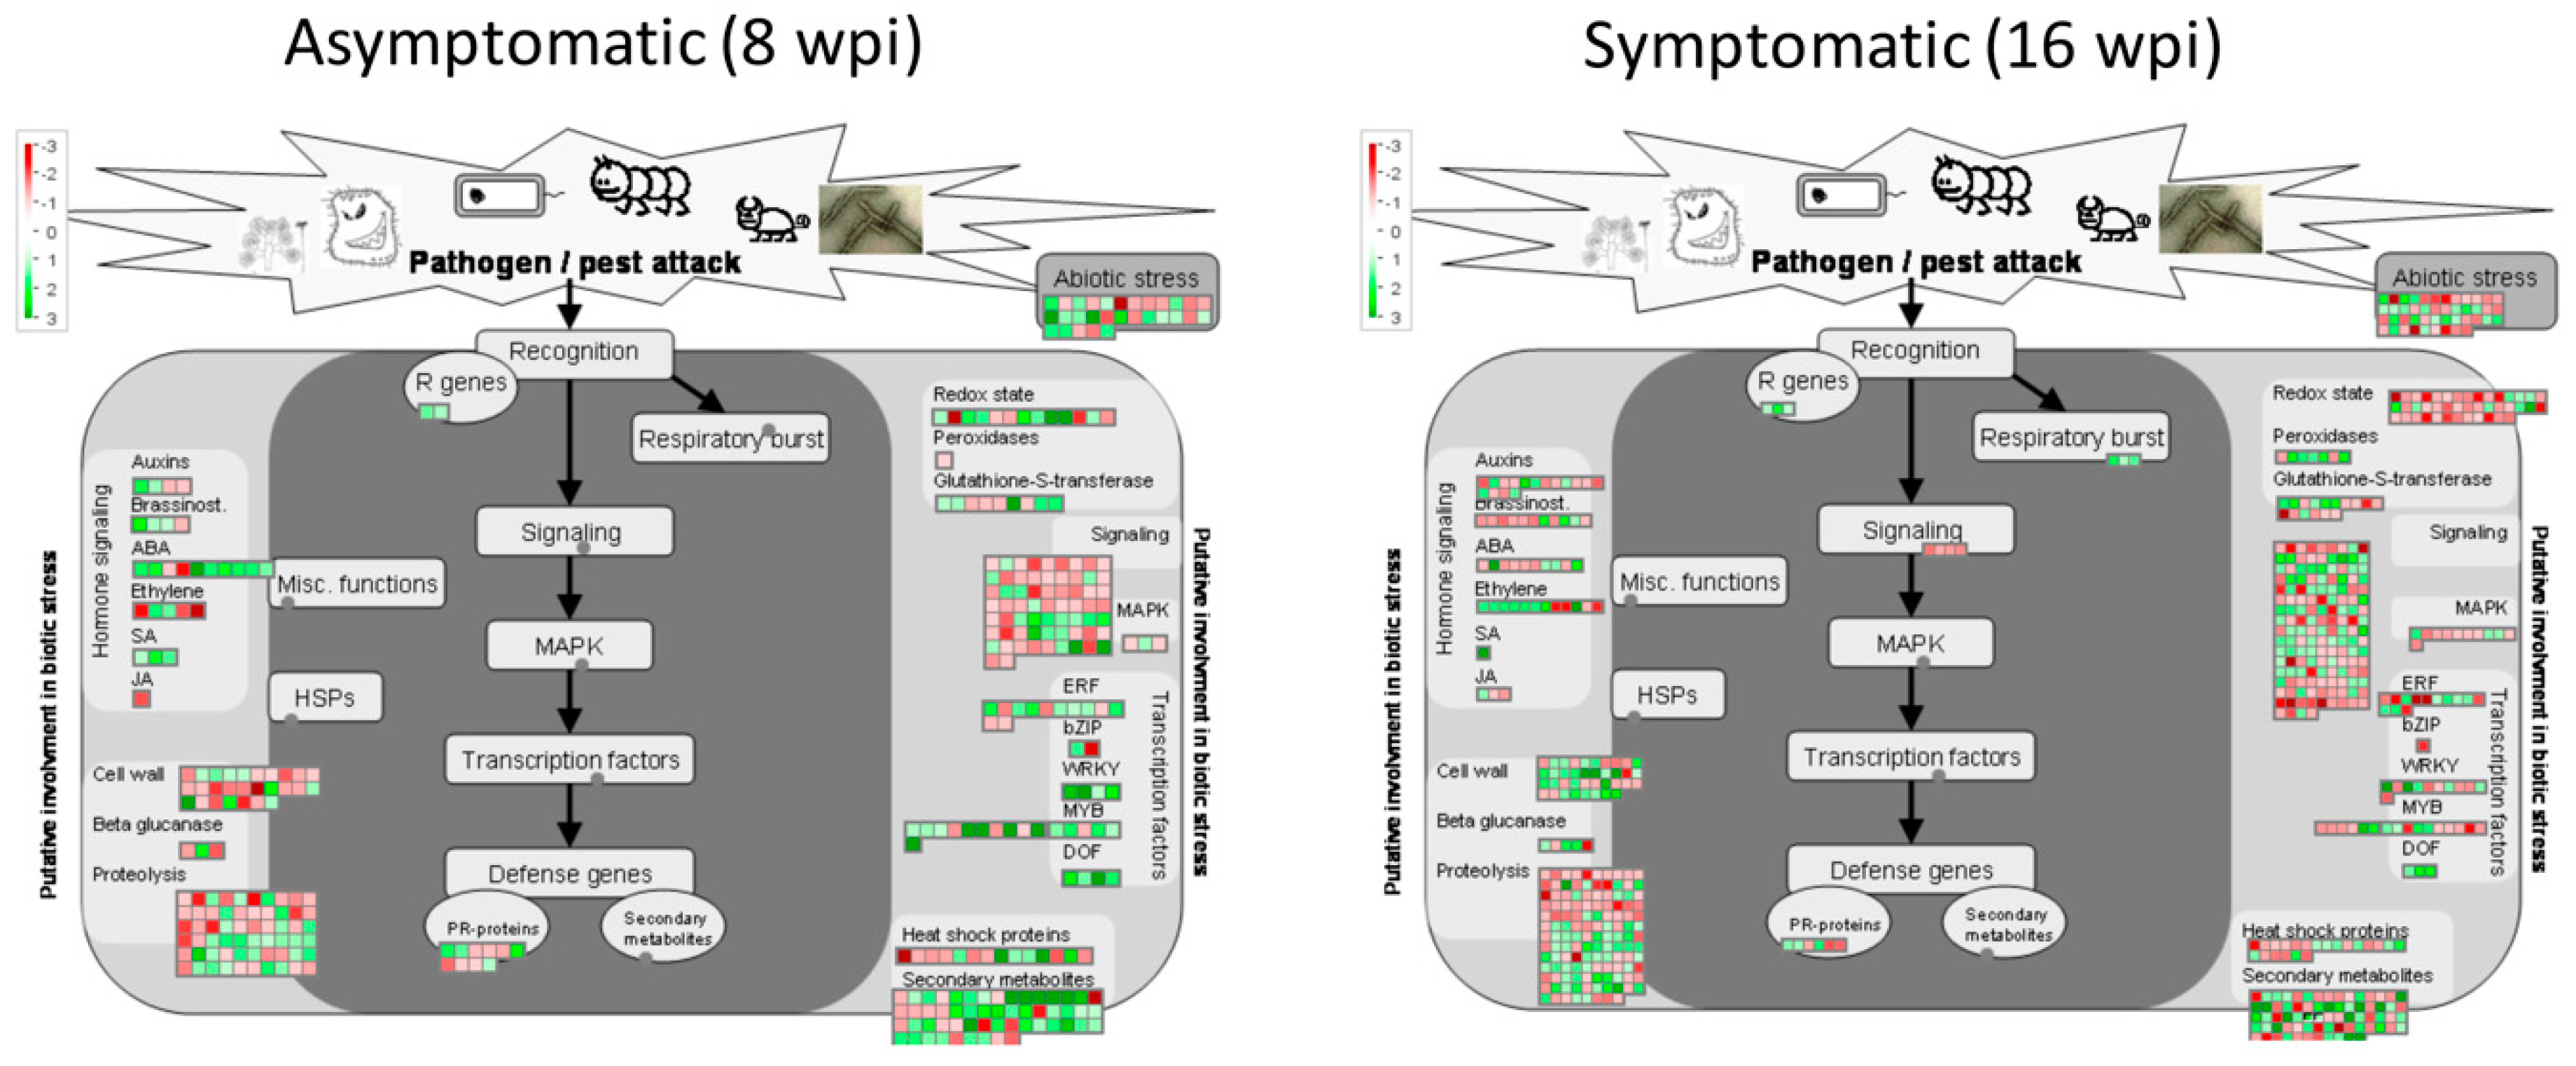
3.5. Gene Pathway Enrichment Analysis of Host Pathways in Response to CLas Infection
3.5.1. Analyzing DEGs Related to Stress Response at Asymptomatic Stage
- 1.
- Secondary MetabolismA total of 54 DEGs (37 upregulated and 17 downregulated) were observed in this category: 14 genes involved in isoprenoids metabolism, 16 from phenylpropanoids metabolism, 4 miscellaneous alkaloid-like, 6 sulfur-containing proteins involved in glucosinolates and allinases synthesis, 2 involved in wax synthesis, 11 belonging to flavonoids metabolism, and 1 related to phenol metabolism.
- 2.
- SignalingSixty-five DEGs belonging to signaling category were mostly downregulated at asymptomatic stage. Three genes involved in sugar and nutrient physiology, 37 receptor kinases (20 containing leucine rich repeats I, II, III, VII, VIII, IX, X, XII, and XIV, 1 Catharantus roseus-like RKL1, 6 containing DUF 26 domain, 1 legume-lectic domain, 2 S-locus glycoprotein-like, 4 wall-associated, and 3 miscellaneous kinases, 8 genes related to calcium signaling, 3 phosphoinositide phospholipase C, two G-proteins, 3 MAP kinases, 2 of phosphorelay complex, 5 related to light, and 2 unspecified genes.
- 3.
- Cell WallTwenty-seven genes (7 up-regulated and 20 down-regulated) were identified in this category. One UDP–glucose epimerase (UGE), one UDP–glucuronate synthase (UXS), three cellulose synthase genes, one cell-wall-degradation-related protein (beta-mannan endohydrolase), and one gene involved in cell wall modification (ATEXP1 expansin) were induced. On the other hand, one UGE gene, six cellulose synthases (CESA4, CESA6, CESA7, CESA8, CLB05 and COBL4), two genes related to hemicellulose synthesis (FRA8, and IRX9), three fasciclin-like arabinogalactan proteins (FLA6, FLA11, and FLA12), two cell-wall-degradation-related protein (beta-mannan endohydrolase), three genes involved in cell wall modification (xyloglucosyl transferases, XTH genes), and three pectin esterases were downregulated.
- 4.
- RNA Regulation of Transcription FactorsFour genes encoding transcription factors containing DOF zinc finger domain (ADOF2, CDF3 and two DOF-type proteins) and four transcriptions containing WRKY domain (WRKY 23, 27, 43, and 57) were upregulated.
- 5.
- Hormone MetabolismTen genes related to abscisic acid metabolism were deregulated. Eight genes were upregulated. Two zeaxanthin epoxidases (ABA1 genes), two involved in signal transduction and four abscisic-acid-induced genes, were upregulated, whereas, two genes (NCED4 and GCR2, involved in synthesis and signal transduction, respectively) were downregulated.
3.5.2. Analyzing DEGs Related to Stress response at Symptomatic Stage
- 1.
- Secondary MetabolismA total of 71 genes were deregulated (33 upregulated and 48 downregulated) in this category: Nineteen genes involved in isoprenoids metabolism, 16 of phenylpropanoids-dependent lignin biosynthesis, 2 miscellaneous alkaloid-like genes, 7 of glucosinolates synthesis, 3 of wax metabolism, 22 of flavonoids metabolism, and 2 of phenol metabolism.
- 2.
- RNA Regulation of TranscriptionThree genes encoding transcription factors containing DOF zinc finger domain (including the ADOF2 gene upregulated at early stage and two different DOF-type proteins) were upregulated.
- 3.
- Redox MetabolismSeven peroxidases were deregulated in this category: five upregulated (PER22, PER32, PER34, and two putative pexosidases genes) and two downregulated (PER17 and APX6 genes). A total of 42 redox-related genes were deregulated, most of them repressed (8 upregulated versus 34 downregulated). Fourteen thioredoxin-related genes, 14 glutatione/ascorbate-related, 5 glutaredoxins, 4 peroxiredoxins, 1 superoxide dismutase, 2 catalases, 1 heme group-containing protein, and 1 sulfiredoxin.
4. Discussion
Supplementary Materials
Author Contributions
Funding
Conflicts of Interest
References
- Wu, G.A.; Terol, J.; Ibanez, V.; López-García, A.; Pérez-Román, E.; Borredá, C.; Domingo, C.; Tadeo, F.R.; Carbonell-Caballero, J.; Alonso, R.; et al. Genomics of the origin and evolution of Citrus. Nat. Publ. Gr. 2018, 554, 311–316. [Google Scholar] [CrossRef] [Green Version]
- Servicio de Informacioón Agroalimentaria y Pesquera (SIAP-SAGARPA). 2019. Available online: http://www.siap.sagarpa.gob.mx/ (accessed on 20 March 2020).
- Servicio Nacional de Sanidad, Inocuidad y Calidad Agroalimentaria (SENASICA-SAGARPA). 2019. Available online: http://www.gob.mx/senasica (accessed on 20 March 2020).
- Bové, J.M. Huanglongbing: A Destructive, newly-emerging, century-old disease of citrus. J. Plant. Pathol. 2006, 88, 7–37. [Google Scholar]
- Duan, Y.; Zhou, L.; Hall, D.G.; Li, W.; Doddapaneni, H.; Lin, H.; Liu, L.; Vahling, C.M.; Gabriel, D.W.; Williams, K.P.; et al. Complete genome sequence of citrus Huanglongbing bacterium, ‘Candidatus Liberibacter asiaticus’ obtained through metagenomics. Mol. Plant Microbe Interact. 2009, 22, 1011–1020. [Google Scholar] [CrossRef] [PubMed] [Green Version]
- Arratia-Castro, A.A.; Santos-Cervantes, M.E.; Arce-Leal, Á.P.; Espinoza-Mancillas, M.G.; Rodríguez Negrete, E.A.; Méndez-Lozano, J.; Arocha-Rosete, Y.; Leyva-López, N.E. Detection and quantification of ‘Candidatus Phytoplasma asterisʼ and ‘Candidatus Liberibacter asiaticusʼ at early and late stages of Huanglongbing disease development. Can. J. Plant Pathol. 2016, 38, 411–421. [Google Scholar] [CrossRef]
- Blaustein, R.A.; Lorca, G.L.; Teplitski, M. Challenges for managing Candidatus Liberibacter spp. (Huanglongbing disease pathogen): Current control measures and future directions. Phytopathology 2018, 108, 424–435. [Google Scholar] [CrossRef] [Green Version]
- Ying, X.; Wan, M.; Hu, L.; Zhang, J.; Li, H.; Lv, D. Identification of the virulence factors of Candidatus Liberibacter asiaticus via heterologous expression in Nicotiana benthamiana using Tobacco Mosaic Virus. Int. J. Mol. Sci. 2019, 20, 5575. [Google Scholar] [CrossRef] [Green Version]
- Albrecht, U.; Bowman, K.D. Gene expression in Citrus sinensis (L.) Osbeck following infection with the bacterial pathogen Candidatus Liberibacter asiaticus causing Huanglongbing in Florida. Plant Sci. 2008, 175, 291–306. [Google Scholar] [CrossRef]
- Wang, N. The citrus Huanglongbing crisis and potential solutions. Mol. Plant 2019, 12, 607–609. [Google Scholar] [CrossRef]
- Folimonova, S.Y.; Robertson, C.J.; Garnsey, S.M.; Gowda, S.; Dawson, W.O. Examination of the responses of different genotypes of citrus to Huanglongbing (citrus greening) under different conditions. Phytopathology 2009, 99, 1346–1354. [Google Scholar] [CrossRef] [Green Version]
- Shokrollah, H.; Abdullah, T.L.; Sijam, K.; Abdullah, S.N.A.; Abdullah, N.A.P. Differential reaction of citrus species in malaysia to Huanglongbing (HLB) disease using grafting method. Am. J. Agric. Biol. Sci. 2009, 4, 32–38. [Google Scholar] [CrossRef] [Green Version]
- Ramadugu, C.; Keremane, M.L.; Halbert, S.E.; Duan, Y.P.; Roose, M.L.; Stover, E.; Lee, R.F. Long-term field evaluation reveals Huanglongbing resistance in citrus relatives. Plant Dis. 2016, 100, 1858–1869. [Google Scholar] [CrossRef] [Green Version]
- Aritua, V.; Achor, D.; Gmitter, F.G.; Albrigo, G.; Wang, N. Transcriptional and microscopic analyses of citrus stem and root responses to Candidatus Liberibacter asiaticus infection. PLoS ONE 2013, 8, e73742. [Google Scholar] [CrossRef] [Green Version]
- Liao, H.L.; Burns, J.K. Gene expression in Citrus sinensis fruit tissues harvested from huanglongbing-infected trees: Comparison with girdled fruit. J. Exp. Bot. 2012, 63, 3307–3319. [Google Scholar] [CrossRef] [PubMed] [Green Version]
- Martinelli, F.; Uratsu, S.L.; Albrecht, U.; Reagan, R.L.; Phu, M.L.; Britton, M.; Buffalo, V.; Fass, J.; Leicht, E.; Zhao, W.; et al. Transcriptome profiling of citrus fruit response to Huanglongbing disease. PLoS ONE 2012, 7, e38039. [Google Scholar] [CrossRef] [PubMed]
- Fan, J.; Chen, C.; Yu, Q.; Khalaf, A.; Achor, D.S.; Brlansky, R.H.; Moore, G.A.; Li, Z.-G.; Gmitter, F.G. Comparative transcriptional and anatomical analyses of tolerant rough lemon and susceptible sweet orange in response to ‘Candidatus Liberibacter asiaticus’ infection. Mol. Plant Microbe Interact. 2012, 25, 1396–1407. [Google Scholar] [CrossRef] [PubMed] [Green Version]
- Xu, M.; Li, Y.; Zheng, Z.; Dai, Z.; Tao, Y.; Deng, X. Transcriptional analyses of mandarins seriously infected by “Candidatus Liberibacter asiaticus”. PLoS ONE 2015, 10, e0133652. [Google Scholar] [CrossRef] [PubMed]
- Albrecht, U.; Bowman, K.D. Transcriptional response of susceptible and tolerant citrus to infection with Candidatus Liberibacter asiaticus. Plant Sci. 2012, 186, 118–130. [Google Scholar] [CrossRef] [PubMed]
- Wang, Y.; Zhou, L.; Yu, X.; Stover, E.; Luo, F.; Duan, Y. Transcriptome profiling of huanglongbing (HLB) tolerant and susceptible citrus plants reveals the role of basal resistance in HLB tolerance. Front. Plant Sci. 2016, 7, 1–13. [Google Scholar] [CrossRef] [PubMed] [Green Version]
- Hu, Y.; Zhong, X.; Liu, X.; Lou, B.; Zhou, C.; Wang, X. Comparative transcriptome analysis unveils the tolerance mechanisms of Citrus hystrix in response to “Candidatus Liberibacter Asiaticus” infection. PLoS ONE 2017, 12, e0189229. [Google Scholar] [CrossRef] [Green Version]
- Zhang, Y.; Uyemoto, J.K.; Kirkpatrick, B.C. A small-scale procedure for extracting nucleic acids from woody plants infected with various phytopathogens for PCR assay. J. Virol. Methods 1998, 71, 45–50. [Google Scholar] [CrossRef]
- Arratia-Castro, A.A.; Santos-Cervantes, M.E.; Fernández-Herrera, E.; Chávez-Medina, J.A.; Flores-Zamora, G.L.; Camacho-Beltrán, E.; Méndez-Lozano, J.; Leyva-López, N.E. Occurrence of “Candidatus Phytoplasma asteris” in citrus showing Huanglongbing symptoms in Mexico. Crop. Prot. 2014, 62, 144–151. [Google Scholar] [CrossRef]
- Li, W.; Hartung, J.S.; Levy, L. Quantitative real-time PCR for detection and identification of Candidatus Liberibacter species associated with citrus Huanglongbing. J. Microbiol. Methods 2006, 66, 104–115. [Google Scholar] [CrossRef] [PubMed]
- Falgueras, J.; Lara, A.J.; Fernández-pozo, N.; Cantón, F.R.; Pérez-trabado, G.; Claros, M.G. SeqTrim: A high-throughput pipeline for pre-processing any type of sequence read. BMC Bioinform. 2010, 11, 38. [Google Scholar] [CrossRef] [PubMed] [Green Version]
- Arce-leal, P.; Bautista, R.; Rodríguez-Negrete, E.A.; Manzanilla-Ramírez, M.A.; Velázquez-Monreal, J.J.; Méndez-Lozano, J.; Bejarano, E.R.; Castillo, A.G.; Claros, M.G.; Leyva-López, N.E. De novo assembly and functional annotation of Citrus aurantifolia transcriptome from Candidatus Liberibacter asiaticus infected and non-infected trees. Data Brief 2020, 1–6. [Google Scholar] [CrossRef]
- Langmead, B.; Salzberg, S.L. Fast gapped-read alignment with Bowtie 2. Nat. Methods 2012, 9, 357–359. [Google Scholar] [CrossRef] [PubMed] [Green Version]
- González Gayte, I.; Bautista Moreno, R.; Seoane Zonjic, P.; Claros, M.G. DEgenes Hunter - A Flexible R pipeline for automated RNA-seq studies in organisms without reference genome. Genom. Comput. Biol. 2017, 3, e31. [Google Scholar]
- Tian, T.; Liu, Y.; Yan, H.; You, Q.; Yi, X.; Du, Z.; Xu, W.; Su, Z. AgriGO v2.0: A GO analysis toolkit for the agricultural community, 2017 update. Nucleic Acids Res. 2017, 45, 122–129. [Google Scholar] [CrossRef] [PubMed]
- Thimm, O.; Bläsing, O.; Gibon, Y.; Nagel, A.; Meyer, S.; Krüger, P.; Selbig, J.; Müller, L.A.; Rhee, S.Y.; Stitt, M. MAPMAN: A user-driven tool to display genomics data sets onto diagrams of metabolic pathways and other biological processes. Plant J. 2004, 37, 914–939. [Google Scholar] [CrossRef] [PubMed]
- Livak, K.J.; Schmittgen, T.D. Analysis of relative gene expression data using real-time quantitative PCR and the 2-ΔΔCT method. Methods 2001, 25, 402–408. [Google Scholar] [CrossRef]
- Nwugo, C.C.; Duan, Y.; Lin, H. Study on citrus response to Huanglongbing highlights a down-regulation of defense-related proteins in lemon plants upon “Ca. Liberibacter asiaticus” infection. PLoS ONE 2013, 8, e67442. [Google Scholar] [CrossRef]
- Kim, J.-S.; Sagaram, U.S.; Burns, J.K.; Li, J.-L.; Wang, N. Response of sweet orange (Citrus sinensis) to ‘Candidatus Liberibacter asiaticus’ infection: Microscopy and Microarray Analyses. Phytopathology 2009, 99, 50–57. [Google Scholar] [CrossRef] [PubMed] [Green Version]
- Zhong, Y.; Cheng, C.; Jiang, N.; Jiang, B. Comparative transcriptome and iTRAQ proteome analyses of citrus root responses to Candidatus Liberibacter asiaticus infection. PLoS ONE 2015, 10, e0126973. [Google Scholar] [CrossRef] [Green Version]
- Mafra, V.; Martins, P.K.; Francisco, C.S.; Ribeiro-Alves, M.; Freitas-Astúa, J.; Machado, M.A. Candidatus Liberibacter americanus induces significant reprogramming of the transcriptome of the susceptible citrus genotype. BMC Genom. 2013, 14, 1–15. [Google Scholar] [CrossRef] [PubMed] [Green Version]
- Folimonova, S.Y.; Achor, D.S. Early events of citrus greening (Huanglongbing) disease development at the ultrastructural level. Phytopathology 2010, 100, 949–958. [Google Scholar] [CrossRef] [Green Version]
- Fan, J.; Chen, C.; Brlansky, R.H.; Gmitter, F.G.; Li, Z.G. Changes in carbohydrate metabolism in Citrus sinensis infected with “Candidatus Liberibacter asiaticus”. Plant Pathol. 2010, 59, 1037–1043. [Google Scholar] [CrossRef]
- Arce-Leal, Á.P.; Leyva-López, N.E.; Santos-Cervantes, M.E.; Rodríguez-Negrete, E.A.; Méndez-Lozano, J.; Manzanilla-Ramírez, M.Á.; Perea-Flores, M.J. Cambios en el metabolismo de carbohidratos asociados a la infección por Candidatus Liberibacter asiaticus en limón mexicano (Citrus aurantifolia). Agrociencia 2019, 53, 593–604. [Google Scholar]
- Cantu, D.; Vicente, A.R.; Labavitch, J.M.; Bennett, A.B.; Powell, A.L.T. Strangers in the matrix: Plant cell walls and pathogen susceptibility. Trends Plant Sci. 2008, 13, 610–617. [Google Scholar] [CrossRef]
- Rashid, A. Defense responses of plant cell wall non-catalytic proteins against pathogens. Physiol. Mol. Plant Pathol. 2016, 94, 38–46. [Google Scholar] [CrossRef]
- Graßmann, J. Terpenoids as Plant Antioxidants. Vitam. Horm. 2005, 72, 505–535. [Google Scholar]
- Ferrer, J.L.; Austin, M.B.; Stewart, C.; Noel, J.P. Structure and function of enzymes involved in the biosynthesis of phenylpropanoids. Plant Physiol. Biochem. 2008, 46, 356–370. [Google Scholar] [CrossRef] [Green Version]
- Havsteen, B.H. The biochemistry and medical significance of the flavonoids. Pharmacol. Ther. 2002, 96, 67–202. [Google Scholar] [CrossRef]
- Hijaz, F.; Nehela, Y.; Killiny, N. Possible role of plant volatiles in tolerance against huanglongbing in citrus. Plant Signal. Behav. 2016, 11, e1138193. [Google Scholar] [CrossRef] [Green Version]
- Norkaew, O.; Pitija, K.; Pripdeevech, P.; Sookwong, P.; Wongpornchai, S. Supercritical fluid extraction and gas chromatographic-mass spectrometric analysis of terpenoids in fresh kaffir lime leaf oil. Chiang Mai J. Sci. 2013, 40, 240–247. [Google Scholar]
- Kooltheat, N.; Kamuthachad, L.; Anthapanya, M.; Samakchan, N.; Sranujit, R.P.; Potup, P.; Ferrante, A.; Usuwanthim, K. Kaffir lime leaves extract inhibits biofilm formation by Streptococcus mutans. Nutrition 2016, 32, 486–490. [Google Scholar] [CrossRef]
- Nafisi, M.; Fimognari, L.; Sakuragi, Y. Interplays between the cell wall and phytohormones in interaction between plants and necrotrophic pathogens. Phytochemistry 2015, 112, 63–71. [Google Scholar] [CrossRef] [PubMed] [Green Version]
- Mardi, M.; Karimi Farsad, L.; Gharechahi, J.; Salekdeh, G.H. In-Depth Transcriptome Sequencing of Mexican Lime Trees Infected with Candidatus Phytoplasma aurantifolia. PLoS ONE 2015, 10. [Google Scholar] [CrossRef] [PubMed] [Green Version]
- Shiu, S.H.; Bleecker, A.B. Plant receptor-like kinase gene family: Diversity, function, and signaling. Sci. STKE. 2001, 113, re22. [Google Scholar] [CrossRef]
- Chattopadhyay, A.; Purohit, J.; Tiwari, K.K.; Deshmukh, R. Targeting transcription factors for plant disease resistance: Shifting paradigm. Curr. Sci. 2019, 117, 1598–1607. [Google Scholar] [CrossRef]
- Le Hir, R.; Bellini, C. The plant-specific Dof transcription factors family: New players involved in vascular system development and functioning in Arabidopsis. Front. Plant Sci. 2013, 4, 164. [Google Scholar] [CrossRef] [PubMed] [Green Version]
- Fornara, F.; Panigrahi, K.C.S.; Gissot, L.; Sauerbrunn, N.; Rühl, M.; Jarillo, J.A.; Coupland, G. Arabidopsis DOF transcription factors act redundantly to reduce CONSTANS expression and are essential for a photoperiodic flowering response. Dev. Cell. 2009, 17, 75–86. [Google Scholar] [CrossRef] [PubMed] [Green Version]
- Pandey, V.P.; Awasthi, M.; Singh, S.; Tiwari, S.; Dwivedi, U.N. A comprehensive review on function and application of plant peroxidases. Biochem. Anal. Biochem. 2017, 6, 1–16. [Google Scholar] [CrossRef]
- Cha, J.Y.; Barman, D.N.; Kim, M.G.; Kim, W.Y. Stress defense mechanisms of NADPH-dependent thioredoxin reductases (NTRs) in plants. Plant Signal. Behav. 2015, 10, 1–3. [Google Scholar] [CrossRef] [PubMed]


© 2020 by the authors. Licensee MDPI, Basel, Switzerland. This article is an open access article distributed under the terms and conditions of the Creative Commons Attribution (CC BY) license (http://creativecommons.org/licenses/by/4.0/).
Share and Cite
Arce-Leal, Á.P.; Bautista, R.; Rodríguez-Negrete, E.A.; Manzanilla-Ramírez, M.Á.; Velázquez-Monreal, J.J.; Santos-Cervantes, M.E.; Méndez-Lozano, J.; Beuzón, C.R.; Bejarano, E.R.; Castillo, A.G.; et al. Gene Expression Profile of Mexican Lime (Citrus aurantifolia) Trees in Response to Huanglongbing Disease caused by Candidatus Liberibacter asiaticus. Microorganisms 2020, 8, 528. https://0-doi-org.brum.beds.ac.uk/10.3390/microorganisms8040528
Arce-Leal ÁP, Bautista R, Rodríguez-Negrete EA, Manzanilla-Ramírez MÁ, Velázquez-Monreal JJ, Santos-Cervantes ME, Méndez-Lozano J, Beuzón CR, Bejarano ER, Castillo AG, et al. Gene Expression Profile of Mexican Lime (Citrus aurantifolia) Trees in Response to Huanglongbing Disease caused by Candidatus Liberibacter asiaticus. Microorganisms. 2020; 8(4):528. https://0-doi-org.brum.beds.ac.uk/10.3390/microorganisms8040528
Chicago/Turabian StyleArce-Leal, Ángela Paulina, Rocío Bautista, Edgar Antonio Rodríguez-Negrete, Miguel Ángel Manzanilla-Ramírez, José Joaquín Velázquez-Monreal, María Elena Santos-Cervantes, Jesús Méndez-Lozano, Carmen R. Beuzón, Eduardo R. Bejarano, Araceli G. Castillo, and et al. 2020. "Gene Expression Profile of Mexican Lime (Citrus aurantifolia) Trees in Response to Huanglongbing Disease caused by Candidatus Liberibacter asiaticus" Microorganisms 8, no. 4: 528. https://0-doi-org.brum.beds.ac.uk/10.3390/microorganisms8040528