
Distribution and Diversity of Beauveria in Boreal Forests of Northern European Russia

Laboratory of Mycology and Phytopathology, Laboratory of Microbiological Plant Protection, All-Russian Institute of Plant Protection (FSBSI VIZR), Pushkin, 196608 St. Petersburg, Russia
*
Author to whom correspondence should be addressed.
Microorganisms 2021, 9(7), 1409; https://0-doi-org.brum.beds.ac.uk/10.3390/microorganisms9071409
Submission received: 25 May 2021
/
Revised: 23 June 2021
/
Accepted: 24 June 2021
/
Published: 29 June 2021
(This article belongs to the Special Issue Entomopathogenic Fungi: Ecology, Evolution, Adaptation)
Abstract
:The distribution and genetic diversity of 91 of Beauveria isolates collected during a long-term survey in boreal forests of northern European Russia was studied. Based on morphological and sequence analysis of TEF and Bloc loci, three Beauveria spp. were identified: B. pseudobassiana, B. bassiana, and B. caledonica, with abundance of 81, 11, and 8%, respectively. Through multilocus sequencing, four haplotypes of B. bassiana and two haplotypes of B. caledonica were detected. Twelve haplotypes of B. pseudobassiana with non-random distribution were identified. Two haplotypes of B. pseudobassiana were the most abundant and widespread occurring across the whole study area, whereas others tended to be more specific to either the north or south of the study area, indicating the presence of different subpopulations. For further analysis of these putative subpopulations, southern and northern areas were separated along the boundary of the Köppen–Geiger climate zones (dfb and dfc), and the genetic structure was examined by analysis of molecular variance and spatial autocorrelation. Molecular evidence of intraspecific recombination of B. pseudobassiana and B. bassiana across northern European Russia area was indicated.
1. Introduction
The genus Beauveria includes globally ubiquitous soilborne arthropod-pathogenic pleomorphic fungi belonging to Cordycipitaceae (Hypocreales) with high ecological and economical importance [1,2,3]. These fungi are important in the regulation of insect populations in natural environments, also occurring as saprotrophs and plant endophytes [4]. Beauveria bassiana (Bals.-Criv.) Vuill. and Beauveria brongniartii (Sacc.) Petch are the most common fungi in mycoinsecticide formulations used to suppress various agricultural and forest insect pests [5]. Beauveria spp. produce many secondary metabolites, which offer a promise for biotechnology [6,7].
The history of research on this fungal group started in the early nineteenth century with the work of Agostino Bassi [8]. He was the first to show the fungal etiology of the insect white muscardine disease. In honor of Bassi, this fungus received the name Botrytis bassiana Bals.-Criv. Vuillemin established the new genus Beauveria and made B. bassiana the type species. During the twentieth century, it became clear that many species, which were previously assigned to Clavaria, Botrytis, Sporotrichum, Isaria, Tritirachium, and others, should be transferred to Beauveria [9]. On the opposite, other species were excluded from this genus. De Hoog [10] then reduced the genus to only three species, В. bassiana, B. brongniartii, and Beauveria alba (Limber) Saccas (currently Parengyodontium album (Limber) C.C. Tsang et al.). Subsequently, Rehner et al. [1] divided B. bassiana s.l. and B. brongniartii s.l. into several cryptic species based on the three nuclear genes (TEF, RPB1, and RPB2) and the nuclear intergenic region (Bloc) phylogeny. Consequently, the understanding of the taxonomic structure of Beauveria has been significantly broadened. Many species have since been described with the aid of molecular methods [11,12,13,14,15,16,17]. The most recent phylogenetic studies led to Beauveria, previously only composed of species known from asexual morphs, being expanded to include taxa previously described by sexual morphs as Cordyceps [16,18].
The majority of studies concerning the community diversity, ecology, and population structure of Beauveria were focused on B. bassiana s.l. These studies have revealed high genetic diversity within local geographical populations using a range of molecular methods, including RFLP, AFLP, DGGE, and microsatellite markers [19,20,21,22,23]. However, neither these methods nor ITS sequencing has provided sufficiently comparable data to infer interspecies and population genetic structures within Beauveria. Recent studies have been more consistent with the sequencing of nuclear intergenic locus Bloc being effectively mandatory for the determination of Beauveria phylogeny [3,24,25]. Most of Beauveria spp. have been reported from particular geographical regions, but a few species (e.g., B. bassiana and Beauveria pseudobassiana S.A. Rehner and Humber) have worldwide distributions. Several studies have demonstrated a strong association of B. bassiana with agricultural and B. pseudobassiana with forest ecosystems [24,25].
The natural insect host range of Beauveria spp. includes 17 orders of Arthropoda [3,26,27]. A number of studies have shown the lack of significant relationships between genotype and host specificity in Beauveria [28,29,30,31,32]. However, recent studies with comparative whole-genome sequencing have indicated that several genes may underpin virulence towards the hosts during the infection process [33,34].
In comparison to the long history of global research on inter- and intraspecific diversity in Beauveria, there have been considerably fewer studies in Russia (and the former USSR). Evlakhova [35] reported the widespread occurrence of B. bassiana s.l. from the Baltic regions to Sakhalin and from the Kola Peninsula to Transcaucasia. Many previous studies were conducted using obsolete species names and, before the recognition of cryptic species in B. bassiana s.l. and B. brongniartii s.l., based on molecular markers. Therefore, there is a need to reevaluate the presence of species and intraspecific forms of Beauveria according to modern taxonomic understanding using contemporary research methods. Although there has been limited recent work on Beauveria phylogeny, more progress has been made on screening virulent strains for biocontrol purposes and their adoption as bioinsecticides [35,36,37].
In Russia, systematic investigations of genetic diversity in Beauveria were undertaken independently in some but not all geographical regions; therefore, the available information is clearly incomplete. Consequently, the goal of this study was to contribute to the information on the species’ and interspecies’ genetic diversity within Beauveria in northern European Russia (NER) because no previous study with material from this region has been conducted with specific molecular markers. We hypothesized that B. pseudobassiana and B. bassiana have a non-random geographical distribution and genetic structure across this focus region.
2. Materials and Methods
2.1. Specimen Collection and Fungal Isolation
This study combined data from three field surveys conducted in August 2017, 2018, and 2019 in boreal forest ecosystems of NER. During these surveys, insect cadavers with signs of mycosis were collected from under the bark of living trees, logs and stumps, and from litter around trees. Ninety-one fungal isolates were collected from infected host insects from 31 locations. In 2017, collections were made in the Republic of Karelia and the Leningrad region. The target areas shifted to the Vologda, Pskov, and Novgorod regions in 2018 and the Republic of Karelia and Arkhangelsk and Vologda regions in 2019. In addition, two accessions from the Pskov region, originally collected in 2013, were included in the analysis. The distance between the most distant locations was over 1000 km. A detailed list of the collections and Genbank accession numbers of sequences are given in Table S1. The identification of accompanying entomopathogenic species from other genera was also undertaken as detailed in Table S2.
Fungal isolation was done by transferring conidia and mycelium fragments from insect cadavers on Sabouraud dextrose agar (SDA, Difco, Detroit, MI, USA) with a sterile inoculating needle. When no conidia were observed, the stimulation of fungal development was done by the moist-chamber technique. Initial identification of Beauveria spp. and entomopathogens was performed based on the examination of macro- and micromorphological features.
2.2. DNA Extraction, PCR Amplification, and Sequencing
Genomic DNA was prepared from homogenized mycelium in 1.5 mL Eppendorf tubes using CTAB/chloroform DNA extraction procedure [38]. DNA probes were resuspended in TE buffer and stored at −20 °C. Primers for partial amplification of translation elongation factor-1a (TEF) were 983F and 1567R [32]. Primers B5.1F and B3.1R were used to amplify the nuclear intergenic region, Bloc [39].
All PCR reactions were performed in a final volume of 25 μL containing 2.5 μL 10× PCR buffer, 0.5 μL dNTP mix (10 mM), 0.5 μL of each primer (10 μM), 0.15 μL of Taq DNA polymerase (5 U/μL, Qiagen, Hilden, Germany), 1 μL of genomic DNA, and 19.85 μL diH2O. Parameters of DNA amplification were as in Rehner and Buckley [32] and Rehner et al. [39].
The PCR product quality was assessed by electrophoresis on an agarose gel (1%) stained with ethidium bromide in 1× TBE buffer. The bands chosen for sequencing were excised and then purified with silica particles [40]. The Sanger sequencing of PCR products was performed in both directions using a capillary DNA sequencer ABI 3500 (Applied Biosystems, Foster City, CA, USA).
2.3. Bioinformatic Analyses
Nucleotide sequences obtained were assembled and manually edited using Vector NTI Advance 11.5.1 software (Life Technologies, Carlsbad, CA, USA). Sequences were aligned using algorithm MUSCLE [41] in bioinformatics software tool MEGA X [42]. All sequences were trimmed evenly to eliminate the variation in sequence length. After alignment, the concatenation of TEF and Bloc sequences was conducted in SequenceMatrix 1.7.3 for further multilocus analysis [43]. Appropriate nucleotide substitution models were identified with jModelTest v. 2.1.10 basing on the corrected Akaike information criterion (AICc) [44,45]. Models K2, T92 + G, and HKY + F + G4 were chosen for TEF, Bloc, and concatenated sequences, respectively [46,47,48]. Then, a maximum likelihood analysis with 1000 bootstrap replicates was performed on the TEF and Bloc datasets to obtain phylogenetic trees using MEGA X. Function cophylo from R package “phytools” was used to generate a co-phylogenetic plot of TEF and Bloc trees (in R v. 4.0.3) [49,50]. Phylogenetic reconstruction with concatenated sequences was conducted in IQ-tree 2.1.2 with 1000 ultrafast bootstrap approximation [51,52].
The number of haplotypes and haplotype diversity (Hd) were calculated using DnaSP v. 5.10 [53,54]. Species richness was estimated as the number of different Beauveria spp. The relative species abundance was considered as the percentage of isolates from each fungal species to the total number of fungal isolates. The species’ relative occurrence was estimated as the percentage of the locations in which a certain species was detected to the total number of locations.
Beauveria spp. isolates had a varying heterogeneous genetic structure in the southern and northern parts of the study area. Therefore, the boundary between the two Köppen-Geiger climate zones [55] was used to investigate this structure. Appropriate coordinates were downloaded from the World Maps of Köppen-Geiger Climate Classification (http://koeppen-geiger.vu-wien.ac.at/present.htm (accessed on 4 March 2021)). The south area was in the Köppen-Geiger zone dfb with a warm-summer-humid continental climate, and the north area was in zone dfc with a subarctic climate. Arlequin 3.5 was used to test the hypothesis that variability in the genetic structure of B. pseudobassiana was related to climate zones (dfb and dfc) based on the hierarchical analysis of molecular variance (AMOVA) [56].
SplitsTree 4.10 was used to find evidence of recombination based on phylogenetic incompatibilities of polymorphic sites along with concatenated sequences with PHI test [57,58]. The test was performed with the default settings of a window size of 100 and k = 3. In addition, the phylogenetic diversity (the sum of the weights for all splits) was estimated with SplitsTree 4.10 [59].
The standardized index of association (IAs) indicating the degree of linkage disequilibrium among different loci and significance of the null hypothesis was calculated under Monte Carlo simulation (10,000 iterations) with LIAN 3.7 [60]. Indices were computed for each fungal species on complete and clone-corrected datasets. Clone-corrected datasets were assembled by removing replicates of the same haplotype since repetition due to clonality can lead to the detection of linkage disequilibrium and consequently can affect the ability to detect recombination among isolates [61].
We used the global multilocus spatial autocorrelation analysis implemented in GenAlEx 6.5 [62] to describe the genetic structure across an entire studied region [63]. The autocorrelation coefficient (r) provides a measure of the genetic similarity between pairs of individuals whose geographic separation falls within the specified distance class. Pairwise individual-by-individual genetic and geographic distances were used to calculate r for predefined 18 distance classes (class size 50 km). Spatial genetic autocorrelograms were created by plotting r values as a function of distance. Tests for statistical significance were performed using 10,000 random permutations of the individuals and 10,000 bootstraps for estimates of r. Correlation values outside the confidence interval are considered to be statistically significant at p < 0.05.
3. Results
3.1. Species Abundance, Occurrence, and Host Specificity
Overall, specimens (insect host cadavers) from 31 locations of northern European Russia were collected, and 91 fungal isolates were purified and sequenced (Figure 1 and Figure 2A, Table S1). Species richness of Beauveria was limited to three species: B. pseudobassiana, B. bassiana, and Beauveria caledonica Bissett and Widden. Beauveria pseudobassiana was the most frequently collected and abundant species (occurrence 77% and abundance 81%). Beauveria bassiana and B. caledonica were less dominant, with abundance of 11 and 8%, respectively.
Beauveria bassiana was collected in eight locations (occurrence 26%), usually separate from other species. However, in two locations (locations 12 and 26), B. bassiana was obtained from Coleoptera (Scolytinae) concurrently with B. pseudobassiana (Figure 2, Table S1). Beauveria caledonica during the present surveys was detected in only three locations (occurrence 10%). Therefore, it could not be included in all statistical analyses.
The uneven distribution of Beauveria spp. across the study area was recorded (Figure 2B–D). Most B. bassiana isolates (80%) were collected from the southern part of the study area (Köppen-Geiger zone dfb). In contrast, most B. pseudobassiana isolates (77%) were collected in the north (Köppen-Geiger zone dfc). Six B. caledonica isolates were collected from locations 9 and 8 in zone dfb, and only one (location 23) was from zone dfc.
About 88% of B. pseudobassiana isolates were collected from Coleoptera; among them, a significant portion was isolated from hosts in the subfamily Scolytinae (73%). Less frequently, B. pseudobassiana was isolated from Lepidoptera (3%), Hemiptera (1%), Hymenoptera (1%), Diptera (1%), and undefined Insecta (5%). Beauveria bassiana was isolated from Coleoptera (50%), Hemiptera (10%), Hymenoptera (10%), Diptera (10%), and undefined Insecta (30%). Beauveria caledonica was only isolated from bark beetles (Scolytinae).
In addition to Beauveria spp., entomopathogenic fungi from other taxonomic groups were identified in the same locations: Akanthomyces cf. attenuatus (Zare and W. Gams) Spatafora, Kepler, and B. Shrestha (locations 16, 19, 20, 21, and 25), Cordyceps bifusispora O.E. Erikss (location 5), Cordyceps militaris (L.) Fr. (locations 5, 19, 24, and 27), Cordyceps farinosa (Holmsk.) Kepler, B. Shrestha, and Spatafora (locations 10, 19, 20, 26, and 27), Metarhizium sp. (location 8), Ophiocordyceps entomorrhiza (Dicks.) G.H. Sung, J.M. Sung, Hywel-Jones, and Spatafora (location 29) and Tolypocladium sp. (location 14; Table S2).
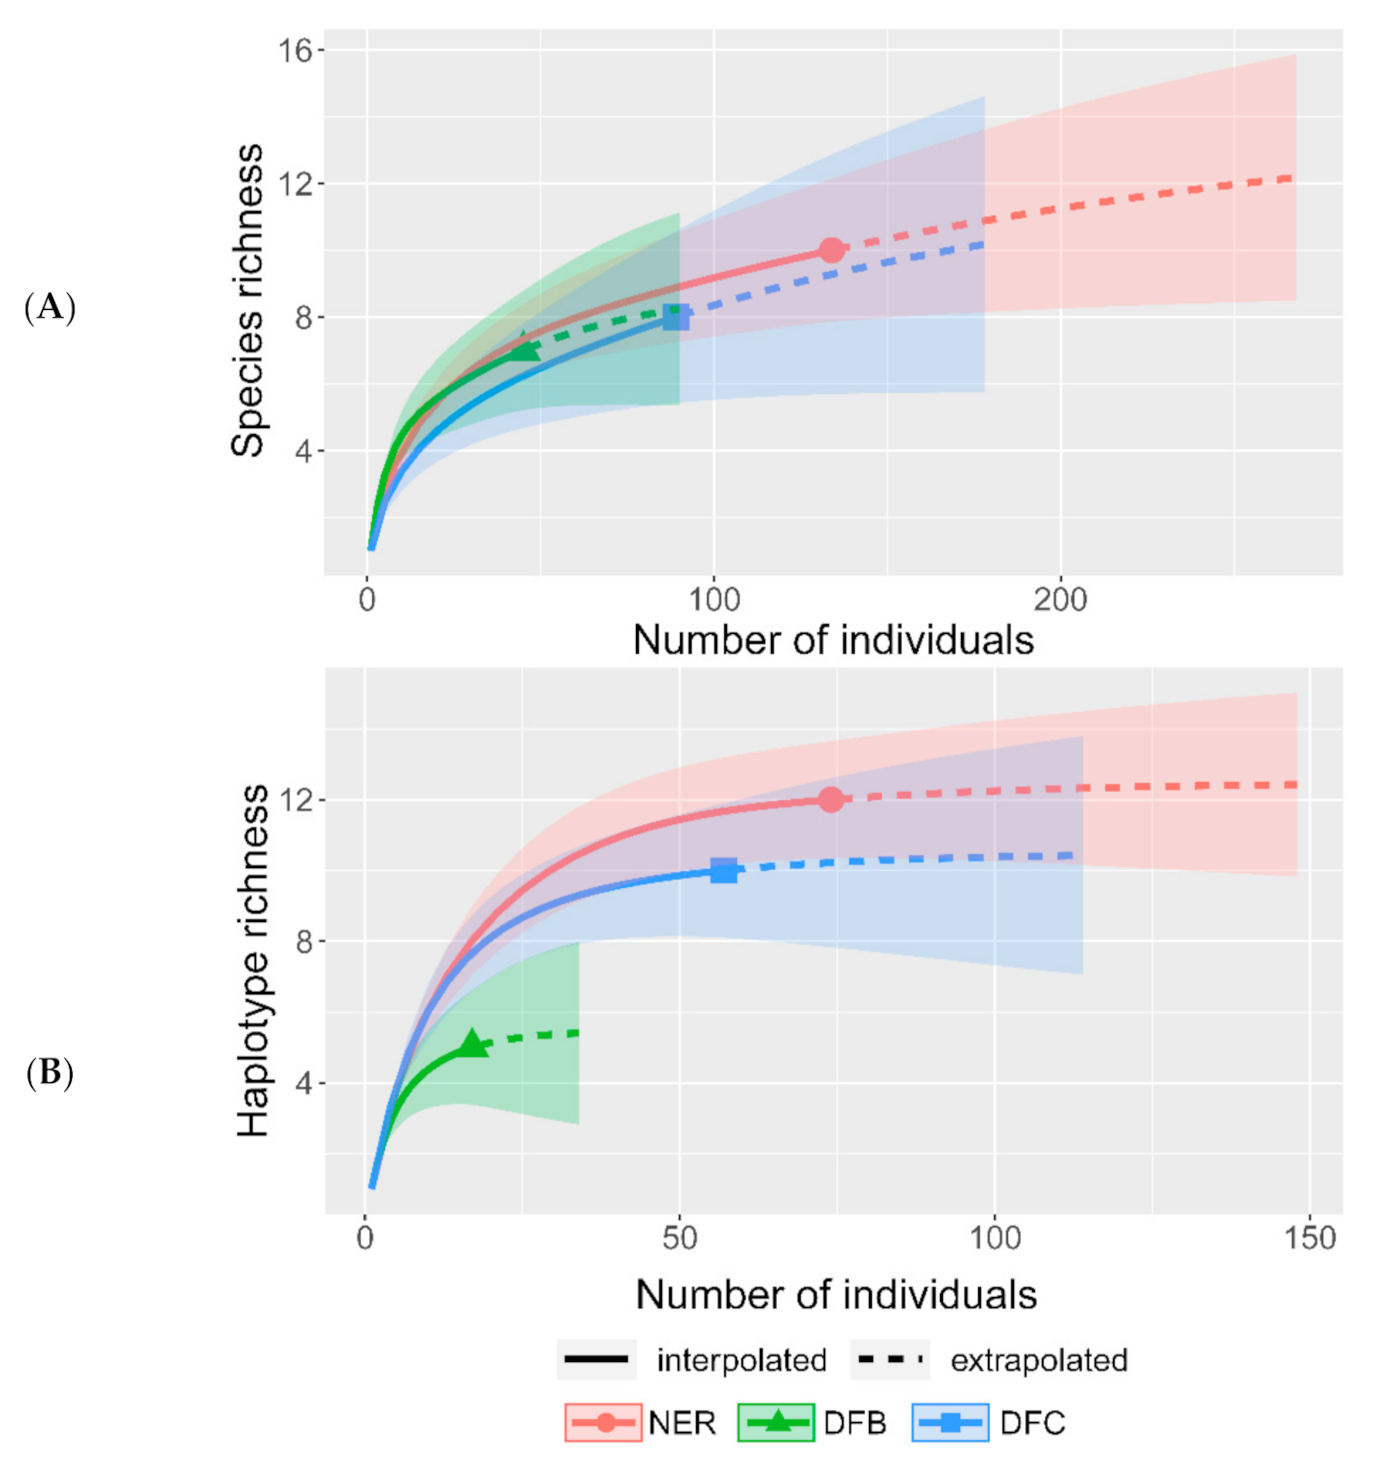
The uneven intensity of sampling for Beauveria spp. across NER could lead to its underestimation in either zone dfb or dfc. To determine the completeness of the available datasets, several individual rarefaction curves were generated for (1) all identified species including entomopathogenic fungi from other genera (Figure 3A, Tables S1 and S2), (2) the three Beauveria spp. (Figure S1 and Table S1), and (3) all B. pseudobassiana haplotypes (Figure 3B and Table S1). Rarefaction curves for the dataset with entomopathogenic fungi from other genera indicated a slight underestimation but were beyond the linear ranges. Rarefaction curves for Beauveria spp. and B. pseudobassiana haplotypes reached the asymptote and indicated the adequacy of sampling intensity across NER, as well as zones dfb and dfc. This indicates that a high proportion of Beauveria spp. and B. pseudobassiana haplotypes were collected in the present survey.
3.2. Genetic Diversity
The intraspecific diversity of B. pseudobassiana was sufficiently greater than for the other two species. Total Hd for B. pseudobassiana isolates across all locations reached 0.638 (TEF), 0.738 (Bloc), and 0.863 (multilocus sequences; MLS; Table S3). Total Hd for B. bassiana isolates was 0.778 for each locus and MLS data. For B. caledonica, total Hd was 0.286 for Bloc and MLS and 0 for TEF since the latter was represented by only one allele. Total phylogenetic diversity based on MLS data was estimated as 0.033 for B. pseudobassiana, 0.054 for B. bassiana, and 0.001 for B. caledonica. The MLS phylogenetic tree of Beauveria spp. is presented in Figure S2.
Beauveria bassiana was represented by four TEF alleles (bT1, bT2, bT3, and bT4) and four Bloc alleles (bB1, bB2, bB3, and bB4; Figure 1). The most abundant haplotype was bT1B1 representing 40% of total B. bassiana isolates. Beauveria caledonica was represented by one TEF allele (cT1) and two Bloc alleles (cB1 and cB2). Each of the two B. caledonica haplotypes (cT1B1 and cT1B2) were found in separate climate zones.
The most representative data were obtained for B. pseudobassiana isolates, and the genetic structure of this species was obtained in more detail. Beauveria pseudobassiana had four distinguishable alleles by TEF, which were marked as pT1, pT2, pT3, and pT4, according to their abundance (Figure 1). Alleles pT1 and pT2 were predominant and were represented by 49 and 34% of isolates, respectively. They were widely distributed over the study area. Alleles pT3 and pT4 were significantly less abundant. Allele pT3 (14%) was detected only in the north of the study area, while pT4 (4%) was found only in the south (a single location of the Pskov region).
The intergenic region Bloc of B. pseudobassiana allowed the identification of six clades, which were designated as pB1–pB6. Within all clades, nine individual alleles were observed and numbered with respect to their clade (e.g., alleles pB1.1, pB1.2, and pB1.3 corresponded to clade pB1). The most predominant allele was pB1.1, occurring in 47% of isolates. Less frequent were pB1.2 and pB3, with an occurrence within isolates of 12 and 14%, respectively. All other six Bloc alleles had an occurrence of less than 8% each and were detected in up to six isolates. Alleles pB1.1, pB1.2, and pB3 were more or less evenly distributed, whereas alleles pB2.1, pB2.2, pB4, pB5, and pB6 were found only in isolates from the northern zone. Allele pB1.3 was found in a single isolate from the Pskov region.
Haplotypes with a combination of pT1B1.1 and pT2B1.1 were the most frequent (27 and 20%, respectively) and widespread. Haplotype pT1B1.2 had a uniform distribution and was detected in the Republic of Karelia and the Novgorod and Vologda regions but was quite rare. Since alleles pB2.1, pB2.2, pB4, pB5, and pB6 were found only in the northern zone, all occurred combinations with TEF alleles (pT1, pT2, and pT3) were detected also strictly in the northern zone.
It is worth noting that several haplotypes were collected from one location, revealing the highly variable heterogeneous haplotype structure of B. pseudobassiana. For example, eight haplotypes were found in location 14 and four haplotypes in locations 17 and 20, respectively.
Table 1 presents the result of AMOVA used to evaluate the population genetic structure of B. pseudobassiana in two climate zones (dfb and dfc), with each population corresponding to one location (Table 1). This partitioning scheme showed a low genetic differentiation between the dfb and dfc zones (2.5%), with the most variation observed within populations (79.2%). The variation derived from populations within each climate zone was moderate (18.3%) and reflected the heterogeneous haplotype structure at a single location, as previously mentioned. The fixation index between populations within groups was significant (FSC = 0.19; p = 0.007), while it was lower and not significant between groups (FCT = 0.03; p = 0.215).
To avoid the impact of heterogeneity within locations, we increased the size of the populations and linked them to the administrative division (Vologda region locations were allocated to the northern and southern zones according to the climate boundary). In this case, the fixation index between the groups was significant (FCT = 0.07; p = 0.029) and exceeded the fixation index within populations (FSC = −0.05; p = 0.781) showing a strong population genetic structure at the group scale. As expected, the grouping of populations only by administrative boundaries did not provide evidence of a genetic structure at this level (FCT = −0.10; p = 0.933).
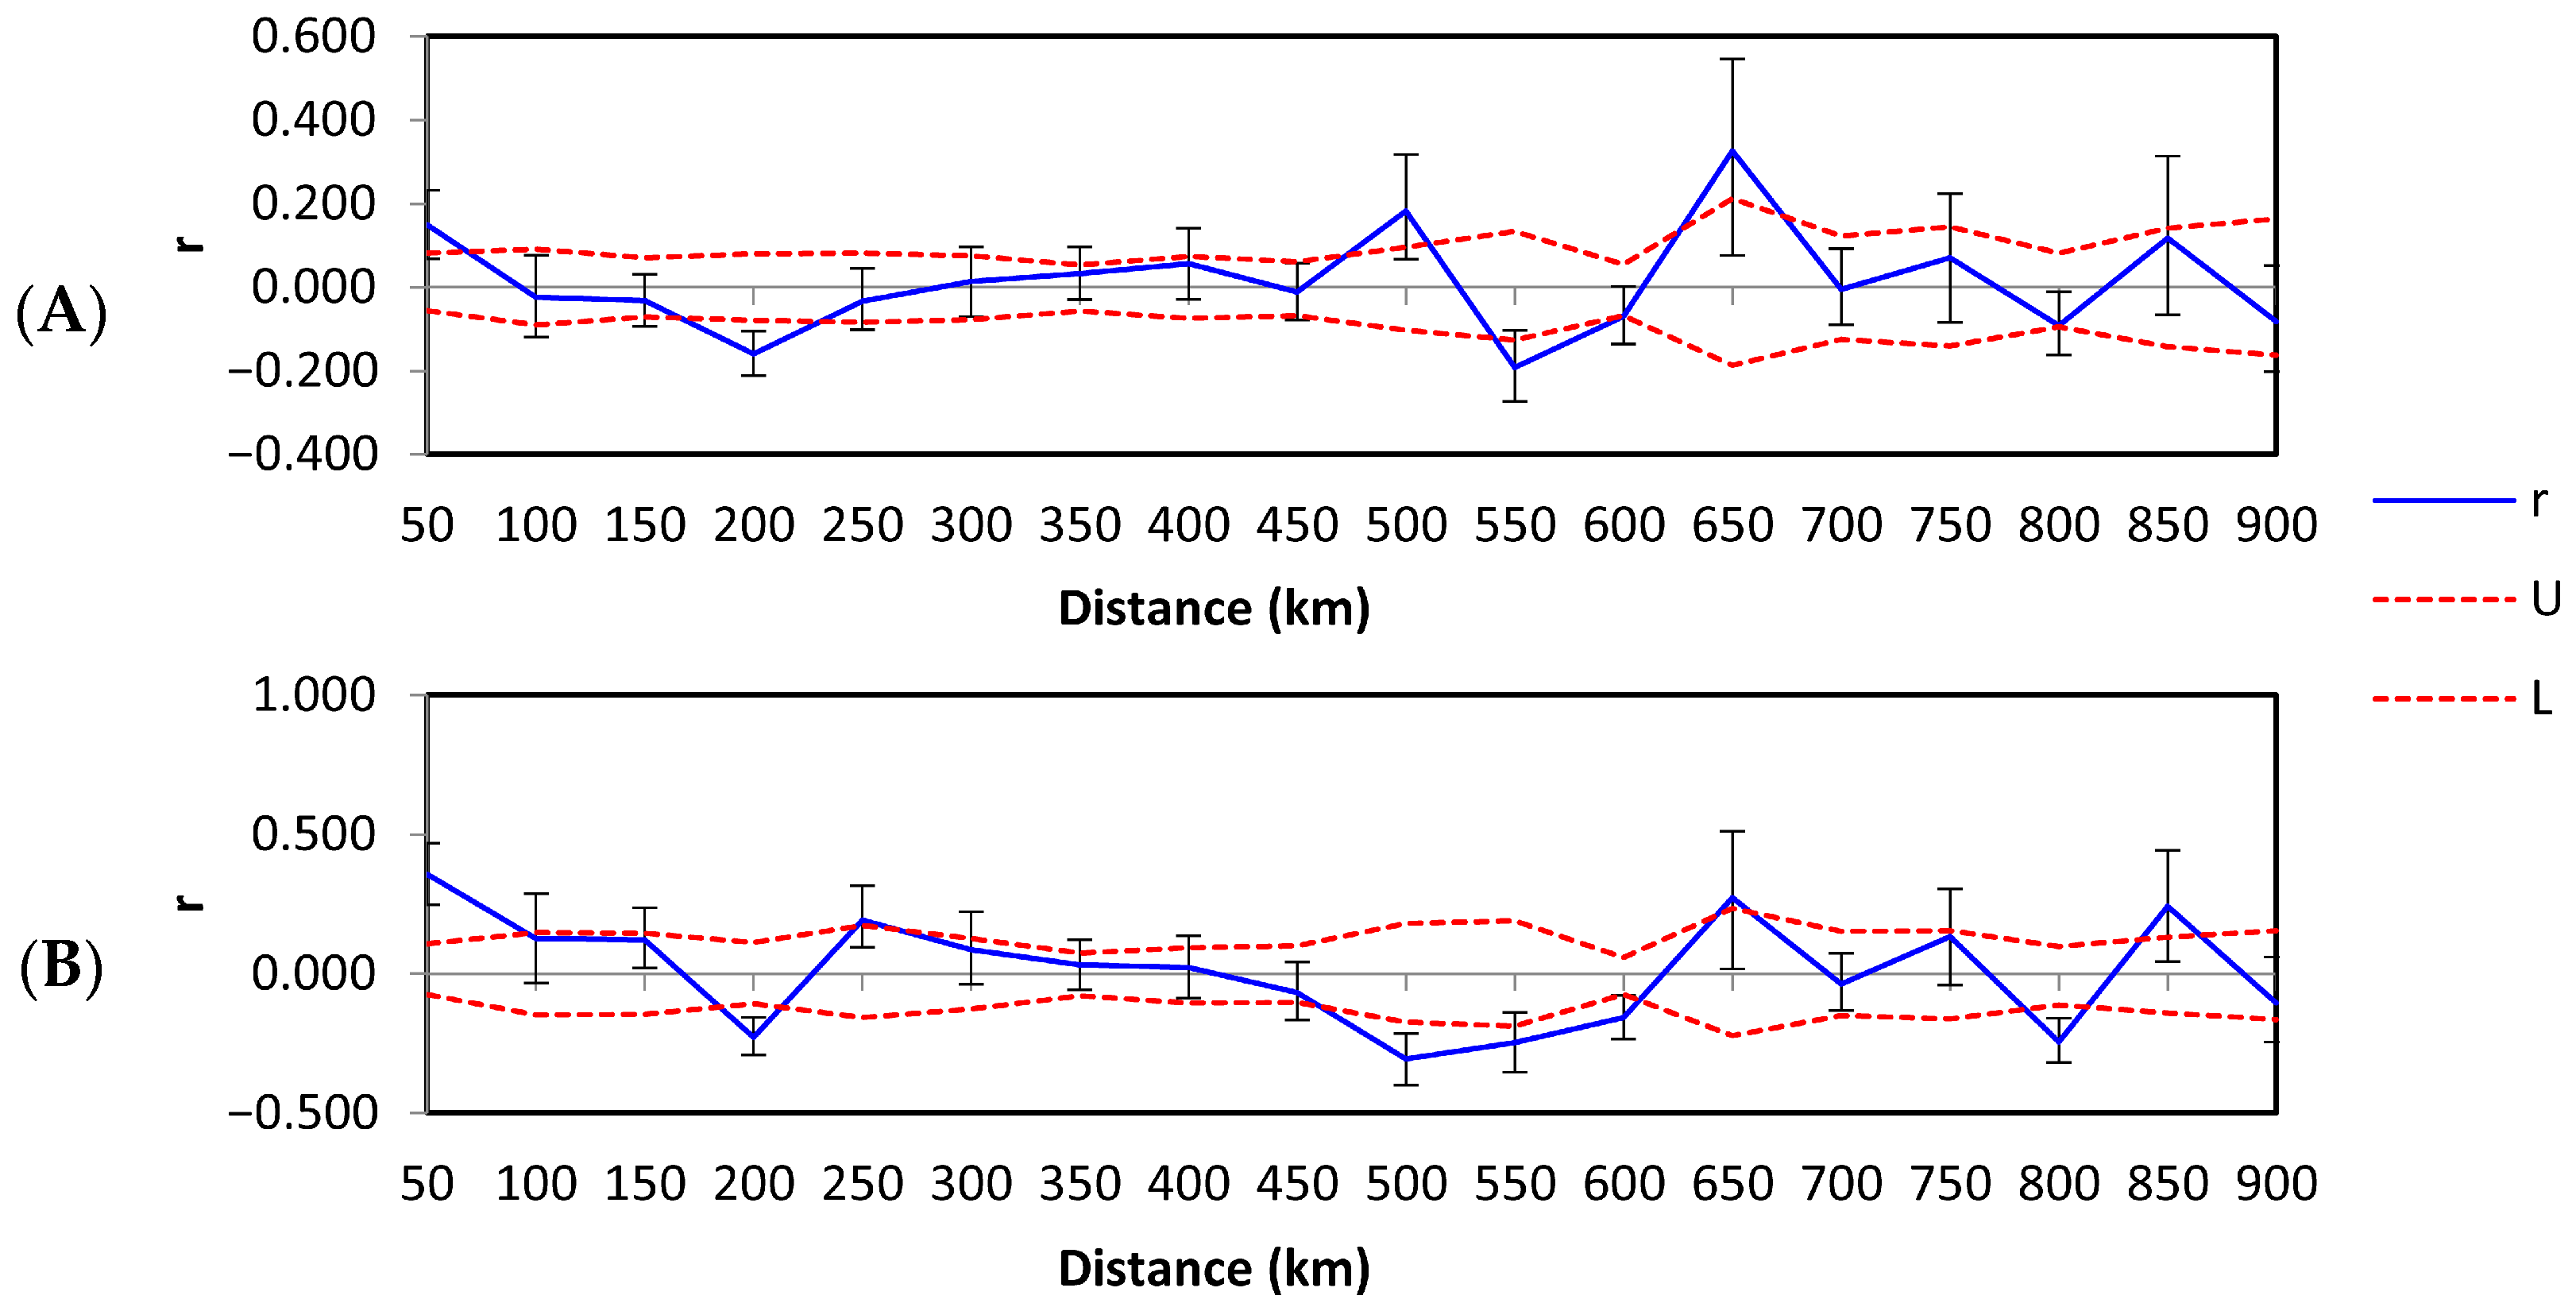
Spatial autocorrelation for all B. pseudobassiana haplotypes across 18 distance classes showed a pattern of decreasing genetic relatedness up to 50 km, with an x-intercept of 93 km (Figure 4A, Table S4). In addition, positive and significant r values were observed at 500 and 650 km, reflecting the presence of non-random genetic structure at these distance classes. To understand the contribution of widespread haplotypes T1B1.1 and T2B1.1 to the spatial autocorrelation values, these haplotypes were separated from the dfc zone dataset to obtain another correlogram (Figure 4B). This resulted in the improvement of r values, which were still significant and positive up to 50 km, but the x-intercept was at 167 km. Further, positive r values still occurred at larger distance classes. The relationship between r and the distance was not significantly negative until 200 km on both plots. The correlograms showed the oscillation of high and low autocorrelation, indicating irregularity of specimen survey due to alternating areas of a high and low density of findings. Although, several signs of positive autocorrelation at a significant distance from each other might be evidence of several independent genetic aggregations.
3.3. Recombination
PHI test based on MLS data of 74 B. pseudobassiana isolates showed strong evidence of recombination (p = 0.007) between the haplotypes across the area of NER studied (Table 2, Table S3). Separate testing of 57 isolates from zone dfc resulted in significance (p = 0.010) and still reflected the recombination process (Table 2). However, the testing of the B. pseudobassiana population from zone dfb did not confirm that the recombination between individuals. Most likely, the results in zone dfb were due to insufficient data. Testing of 10 B. bassiana isolates provided evidence of recombination (p = 0.025). Further testing of B. bassiana in zone dfb did not confirm recombination. Testing of B. bassiana (dfc) and B. caledonica (all areas) did not provide evidence of recombination due to the insufficient informative characters (Table 2, Table S3).
The IAs, showing the degree of linkage between different loci, were calculated for each species separately on the complete and clone-corrected MLS datasets for all populations, as well as for populations in the two climate zones (Table 2, Table S3). IAs estimated for all B. pseudobassiana populations based on the complete dataset showed a moderate linkage disequilibrium significantly different from zero. Nevertheless, after the implementation of datasets with clone-corrected data, the null hypothesis was not rejected, indicating the linkage equilibrium and pointing to the potential existence of genetic recombination within populations of B. pseudobassiana (Table 2).
For the B. bassiana non-clone-corrected datasets, IAs differed significantly from zero in NER and zone dfb populations. This indicates the linkage between loci and thus the absence of sexual reproduction in populations. Other datasets for clone-corrected or zone dfc populations of B. bassiana were insufficient to be analyzed. Genetic recombination between B. caledonica isolates was not tested for the same reasons.
4. Discussion
The 91 fungal Beauveria isolates from northern European Russia included three Beauveria spp.: B. bassiana, B. pseudobassiana, and B. caledonica. Notably, B. brongniartii was not found; however, this species regularly appeared as Beauveria tenella (Sacc.) Siemaszko in the old Russian-language literature devoted to entomopathogens of boreal forests [35]. The existence of B. caledonica and the absence of B. brongniartii in the presented dataset, considering their similar morphological characteristics [1], may reflect incorrect species identification before molecular phylogeny was commonly used in mycological research. We suspect that most of B. brongniartii (=B. tenella) determinations in the earlier Russian literature may actually refer to B. caledonica, which was recently detected in Russia and considered to be quite rare [69].
Intraspecific heterogeneity of Beauveria spp. in the study area made it necessary to more closely examine the data to seek an explanation for this phenomenon. Analysis of biodiversity according to artificial administrative boundaries has widely been used but was not suitable in terms of ecology, especially if we can define any gradient of environmental factor. For these purposes, we divided the survey area north–south by climate zone (dfb and dfc) according to the Köppen-Geiger climate classification. The division was between the warm-summer-humid continental climate and subarctic climate. However, it is possible that a division of the southern and middle boreal forests would be more informative, even though this boundary is relatively close to the boundary between dfb and dfc.
Based on the climate zone division, an uneven distribution of B. bassiana and B. pseudobassiana was revealed. Earlier studies indicated a strong association of B. bassiana with agricultural and B. pseudobassiana with forest ecosystems [24,25]. Our findings were consistent with these reports as the major species in the forest ecosystems were B. pseudobassiana, and the proportion of B. bassiana increased towards the southern (dfb) more agricultural areas (Figure 2B and Figure S3). Other studies have also indicated that B. bassiana is associated with the steppe zone, whereas B. pseudobassiana is more common in forest ecosystems [70]. Although only 10 B. bassiana isolates were obtained during the survey, they were collected from similar spectra of insect orders to B. pseudobassiana.
Sequencing of TEF and Bloc indicated significantly more haplotype richness in B. pseudobassiana (12 haplotypes per 74 isolates) than in B. bassiana (4 haplotypes per 10 isolates). In contrast, phylogenetic studies of Beauveria spp. isolated from soils in Slovakia based on sequencing analysis of ITS and Bloc loci found a limited genetic structure in B. pseudobassiana since one haplotype was found in 47 isolates. In contrast, only a slightly larger number of isolates (56) of B. bassiana had 15 haplotypes [24]. While studying the distribution and genetic diversity of Beauveria spp. in natural and agricultural ecosystems in China based on 641 isolates, 14 haplotypes of B. pseudobassiana and 13 haplotypes of B. bassiana were identified [25]. We found that several haplotypes detected in NER were more abundant and had wide distribution (T1B1.1 and T2B1.1), while others were less frequent and tended to occur mostly in the northern climate zone.
High haplotype diversity of B. bassiana in relatively small areas has been reported frequently [19,20,21,22,23]. For example, Wang et al. [19] characterized 13 haplotypes with the PCR-RFLP of the pr1 virulence-associated gene and 31 haplotypes with microsatellite markers among 77 B. bassiana isolates collected in pine forests in southeast China. Seven SSR markers used to study 81 B. bassiana isolates from Lygus hesperus of San Joaquin Valley (CA, USA) found three to nine distinct alleles [21]. A comparison of such studies is complicated because they were conducted with different molecular approaches and before the division of B. bassiana s.l. into several phylogenetic species.
A teleomorph–anamorph connection was previously reported for B. brongniartii [71]. Currently, there are ten members of genus Beauveria, including B. pseudobassiana, that also have a confirmed sexual reproduction cycle [3,14,16,18,72]. Consistently, our testing of B. bassiana and B. pseudobassiana isolates revealed that sexual or parasexual recombination across NER is possible. Based on our experience and multi-year surveys, there was no evidence of a teleomorph of these species that could be confirmed from the specimens collected. Cordyceps teleomorphs within the Beauveria clade have been mainly reported from East Asia or Amazonia [18]. Whether the putative recombination detected is sexual or parasexual, e.g., during infection of a single arthropod host by several fungal haplotypes, remains to be resolved.
5. Conclusions
The boreal forests of northern European Russia are characterized by low Beauveria species diversity, with only three species (B. caledonica, B. bassiana, and B. pseudobassiana) confirmed by molecular methods. Despite earlier reports of B. brongniartii in northern European Russia, it was not recollected in this more comprehensive study, so these are considered doubtful. Consistent with earlier findings, B. pseudobassiana was more abundant in forest ecosystems, and B. bassiana increased in occurrence towards the more agricultural areas sampled. Significant haplotype diversity in B. pseudobassiana revealed widespread haplotypes and haplotypes that tended to occur in the more northerly areas. Despite the absence of teleomorph specimens in this study, there was molecular clear evidence of intraspecific recombination in B. pseudobassiana and, to a lesser extent, in B. bassiana.
Supplementary Materials
The following are available online at https://0-www-mdpi-com.brum.beds.ac.uk/article/10.3390/microorganisms9071409/s1, Table S1. Beauveria isolates information, Table S2. Accompanying species, Table S3. Haplotype polymorphism and recombination, Table S4. Spatial autocorrelation, Figure S1. Rarefaction curves for Beauveria spp., Figure S2. MLS phylogenetic tree of Beauveria spp., Figure S3. Percent of agricultural lands.
Author Contributions
I.A.K. and G.R.L. contributed equally to all aspects of this study and its reporting. All authors have read and agreed to the published version of the manuscript.
Funding
This research was funded by the Russian Foundation for Basic Research grant number 17-04-00474.
Institutional Review Board Statement
Not applicable.
Informed Consent Statement
Not applicable.
Data Availability Statement
The raw data analyzed during the study are available from the corresponding author on reasonable request. The obtained sequences were submitted in GenBank.
Acknowledgments
We are grateful to Maxim V. Levchenko and Marina V. Sabitova for laboratory assistance and maintaining of culture collection. In addition, we thank Philipp B. Gannibal for his invaluable scientific discussion and advice. Ian T. Riley is thanked for his support in the manuscript preparation.
Conflicts of Interest
The authors declare no conflict of interest.
References
- Rehner, S.A.; Minnis, A.M.; Sung, G.H.; Luangsaard, J.J.; Devotto, L.; Humber, R.A. Phylogeny and systematics of the anamorphic, Entomopathogenic genus Beauveria. Mycologia 2011, 103, 1055–1073. [Google Scholar] [CrossRef] [PubMed]
- Roberts, D.W.; Hajek, A.E. Entomopathogenic fungi as bioinsecticides. In Frontiers in Industrial Mycology; Leatham, G.F., Ed.; Chapman & Hall: New York, NY, USA, 1992; pp. 144–159. [Google Scholar]
- Wang, Y.; Tang, D.X.; Duan, D.E.; Wang, Y.B.; Yu, H. Morphology, molecular characterization, and virulence of Beauveria pseudobassiana isolated from different hosts. J. Invertebr. Pathol. 2020, 172, 107333. [Google Scholar] [CrossRef] [PubMed]
- Vega, F.E.; Posada, F.; Aime, M.C.; Pava-Ripoll, M.; Infante, F.; Rehner, S.A. Entomopathogenic fungal endophytes. Biol. Control 2008, 46, 72–82. [Google Scholar] [CrossRef] [Green Version]
- Faria, M.R.; Wraight, S.P. Mycoinsecticides and mycoacaricides: A comprehensive list with worldwide coverage and international classification of formulation types. Biol. Control. 2007, 43, 237–256. [Google Scholar] [CrossRef]
- Zimmermann, G. Review on safety of the entomopathogenic fungi Beauveria bassiana and Beauveria brongniartii. Biocontrol. Sci. Technol. 2007, 17, 553–596. [Google Scholar] [CrossRef]
- Berestetskiy, A.O.; Ivanova, A.N.; Petrova, M.O.; Prokof’eva, D.S.; Stepanycheva, E.A.; Uspanov, A.M.; Lednev, G.R. Comparative analysis of the biological activity and chromatographic profiles of the extracts of Beauveria bassiana and B. pseudobassiana cultures grown on different nutrient substrates. Microbiology 2018, 87, 200–214. [Google Scholar] [CrossRef]
- Yarrow, P.J. On the mark disease, calcinaccio or muscardine, a disease that affects silk worms. In Phytopathology Classics No 10; Ainsworth, G.C., Yarrow, P.J., Eds.; APS: Baltimore, MD, USA, 1958; pp. 1–49. [Google Scholar]
- MacLeod, D.M. Investigations on the genera Beauveria Vuill. and Tritirachium Limber. Can. J. Bot. 1954, 32, 818–890. [Google Scholar] [CrossRef]
- De Hoog, G.S. The genera Beauveria, Isaria, Tritirachium and Acrodontium gen. nov. Stud. Mycol. 1972, 1, 1–41. [Google Scholar]
- Zhang, S.L.; He, L.M.; Chen, X.; Huang, B. Beauveria lii sp. nov. isolated from Henosepilachna vigintioctopunctata. Mycotaxon 2012, 121, 199–206. [Google Scholar] [CrossRef]
- Agrawal, Y.; Mual, P.; Shenoy, B.D. Multi-gene genealogies reveal cryptic species Beauveria rudraprayagi sp. nov. from India. Mycosphere 2014, 5, 719–736. [Google Scholar] [CrossRef]
- Robène-Soustrade, I.; Jouen, E.; Pastou, D.; Payet-Hoareau, M.; Goble, T.; Linderme, D.; Lefeuvre, P.; Calmès, C.; Reynaud, B.; Nibouche, S.; et al. Description and phylogenetic placement of Beauveria hoplocheli sp. nov. used in the biological control of the sugarcane white grub, Hoplochelus marginalis, in Reunion Island. Mycologia 2015, 107, 1221–1232. [Google Scholar] [CrossRef] [PubMed]
- Ariyawansa, H.A.; Hyde, K.D.; Jayasiri, S.C.; Buyck, B.; Chethana, K.W.T.; Dai, D.Q.; Dai, Y.C.; Daranagama, D.A.; Jaya-wardena, R.S.; Lücking, R.; et al. Fungal diversity notes 111–252—taxonomic and phylogenetic contributions to fungal taxa. Fungal Divers. 2015, 75, 27–274. [Google Scholar] [CrossRef]
- Chen, W.H.; Han, Y.F.; Liang, Z.Q.; Jin, D.C. A new araneogenous fungus in the genus Beauveria from Guizhou, China. Phytotaxa 2017, 302, 57–64. [Google Scholar] [CrossRef] [Green Version]
- Kepler, R.M.; Luangsa-Ard, J.J.; Hywel-Jones, N.L.; Quandt, C.A.; Sung, G.H.; Rehner, S.A.; Aime, M.C.; Henkel, T.W.; Sanjuan, T.; Zare, R.; et al. A phylogenetically-based nomenclature for Cordycipitaceae (Hypocreales). IMA Fungus 2017, 8, 335–353. [Google Scholar] [CrossRef]
- Chen, W.H.; Liu, M.; Huang, Z.X.; Yang, G.M.; Han, Y.F.; Liang, J.D.; Liang, Z.Q. Beauveria majiangensis, a new entomopathogenic fungus from Guizhou, China. Phytotaxa 2018, 333, 243–250. [Google Scholar] [CrossRef] [Green Version]
- Sanjuan, T.; Tabima, J.; Restrepo, S.; Læssøe, T.; Spatafora, J.W.; Franco-Molano, A.E. Entomopathogens of Amazonian stick insects and locusts are members of the Beauveria species complex (Cordyceps sensu stricto). Mycologia 2014, 106, 260–275. [Google Scholar] [CrossRef]
- Wang, C.; Fan, M.; Li, Z.; Butt, T.M. Molecular monitoring and evaluation of the application of the insect-pathogenic fungus Beauveria bassiana in southeast China. J. Appl. Microbiol. 2004, 96, 861–870. [Google Scholar] [CrossRef]
- Devi, K.U.; Reineke, A.; Reddy, N.N.; Rao, C.U.; Padmavathi, J. Genetic diversity, reproductive biology, and speciation in the entomopathogenic fungus Beauveria bassiana (Balsamo) Vuillemin. Genome 2006, 49, 495–504. [Google Scholar] [CrossRef]
- McGuire, M.R.; Ulloa, M.; Park, Y.H.; Hudson, N. Biological and molecular characteristics of Beauveria bassiana isolates from California Lygus hesperus (Hemiptera: Miridae) populations. Biol. Control. 2005, 33, 307–314. [Google Scholar] [CrossRef]
- Yao, J.; Zhang, L.; Chen, X.; Li, Z. A population survey of Beauveria bassiana in the microhabitat of the red turpentine beetle, Dendroctonus valens, in Chinese pine forests. Biocontrol. Sci. Technol. 2012, 22, 1254–1267. [Google Scholar] [CrossRef]
- Cai, Y.; Pu, S.; Nie, Y.; Rehner, S.; Huang, B. Discrimination of Chinese Beauveria strains by DGGE genotyping and taxonomic identification by sequence analysis of the Bloc nuclear intergenic region. Appl. Entomol. Zool. 2013, 48, 255–263. [Google Scholar] [CrossRef]
- Medo, J.; Michalko, J.; Medová, J.; Cagáň, Ľ. Phylogenetic structure and habitat associations of Beauveria species isolated from soils in Slovakia. J. Invertebr. Pathol. 2016, 140, 46–50. [Google Scholar] [CrossRef] [Green Version]
- Imoulan, A.; Wei, X.D.; Wang, W.J.; Li, Y.; Lu, W.L.; Yang, R.H.; Wang, Y.H.; Kirk, P.M.; Meziane, A.E.; Yao, Y.J. Distribution and genetic diversity of Beauveria species at different soil depths in natural and agricultural ecosystems. Mycol. Prog. 2019, 18, 1241–1252. [Google Scholar] [CrossRef]
- Li, Z.Z. List on the insect hosts of Beauveria bassiana. In Study and Application of Entomogenous Fungi in China; Li, Y., Li, Z., Liang, Z., Wu, J., Wu, Z., Xu, Q., Eds.; Academic Periodical Press: Beijing, China, 1988; Volume 1, pp. 241–255. [Google Scholar]
- Cummings, N.J. Entomopathogenic Fungi in New Zealand Native Forests: The Genera Beauveria and Isaria. Ph.D. Thesis, University of Canterbury, Christchurch, New Zealand, 2009. [Google Scholar]
- Bidochka, M.J.; Menzies, F.V.; Kamp, A.M. Genetic groups of the insect-pathogenic fungus Beauveria bassiana are associated with habitat and thermal growth preferences. Arch. Microbiol. 2002, 178, 531–537. [Google Scholar] [CrossRef]
- Coates, B.S.; Hellmich, R.L.; Lewis, L.C. Beauveria bassiana haplotype determination based on nuclear rDNA internal transcribed spacer PCR–RFLP. Mycol. Res. 2002, 106, 40–50. [Google Scholar] [CrossRef] [Green Version]
- Wang, C.; Shah, F.A.; Patel, N.; Li, Z.; Butt, T. Molecular investigation on strain genetic relatedness and population structure of Beauveria bassiana. Environ. Microbiol. 2003, 5, 908–915. [Google Scholar] [CrossRef]
- Aquino de Muro, M.; Mehta, S.; Moore, D. The use of amplified fragment length polymorphism for molecular analysis of Beauveria bassiana isolates from Kenya and other countries, and their correlation with host and geographical origin. FEMS Microbiol. Lett. 2003, 229, 249–257. [Google Scholar] [CrossRef] [Green Version]
- Rehner, S.A.; Buckley, E. A Beauveria phylogeny inferred from nuclear ITS and EF1-alpha sequences: Evidence for cryptic diversification and links to Cordyceps teleomorphs. Mycologia 2005, 97, 84–98. [Google Scholar] [CrossRef]
- Valero-Jiménez, C.A.; Faino, L.; Spring in’t Veld, D.; Smit, S.; Zwaan, B.J.; van Kan, J.A.L. Comparative genomics of Beauveria bassiana: Uncovering signatures of virulence against mosquitoes. BMC Genom. 2016, 17, 986. [Google Scholar] [CrossRef] [Green Version]
- Zhang, Z.; Lu, Y.; Xu, W.; Sui, L.; Du, Q.; Wang, Y.; Zhao, Y.; Li, Q. Influence of genetic diversity of seventeen Beauveria bassiana isolates from different hosts on virulence by comparative genomics. BMC Genom. 2020, 21, 451. [Google Scholar] [CrossRef]
- Evlakhova, A.A. Entomogenous fungi. In Classification, Biology, Practical Significance; “Nauka” Press: Saint Petersburg, Russia, 1974. [Google Scholar]
- Ferron, P. Biological Control of Insect Pests by Entomogenous Fungi. In Annual Review of Entomology; Mittler, T.E., Smith, C.N., Resh, V.H., Eds.; Annual Reviews Inc.: Palo Alto, CA, USA, 1978; Volume 23, pp. 409–442. [Google Scholar]
- Lednev, G.R.; Uspanov, A.M.; Levchenko, M.V.; Sabitova, M.N.; Kamenova, A.S.; Abdukerim, R.; Konurova, D.S.; Duisembekov, B.A.; Kazartsev, I.A. Causative agents of bark beetle mycoses and prospects for their use in the xylophage population control. Plant Protection News 2017, 4, 22–28. [Google Scholar]
- Doyle, J.J.; Doyle, J.L. A rapid DNA isolation procedure for small quantities of fresh leaf tissue. Phytochem. Bull. 1987, 19, 11–15. [Google Scholar]
- Rehner, S.A.; Posada, F.; Buckley, E.P.; Infante, F.; Castillo, A.; Vega, F.E. Phylogenetic origins of African and Neotropical Beauveria bassiana s. l. pathogens of the coffee berry borer, Hypothenemus hampei. J. Invertebr. Pathol. 2006, 93, 11–21. [Google Scholar] [CrossRef] [PubMed]
- Malferrari, G.; Monferini, E.; DeBlasio, P.; Diaferia, G.; Saltini, G.; Del Vecchio, E.; Rossi-Bernardi, L.; Biunno, I. High-quality genomic DNA from human whole blood and mononuclear cells. Biotechniques 2002, 33, 1228–1230. [Google Scholar] [CrossRef] [PubMed] [Green Version]
- Edgar, R.C. MUSCLE: A multiple sequence alignment method with reduced time and space complexity. BMC Bioinform. 2004, 5, 113. [Google Scholar] [CrossRef] [Green Version]
- Kumar, S.; Stecher, G.; Li, M.; Knyaz, C.; Tamura, K. MEGA X: Molecular Evolutionary Genetics Analysis across computing platforms. Mol. Biol. Evol. 2018, 35, 1547–1549. [Google Scholar] [CrossRef] [PubMed]
- Vaidya, G.; Lohman, D.J.; Meier, R. SequenceMatrix: Concatenation software for the fast assembly of multi-gene datasets with character set and codon information. Cladistics 2011, 27, 171–180. [Google Scholar] [CrossRef]
- Darriba, D.; Taboada, G.L.; Doallo, R.; Posada, D. jModelTest 2: More models, new heuristics and parallel computing. Nat. Methods 2012, 9, 772. [Google Scholar] [CrossRef] [Green Version]
- Guindon, S.; Gascuel, O. A simple, fast and accurate method to estimate large phylogenies by maximum-likelihood. Syst. Biol. 2003, 52, 696–704. [Google Scholar] [CrossRef] [Green Version]
- Kimura, M. A simple method for estimating evolutionary rate of base substitutions through comparative studies of nucleotide sequences. Mol. Biol. Evol. 1980, 16, 111–120. [Google Scholar] [CrossRef]
- Tamura, K. Estimation of the number of nucleotide substitutions when there are strong transition-transversion and G + C-content biases. Mol. Biol. Evol. 1992, 9, 678–687. [Google Scholar] [CrossRef] [Green Version]
- Hasegawa, M.; Kishino, H.; Yano, T. Dating of the human-ape splitting by a molecular clock of mitochondrial DNA. J. Mol. Evol. 1985, 22, 160–174. [Google Scholar] [CrossRef]
- R Core Team. R: A Language and Environment for Statistical Computing; R Foundation for Statistical Computing: Vienna, Austria, 2018; Available online: https://cran.r-project.org (accessed on 20 May 2021).
- Revell, L.J. phytools: An R package for phylogenetic comparative biology (and other things). Methods Ecol. Evol. 2012, 3, 217–223. [Google Scholar] [CrossRef]
- Hoang, D.T.; Chernomor, O.; von Haeseler, A.; Minh, B.Q.; Vinh, L.S. UFBoot2: Improving the ultrafast bootstrap approximation. Mol. Biol. Evol. 2018, 35, 518–522. [Google Scholar] [CrossRef]
- Nguyen, L.T.; Schmidt, H.A.; von Haeseler, A.; Minh, B.Q. IQ-TREE: A fast and effective stochastic algorithm for estimating maximum-likelihood phylogenies. Mol. Biol. Evol. 2015, 32, 268–274. [Google Scholar] [CrossRef]
- Nei, M. Molecular Evolutionary Genetics; Columbia Univ. Press: New York, NY, USA, 1987. [Google Scholar]
- Librado, P.; Rozas, J. DNASP V5: A software for comprehensive analysis of DNA polymorphism data. Bioinformatics 2009, 25, 1451–1452. [Google Scholar] [CrossRef] [Green Version]
- Kottek, M.; Grieser, J.; Beck, C.; Rudolf, B.; Rubel, F. World Map of the Köppen-Geiger climate classification updated. Meteorol. Z. 2006, 15, 259–263. [Google Scholar] [CrossRef]
- Excoffier, L.; Lischer, H.E.L. Arlequin suite ver 3.5: A new series of programs to perform population genetics analyses under Linux and Windows. Mol. Ecol. Resour. 2010, 10, 564–567. [Google Scholar] [CrossRef]
- Bruen, T.C.; Philippe, H.; Bryant, D. A simple and robust statistical test for detecting the presence of recombination. Genetics 2006, 172, 2665–2681. [Google Scholar] [CrossRef] [Green Version]
- Huson, D.H.; Bryant, D. Application of Phylogenetic Networks in Evolutionary Studies. Mol. Biol. Evol. 2006, 23, 254–267. [Google Scholar] [CrossRef]
- Faith, D.P. Conservation evaluation and phylogenetic diversity. Biol. Conserv. 1992, 61, 1–10. [Google Scholar] [CrossRef]
- Haubold, H.; Hudson, R.R. LIAN 3.0: Detecting linkage disequilibrium in multilocus data. Bioinformatics 2000, 16, 847–848. [Google Scholar] [CrossRef] [PubMed]
- Carriconde, F.; Gilgado, F.; Arthur, I.; Ellis, D.; Malik, R.; van de Wiele, N.; Robert, V.; Currie, B.J.; Meyer, W. Clonality and α-a recombination in the Australian Cryptococcus gattii VGII population-an emerging outbreak in Australia. PLoS ONE 2011, 6, e16936. [Google Scholar] [CrossRef] [PubMed] [Green Version]
- Peakall, R.; Smouse, P.E. GenAlEx 6.5: Genetic analysis in Excel. Population genetic software for teaching and research—An update. Bioinformatics 2012, 28, 2537–2539. [Google Scholar] [CrossRef] [PubMed] [Green Version]
- Smouse, P.E.; Peakall, R. Spatial autocorrelation analysis of individual multiallele and multilocus genetic structure. Heredity 1999, 82, 561–573. [Google Scholar] [CrossRef] [PubMed] [Green Version]
- Becker, R.A.; Wilks, A.R.; Brownrigg, R.; Minka, T.P.; Deckmyn, A. maps: Draw Geographical Maps. R package version 3.3.0. The Comprehensive R Archive Network (CRAN), 2018. Available online: https://CRAN.R-project.org/package=maps (accessed on 20 May 2021).
- Wickham, H.; Sievert, C. ggplot2: Elegant Graphics for Data Analysis; Springer: New York, NY, USA, 2016. [Google Scholar]
- Lemon, J. Plotrix: A package in the red light district of R. R News 2006, 6, 8–12. [Google Scholar]
- Hsieh, T.C.; Ma, K.H.; Chao, A. iNEXT: An R package for rarefaction and extrapolation of species diversity (Hill numbers). Methods Ecol. Evol. 2016, 7, 1451–1456. [Google Scholar] [CrossRef]
- Chao, A.; Gotelli, N.J.; Hsieh, T.C.; Sander, E.L.; Ma, K.H.; Colwell, R.K.; Ellison, A.M. Rarefaction and extrapolation with Hill numbers: A framework for sampling and estimation in species diversity studies. Ecol. Monogr. 2014, 84, 45–67. [Google Scholar] [CrossRef] [Green Version]
- Sokornova, S.V.; Borisov, B.A.; Lednev, G.R.; Tokarev, Y.S.; Kazartsev, I.A.; Volkova, N.S. The first detection of entomopathogenic fungus Beauveria caledonica in Russia. In Sovremennaya mikologiya v Rossii; Materialy 4-go S’ezda mikologov Rossii: Moscow, Russia, 2017. [Google Scholar]
- Lednev, G.; Tokarev, Y.; Uspanov, A.; Malysh, J.; Duisembekov, B.; Sabitova, M.; Levchenko, M.; Smagulova, S.; Orazova, S.; Amanov, S.; et al. Molecular criteria for screening of Beauveria strains used for insect pest control. J. Biotechnol. 2014, 185, S63–S64. [Google Scholar] [CrossRef]
- Shimazu, M.; Mitsuhashi, W.; Hashimoto, H. Cordyceps brongniartii sp. nov., the teleomorph of Beauveria brongniartii. Trans. Mycol. Soc. Jpn. 1988, 29, 323–330. [Google Scholar]
- Li, Z.; Li, C.; Huang, B.; Fan, M. Discovery and demonstration of the teleomorph of Beauveria bassiana (Bals.) Vuill., an important entomogenous fungus. Chin. Sci. Bull. 2001, 46, 751–753. [Google Scholar] [CrossRef]
Figure 1.
Phylogenetic trees of Beauveria spp. based on the maximum likelihood (ML) analyses of two locus (TEF gene and nuclear intergenic locus Bloc). ML bootstrap values (>50%) are shown at the nodes. Gray and white areas separate alternating alleles. Alleles of each locus are designated with individual index numbers. Beauveria species epithets pseudobassiana, bassiana, and caledonica are indicated with lowercase letters (p, b, and c), TEF and Bloc alleles with capital letters (T and B), and then numbers in order of abundance. Beauveria pseudobassiana was divided into six clades by Bloc, with the subsequent hierarchical allelic assignment.

Figure 2.
Distribution of Beauveria spp. And haplotypes across northern European Russia. (A) Geographical map and specimens’ locations numbered with respect to Table S1. Abbreviations: Arkh—Arkhangelsk, Vg—Vologda, Ng—Novgorod, Ps—Pskov, SPb—St. Petersburg, Pz—Petrozavodsk. (B) Distribution of B. bassiana (bT1B1 to bT4B4) and B. caledonica (cT1B1 to cT1B2) haplotypes. (C) Distribution of B. pseudobassiana haplotypes (pT1B1.1 topT1B6). (D) Distribution of B. pseudobassiana haplotypes (pT2B1.1 to pT4B3). The haplotypes’ designations are derived from Figure 1. Roman numerals correspond to isolating the quantity at that location. The blue line indicates the boundary between the southern and northern climate zones (dfb and dfc) according to the Köppen-Geiger climate classification.

Figure 3.
Rarefaction curves for total species richness (Beauveria spp. and other arthropod-pathogenic species isolated in this study; (A) and for B. pseudobassiana haplotype richness (B) observed in northern European Russia (NER) and the southern (dfb) and northern (dfc) climate zones. Rarefaction curves for B. bassiana and B. caledonica could not be obtained due to insufficient data. Shaded areas on plots correspond to 95% confidence intervals.

Figure 4.
Spatial autocorrelograms of the genetic correlation coefficient (r) as a function of distance for Beauveria pseudobassiana across northern European Russia (A) for all haplotypes and (B) for all haplotypes with the exception of T1B1.1 and T2B1.1 (the most abundant) haplotypes in the dfc climate zone. Dashed lines represent the upper (U) and lower (L) bounds of the 95% confidence intervals about the null hypothesis of random distribution of haplotypes; error bars are bootstrapped 95% confidence intervals within each distance class.


Table 1.
Analysis of molecular variance for B. pseudobassiana using MLS data for different grouping variants. Data were partitioned to test the effect of the genetic structure in the Köppen-Geiger climate zones (dfb and dfc) of northern European Russia by population sizes and administrative boundaries.
| Grouping | Source of Variation | DF 1 | SS | V (%) |
|---|---|---|---|---|
| Group 1: 7 populations from locations 5, 6, 8, and 10–13 Group 2: 17 populations from locations 14–17 and 19–31 | Between groups | 1 | 14.86 | 2.5 |
| Between populations within groups | 22 | 193.80 | 18.3 | |
| Within populations | 50 | 262.32 | 79.2 | |
| Total | 73 | 470.99 | - | |
| FSC: 0.19 (p = 0.007), FST: 0.21 (p = 0.004), and FCT: 0.03 (p = 0.215) | ||||
| Group 1: Leningrad Reg. (locations 10 and 13); Pskov Reg. (locations 6, 11, and 12); Novgorod Reg. (location 5); Vologda Reg. (south, location 8) Group 2: Arkhangelsk Reg. (locations 15, 19, and 24–31); R. of Karelia (locations 16, 17, and 20–23); Vologda Reg. (north, location 14) | Between groups | 1 | 14.86 | 7.0 |
| Between populations within groups | 5 | 18.19 | −5.0 | |
| Within populations | 67 | 437.94 | 98.0 | |
| Total | 73 | 470.99 | - | |
| FSC: −0.05 (p = 0.781), FST: 0.02 (p = 0.648), and FCT: 0.07 (p = 0.029) | ||||
| Group 1: Arkhangelsk Reg. (locations 15, 19, and 24–31) Group 2: R. of Karelia (locations 16, 17, and 20–23) Group 3: Vologda Reg. (locations 8 and 14) Group 4: Pskov Reg. (locations 6, 11, and 12) Group 5: Novgorod Reg.(location 5) Group 6: Leningrad Reg. (locations 10 and 13) | Between groups | 5 | 25.68 | −9.6 |
| Between populations within groups | 18 | 182.98 | 27.5 | |
| Within populations | 50 | 262.32 | 82.1 | |
| Total | 73 | 470.99 | - | |
| FSC: 0.25 (p = 0.001), FST: 0.18 (p = 0.005), and FCT: −0.10 (p = 0.933) | ||||
1 DF, degrees of freedom; SS, sum of squares; V (%), percent variation; R, Republic; Reg, Region.
Table 2.
Estimates of recombination of Beauveria bassiana and B. pseudobassiana. Estimates for B. caledonica were not possible due to insufficient informative characters.
Table 2.
Estimates of recombination of Beauveria bassiana and B. pseudobassiana. Estimates for B. caledonica were not possible due to insufficient informative characters.
| Parameter | Dfb 1 | Dfc | NER |
|---|---|---|---|
| Beauveria pseudobassiana | |||
| PHI test 2 | no recombination | recombination ** | recombination ** |
| IAs NCC 3 | 0.2928 ** | 0.2290 *** | 0.1970 *** |
| IAs CC | −0.0667 | −0.0874 | −0.0860 |
| Beauveria bassiana | |||
| PHI test | no recombination | n/p | recombination * |
| IAs NCC | 1.0741 ** | n/p | 1.0455 *** |
| IAs CC | n/p | n/p | n/p |
1 Abbreviations: dfb—warm-summer-humid continental climate zone; dfc—subarctic climate zone; NER—northern European Russia; NCC—non-clone-corrected data; CC—clone corrected data; n/p—not possible: calculation not done because of an insufficiently large dataset; 2 PHI (Φw, pairwise homoplasy index) test (Bruen et al., 2006) was calculated with SplitsTree 4 software (Huson, Bryant, 2006); 3 indexes of association (IAs) for non-clone-corrected and clone corrected data were calculated with LIAN 3.5 (Haubold, Hudson, 2000); significance values for the PHI test and IAs are as follows: * p < 0.05; ** p < 0.01; *** p < 0.001.
Publisher’s Note: MDPI stays neutral with regard to jurisdictional claims in published maps and institutional affiliations. |
© 2021 by the authors. Licensee MDPI, Basel, Switzerland. This article is an open access article distributed under the terms and conditions of the Creative Commons Attribution (CC BY) license (https://creativecommons.org/licenses/by/4.0/).
Share and Cite
MDPI and ACS Style
Kazartsev, I.A.; Lednev, G.R. Distribution and Diversity of Beauveria in Boreal Forests of Northern European Russia. Microorganisms 2021, 9, 1409. https://0-doi-org.brum.beds.ac.uk/10.3390/microorganisms9071409
AMA Style
Kazartsev IA, Lednev GR. Distribution and Diversity of Beauveria in Boreal Forests of Northern European Russia. Microorganisms. 2021; 9(7):1409. https://0-doi-org.brum.beds.ac.uk/10.3390/microorganisms9071409
Chicago/Turabian StyleKazartsev, Igor A., and Georgy R. Lednev. 2021. "Distribution and Diversity of Beauveria in Boreal Forests of Northern European Russia" Microorganisms 9, no. 7: 1409. https://0-doi-org.brum.beds.ac.uk/10.3390/microorganisms9071409
Note that from the first issue of 2016, this journal uses article numbers instead of page numbers. See further details here.