
Shiga Toxin-Producing Escherichia coli Outbreaks in the United States, 2010–2017


Abstract
:1. Introduction
2. Materials and Methods
2.1. Surveillance
2.2. Definitions
2.3. Analysis
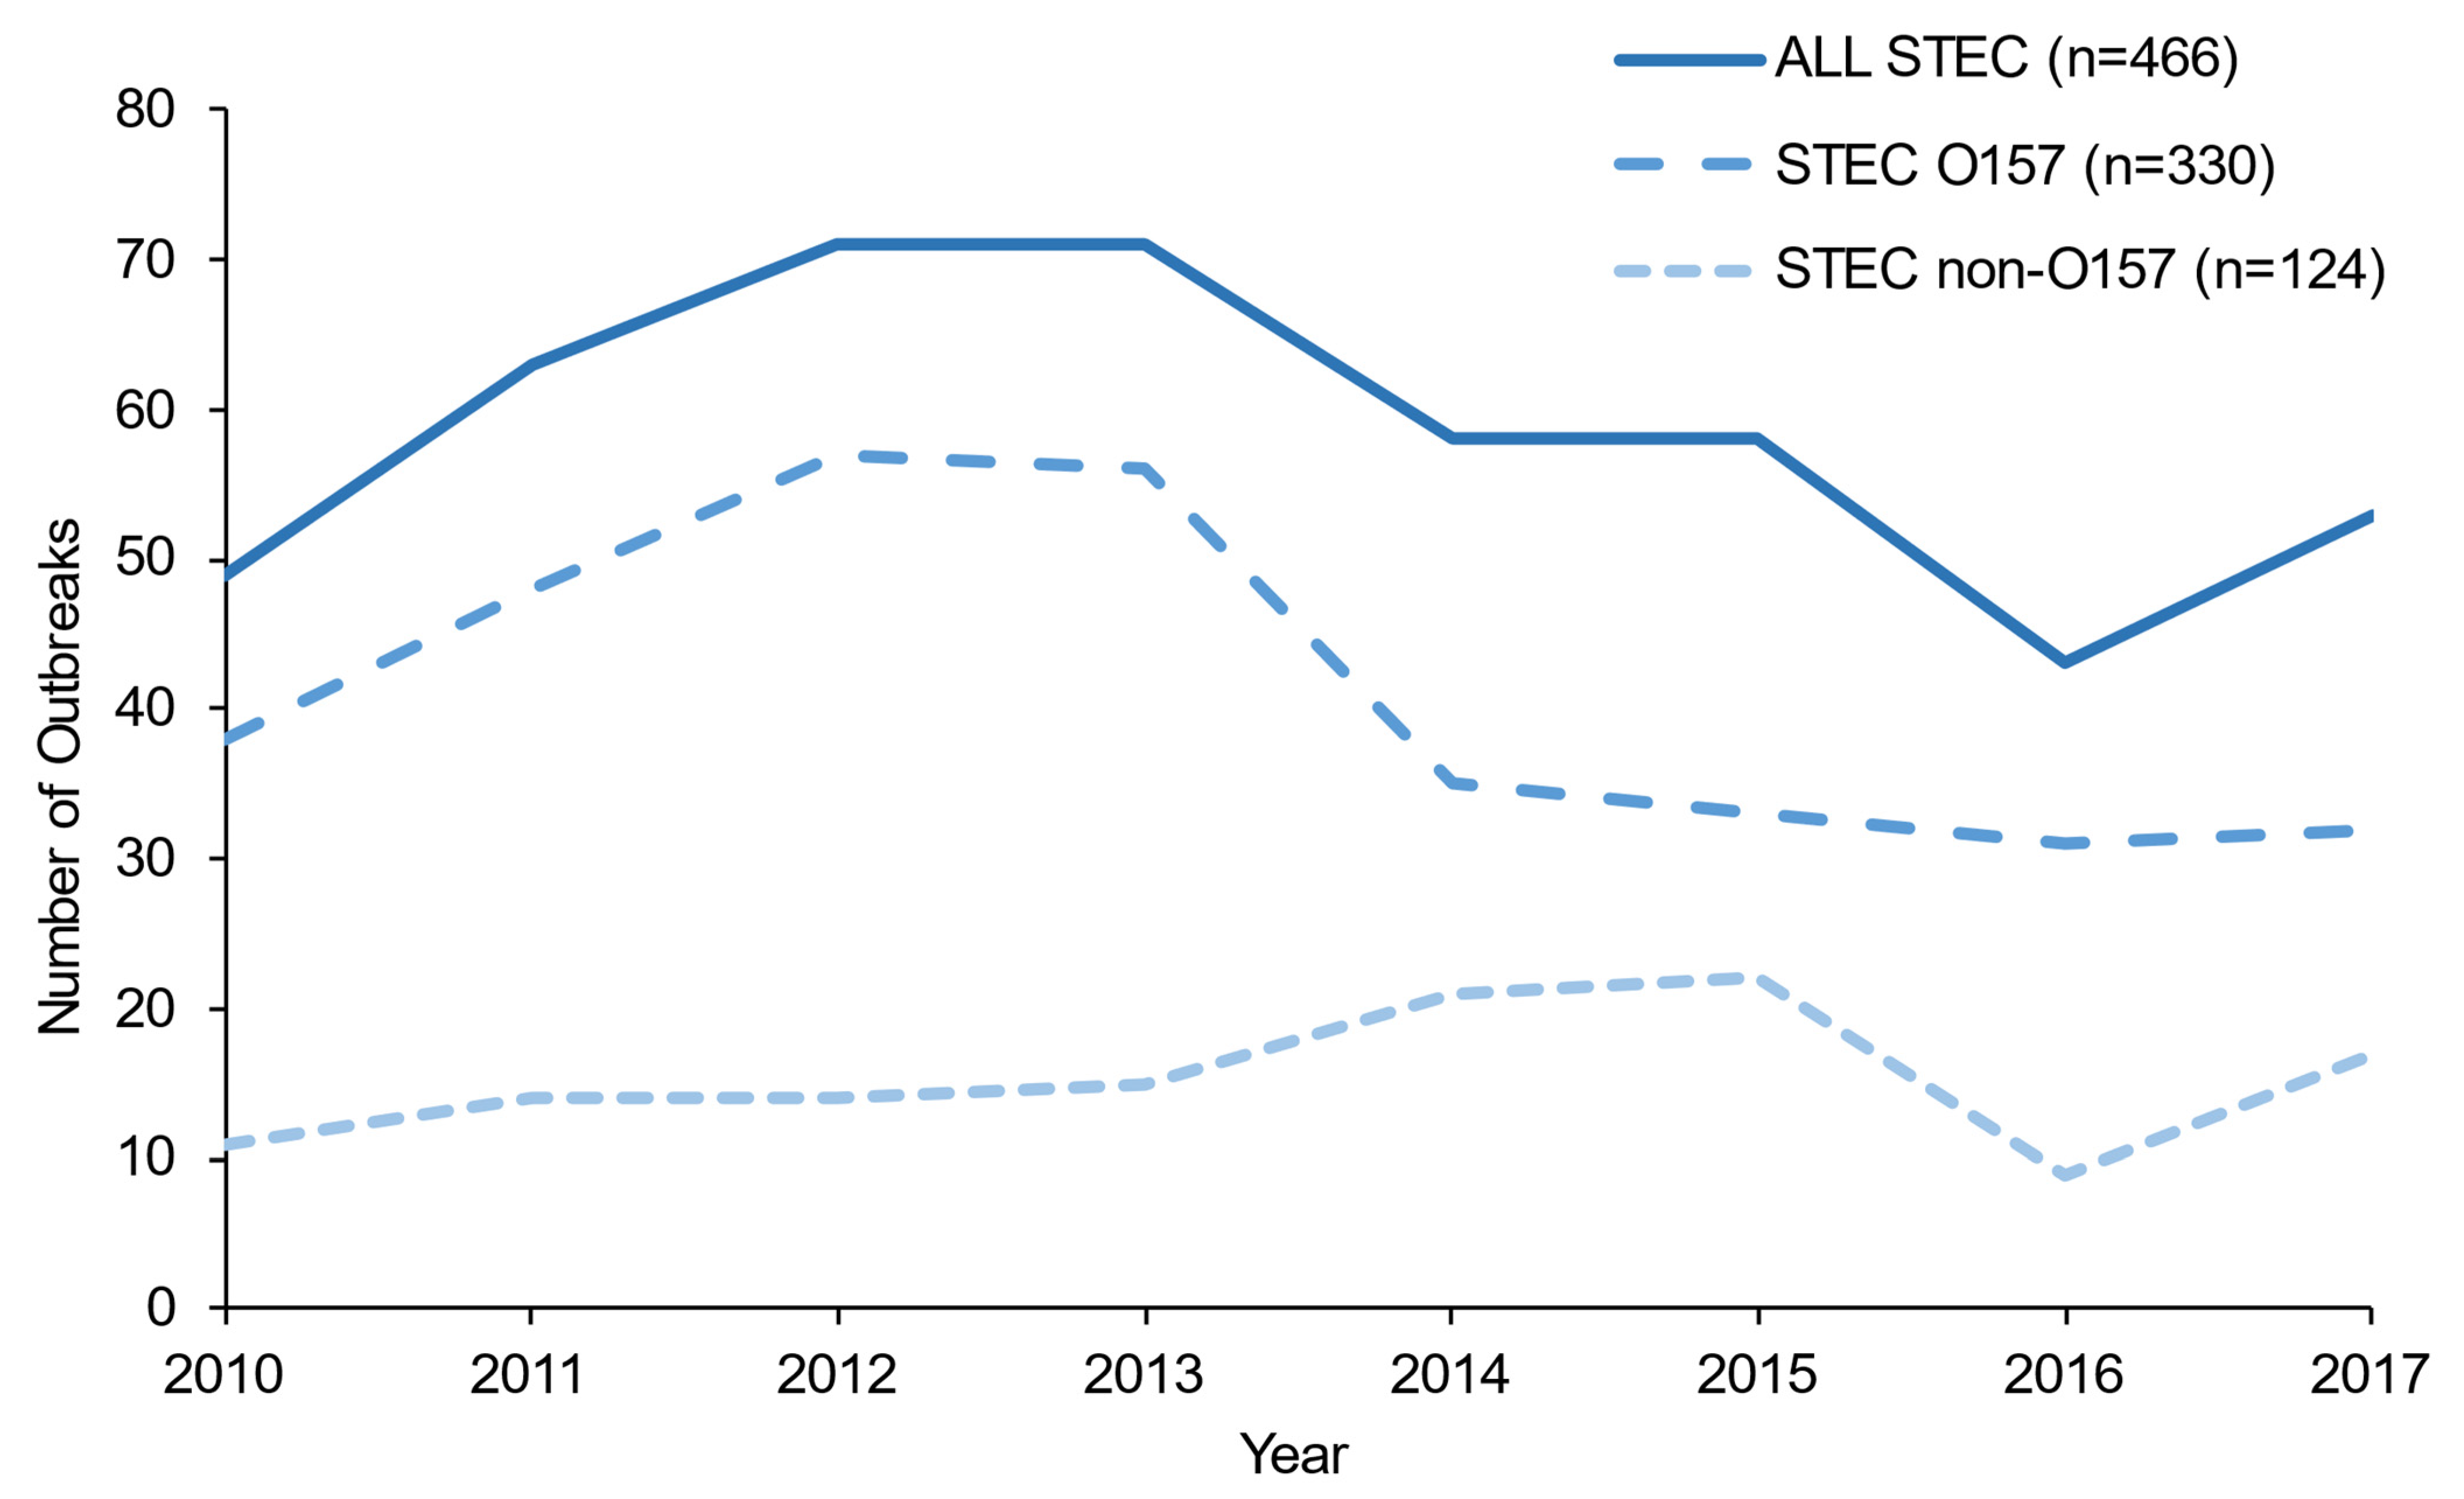
3. Results
3.1. Sources
3.2. Severity
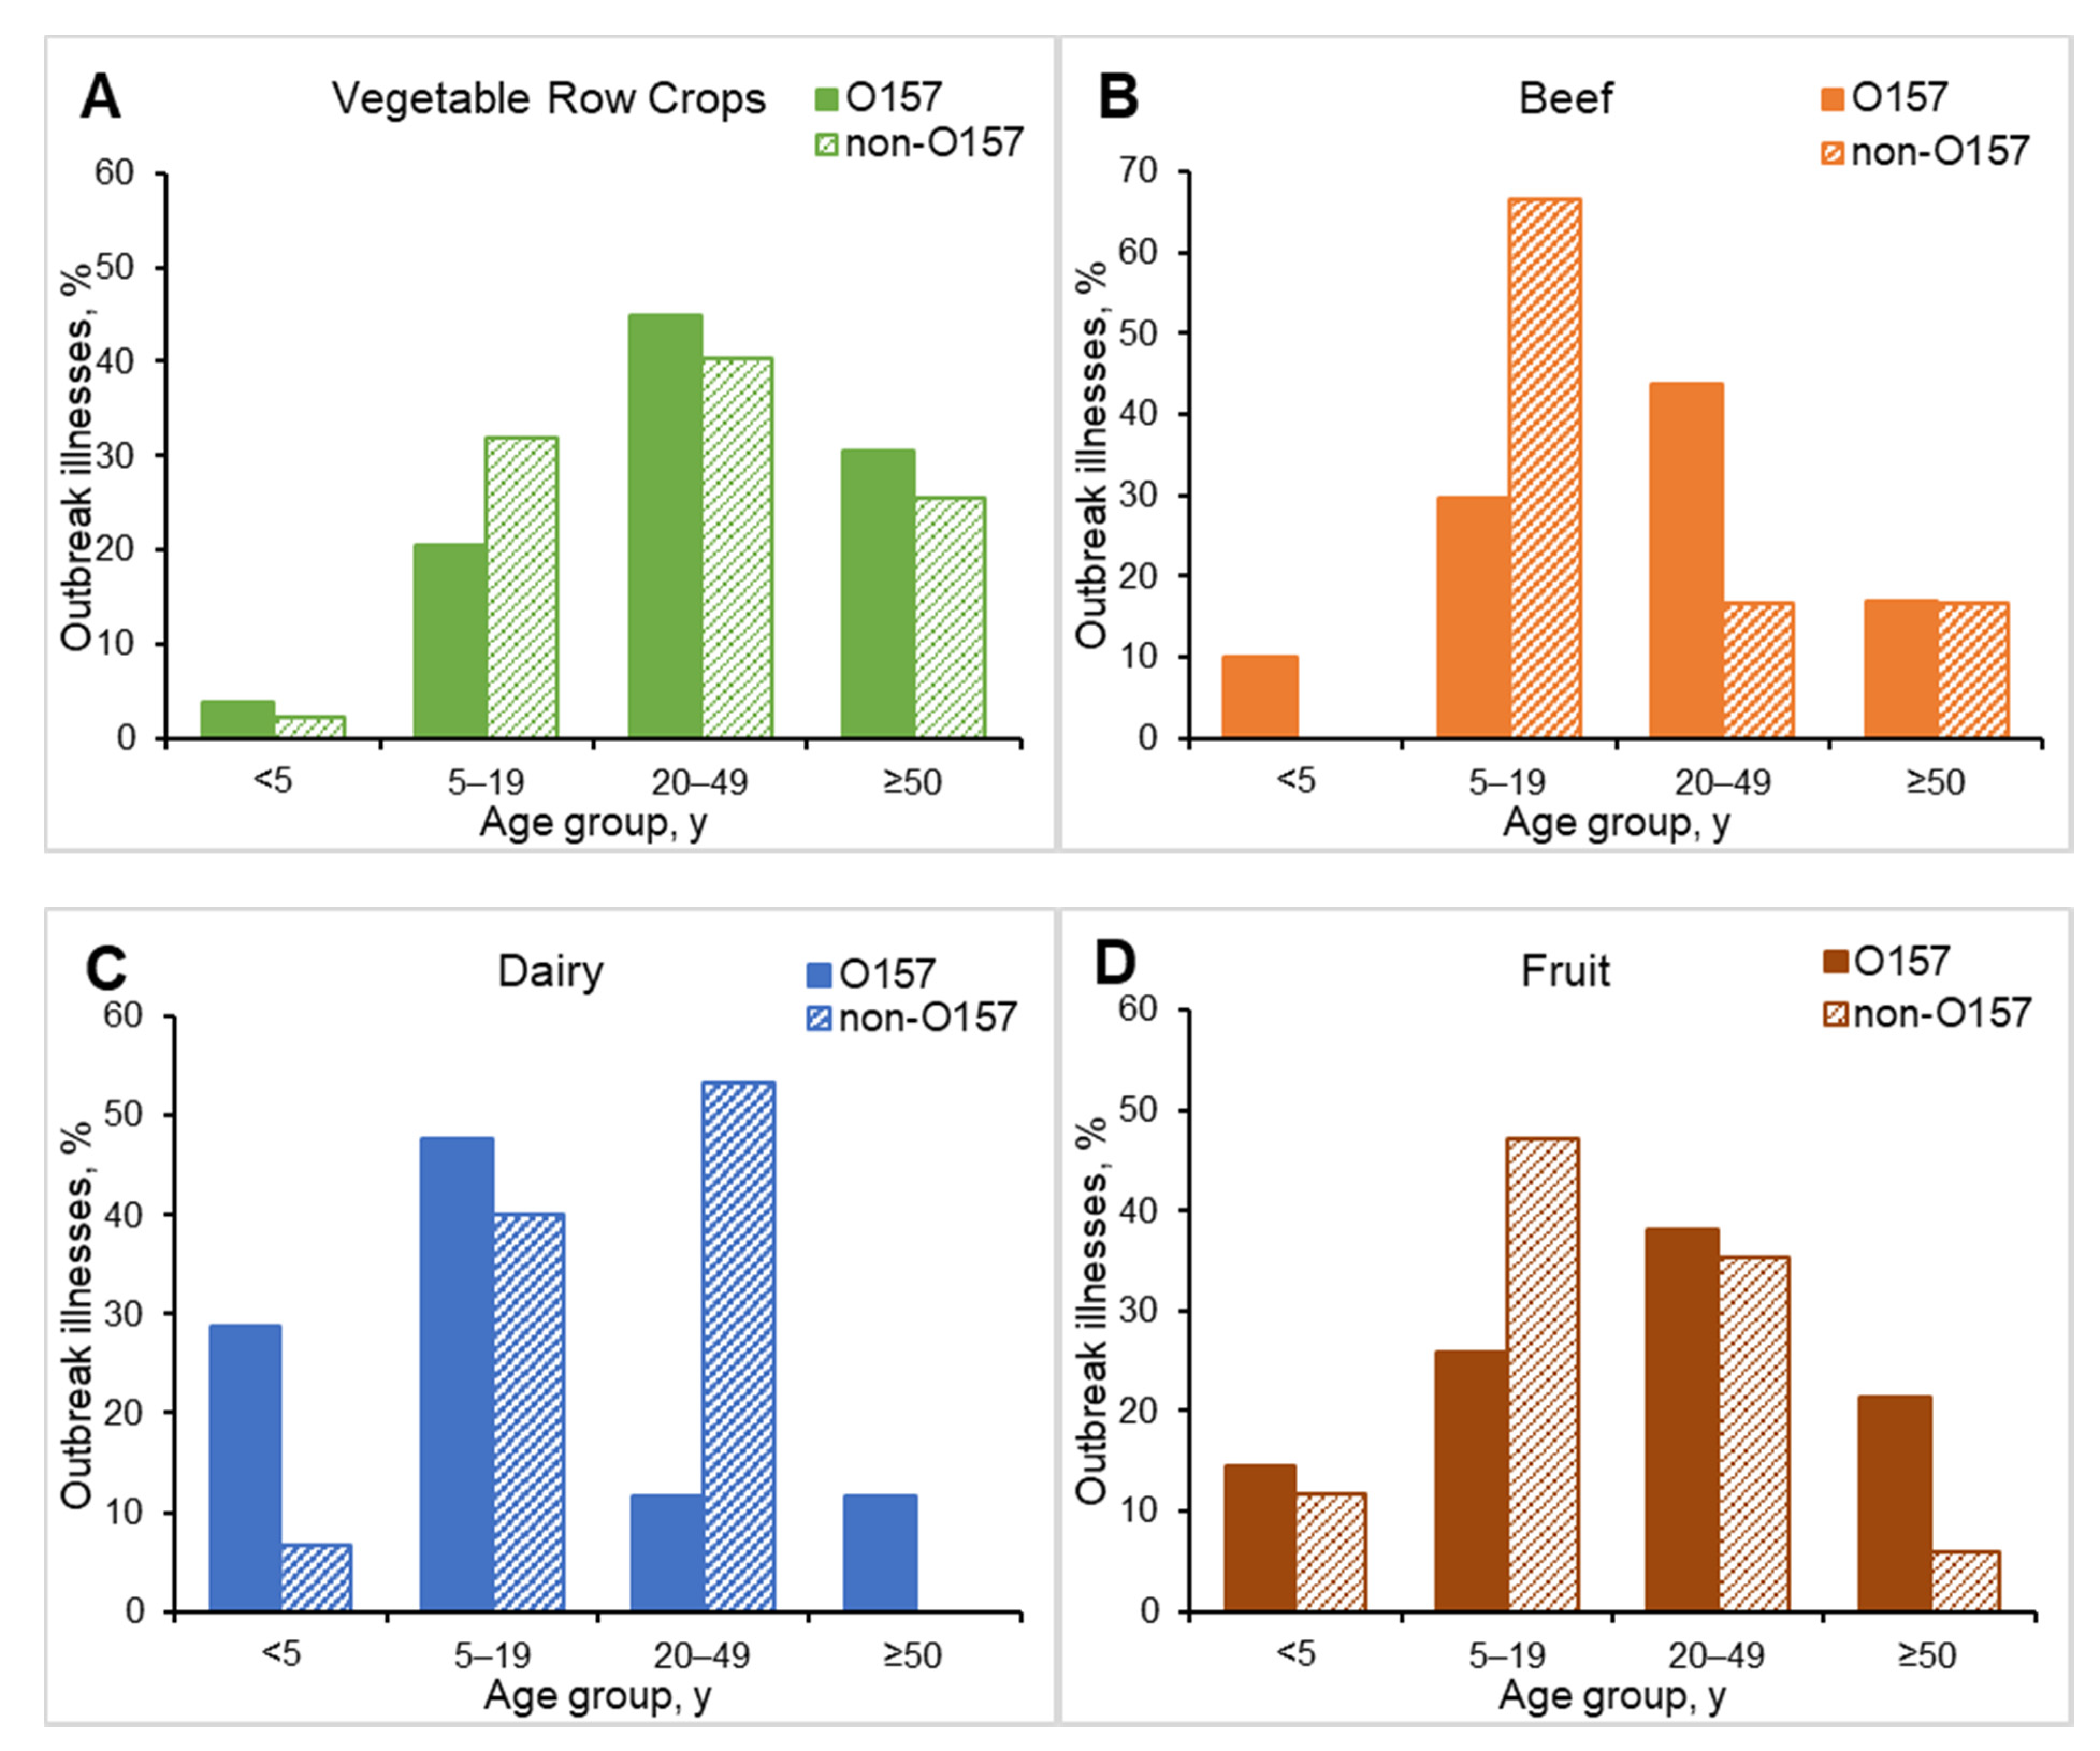
3.3. Demographic Characteristics
3.4. Seasonality and Geography
3.5. Settings
4. Discussion
Author Contributions
Funding
Institutional Review Board Statement
Informed Consent Statement
Data Availability Statement
Acknowledgments
Conflicts of Interest
Disclaimer
References
- Scallan, E.; Hoekstra, R.M.; Angulo, F.J.; Tauxe, R.V.; Widdowson, M.-A.; Roy, S.L.; Jones, J.L.; Griffin, P.M. Foodborne Illness Acquired in the United States—Major Pathogens. Emerg. Infect. Dis. 2011, 17, 7–15. [Google Scholar] [CrossRef]
- Griffin, P.M.; Tauxe, R.V. The Epidemiology of Infections Caused by Escherichia coli O157: H7, Other Enterohemorrhagic E. coli, and the Associated Hemolytic Uremic Syndrome. Epidemiol. Rev. 1991, 13, 60–98. [Google Scholar] [CrossRef] [PubMed]
- Gould, L.H.; Bopp, C.; Strockbine, N.; Atkinson, R.; Baselski, V.; Body, B.; Carey, R.; Crandall, C.; Hurd, S.; Kaplan, R.; et al. Recommendations for diagnosis of Shiga toxin--producing Escherichia coli infections by clinical laboratories MMWR Recomm Rep. Clin. Microbiol. Newsl. 2009, 34, 75–83. [Google Scholar]
- Gould, L.H.; Mody, R.K.; Ong, K.L.; Clogher, P.; Cronquist, A.B.; Garman, K.N.; Lathrop, S.; Medus, C.; Spina, N.L.; Webb, T.H.; et al. Increased recognition of non-O157 Shiga toxin-producing Escherichia coli infections in the United States during 2000-2010: Epidemiologic features and comparison with E. coli O157 infections. Foodborne Pathog. Dis. 2013, 10, 453–460. [Google Scholar] [CrossRef] [PubMed]
- Hoefer, D.; Hurd, S.; Medus, C.; Cronquist, A.; Hanna, S.; Hatch, J.; Hayes, T.; Larson, K.; Nicholson, C.; Wymore, K.; et al. Laboratory practices for the identification of Shiga toxin-producing Escherichia coli in the United States, FoodNet sites, 2007. Foodborne Pathog. Dis. 2011, 8, 555–560. [Google Scholar] [CrossRef]
- Marder, M.E.P.; Griffin, P.M.; Cieslak, P.R.; Dunn, J.; Hurd, S.; Jervis, R.; Lathrop, S.; Muse, A.; Ryan, P.; Smith, K.; et al. Preliminary Incidence and Trends of Infections with Pathogens Transmitted Commonly Through Food–Foodborne Diseases Active Surveillance Network, 10 U.S. Sites, 2006–2017. MMWR Morb. Mortal Wkly. Rep. 2018, 67, 324–328. [Google Scholar] [CrossRef] [PubMed]
- Stigi, K.A.; Macdonald, J.K.; Tellez-Marfin, A.A.; Lofy, K.H. Laboratory Practices and Incidence of Non-O157 Shiga toxin–producingEscherichia coliInfections. Emerg. Infect. Dis. 2012, 18, 477–479. [Google Scholar] [CrossRef]
- Iwamoto, M.; Huang, J.Y.; Cronquist, A.B.; Medus, C.; Hurd, S.; Zansky, S.; Dunn, J.; Woron, A.M.; Oosmanally, N.; Griffin, P.M.; et al. Bacterial enteric infections detected by culture-independent diagnostic tests—FoodNet, United States, 2012–2014. MMWR Morb. Mortal Wkly Rep. 2015, 64, 252–257. [Google Scholar]
- Centers for Disease Control and Prevention (CDC). Vital signs: Incidence and trends of infection with pathogens transmitted commonly through food—Foodborne Diseases Active Surveillance Network, 10 U.S. sites, 1996–2010. MMWR Morb. Mortal Wkly. Rep. 2011, 60, 749–755. [Google Scholar]
- Heiman, K.E.; Mody, R.K.; Johnson, S.D.; Griffin, P.M.; Gould, L.H. Escherichia coliO157 Outbreaks in the United States, 2003–2012. Emerg. Infect. Dis. 2015, 21, 1293–1301. [Google Scholar] [CrossRef]
- Luna-Gierke, R.E.; Griffin, P.M.; Gould, L.H.; Herman, K.; Bopp, C.A.; Strockbine, N.; Mody, R.K. Outbreaks of non-O157 Shiga toxin-producingEscherichia coliinfection: USA. Epidemiol. Infect. 2014, 142, 2270–2280. [Google Scholar] [CrossRef]
- Centers for Disease Control and Prevention. National Outbreak Reporting System, about NORS. Available online: https://www.cdc.gov/nors/about.html (accessed on 4 November 2019).
- Richardson, L.C.; Bazaco, M.C.; Parker, C.C.; Dewey-Mattia, D.; Golden, N.; Jones, K.; Klontz, K.; Travis, C.; Kufel, J.Z.; Cole, D. An updated scheme for categorizing foods implicated in foodborne disease outbreaks: A tri-agency collaboration. Foodborne Pathog. Dis. 2017, 14, 701–710. [Google Scholar] [CrossRef]
- US Food and Drug Administration. FSMA Final Rule on Produce Safety. Standards for the Growing, Harvesting, Packing, and Holding of Produce for Human Consumption. Available online: https://www.fda.gov/food/food-safety-modernization-act-fsma/fsma-final-rule-produce-safety (accessed on 4 November 2019).
- California Leafy Greens Marketing Agreement. New, More Stringent Food Safety Practices Adopted to Prevent Outbreaks. 2019. Available online: https://lgma.ca.gov/news/new-more-stringent-food-safety-practices-adopted-to-prevent-outbreaks (accessed on 19 April 2019).
- Arizona Leafy Greens Marketing Agreement. Commodity Specific Food Safety Guidelines for the Production and Harvest of Lettuce and Leafy Greens; Report No 12. 2019. Available online: https://www.arizonaleafygreens.org/guidelines (accessed on 19 April 2019).
- Manage, D.P.; Lauzon, J.; Jones, C.M.; Ward, P.J.; Pilarski, L.M.; Pilarski, P.M.; McMullen, L.M. Detection of pathogenic Escherichia coli on potentially contaminated beef carcasses using cassette PCR and conventional PCR. BMC Microbiol. 2019, 19, 175. [Google Scholar] [CrossRef] [Green Version]
- Boerlin, P.; McEwen, S.A.; Boerlin-Petzold, F.; Wilson, J.B.; Johnson, R.P.; Gyles, C.L. Associations between Virulence Factors of Shiga Toxin-Producing Escherichia coli and Disease in Humans. J. Clin. Microbiol. 1999, 37, 497–503. [Google Scholar] [CrossRef] [Green Version]
- Ostroff, S.M.; Tarr, P.I.; Neill, M.A.; Lewis, J.H.; Hargrett-Bean, N.; Kobayashi, J.M. Toxin genotypes and plasmid profiles as determinants of systemic sequelae in Escherichia coli O157:H7 infections. J. Infect. Dis. 1989, 160, 994–998. [Google Scholar] [CrossRef]
- Petro, C.D.; Trojnar, E.; Sinclair, J.; Liu, Z.-M.; Smith, M.; O’Brien, A.D.; Melton-Celsa, A. Shiga toxin type 1a (Stx1a) reduces the toxicity of the more potent Stx2a in vivo and in vitro. Infect. Immun. 2019, 87, e00787-18. [Google Scholar] [CrossRef] [Green Version]
- Centers for Disease Control and Prevention (CDC). National Shiga Toxin-Producing Escherichia coli (STEC) Surveillance Annual Report, 2016; US Department of Health and Human Services, CDC: Atlanta, GA, USA, 2018. [Google Scholar]
- Ekiri, A.B.; Landblom, D.; Doetkott, D.; Olet, S.; Shelver, W.L.; Khaitsa, M.L. Isolation and characterization of Shiga toxin–producing Escherichia coli serogroups O26, O45, O103, O111, O113, O121, O145, and O157 shed from range and feedlot cattle from postweaning to slaughter. J. Food Prot. 2014, 77, 1052–1061. [Google Scholar] [CrossRef]
- Cull, C.A.; Renter, D.G.; Dewsbury, D.M.; Noll, L.W.; Shridhar, P.B.; Ives, S.E.; Nagaraja, T.G.; Cernicchiaro, N. Feedlot- and pen-level prevalence of enterohemorrhagic Escherichia coli in feces of commercial feedlot cattle in two major U.S. cattle feeding areas. Foodborne Pathog. Dis. 2017, 14, 309–317. [Google Scholar] [CrossRef]
- Brooks, J.T.; Sowers, E.G.; Wells, J.G.; Greene, K.D.; Griffin, P.M.; Hoekstra, R.M.; Strockbine, N.A. Non-O157 Shiga toxin–producing Escherichia coli infections in the United States, 1983–2002. J. Infect. Dis. 2005, 192, 1422–1429. [Google Scholar] [CrossRef] [PubMed] [Green Version]
- Strockbine, N. (Centers for Disease Control and Prevention, Atlanta, GA, USA). Personal communication,. 2021. [Google Scholar]
- Tseng, M.; Sha, Q.; Rudrik, J.T.; Collins, J.D.; Henderson, T.R.; Funk, J.A.; Manning, S. Increasing incidence of non-O157 Shiga toxin-producing Escherichia coli (STEC) in Michigan and association with clinical illness. Epidemiol. Infect. 2016, 144, 1394–1405. [Google Scholar] [CrossRef] [PubMed] [Green Version]
- Gould, L.H.; Demma, L.; Jones, T.F.; Hurd, S.; Vugia, D.J.; Smith, K.; Shiferaw, B.; Segler, S.; Palmer, A.; Zansky, S.; et al. Hemolytic uremic syndrome and death in persons with Escherichia coli O157:H7 infection, foodborne diseases active surveillance network sites, 2000–2006. Clin. Infect. Dis. 2009, 49, 1480–1485. [Google Scholar] [CrossRef] [Green Version]
- Dewsbury, D.M.; Renter, D.G.; Shridhar, P.B.; Noll, L.W.; Shi, X.; Nagaraja, T.G.; Cernicchiaro, N. Summer and winter prevalence of Shiga toxin-producing Escherichia coli (STEC) O26, O45, O103, O111, O121, O145, and O157 in feces of feedlot cattle. Foodborne Pathog. Dis. 2015, 12, 726–732. [Google Scholar] [CrossRef] [PubMed]
- Smith, R.; Cahn, M.; Daugovish, O.; Koike, S.; Natwick, E.; Smith, H.; Subbarao, K.; Takele, E.; Turini, T. Leaf lettuce production in California. The Regents of the University of California Agriculture and Natural Resources Publication, Vegetable Production Series; 7216; UC Vegetable Research and Information Center: Richmond, CA, USA, 2011; pp. 1–6. [Google Scholar] [CrossRef]
- Sodha, S.V.; Heiman, K.; Gould, L.H.; Bishop, R.; Iwamoto, M.; Swerdlow, D.L.; Griffin, P.M. National patterns of Escherichia coli O157 infections, USA, 1996–2011. Epidemiol. Infect. 2015, 143, 267–273. [Google Scholar] [CrossRef] [PubMed]
- Pires, S.M.; Majowicz, S.; Gill, A.; Devleesschauwer, B. Global and regional source attribution of Shiga toxin-producing Escherichia coli infections using analysis of outbreak surveillance data. Epidemiol. Infect. 2019, 147, e236. [Google Scholar] [CrossRef] [Green Version]


| STEC | Serogroup Category | Top non-O157 Serogroups | |||||||||||
|---|---|---|---|---|---|---|---|---|---|---|---|---|---|
| Total † | O157 | Non-O157 ‡ | p | O26 | O111 | O121 | |||||||
| Transmission source | No. | (%) | No. | (%) | No. | (%) | No. | (%) | No. | (%) | No. | (%) | |
| Food | 200 | (43) | 146 | (44) | 51 | (41) | 0.55 | 18 | (40) | 7 | (30) | 8 | (50) |
| Veg. row crops | 32 | (16) | 24 | (16) | 8 | (16) | 0.90 | 3 | (16) | 2 | (29) | 0 | (0) |
| Beef | 26 | (13) | 24 | (16) | 2 | (4) | 0.02 | 1 | (6) | 0 | (0) | 0 | (0) |
| Dairy | 19 | (10) | 15 | (10) | 3 | (6) | 0.35 | 1 | (6) | 1 | (14) | 0 | (0) |
| Fruit | 8 | (4) | 6 | (4) | 2 | (4) | 0.95 | 0 | (0) | 1 | (14) | 0 | (0) |
| Other foods § | 42 | (21) | 29 | (20) | 12 | (24) | 0.58 | 1 | (6) | 1 | (14) | 5 | (63) |
| Unknown | 73 | (37) | 48 | (32) | 24 | (47) | 0.07 | 12 | (66) | 2 | (29) | 3 | (37) |
| Person-to-person | 87 | (19) | 54 | (16) | 29 | (24) | 0.08 | 14 | (30) | 8 | (33) | 3 | (19) |
| Animal contact | 49 | (11) | 36 | (11) | 11 | (9) | 0.53 | 4 | (9) | 3 | (13) | 0 | (0) |
| Water | 20 | (4) | 13 | (4) | 6 | (5) | 0.67 | 0 | (0) | 2 | (8) | 2 | (13) |
| Other environmental | 5 | (1) | 5 | (2) | 0 | (0) | 0.33 ¶ | 0 | (0) | 0 | (0) | 0 | (0) |
| Unknown transmission | 105 | (23) | 76 | (23) | 26 | (21) | 0.64 | 9 | (20) | 4 | (17) | 3 | (19) |
| TOTAL | 466 | (100) | 330 | (71) | 123 | (26) | NA | 45 | (36) | 24 | (20) | 16 | (13) |
| Transmission Mode and Source | Illnesses No. (Median Size) | Hospitalizations No. (%) | HUS * No. (%) | Deaths No. (%) | ||||||||||||||||||||
|---|---|---|---|---|---|---|---|---|---|---|---|---|---|---|---|---|---|---|---|---|---|---|---|---|
| All STEC † | O157 | Non-O157 | All STEC † | O157 | Non-O157 | All STEC † | O157 | Non-O157 | ALL STEC † | O157 | Non-O157 | |||||||||||||
| Food | 2853 | (7.5) | 2017 | (8) | 567 | (6) | 776 | (27) § | 597 | (30) # | 139 | (25) | 137 | (5) ¶ | 112 | (6) ** | 7 | (1) | 12 | (0.4) | 11 | (0.5) | 1 | (0.2) |
| Veg. row crops | 738 | (15.5) | 613 | (15) | 125 | (16) | 223 | (30) | 183 | (30) | 40 | (32) | 31 | (4) | 27 | (4) | 4 | (3) | 2 | (0.3) | 2 | (0.3) | 0 | (0) |
| Beef | 211 | (7.5) | 200 | (8) | 11 | (6) | 60 | (28) | 57 | (29) | 3 | (27) | 2 | (1) ¶ | 2 | (1) | 0 | (0) | 1 | (0.5) | 1 | (0.5) | 0 | (0) |
| Dairy | 148 | (5) | 119 | (4) | 15 | (6) | 57 | (39) § | 49 | (41) # | 1 | (7) | 19 | (13) § | 16 | (13) | 0 | (0) | 0 | NA | 0 | (0) | 0 | (0) |
| Fruit | 106 | (6.5) | 89 | (7) | 17 | (9) | 24 | (23) | 23 | (26) | 1 | (6) | 3 | (3) | 3 | (3) | 0 | (0) | 2 | (1.9) § | 2 | (2.2) | 0 | (0) |
| Other foods ‡ | 738 | (10.5) | 507 | (12) | 220 | (13) | 195 | (26) | 144 | (28) | 47 | (21) | 33 | (4) | 30 | (6) # | 3 | (1) | 1 | (0.1) | 0 | (0) | 1 | (0.5) |
| Unknown | 912 | (4) | 489 | (4) | 179 | (4) | 217 | (24) | 141 | (29) | 47 | (26) | 49 | (5) | 34 | (7) ** | 0 | (0) | 6 | (0.4) | 6 | (1) | 0 | (0) |
| Person-to-person | 587 | (5) | 293 | (4) | 269 | (6) | 70 | (12) ¶ | 68 | (23) ** | 1 | (0.4) | 36 | (6) | 36 | (12) ** | 0 | (0) | 3 | (0.5) | 3 | (1) | 0 | (0) |
| Animal contact | 509 | (4) | 387 | (4) | 68 | (4) | 100 | (20) ¶ | 81 | (21) | 12 | (18) | 48 | (9) § | 44 | (11) # | 1 | (2) | 3 | (0.6) | 3 | (0.8) | 0 | (0) |
| Water | 218 | (6.5) | 181 | (8) | 31 | (5) | 46 | (21) | 42 | (23) | 4 | (13) | 21 | (10) § | 19 | (11) | 2 | (7) | 1 | (0.5) | 1 | (0.6) | 0 | (0) |
| Other environmental | 86 | (6) | 86 | (6) | 0 | NA | 13 | (15) ¶ | 13 | (15) | NA | 5 | (6) | 5 | (6) | NA | 0 | (0) | 0 | (0) | NA | |||
| Unknown transmission | 516 | (3) | 389 | (3) | 112 | (4) | 158 | (31) § | 138 | (36) ** | 16 | (14) | 56 | (11) § | 46 | (12) | 8 | (7) | 5 | (1) | 4 | (1) | 1 | (0.9) |
| TOTAL | 4769 | (5) | 3353 | (5) | 1047 | (5) | 1163 | (24) | 939 | (28)** | 172 | (16) | 303 | (6) | 262 | (8) ** | 18 | (2) | 24 | (0.5) | 22 | (0.7) | 2 | (0.2) |
Publisher’s Note: MDPI stays neutral with regard to jurisdictional claims in published maps and institutional affiliations. |
© 2021 by the authors. Licensee MDPI, Basel, Switzerland. This article is an open access article distributed under the terms and conditions of the Creative Commons Attribution (CC BY) license (https://creativecommons.org/licenses/by/4.0/).
Share and Cite
Tack, D.M.; Kisselburgh, H.M.; Richardson, L.C.; Geissler, A.; Griffin, P.M.; Payne, D.C.; Gleason, B.L. Shiga Toxin-Producing Escherichia coli Outbreaks in the United States, 2010–2017. Microorganisms 2021, 9, 1529. https://0-doi-org.brum.beds.ac.uk/10.3390/microorganisms9071529
Tack DM, Kisselburgh HM, Richardson LC, Geissler A, Griffin PM, Payne DC, Gleason BL. Shiga Toxin-Producing Escherichia coli Outbreaks in the United States, 2010–2017. Microorganisms. 2021; 9(7):1529. https://0-doi-org.brum.beds.ac.uk/10.3390/microorganisms9071529
Chicago/Turabian StyleTack, Danielle M., Hannah M. Kisselburgh, LaTonia C. Richardson, Aimee Geissler, Patricia M. Griffin, Daniel C. Payne, and Brigette L. Gleason. 2021. "Shiga Toxin-Producing Escherichia coli Outbreaks in the United States, 2010–2017" Microorganisms 9, no. 7: 1529. https://0-doi-org.brum.beds.ac.uk/10.3390/microorganisms9071529