
Validation of a Commercial Collar-Based Sensor for Monitoring Eating and Ruminating Behaviour of Dairy Cows


Abstract
:Simple Summary
Abstract
1. Introduction
2. Materials and Methods
2.1. Animals and Experimental Setup
2.2. Activity Sensors
2.3. Behavioural Observations
2.4. Data Preparation and Statistical Analysis
3. Results
4. Discussion
5. Conclusions
Author Contributions
Funding
Institutional Review Board Statement
Data Availability Statement
Acknowledgments
Conflicts of Interest
References
- Lovarelli, D.; Bacenetti, J.; Guarino, M. A review on dairy cattle farming: Is precision livestock farming the compromise for an environmental, economic and social sustainable production? J. Clean Prod. 2020, 262, 121409. [Google Scholar] [CrossRef]
- Stygar, A.H.; Gómez, Y.; Berteselli, G.V.; Dalla Costa, E.; Canali, E.; Niemi, J.K.; Llonch, P.; Pastell, M. A systematic review on commercially available and validated sensor technologies for welfare assessment of dairy cattle. Front. Vet. Sci. 2021, 8, 177. [Google Scholar] [CrossRef]
- Shalloo, L.; O’Donovan, M.; Leso, L.; Werner, J.; Ruelle, E.; Geoghegan, A.; Delaby, L.; O’Leary, N. Review: Grass-based dairy systems, data and precision technologies. Animal 2018, 12, s262–s271. [Google Scholar] [CrossRef] [Green Version]
- Rutten, C.J.; Velthuis, A.G.J.; Steeneveld, W.; Hogeveen, H. Invited review: Sensors to support health management on dairy farms. J. Dairy Sci. 2013, 96, 1928–1952. [Google Scholar] [CrossRef]
- DeVries, T.J.; Von Keyserlingk, M.A.G.; Weary, D.M.; Beauchemin, K.A. Validation of a system for monitoring feeding behavior of dairy cows. J. Dairy Sci. 2003, 86, 3571–3574. [Google Scholar] [CrossRef] [Green Version]
- Chizzotti, M.L.; Machado, F.S.; Valente, E.E.L.; Pereira, L.G.R.; Campos, M.M.; Tomich, T.R.; Coelho, S.G.; Ribas, M.N. Validation of a system for monitoring individual feeding behavior and individual feed intake in dairy cattle. J. Dairy Sci. 2015, 98, 3438–3442. [Google Scholar] [CrossRef]
- Lohölter, M.; Rehage, R.; Meyer, U.; Lebzien, P.; Rehage, J.; Dänicke, S. Evaluation of a device for continuous measurement of rumen pH and temperature considering localization of measurement and dietary concentrate proportion. Appl. Agric. Forestry Res. 2013, 63, 61–68. [Google Scholar] [CrossRef]
- O’Leary, N.; Leso, L.; Buckley, F.; Kenneally, J.; McSweeney, D.; Shalloo, L. Validation of an Automated Body Condition Scoring System Using 3D Imaging. Agriculture 2020, 10, 246. [Google Scholar] [CrossRef]
- Hoffmann, G.; Schmidt, M.; Ammon, C.; Rose-Meierhöfer, S.; Burfeind, O.; Heuwieser, W.; Berg, W. Monitoring the body temperature of cows and calves using video recordings from an infrared thermography camera. Vet. Res. Commun. 2013, 37, 91–99. [Google Scholar] [CrossRef] [PubMed]
- Borchers, M.R.; Chang, Y.M.; Tsai, I.C.; Wadsworth, B.A.; Bewley, J.M. A validation of technologies monitoring dairy cow feeding, ruminating, and lying behaviors. J. Dairy Sci. 2016, 99, 7458–7466. [Google Scholar] [CrossRef]
- Grinter, L.N.; Campler, M.R.; Costa, J.H.C. Validation of a behavior-monitoring collar’s precision and accuracy to measure rumination, feeding, and resting time of lactating dairy cows. J. Dairy Sci. 2019, 102, 3487–3494. [Google Scholar] [CrossRef] [Green Version]
- Kröger, I.; Humer, E.; Neubauer, V.; Kraft, N.; Ertl, P.; Zebeli, Q. Validation of a noseband sensor system for monitoring ruminating activity in cows under different feeding regimens. Livest. Sci. 2016, 193, 118–122. [Google Scholar] [CrossRef]
- Norring, M.; Häggman, J.; Simojoki, H.; Tamminen, P.; Winckler, C.; Pastell, M. Lameness impairs feeding behavior of dairy cows. J. Dairy Sci. 2014, 97, 4317–4321. [Google Scholar] [CrossRef] [PubMed]
- González, L.A.; Tolkamp, B.J.; Coffey, M.P.; Ferret, A.; Kyriazakis, I. Changes in feeding behavior as possible indicators for the automatic monitoring of health disorders in dairy cows. J. Dairy Sci. 2008, 91, 1017–1028. [Google Scholar] [CrossRef] [PubMed] [Green Version]
- Cocco, R.; Canozzi, M.E.A.; Fischer, V. Rumination time as an early predictor of metritis and subclinical ketosis in dairy cows at the beginning of lactation: Systematic review-meta-analysis. Prev. Vet. Med. 2021, 189, 105309. [Google Scholar] [CrossRef] [PubMed]
- DeVries, T.J.; Beauchemin, K.A.; Dohme, F.; Schwartzkopf-Genswein, K.S. Repeated ruminal acidosis challenges in lactating dairy cows at high and low risk for developing acidosis: Feeding, ruminating, and lying behavior. J. Dairy Sci. 2009, 92, 5067–5078. [Google Scholar] [CrossRef] [PubMed] [Green Version]
- Müschner-Siemens, T.; Hoffmann, G.; Ammon, C.; Amon, T. Daily rumination time of lactating dairy cows under heat stress conditions. J. Therm. Bio. 2020, 88, 102484. [Google Scholar] [CrossRef] [PubMed]
- Büchel, S.; Sundrum, A. Decrease in rumination time as an indicator for the onset of calving. J. Dairy Sci. 2014, 97, 3120–3127. [Google Scholar] [CrossRef] [Green Version]
- Thorup, V.M.; Nielsen, B.L.; Robert, P.E.; Giger-Reverdin, S.; Konka, J.; Michie, C.; Friggens, N.C. Lameness affects cow feeding but not rumination behavior as characterized from sensor data. Front. Vet. Sci. 2016, 3, 37. [Google Scholar] [CrossRef] [Green Version]
- R Core Team. R: A Language and Environment for Statistical Computing; R Foundation for Statistical Computing: Vienna, Austria, 2019; Available online: https://www.R.-project.org/ (accessed on 19 April 2021).
- Rook, A.J.; Huckle, C.A. Activity bout criteria for grazing dairy cows. Appl. Anim. Behav. Sci. 1997, 54, 89–96. [Google Scholar] [CrossRef]
- Tolkamp, B.J.; Allcroft, D.J.; Austin, E.J.; Nielsen, B.L.; Kyriazakis, I. Satiety splits feeding behaviour into bouts. J. Theor. Biol. 1998, 194, 235–250. [Google Scholar] [CrossRef]
- DeVries, T.J.; Von Keyserlingk, M.A.G.; Weary, D.M.; Beauchemin, K.A. Measuring the feeding behavior of lactating dairy cows in early to peak lactation. J. Dairy Sci. 2003, 86, 3354–3361. [Google Scholar] [CrossRef]
- Fraley, C.; Raftery, A.E.; Scrucca, L.; Murphy, T.B.; Fop, M. mclust: Gaussian Mixture Modelling for Model-Based Clustering, Classification, and Density Estimation. R Package Version 5.4. 2020. Available online: https://cran.r-project.org/web/packages/mclust/index.html (accessed on 15 July 2021).
- Gamer, M.; Lemon, J.; Fellows, I.; Singh, P. irr: Various Coefficients of Interrater Reliability and Agreement. R Package Version 0.84.1. 2019. Available online: https://CRAN.R-project.org/package=irr (accessed on 15 July 2021).
- McHugh, M.L. Interrater reliability: The kappa statistic. Biochem. Med. 2012, 22, 276–282. [Google Scholar] [CrossRef]
- Stevenson, M.; Sergeant, E. epiR: Tools for the Analysis of Epidemiological Data. R Package Version 2.0.26. 2021. Available online: https://CRAN.R-project.org/package=epiR (accessed on 15 July 2021).
- Hinkle, D.E.; Wiersma, W.; Jurs, S.G. Applied Statistics for the Behavioral Sciences, 5th ed.; Houghton Mifflin: Boston, MA, USA, 2003. [Google Scholar]
- Lehnert, B. BlandAltmanLeh: Plots (Slightly Extended) Bland-Altman Plots. R Package Version 0.3.1. 2015. Available online: https://CRAN.R-project.org/package=BlandAltmanLeh (accessed on 15 July 2021).
- Bland, J.M.; Altman, D.G. Comparing methods of measurement: Why plotting difference against standard method is misleading. Lancet 1995, 346, 1085–1087. [Google Scholar] [CrossRef] [Green Version]
- Giavarina, D. Understanding Bland Altman analysis. Biochem. Med. 2015, 25, 141–151. [Google Scholar] [CrossRef] [Green Version]
- Bates, D.; Maechler, M.; Bolker, B.; Walker, S. Fitting Linear Mixed-Effects Models Using lme4. J. Stat. Softw. 2015, 67, 1–48. [Google Scholar] [CrossRef]
- Lenth, R. emmeans: Estimated Marginal Means, aka Least-Squares Means. R Package Version 1.4.1. 2019. Available online: https://CRAN.R-project.org/package=emmeans (accessed on 15 July 2021).
- Beauchemin, K.A. Invited review: Current perspectives on eating and rumination activity in dairy cows. J. Dairy Sci. 2018, 101, 4762–4784. [Google Scholar] [CrossRef] [PubMed] [Green Version]
- Pahl, C.; Hartung, E.; Mahlkow-Nerge, K.; Haeussermann, A. Feeding characteristics and rumination time of dairy cows around estrus. J. Dairy Sci. 2015, 98, 148–154. [Google Scholar] [CrossRef] [PubMed] [Green Version]
- Tafaj, M.; Maulbetsch, A.; Zebeli, Q.; Steingaß, H.; Drochner, W. Effects of physically effective fibre concentration of diets consisting of hay and slowly degradable concentrate on chewing activity in mid lactation dairy cows under constant intake level. Arch. Anim. Nutr. 2005, 59, 313–324. [Google Scholar] [CrossRef] [PubMed]
- Werner, J.; Leso, L.; Umstatter, C.; Niederhauser, J.; Kennedy, E.; Geoghegan, A.; Shalloo, L.; Schick, M.; O’Brien, B. Evaluation of the RumiWatchSystem for measuring grazing behaviour of cows. J. Neurosci. Methods 2018, 300, 138–146. [Google Scholar] [CrossRef] [PubMed]
- Bikker, J.P.; Van Laar, H.; Rump, P.; Doorenbos, J.; Van Meurs, K.; Griffioen, G.M.; Dijkstra, J. Evaluation of an ear-attached movement sensor to record cow feeding behavior and activity. J. Dairy Sci. 2014, 97, 2974–2979. [Google Scholar] [CrossRef]
- Zehner, N.; Umstätter, C.; Niederhauser, J.J.; Schick, M. System specification and validation of a noseband pressure sensor for measurement of ruminating and eating behavior in stable-fed cows. Comput. Electron. Agric. 2017, 136, 31–41. [Google Scholar] [CrossRef]
- Ruuska, S.; Kajava, S.; Mughal, M.; Zehner, N.; Mononen, J. Validation of a pressure sensor-based system for measuring eating, rumination and drinking behaviour of dairy cattle. Appl. Anim. Behav. Sci. 2016, 174, 19–23. [Google Scholar] [CrossRef]
- Benaissa, S.; Tuyttens, F.A.; Plets, D.; Cattrysse, H.; Martens, L.; Vandaele, L.; Joseph, W.; Sonck, B. Classification of ingestive-related cow behaviours using RumiWatch halter and neck-mounted accelerometers. Appl. Anim. Behav. Sci. 2019, 211, 9–16. [Google Scholar] [CrossRef] [Green Version]
- Pereira, G.M.; Heins, B.J.; Endres, M.I. Validation of an ear-tag accelerometer sensor to determine rumination, eating, and activity behaviors of grazing dairy cattle. J. Dairy Sci. 2018, 101, 2492–2495. [Google Scholar] [CrossRef] [PubMed] [Green Version]
- Wolfger, B.; Timsit, E.; Pajor, E.A.; Cook, N.; Barkema, H.W.; Orsel, K. Accuracy of an ear tag-attached accelerometer to monitor rumination and feeding behavior in feedlot cattle. J. Anim. Sci. 2015, 93, 3164–3168. [Google Scholar] [CrossRef] [Green Version]
- Benaissa, S.; Tuyttens, F.A.; Plets, D.; De Pessemier, T.; Trogh, J.; Tanghe, E.; Sonck, B. On the use of on-cow accelerometers for the classification of behaviours in dairy barns. Res. Vet. Sci. 2019, 125, 425–433. [Google Scholar] [CrossRef] [Green Version]
- Smith, D.; Rahman, A.; Bishop-Hurley, G.J.; Hills, J.; Shahriar, S.; Henry, D.; Rawnsley, R. Behavior classification of cows fitted with motion collars: Decomposing multi-class classification into a set of binary problems. Comput. Electron. Agric. 2016, 131, 40–50. [Google Scholar] [CrossRef]
- Diosdado, J.A.V.; Barker, Z.E.; Hodges, H.R.; Amory, J.R.; Croft, D.P.; Bell, N.J.; Codling, E.A. Classification of behaviour in housed dairy cows using an accelerometer-based activity monitoring system. Anim. Biotelemetry 2015, 3, 1–14. [Google Scholar] [CrossRef] [Green Version]


| Day | Session (Time) | Treatment | |||
|---|---|---|---|---|---|
| TMR 1 | TMR 2 | LHY | GRZ | ||
| Day 1 | 9:00–11:00 a.m. | 1 | 2 | 3 | 4 |
| 12:00–2:00 p.m. | 2 | 1 | 4 | 3 | |
| 4:00–6:00 p.m. | 3 | 4 | 1 | 2 | |
| Day 2 | 9:00–11:00 a.m. | 1 | 2 | 4 | 3 |
| 12:00–2:00 p.m. | 4 | 3 | 2 | 1 | |
| 4:00–6:00 p.m. | 2 | 1 | 3 | 4 | |
| Observer | 1 | 2 | 3 | Overall |
|---|---|---|---|---|
| 2 | 0.898 | - | 0.881 | |
| 3 | 0.893 | 0.871 | - | |
| 4 | 0.876 | 0.913 | 0.838 |
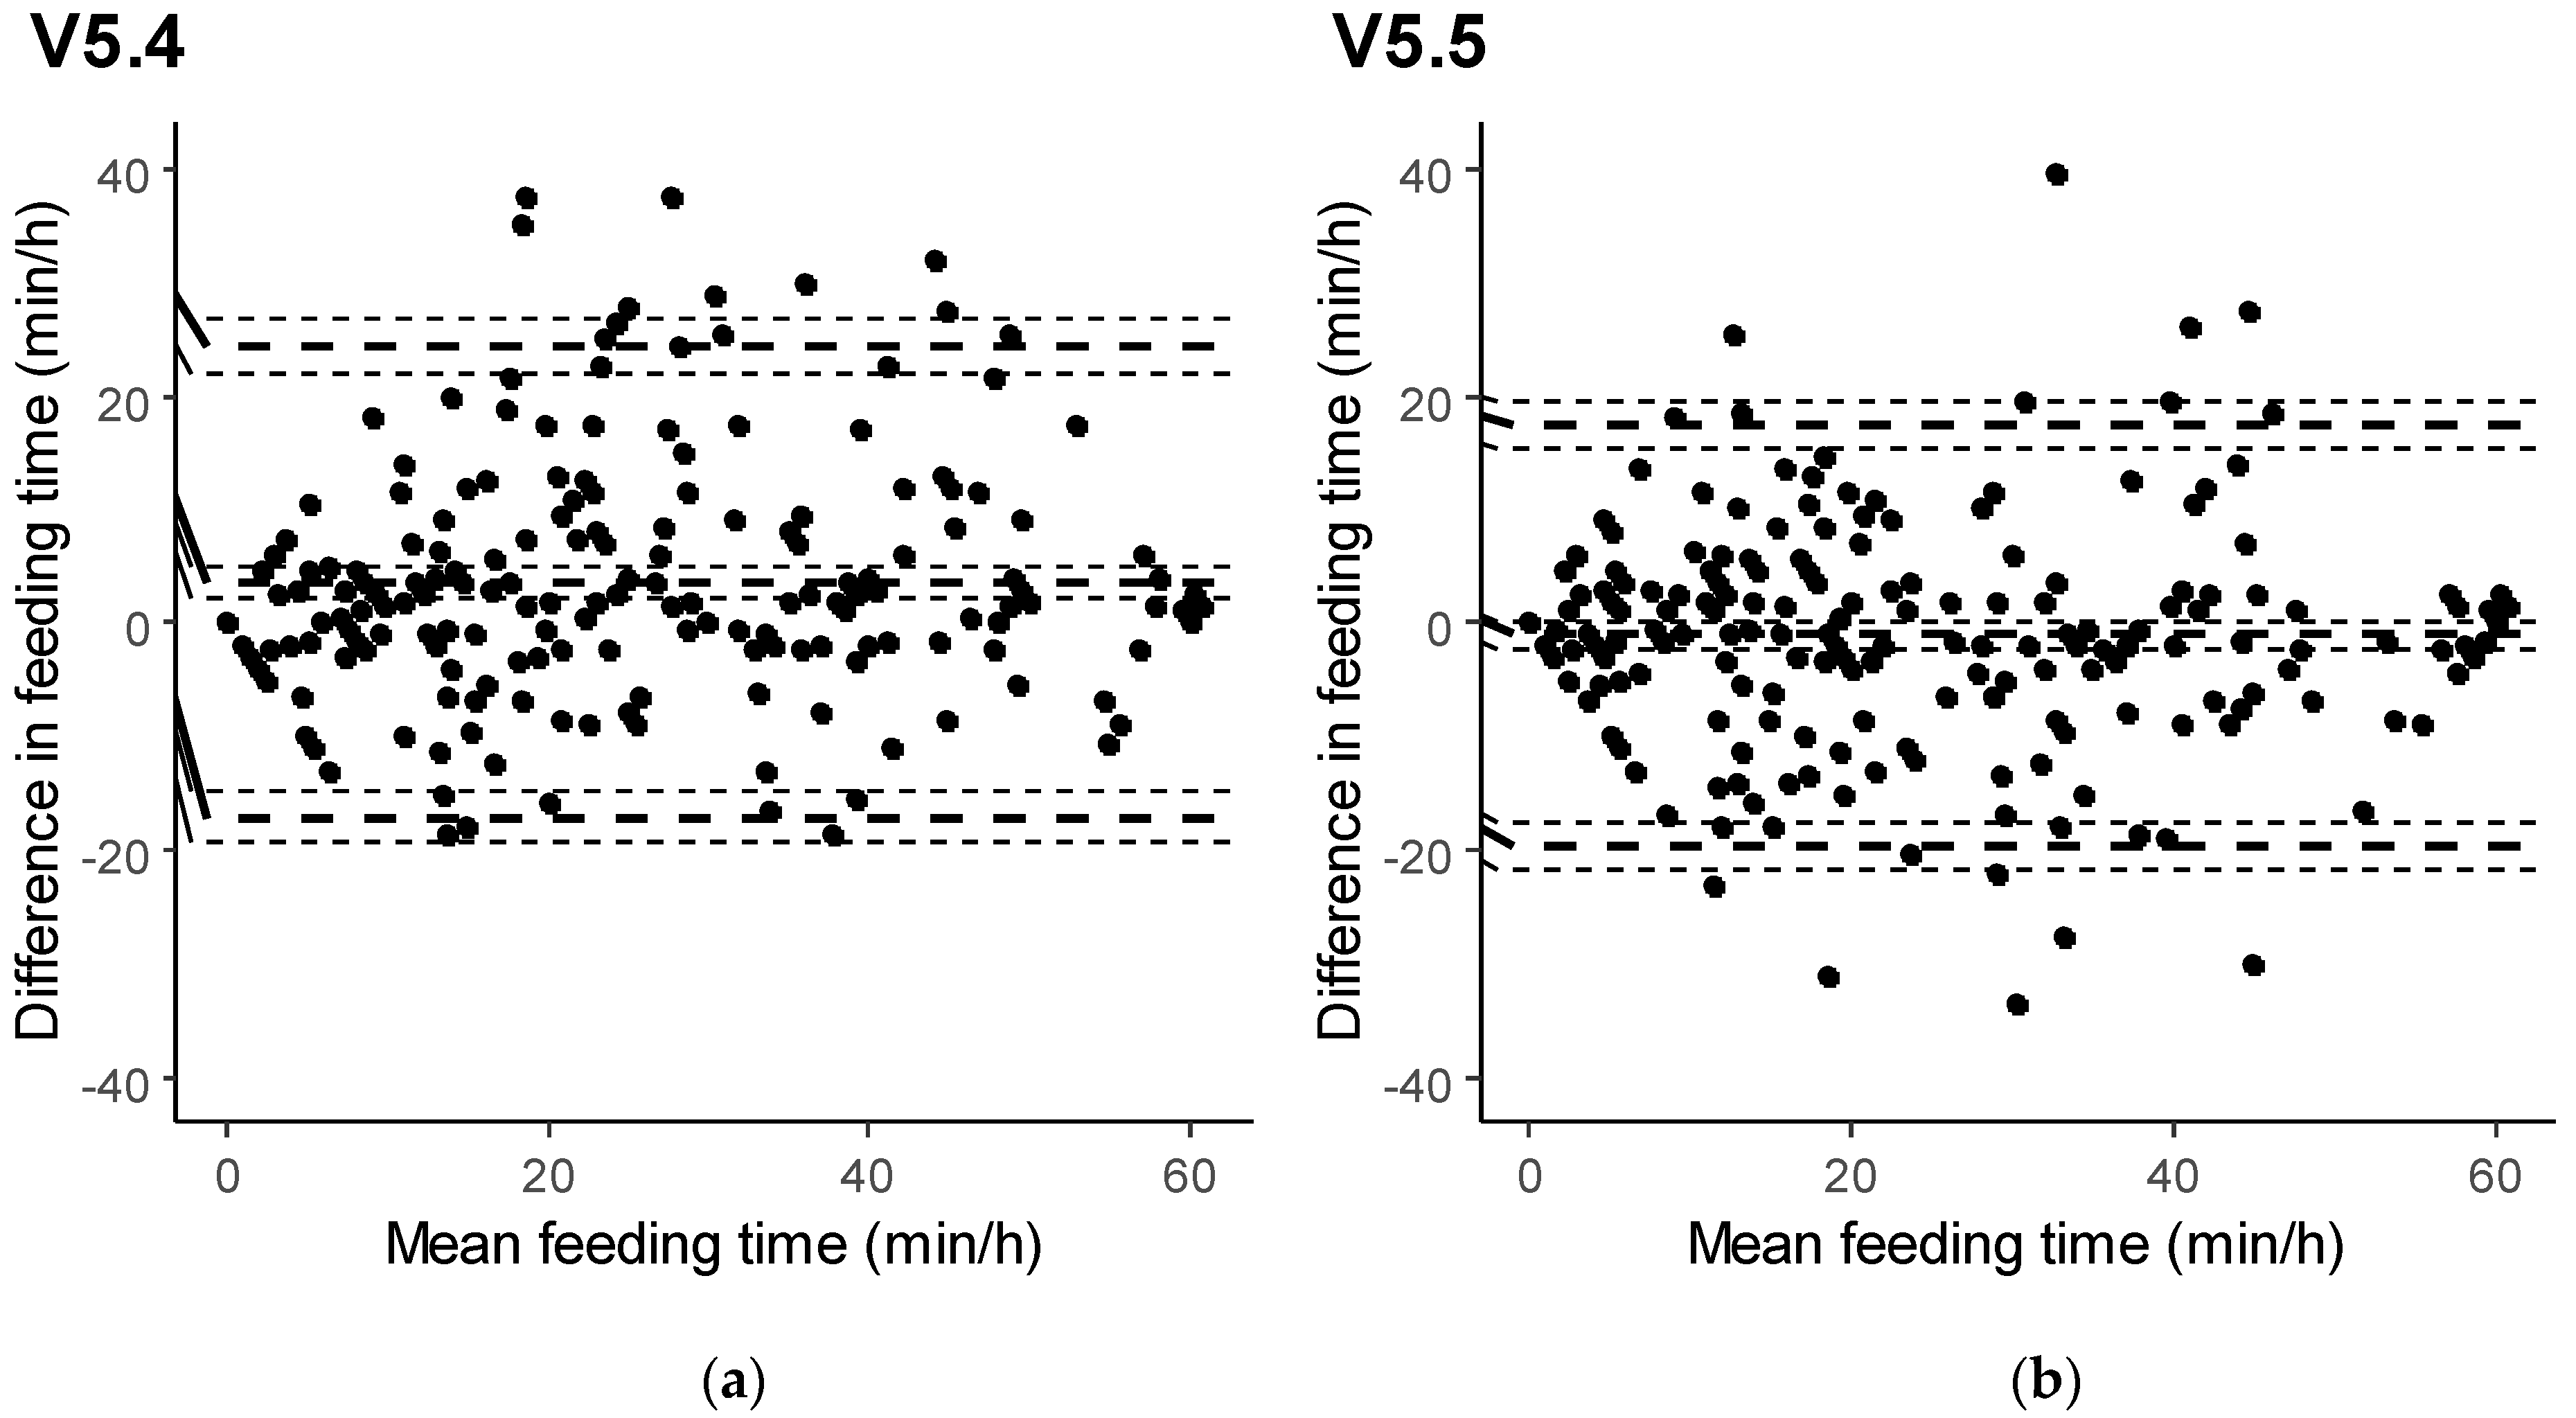
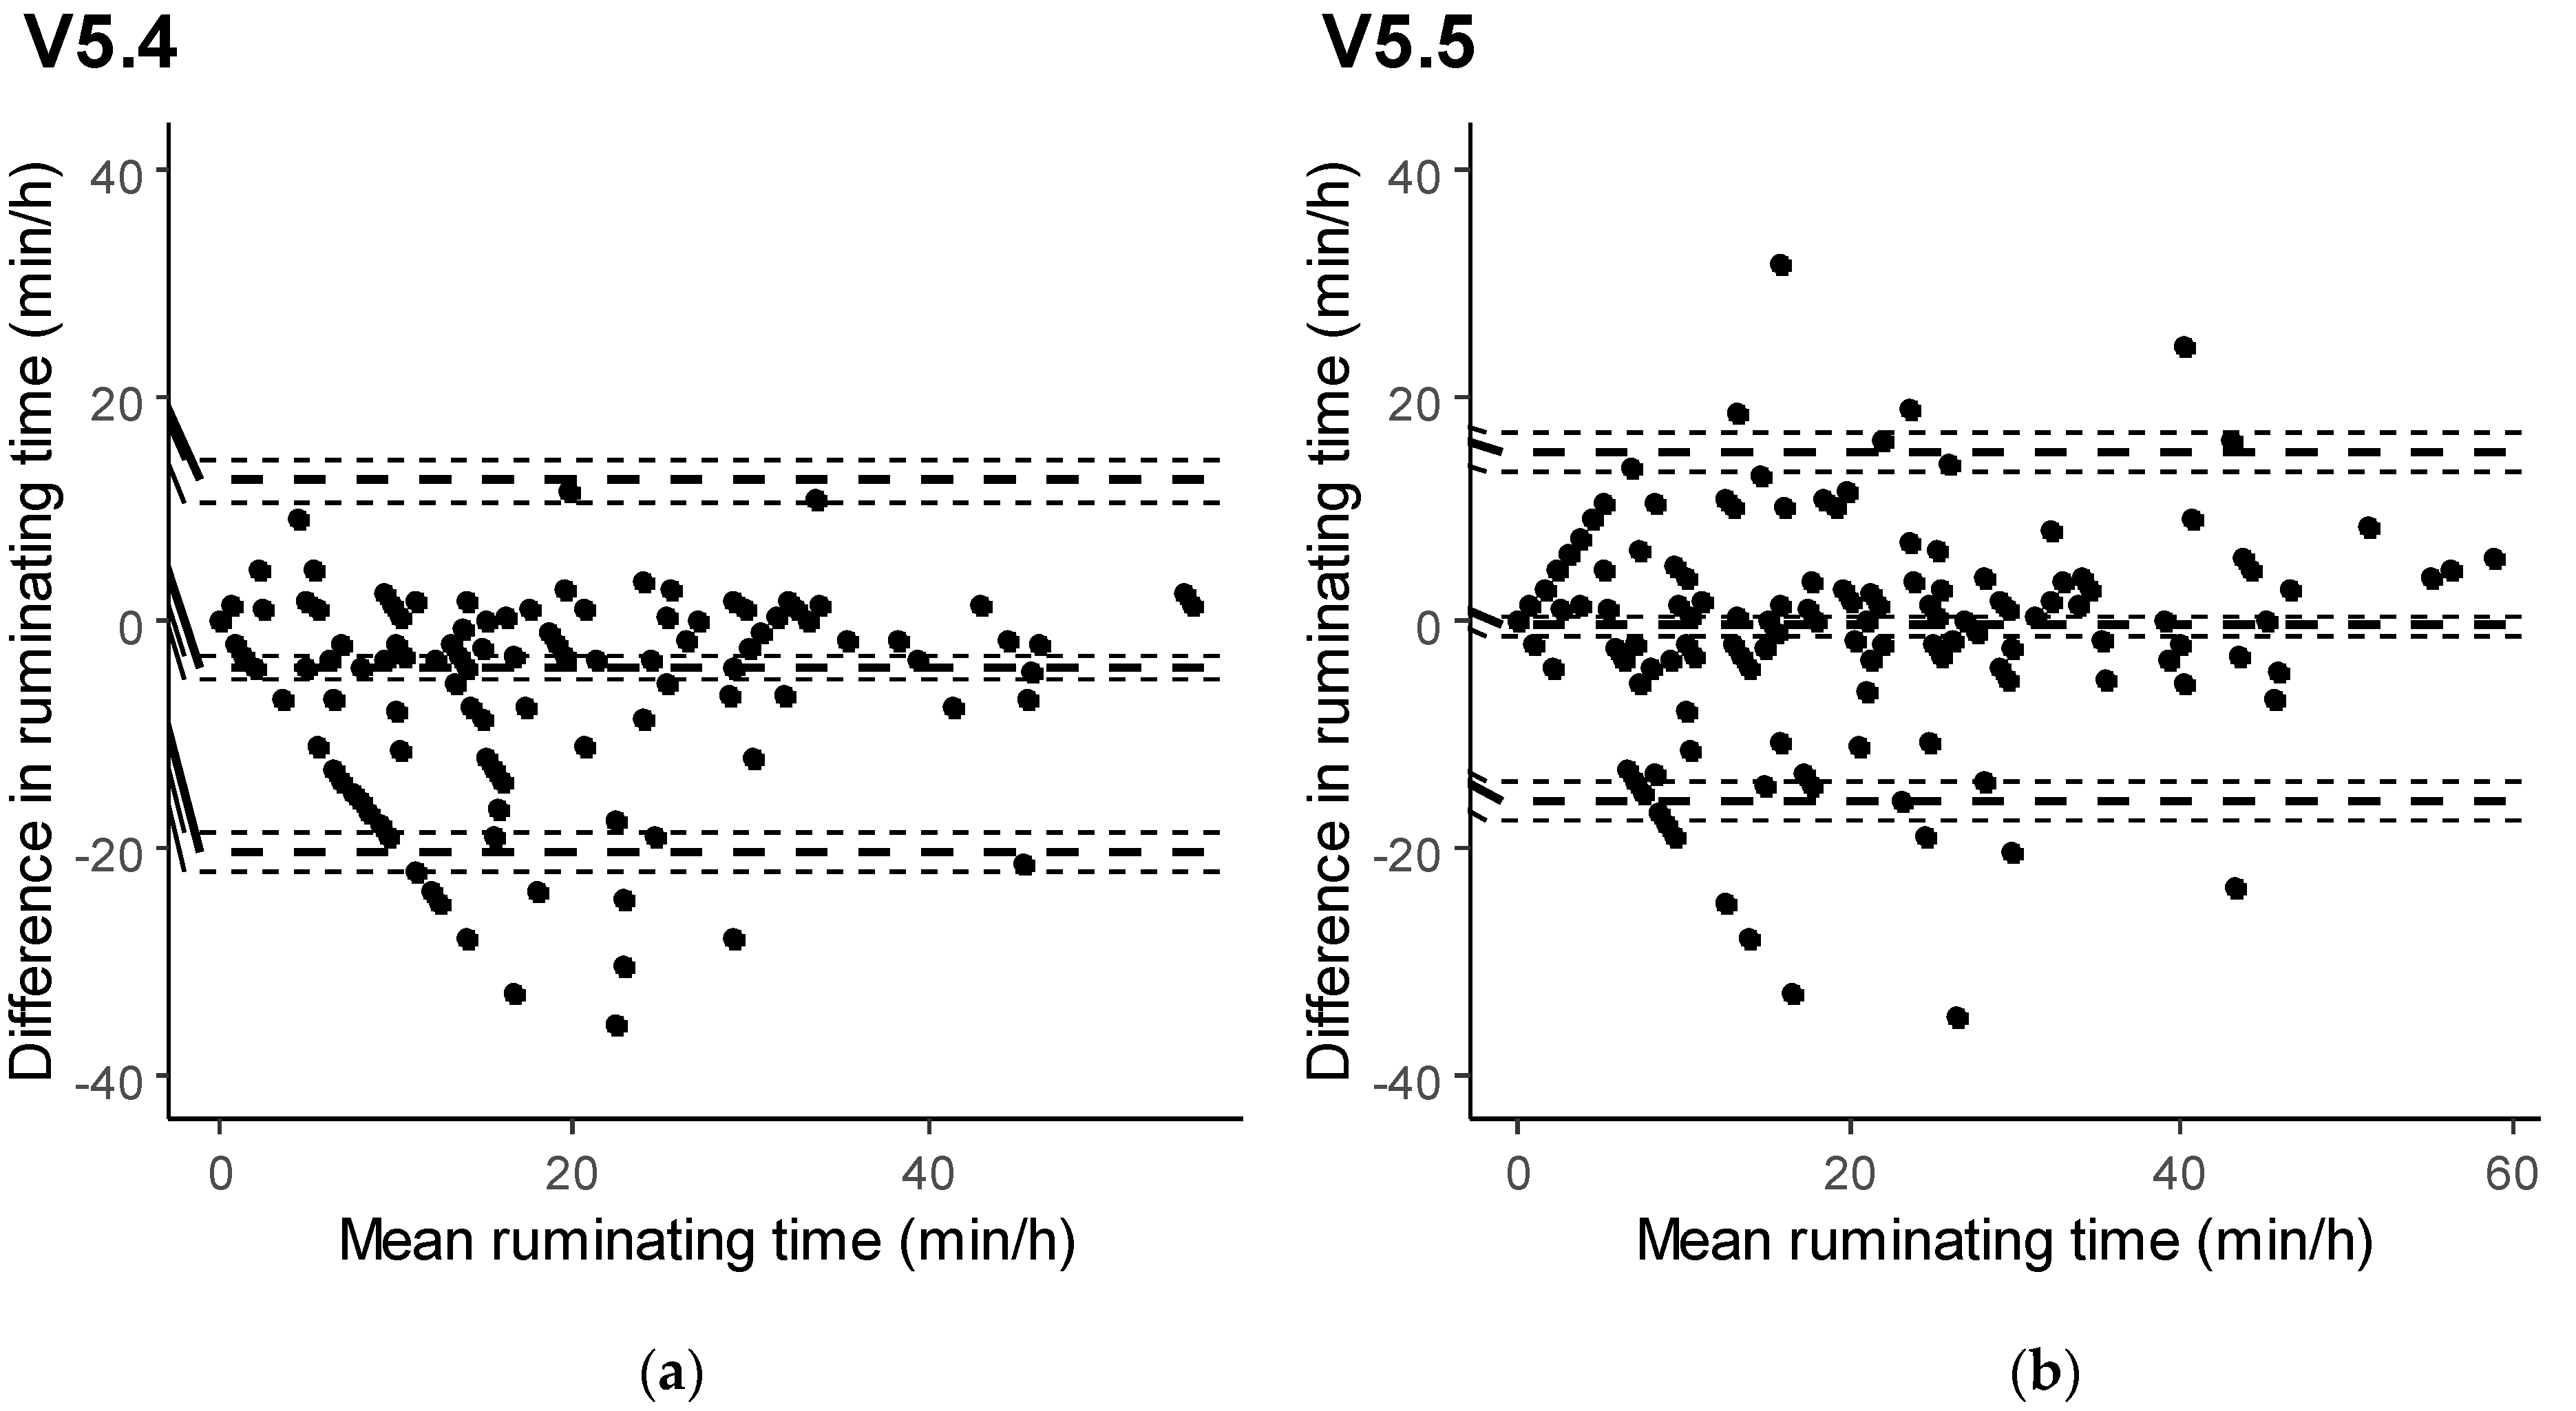
| Behavior | Software Version | rs | CCC | Bias (95% CI) | Lower Limit of Agreement 1 (95% CI) | Upper Limit of Agreement 1 (95% CI) | Critical Difference 2 |
|---|---|---|---|---|---|---|---|
| Feeding time (min/h) | V5.4 | 0.84 | 0.83 | 3.63 * (2.27; 4.97) | −17.17 (−19.50; −14.89) | 24.42 (22.08; 26.76) | 20.79 |
| V5.5 | 0.85 | 0.86 | −1.06 (−2.26; 0.14) | −19.60 (−21.68; −17.51) | 17.46 (15.38; 19.55) | 18.53 | |
| Ruminating time (min/h) | V5.4 | 0.81 | 0.79 | −3.93 * (−4.99; −2.86) | −20.33 (−22.17; −18.49) | 12.48 (10.63; 14.32) | 16.41 |
| V5.5 | 0.83 | 0.86 | −0.40 (−1.40; 0.60) | −15.80 (−17.53; −14.07) | 15.00 (13.27; 16.73) | 15.40 |
Publisher’s Note: MDPI stays neutral with regard to jurisdictional claims in published maps and institutional affiliations. |
© 2021 by the authors. Licensee MDPI, Basel, Switzerland. This article is an open access article distributed under the terms and conditions of the Creative Commons Attribution (CC BY) license (https://creativecommons.org/licenses/by/4.0/).
Share and Cite
Leso, L.; Becciolini, V.; Rossi, G.; Camiciottoli, S.; Barbari, M. Validation of a Commercial Collar-Based Sensor for Monitoring Eating and Ruminating Behaviour of Dairy Cows. Animals 2021, 11, 2852. https://0-doi-org.brum.beds.ac.uk/10.3390/ani11102852
Leso L, Becciolini V, Rossi G, Camiciottoli S, Barbari M. Validation of a Commercial Collar-Based Sensor for Monitoring Eating and Ruminating Behaviour of Dairy Cows. Animals. 2021; 11(10):2852. https://0-doi-org.brum.beds.ac.uk/10.3390/ani11102852
Chicago/Turabian StyleLeso, Lorenzo, Valentina Becciolini, Giuseppe Rossi, Stefano Camiciottoli, and Matteo Barbari. 2021. "Validation of a Commercial Collar-Based Sensor for Monitoring Eating and Ruminating Behaviour of Dairy Cows" Animals 11, no. 10: 2852. https://0-doi-org.brum.beds.ac.uk/10.3390/ani11102852