
Application of a Protocol to Assess Camel Welfare: Scoring System of Collected Measures, Aggregated Assessment Indices, and Criteria to Classify a Pen


Abstract
:Simple Summary
Abstract
1. Introduction
2. Materials and Methods
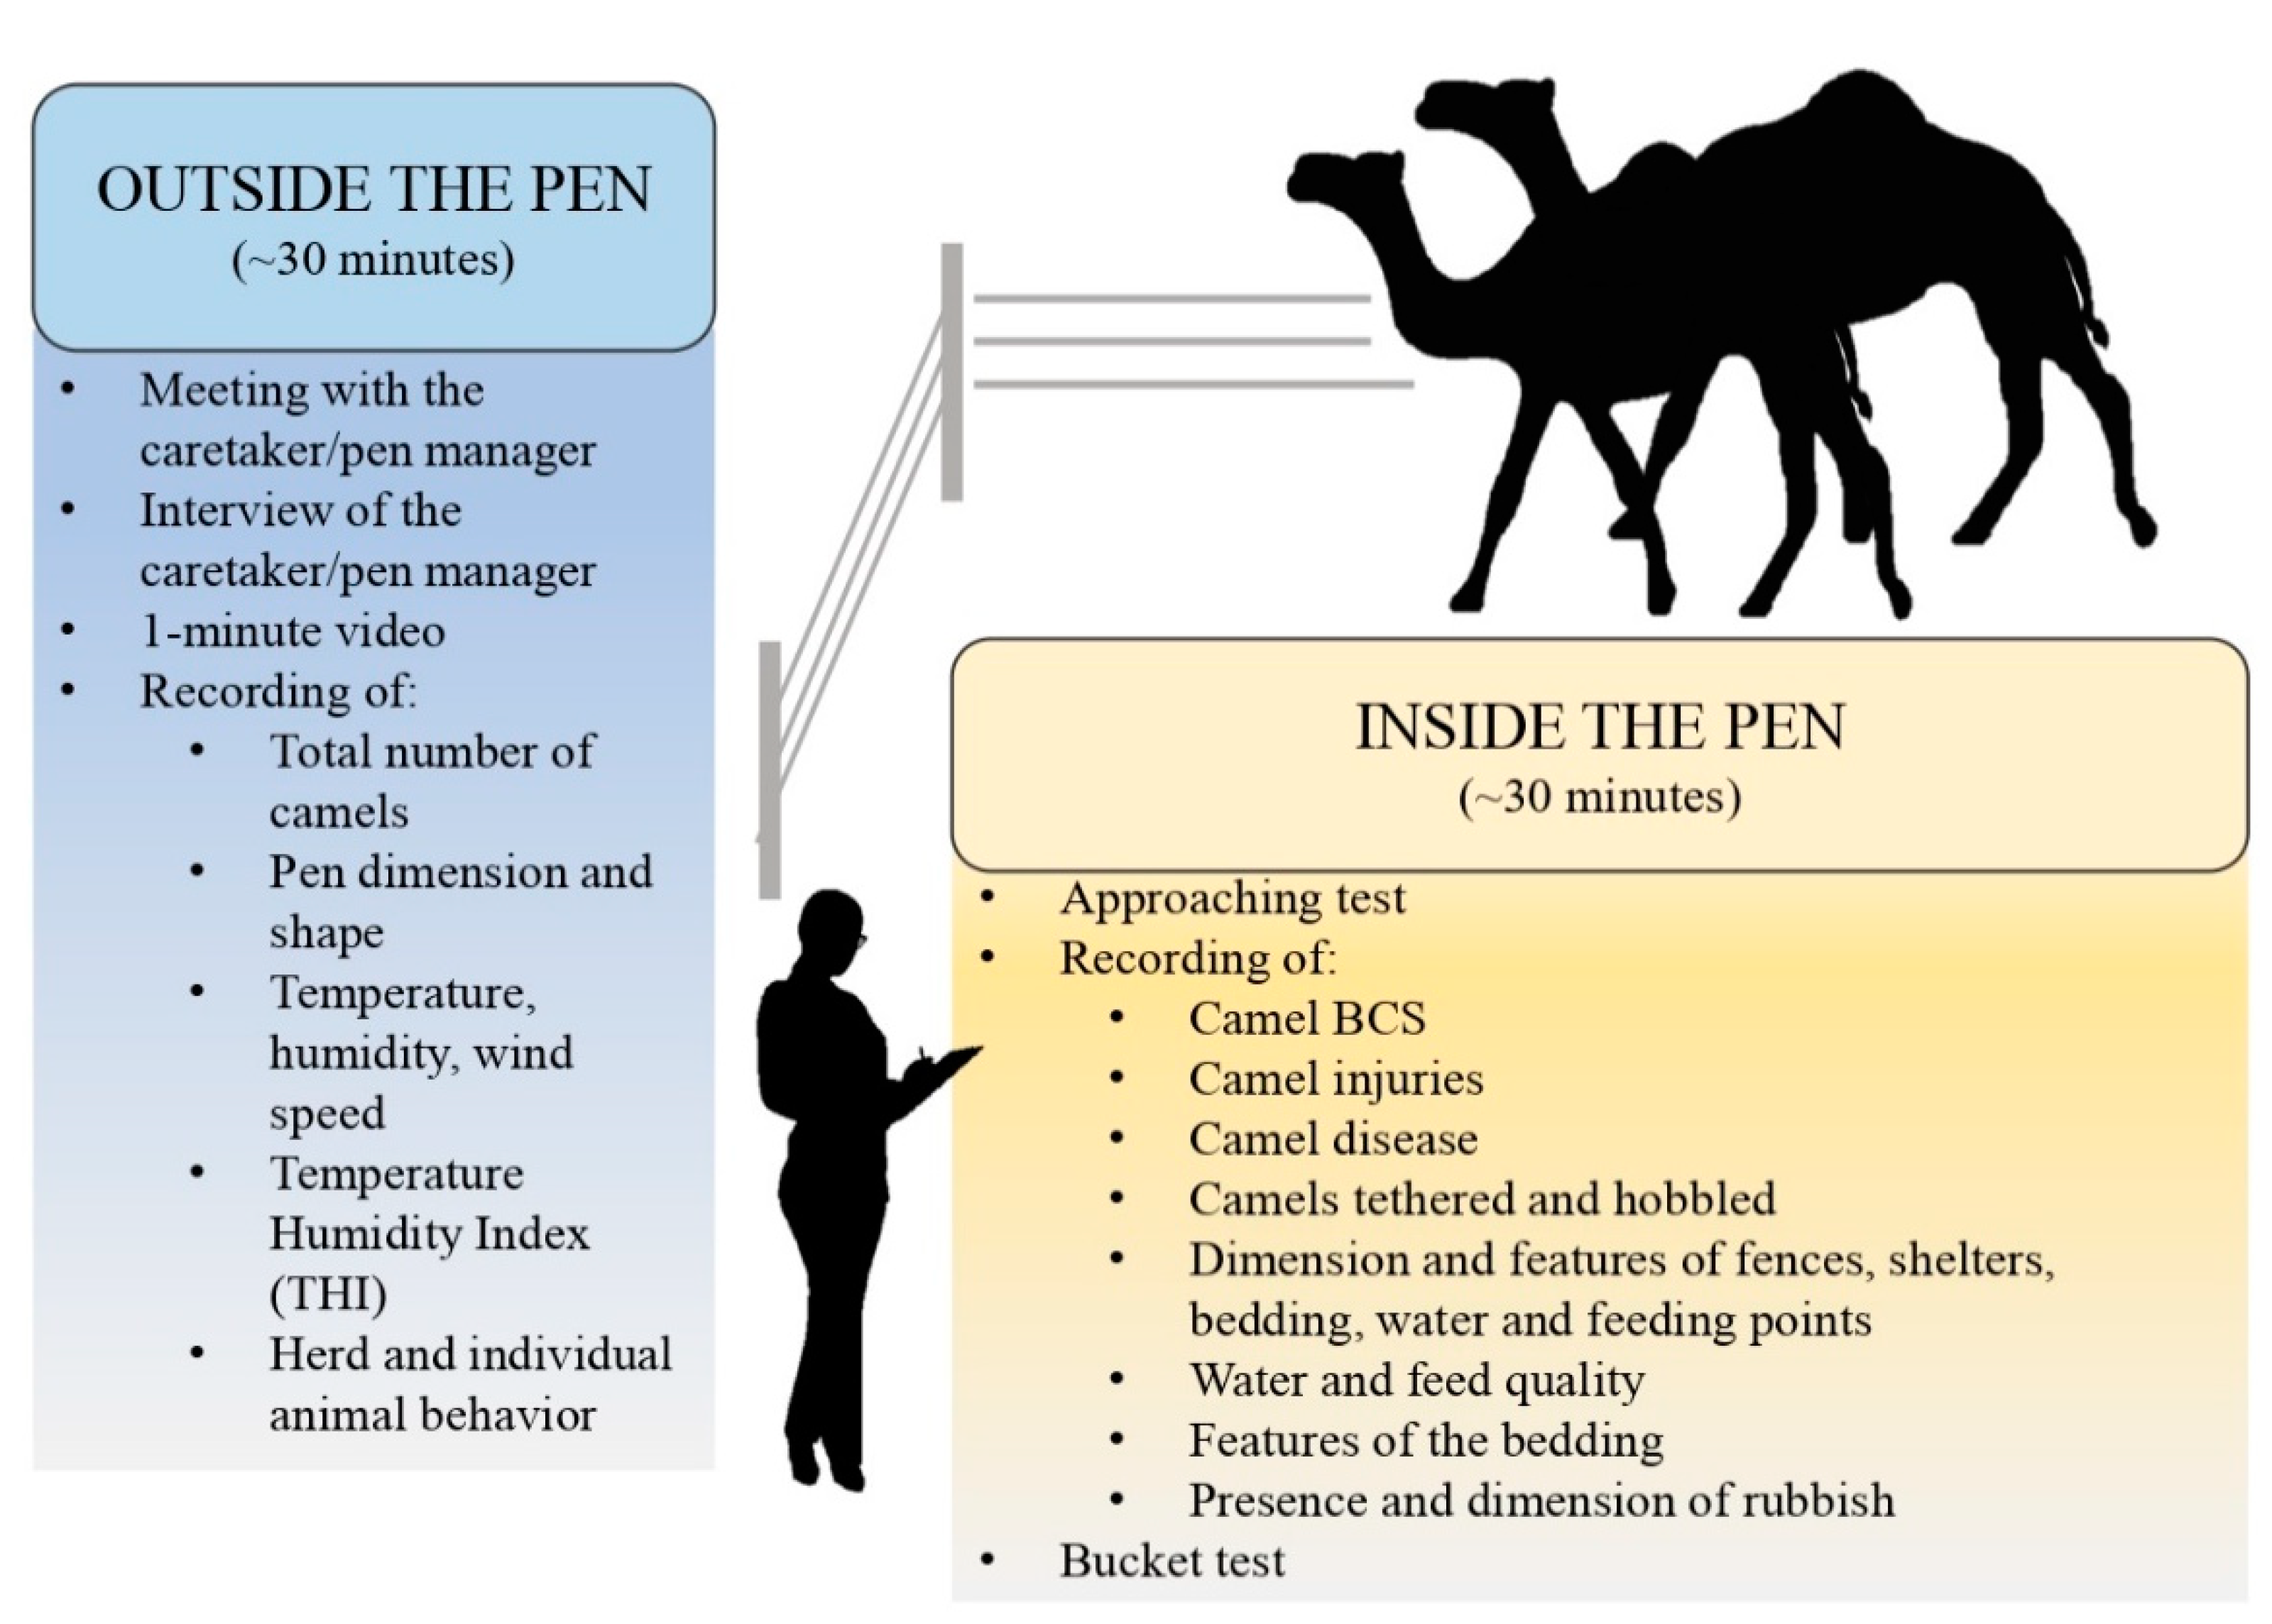
2.1. Animals, Housing, and Caretakers
2.2. Protocol
2.3. Data Entry and Processing
- Answers to open-ended questions of the interview (Caretaker level);
- Building materials of facilities, type of feed, bedding and rubbish, type of disease and physical injury (Herd level);
- Material of hobbles, type of disease and physical injury (Animal level).
2.4. Selection of Measures
2.5. Scoring and Aggregation of Measures
2.6. Pen Classification
2.7. Statistical Analysis
3. Results
3.1. Scoring and Aggregation of Measures
3.1.1. First Step: Scoring of Measures
3.1.2. Second Step: Calculation of Partial Indices (PIs)
3.1.3. Third Step: Calculation of Aggregate Indices (LAIs and PAIs)
3.1.4. Fourth Step: Calculation of Total Welfare Index (TWI)
3.2. Pen Classification
3.2.1. Systems of Pen Classification
3.2.2. Relative Importance of the Measures on the Pen System Classifications
4. Discussion
Limitations and Further Technical Considerations on the Selection of Measures, Scoring System and Aggregation Process
5. Conclusions
Supplementary Materials
Author Contributions
Funding
Institutional Review Board Statement
Informed Consent Statement
Data Availability Statement
Acknowledgments
Conflicts of Interest
References
- Pond, W.G.; Bazer, F.W.; Rollin, B.E. Animal Welfare in Animal Agriculture: Husbandry, Stewardship, and Sustainability in Animal Production; CRC Press: Boca Raton, FL, USA, 2011; ISBN 9781439897850. [Google Scholar]
- Scott, E.M.; Nolan, A.M.; Fitzpatrick, J.L. Conceptual and methodological issues related to welfare assessment: A framework for measurement. Acta Agric. Scand. A Anim. Sci. 2001, 51, 5–10. [Google Scholar] [CrossRef]
- Main, D.C.J.; Kent, J.P.; Wemelsfelder, F.; Ofner, E.; Tuyttens, F.A.M. Applications for methods of on-farm welfare assessment. Anim. Welf. 2003, 12, 523–528. [Google Scholar]
- OIE. World Organisation for animal health introduction. In Terrestrial Animal Health Code; OIE: Paris, France, 2008. [Google Scholar]
- Mellor, D.J. Updating animalwelfare thinking: Moving beyond the “five freedoms” towards “A lifeworth living”. Animals 2016, 6, 21. [Google Scholar] [CrossRef]
- Mason, G.; Mendl, M. Why is there no simple way of measuring animal welfare? Anim. Welf. 1993, 2, 301–319. [Google Scholar]
- EFSA. Statement on the use of animal-based measures to assess the welfare of animals. Panel on Animal Health and Welfare (AHAW). EFSA J. 2012, 10, 2767. [Google Scholar]
- Welfare Quality Network Welfare Quality® Project. Available online: http://www.welfarequality.net/en-us/news/assessment-protocols/. (accessed on 15 June 2020).
- Brambell, R. Report of the Technical Committee to Enquire into the Welfare of Animals Kept under Intensive Livestock Husbandry Systems; Command Paper 2836; Her Majesty’s Stationery Office: London, UK, 1965.
- FAW Council. Farm Animal Welfare in Great Britain: Past, Present and Future. Available online: https://www.gov.uk/government/uploads/system/uploads/attachment_data/file/319292/Farm_Animal_Welfare_in_Great_Britain_-_Past__Present_and_Future.pdf (accessed on 28 July 2020).
- Welfare Quality® Consortium. Welfare Quality® Assessment Protocol for Pigs. Available online: http://www.welfarequalitynetwork.net/media/1018/pig_protocol.pdf. (accessed on 15 June 2020).
- Blokhuis, H.J.; Veissier, I.; Miele, M.; Jones, B. The welfare quality® project and beyond: Safeguarding farm animal well-being. Acta Agric. Scand. A Anim. Sci. 2010, 60, 129–140. [Google Scholar] [CrossRef]
- Welfare Quality®. Welfare Quality® assessment protocol for cattle; Welfare Quality® Consortium: Lelystad, The Netherlands, 2009; pp. 1–142. [Google Scholar]
- AWIN. Welfare Assessment Protocol for Horses. Available online: https://air.unimi.it/retrieve/handle/2434/269097/384836/AWINProtocolHorses.pdf. (accessed on 15 June 2020).
- AWIN. Welfare Assessment Protocol for Sheep. Available online: https://www.researchgate.net/publication/275887069_AWIN_Welfare_Assessment_Protocol_for_Sheep. (accessed on 15 June 2020).
- AWIN. Welfare Assessment Protocol for Goats. Available online: https://air.unimi.it/retrieve/handle/2434/269102/384790/AWINProtocolGoats.pdf. (accessed on 15 June 2020).
- De Vries, M.; Bokkers, E.A.M.; van Schaik, G.; Botreau, R.; Engel, B.; Dijkstra, T.; de Boer, I.J.M. Evaluating results of the welfare quality multi-criteria evaluation model for classification of dairy cattle welfare at the herd level. J. Dairy Sci. 2013, 96, 6264–6273. [Google Scholar] [CrossRef]
- Botreau, R.; Bonde, M.; Butterworth, A.; Perny, P.; Bracke, M.B.M.; Capdeville, J.; Veissier, I. Aggregation of measures to produce an overall assessment of animal welfare. Part 1: A review of existing methods. Animal 2007, 1, 1179–1187. [Google Scholar] [CrossRef] [Green Version]
- Czycholl, I.; Kniese, C.; Schrader, L.; Krieter, J. Assessment of the multi-criteria evaluation system of the Welfare Quality® protocol for growing pigs. Animal 2017, 11, 1573–1580. [Google Scholar] [CrossRef]
- Kubasiewicz, L.M.; Rodrigues, J.B.; Norris, S.L.; Watson, T.L.; Rickards, K.; Bell, N.; Judge, A.; Raw, Z.; Burden, F.A. The welfare aggregation and guidance (WAG) tool: A new method to summarize global welfare assessment data for equids. Animals 2020, 10, 546. [Google Scholar] [CrossRef] [Green Version]
- Pastrana, C.I.; González, F.J.N.; Ciani, E.; Capote, C.J.B.; Bermejo, J.V.D. Effect of research impact on emerging camel husbandry, welfare and social-related awareness. Animals 2020, 10, 780. [Google Scholar] [CrossRef]
- Padalino, B.; Menchetti, L. The first tool for assessing welfare of camels. Front. Vet. Sci. 2021, 7, 631876. [Google Scholar] [CrossRef]
- Menchetti, L.; Monaco, D.; Ziani, A.; Padalino, B. Camel welfare: The first survey on camel caretakers’ perspective. J. Camelid Sci. 2020. paper accepted. [Google Scholar]
- Faye, B.; Bengoumi, M.; Cleradin, A.; Tabarani, A.; Chilliard, Y. Body condition score in dromedary camel: A tool for management of reproduction. Emirates J. Food Agric. 2001, 13, 1–6. [Google Scholar] [CrossRef] [Green Version]
- Tuyttens, F.A.M.; Federici, J.F.; Vanderhasselt, R.F.; Goethals, K.; Duchateau, L.; Sans, E.C.O.; Molento, C.F.M. Assessment of welfare of Brazilian and Belgian broiler flocks using the Welfare Quality protocol. Poult. Sci. 2015, 94, 1758–1766. [Google Scholar] [CrossRef]
- Renggaman, A.; Choi, H.L.; Sudiarto, S.I.; Alasaarela, L.; Nam, O.S. Development of pig welfare assessment protocol integrating animal-, environment-, and management-based measures. J. Anim. Sci. Technol. 2015, 57, 1–11. [Google Scholar] [CrossRef] [PubMed] [Green Version]
- Botreau, R.; Veissier, I.; Pern, P. Overall assessment of animal welfare: Strategy adopted in Welfare Quality®. Anim. Welf. 2009, 18, 363–370. [Google Scholar]
- Pfeifer, M.; Koch, A.; Lensches, C.; Schmitt, A.O.; Hessel, E.F. Acceptance and feasibility of a guideline for the animal welfare assessment of fattening pigs from farmers’ point of view. Animals 2020, 10, 711. [Google Scholar] [CrossRef] [Green Version]
- EFSA Panel on Animal Health and Welfare (AHAW). Guidance on Risk Assessment for Animal Welfare. EFSA J. 2012, 10, 2513. [Google Scholar] [CrossRef] [Green Version]
- Bergin, D.; Nijman, V. An assessment of welfare conditions in wildlife markets across Morocco. J. Appl. Anim. Welf. Sci. 2019, 22, 279–288. [Google Scholar] [CrossRef] [PubMed]
- Bravo, V.M.; Knowles, T.G.; Gallo, C. Transport, associated handling procedures and behaviour of calves marketed through chilean auction markets. Animals 2020, 10, 2170. [Google Scholar] [CrossRef]
- Bekele, T.; Szonyi, B.; Feleke, A.; Grace, D. Assessment of small ruminant welfare in Ethiopia—An abattoir-based study. J. Appl. Anim. Welf. Sci. 2020, 23, 356–365. [Google Scholar] [CrossRef] [PubMed]
- Pritchard, J.C.; Lindberg, A.C.; Main, D.C.J.; Whay, H.R. Assessment of the welfare of working horses, mules and donkeys, using health and behaviour parameters. Prev. Vet. Med. 2005, 69, 265–283. [Google Scholar] [CrossRef] [PubMed]
- Rodrigues, J.B.; Sullivan, R.J.E.; Judge, A.; Norris, S.L.; Burden, F.A. Quantifying poor working equid welfare in Nepalese brick kilns using a welfare assessment tool. Vet. Rec. 2020, 187, 445. [Google Scholar] [CrossRef] [PubMed]
- Al Haj Ali, M.; Nyberg, F.; Chandranath, S.I.; Ponery, A.S.; Adem, A.; Adeghate, E. Effect of high-calorie diet on the prevalence of diabetes mellitus in the one-humped camel (Camelus dromedarius). Ann. N. Y. Acad. Sci. 2006, 1084, 402–410. [Google Scholar]
- Roche, J.R.; Friggens, N.C.; Kay, J.K.; Fisher, M.W.; Stafford, K.J.; Berry, D.P. Invited review: Body condition score and its association with dairy cow productivity, health, and welfare. J. Dairy Sci. 2009, 92, 5769–5801. [Google Scholar] [CrossRef] [PubMed] [Green Version]
- Menchetti, L.; Padalino, B.; Brasileiro Fernandes, F.; Nanni Costa, L. Comparison of nonlinear growth models and factors affecting body weight at different ages in Toy Poodles. Ital. J. Anim. Sci. 2020, 19, 792–802. [Google Scholar] [CrossRef]
- Dalmau, A.; Moles, X.; Pallisera, J. Animal welfare assessment protocol for does, bucks, and kit rabbits reared for production. Front. Vet. Sci. 2020, 7, 445. [Google Scholar] [CrossRef]
- Agab, H.; Abbas, B. Epidemiological studies on camel diseases in eastern Sudan. World Anim. Rev. 1999, 92, 42–51. [Google Scholar]
- Agab, H. Diseases and causes of mortality in a camel (Camelus dromedarius) dairy farm in Saudi Arabia. J. Camel Pract. Res. 2006, 13, 165–169. [Google Scholar]
- Volpato, G.; Lamin Saleh, M.S.; Nardo, A. Ethnoveterinary of Sahrawi pastoralists of Western Sahara: Camel diseases and remedies. J. Ethnobiol. Ethnomed. 2015, 11, 1–22. [Google Scholar] [CrossRef] [Green Version]
- Farhat, S.F.; McLean, A.K.; Mahmoud, H.F.F. Welfare assessment and identification of the associated risk factors compromising the welfare of working donkeys (Equus asinus) in egyptian brick kilns. Animals 2020, 10, 1611. [Google Scholar] [CrossRef] [PubMed]
- Rayner, E.L.; Airikkala-Otter, I.; Susheelan, A.; Mellanby, R.J.; Meunier, N.V.; Gibson, A.; Gamble, L. Prevalence of mutilations and other skin wounds in working donkeys in Tamil Nadu, India. Vet. Rec. 2018, 183, 450. [Google Scholar] [CrossRef] [PubMed]
- Benatallah, A.; Ghozlane, F.; Marie, M. Dairy cow welfare assessment on Algerian farms. Afr. J. Agric. Res. 2015, 10, 895–901. [Google Scholar]
- Gebremedhin, B.; Hoekstra, D.; Jemaneh, S. Heading towards Commercialization? The Case of Live Animal Marketing in Ethiopia; Improving Productivity and Market Success (IPMS) of Ethiopian Farmers Project Working Paper 5; ILRI (International Livestock Research Institute): Nairobi, Kenya, 2007. [Google Scholar]
- Sharma, A.; Kennedy, U.; Schuetze, C.; Phillips, C.J. The welfare of cows in Indian shelters. Animals 2019, 9, 172. [Google Scholar] [CrossRef] [PubMed] [Green Version]
- Bracke, M.B.M.; Spruijt, B.M.; Metz, J.H.M.; Scheuten, W.G.P. Decision support system for overall welfare assessment in pregnant sows A: Model structure and weighting procedure. J. Anim. Sci. 2002, 80, 1819–1834. [Google Scholar] [CrossRef] [PubMed] [Green Version]
- Islam, N.; Islam, S. Human animal relationship: Understanding animal rights in the islamic ecological paradigm. J. Study Relig. Ideol. 2015, 14, 96–126. [Google Scholar]
- Armstrong, D.V. Heat stress interaction with shade and cooling. J. Dairy Sci. 1994, 77, 2044–2050. [Google Scholar] [CrossRef]
- Serradilla, J.; Carabaño, M.J.; Ramón, M.; Molina, A.; Diaz, C.; Menéndez-Buxadera, A. Characterisation of goats’ response to heat stress: Tools to improve heat tolerance. In Goat Science; Kukovics, S., Ed.; IntechOpen: London, UK, 2017; ISBN 978-1-83881-263-8. [Google Scholar]
- Altman, D.G. Categorizing continuous variables. Wiley StatsRef Stat. Ref. Online 2014. [Google Scholar]
- Jewell, N.P. Statistics for Epidemiology; Chatfield, C., Tanner, M., Zidek, J., Eds.; Chapman & Hall/CRC: Boca Raton, FL, USA; London, UK; New York, NY, USA; Washington, DC, USA, 2009; ISBN 0-203-49686-8. [Google Scholar]


| Welfare Principle | Level of Investigation | ||
|---|---|---|---|
| Caretaker | Herd | Animal | |
| Good Feeding | Feeding and watering management | Feeding and watering points (number, dimension, location) Feed and water availability Feed and water quality Feeding and watering space per animal Presence of salt Proportion of camels drinking, eating and ruminating | Body Condition Score (BCS) Thirst Index |
| Good Housing | Caretaker’s experience in working with animals Number of animals handled by the caretaker in the busiest week | Space allowance Shelter (presence and shaded space allowance) Fence condition Bedding (presence and cleanliness) Rubbish (presence and dimension) Proportion of camels hobbled and in shade | Resting behaviour Location (under the sun/in shade) Insects (quality, quantity) Tethering Hobbled |
| Good Health | Past camel disease observed Camel health check Medical treatments | Proportion of camels with disease, physical injuries, scars from hobbles, cauterization, nose-ring Proportion of camels in pain | Presence of disease, physical injuries, locomotory disorders, skin disorders, discharge, mastitis or abnormal udder, respiratory disorders, pain |
| Appropriate Behaviour | Caretaker’s experience in camel handling Current behavioural problems Caretaker’s skills in identifying distress | Proportion of camels resting, standing quietly, aggressive Proportion of camels showing stereotypies and other abnormal behaviour | Social interaction Stereotypies Abnormal behaviour Feeding and rumination Approaching test |
| Measure | Criteria | Scores | |
|---|---|---|---|
| Who carries out health assessment or medical treatment | A veterinarian | 0 | |
| A non-veterinarian | 1 | ||
| Not conducted | 2 | ||
| Grade of caretaker’s ability in identifying a camel in distress/pain | High–Very high | 0 | |
| Moderate | 1 | ||
| Low–Some | 2 | ||
| Years of caretaker’s experience | >10 years | 0 | |
| 6–10 years | 1 | ||
| 0–5 years | 2 | ||
| Food/water distribution | Ad libitum | 0 | |
| Rationed | 2 | ||
| Food/water position 1 | In the shade | 0 | |
| In the sun | 2 | ||
| Continuous variables related to facilities 1,2 | Statistical binning (tertiles) | 0 (best situation) | |
| 1 (second tertile group) | |||
| 2 (worst situation) | |||
| Cleanliness of facilities 1 | Clean | 0 | |
| Partially Dirty | 1 | ||
| Dirty | 2 | ||
| Presence of salt block, shelter, shade, bedding | Yes | 0 | |
| No | 2 | ||
| Presence of rubbish, broken fence, insects | No | 0 | |
| Yes | 2 | ||
| Body Condition Score (BCS) | 3 (good body condition) | 0 | |
| 2, 4 (moderate body condition) | 1 | ||
| 0–1, 5 (poor body condition, lean or obese) | 2 | ||
| Thirst Index | 0 | 0 | |
| 1 | 1 | ||
| 2–3 | 2 | ||
| Presence of a disease, physical injuries, pain or behaviour indicating poor welfare 3 | |||
| Animal level | No | 0 | |
| Yes | 2 | ||
| Herd level | Percentage of animals with the disease/injury/pain/behaviour | 0 (0%)–2 (100%) | |
| Presence of behaviour indicating good welfare 4 | |||
| Animal level | Yes | 0 | |
| No | 2 | ||
| Herd level | Percentage of animals showing the behaviour | 0 (100%)–2 (0%) | |
| Tethering/Hobbled | No | 0 | |
| Yes | 2 | ||
| Responses during the approaching test | Positive | 0 | |
| Neutral | 1 | ||
| Negative | 2 | ||
| Parameter | Criteria | Welfare Classes |
|---|---|---|
| Principle Aggregate Indexes | >60 for each principle and >80 for 2 principles | Excellent |
| >30 for each principle and >60 for 3 principles | Satisfactory | |
| >20 for each principle and >30 for 3 principles | Unsatisfactory | |
| Failure to meet the above requirements | Unacceptable | |
| Total Welfare Index | Third tertile | Green Light |
| Second tertile | Orange Light | |
| First tertile | Red Light |
| Type of Measure | Measure | Score | Welfare Class | p Value * | |||
|---|---|---|---|---|---|---|---|
| Satisfactory | Unacceptable | ||||||
| Count | N % | Count | N % | ||||
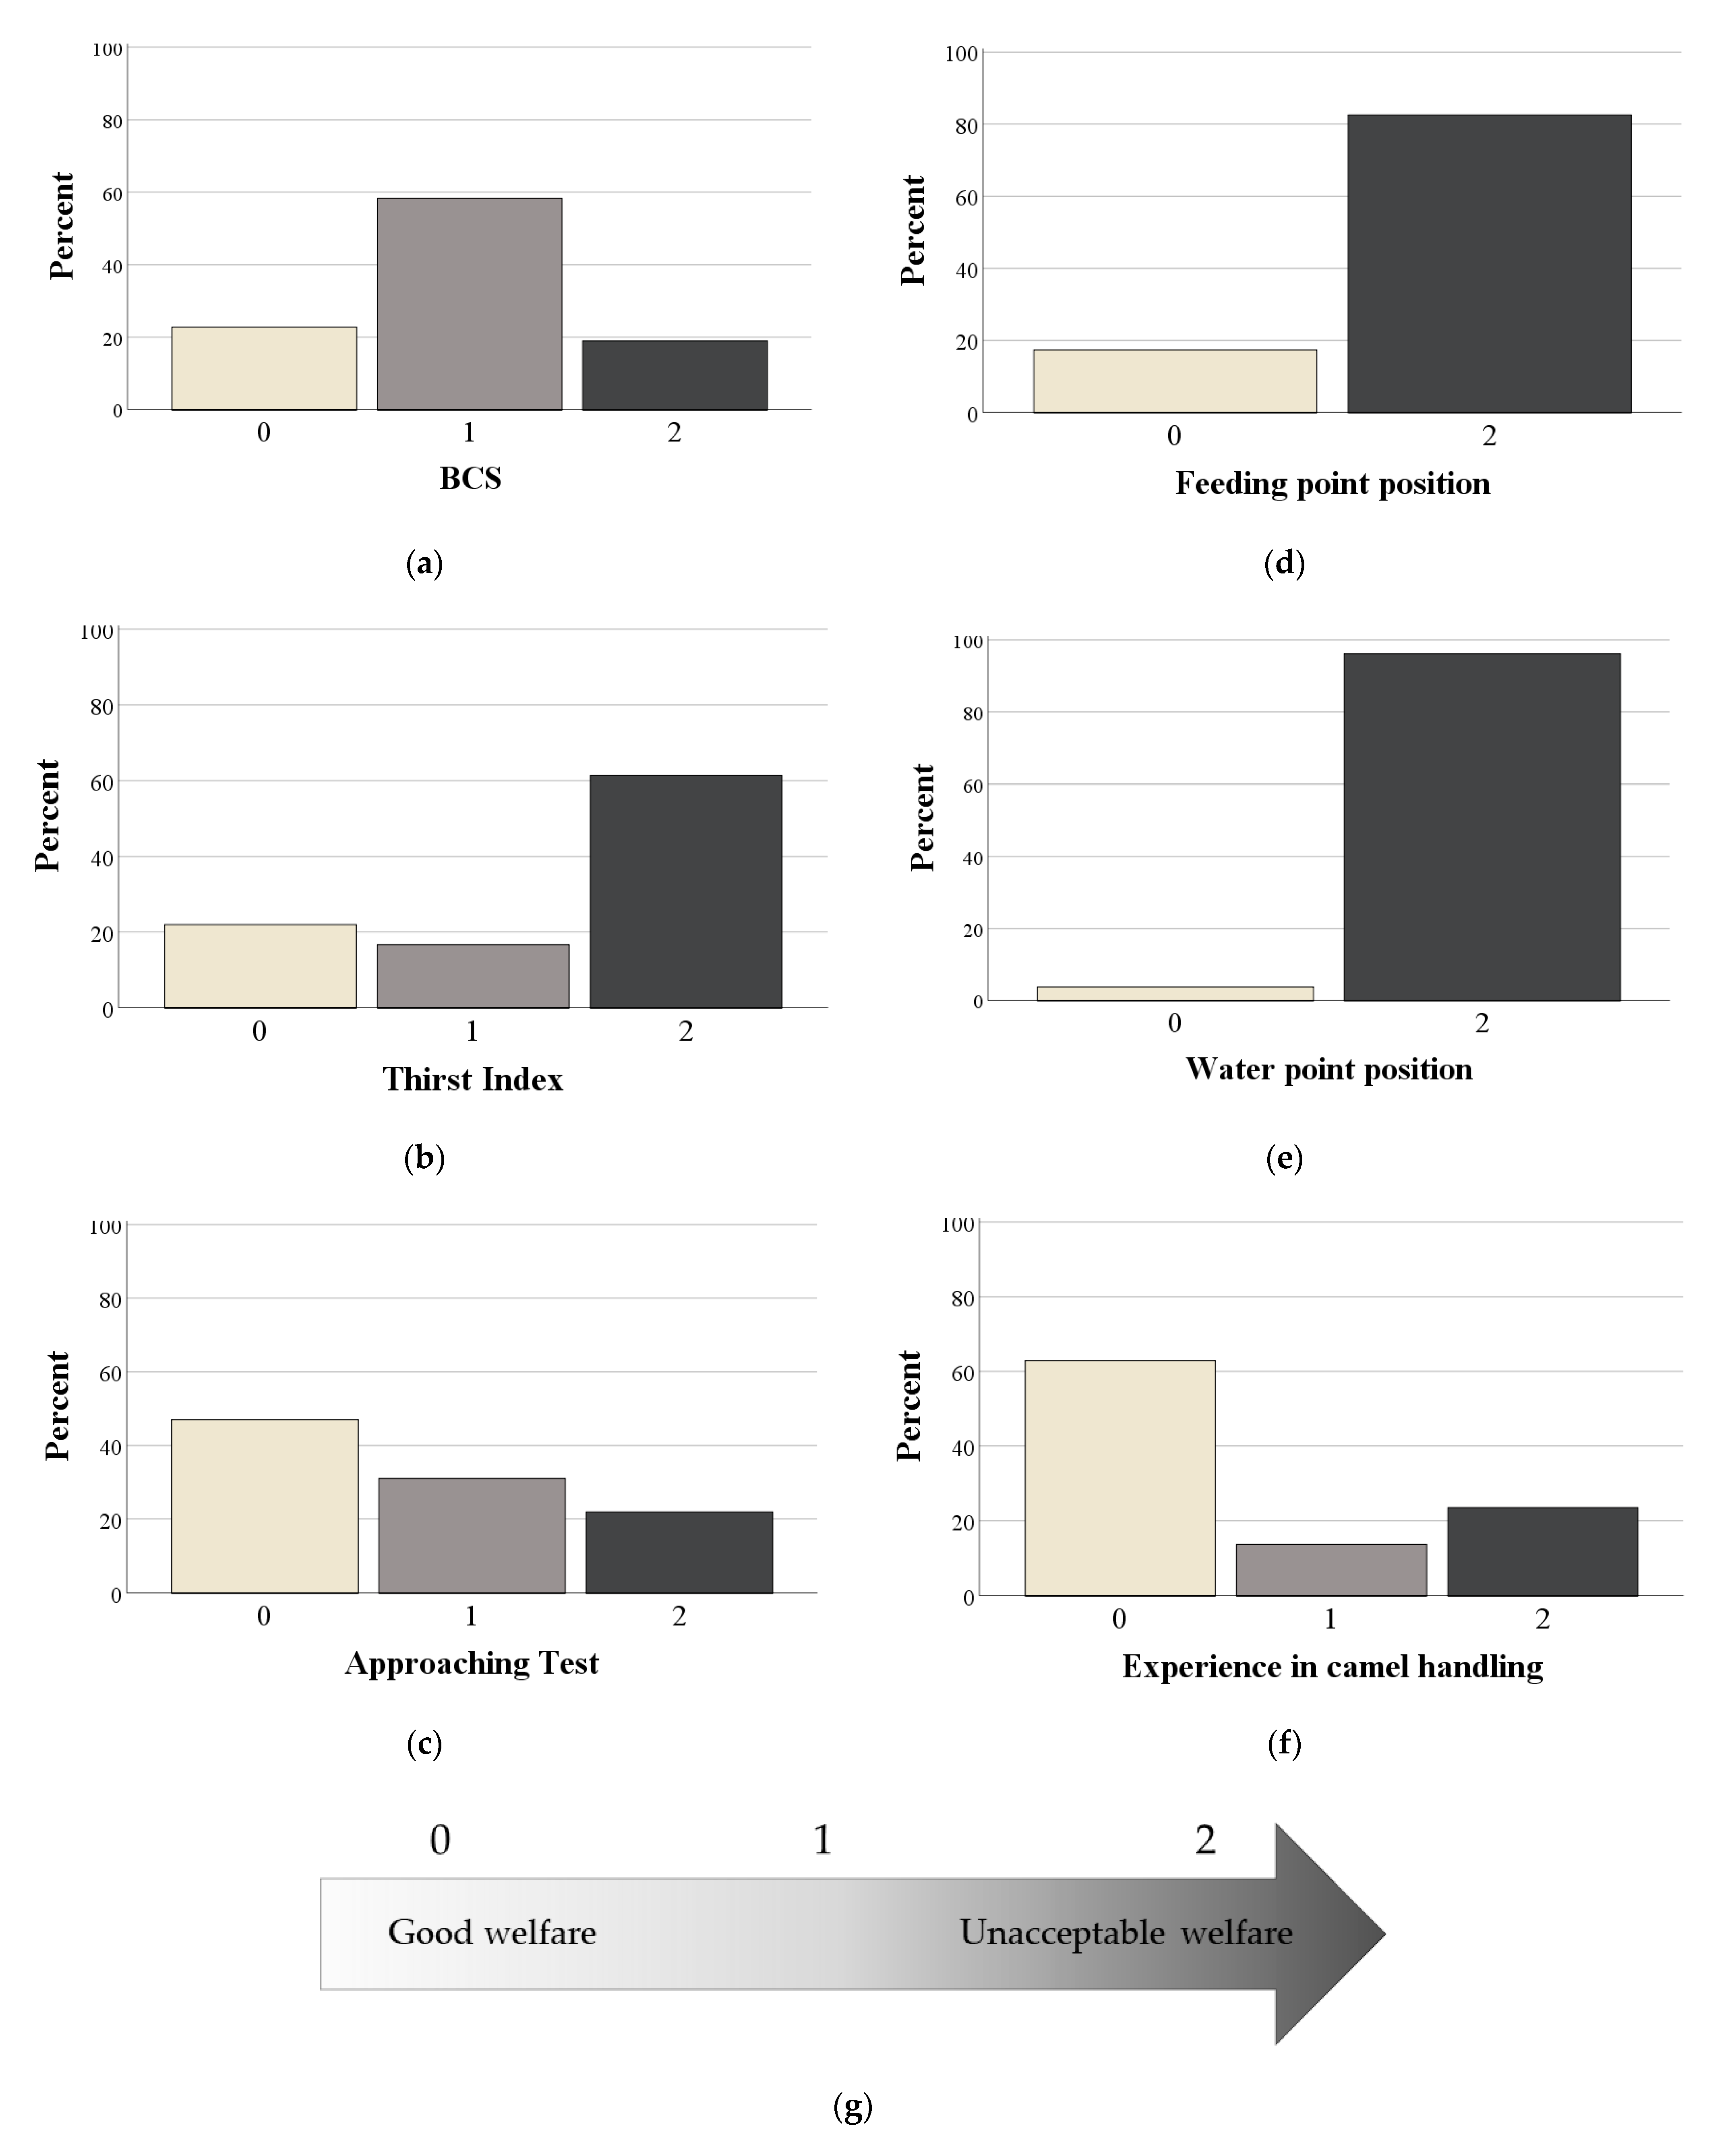
| Animal-based | BCS | 0 | 12 a | 63.2% | 0 b | 0.0% | 0.002 |
| 1 | 3 a | 15.8% | 5 a | 50.0% | |||
| 2 | 4 a | 21.0% | 5 a | 50.0% | |||
| Thirst Index | 0 | 6 a | 31.6% | 0 b | 0.0% | 0.088 | |
| 1 | 3 a | 15.8% | 1 b | 10.0% | |||
| 2 | 10 a | 52.6% | 9 b | 90.0% | |||
| Approaching test | 0 | 15 a | 78.9% | 5 a | 50.0% | 0.079 | |
| 1 | 1 a | 5.3% | 4 b | 40.0% | |||
| 2 | 3 a | 15.8% | 1 a | 10.0% | |||
| Camels with a disease 1 | 33.3 (0.0–50.0) | 36.7 (33.3–60.0) | 0.403 | ||||
| Camels with physical injuries 1 | 0.0 (0.0–0.0) | 7.1 (0.0–20.0) | 0.138 | ||||
| Resourced- and management-based | Frequency of feed distribution 2 | 0 | 5 a | 26.3% | 0 a | 0.0% | 0.134 |
| 2 | 14 a | 73.7% | 10 a | 100.0% | |||
| Frequency of water distribution 2 | 0 | 10 a | 52.6% | 0 a | 0.0% | 0.005 | |
| 2 | 9 a | 47.4% | 10 b | 100.0% | |||
| Water space per animal | 0 | 8 a | 42.1% | 2 a | 20.0% | 0.048 | |
| 1 | 4 a | 21.1% | 7 b | 70.0% | |||
| 2 | 7 a | 36.8% | 1 a | 10.0% | |||
| Feeding space per animal | 0 | 7 a | 36.8% | 2 a | 20.0% | 0.560 | |
| 1 | 6 a | 31.6% | 3 a | 30.0% | |||
| 2 | 6 a | 31.6% | 5 a | 50.0% | |||
| Shelter 3 | 0 | 19 a | 100.0% | 8 a | 80.0% | 0.111 | |
| 2 | 0 a | 0.0% | 2 b | 20.0% | |||
| Cleanliness of bedding | 0 | 9 a | 47.4% | 4 a | 40.0% | 0.213 | |
| 1 | 9 a | 47.4% | 3 a | 30.0% | |||
| 2 | 1 a | 5.2% | 3 a | 30.0% | |||
| Rubbish 3 | 0 | 12 a | 63.2% | 3 a | 30.0% | 0.128 | |
| 2 | 7 a | 36.8% | 7 a | 70.0% | |||
| Type of Measure | Measure | Score | Welfare Class | p Value * | |||
|---|---|---|---|---|---|---|---|
| Green | Red | ||||||
| Count | N % | Count | N % | ||||
| Animal-based | BCS | 0 | 13 a | 56.5% | 4 b | 16.0% | 0.014 |
| 1 | 7 a | 30.4% | 16 b | 64.0% | |||
| 2 | 3 a | 13.1% | 5 a | 20.0% | |||
| Thirst Index | 0 | 10 a | 43.5% | 2 b | 8.0% | 0.011 | |
| 1 | 4 a | 17.4% | 4 a | 16.0% | |||
| 2 | 9 a | 39.1% | 19 b | 76.0% | |||
| Approaching test | 0 | 14 a | 60.9% | 11 a | 44.0% | 0.519 | |
| 1 | 5 a | 21.7% | 7 a | 28.0% | |||
| 2 | 4 a | 17.4% | 7 a | 28.0% | |||
| Camels with a disease 1 | 33.3 (0.0–50.0) | 66.7 (31.0–92.3) | 0.028 | ||||
| Camels with physical injuries 1 | 0.0 (0.0–0.0) | 6.3 (0.0–20.0) | 0.007 | ||||
| Resource- and management-based | Frequency of feed distribution 2 | 0 | 9 a | 39.1% | 3 b | 12.0% | 0.046 |
| 2 | 14 a | 60.9% | 22 b | 88.0% | |||
| Frequency of water distribution 2 | 0 | 13 a | 56.5% | 11 a | 44.0% | 0.564 | |
| 2 | 10 a | 43.5% | 14 a | 56.0% | |||
| Water space per animal | 0 | 1 a | 47.8% | 9 a | 36.0% | 0.439 | |
| 1 | 5 a | 21.8% | 10 a | 40.0% | |||
| 2 | 7 a | 30.4% | 6 a | 24.0% | |||
| Feeding space per animal | 0 | 9 a | 39.1% | 7 a | 28.0% | 0.449 | |
| 1 | 8 a | 34.8% | 7 a | 28.0% | |||
| 2 | 6 a | 26.1% | 11 a | 44.0% | |||
| Shelter 3 | 0 | 21 a | 91.3% | 20 a | 80.0% | 0.419 | |
| 2 | 2 a | 8.7% | 5 a | 20.0% | |||
| Cleanliness of bedding | 0 | 9 a | 39.1% | 10 a | 40.0% | 0.027 | |
| 1 | 13 a | 56.5% | 7 b | 28.0% | |||
| 2 | 1 a | 4.4% | 8 b | 32.0% | |||
| Rubbish 3 | 0 | 14 a | 60.9% | 11 a | 44.0% | 0.265 | |
| 2 | 9 a | 39.1% | 14 a | 56.0% | |||
Publisher’s Note: MDPI stays neutral with regard to jurisdictional claims in published maps and institutional affiliations. |
© 2021 by the authors. Licensee MDPI, Basel, Switzerland. This article is an open access article distributed under the terms and conditions of the Creative Commons Attribution (CC BY) license (http://creativecommons.org/licenses/by/4.0/).
Share and Cite
Menchetti, L.; Zappaterra, M.; Nanni Costa, L.; Padalino, B. Application of a Protocol to Assess Camel Welfare: Scoring System of Collected Measures, Aggregated Assessment Indices, and Criteria to Classify a Pen. Animals 2021, 11, 494. https://0-doi-org.brum.beds.ac.uk/10.3390/ani11020494
Menchetti L, Zappaterra M, Nanni Costa L, Padalino B. Application of a Protocol to Assess Camel Welfare: Scoring System of Collected Measures, Aggregated Assessment Indices, and Criteria to Classify a Pen. Animals. 2021; 11(2):494. https://0-doi-org.brum.beds.ac.uk/10.3390/ani11020494
Chicago/Turabian StyleMenchetti, Laura, Martina Zappaterra, Leonardo Nanni Costa, and Barbara Padalino. 2021. "Application of a Protocol to Assess Camel Welfare: Scoring System of Collected Measures, Aggregated Assessment Indices, and Criteria to Classify a Pen" Animals 11, no. 2: 494. https://0-doi-org.brum.beds.ac.uk/10.3390/ani11020494