
One Is the Coldest Number: How Group Size and Body Weight Affect Thermal Preference in Weaned Pigs (3 to 15 kg)


Abstract
:Simple Summary
Abstract
1. Introduction
2. Materials and Methods
2.1. Animals and Housing
2.2. Experimental Design
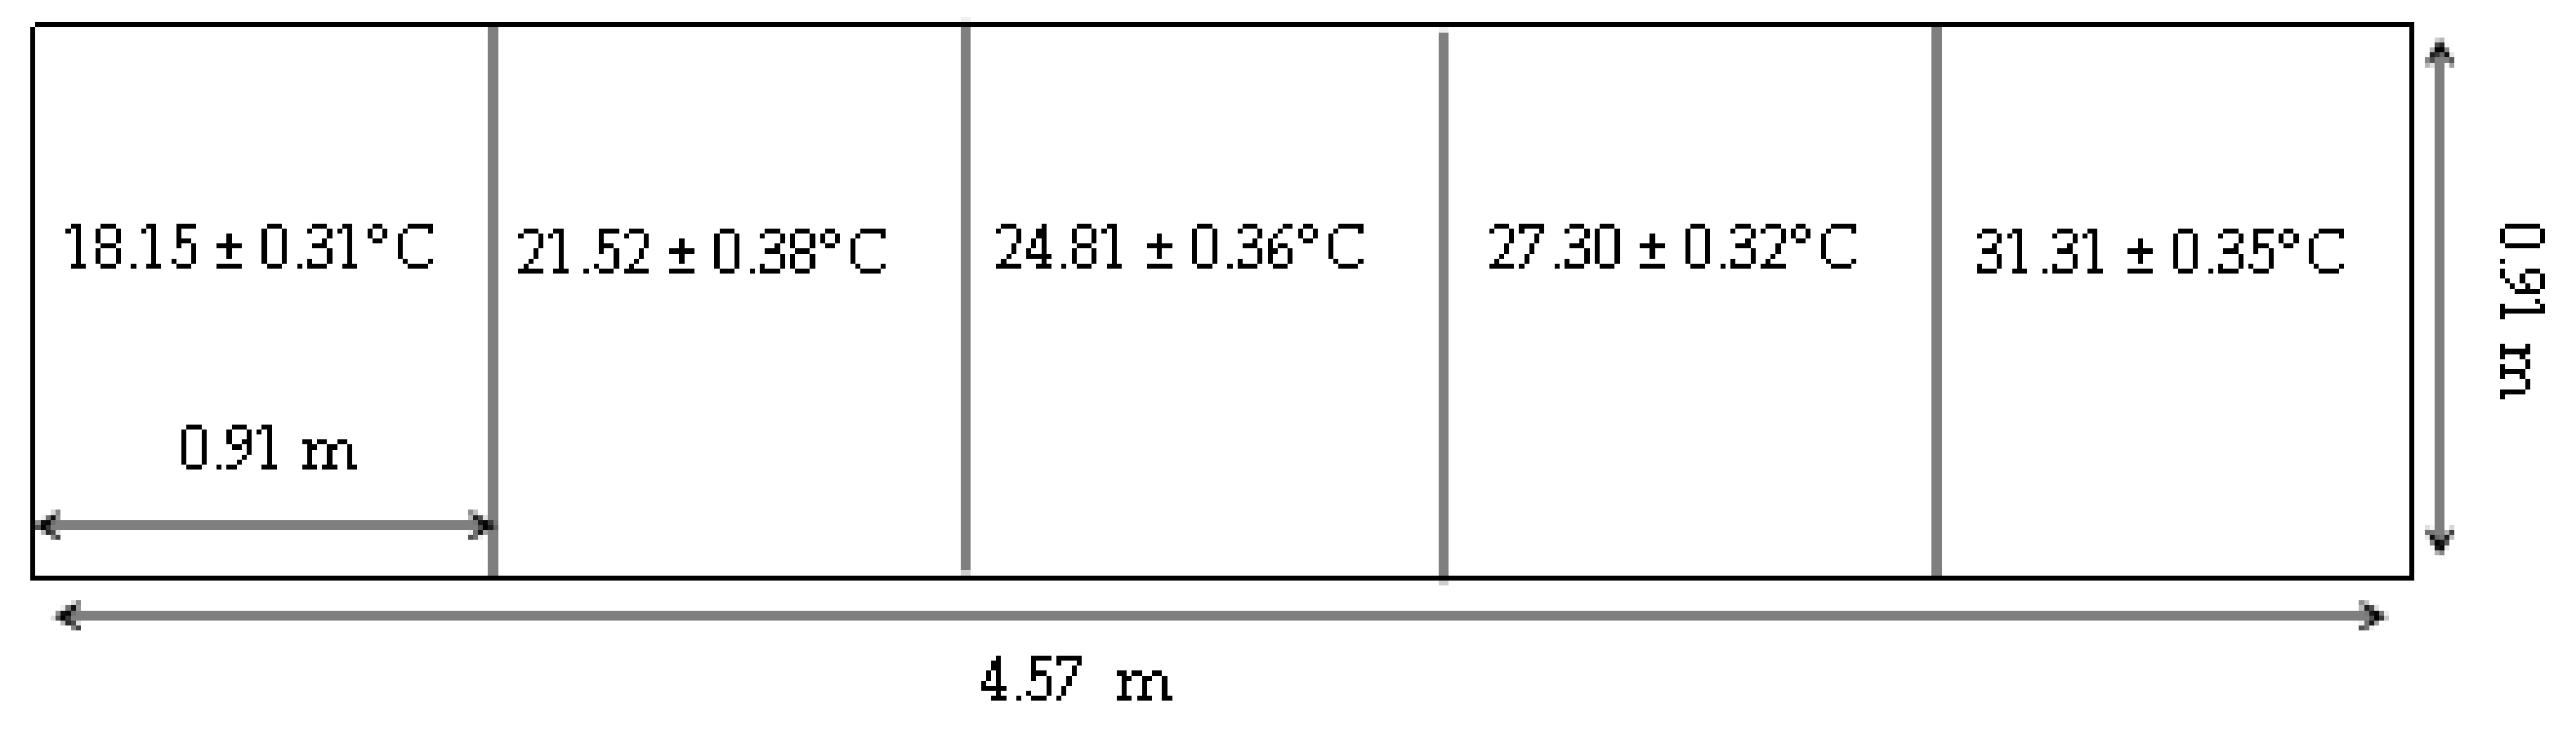
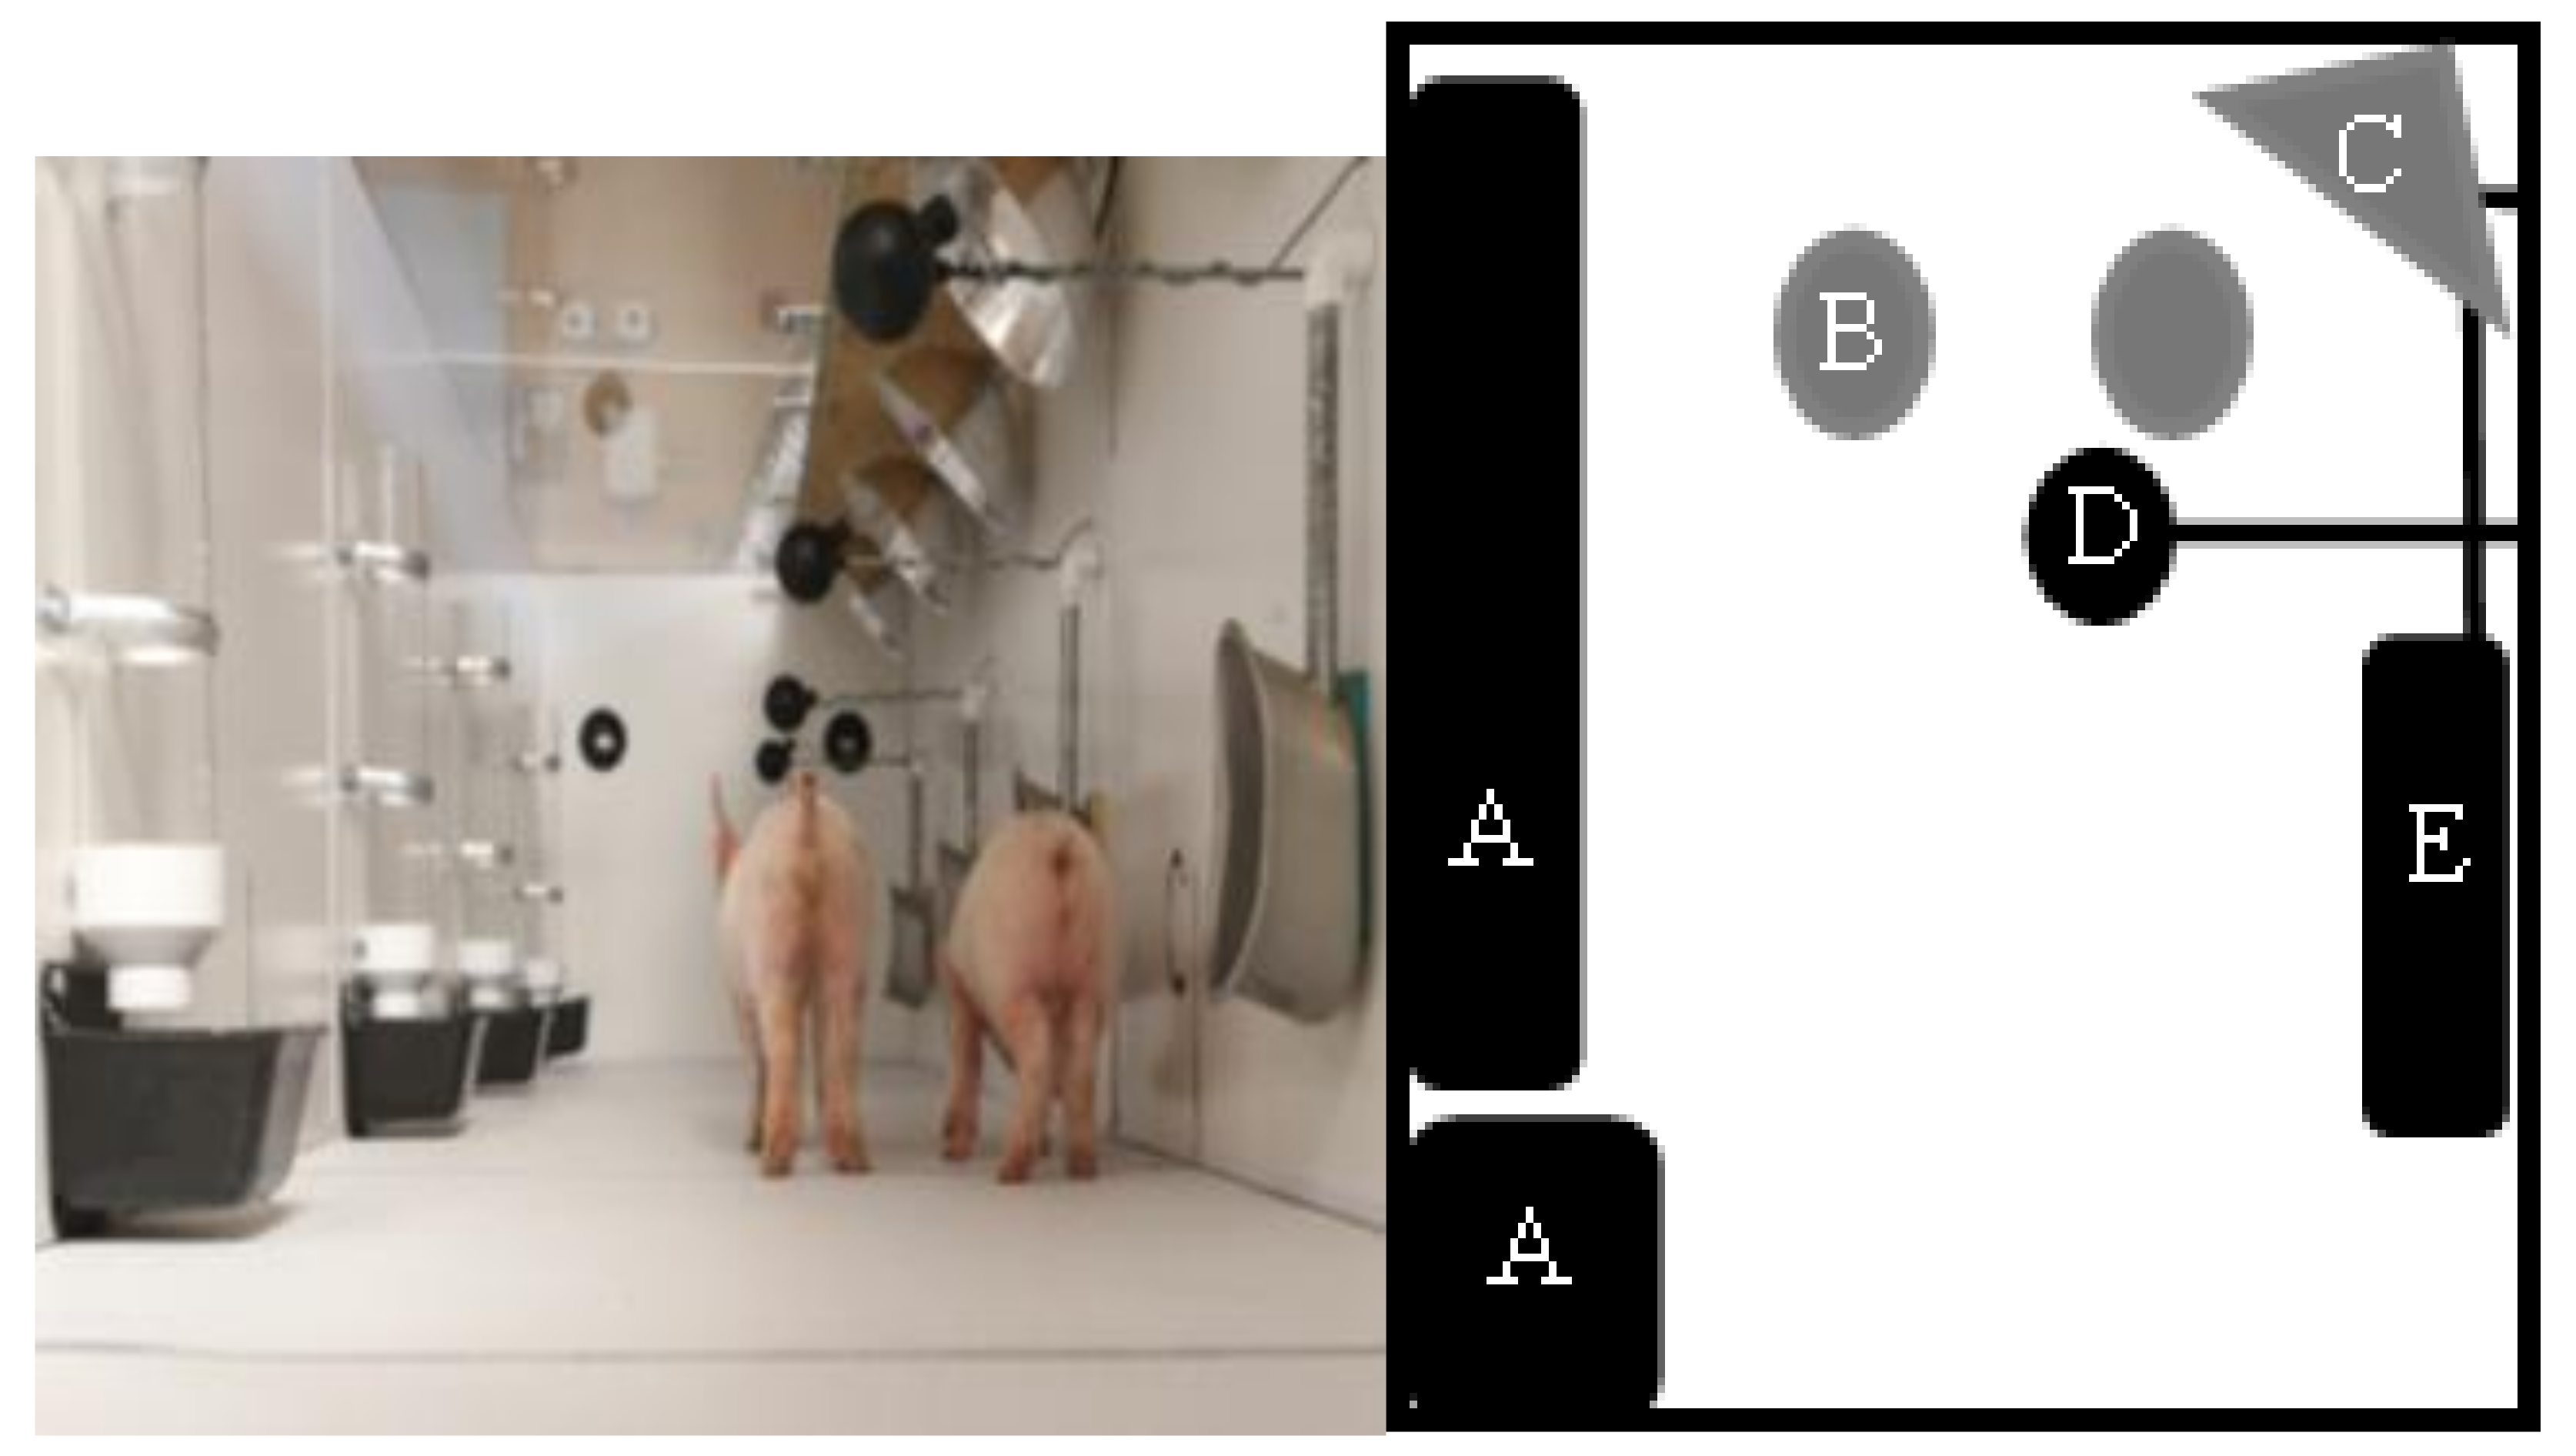
2.2.1. Thermal Apparatus
2.2.2. Behavior and Posture by Location
2.3. Analyses
2.3.1. Behavior by Location
2.3.2. Posture by Location
3. Results
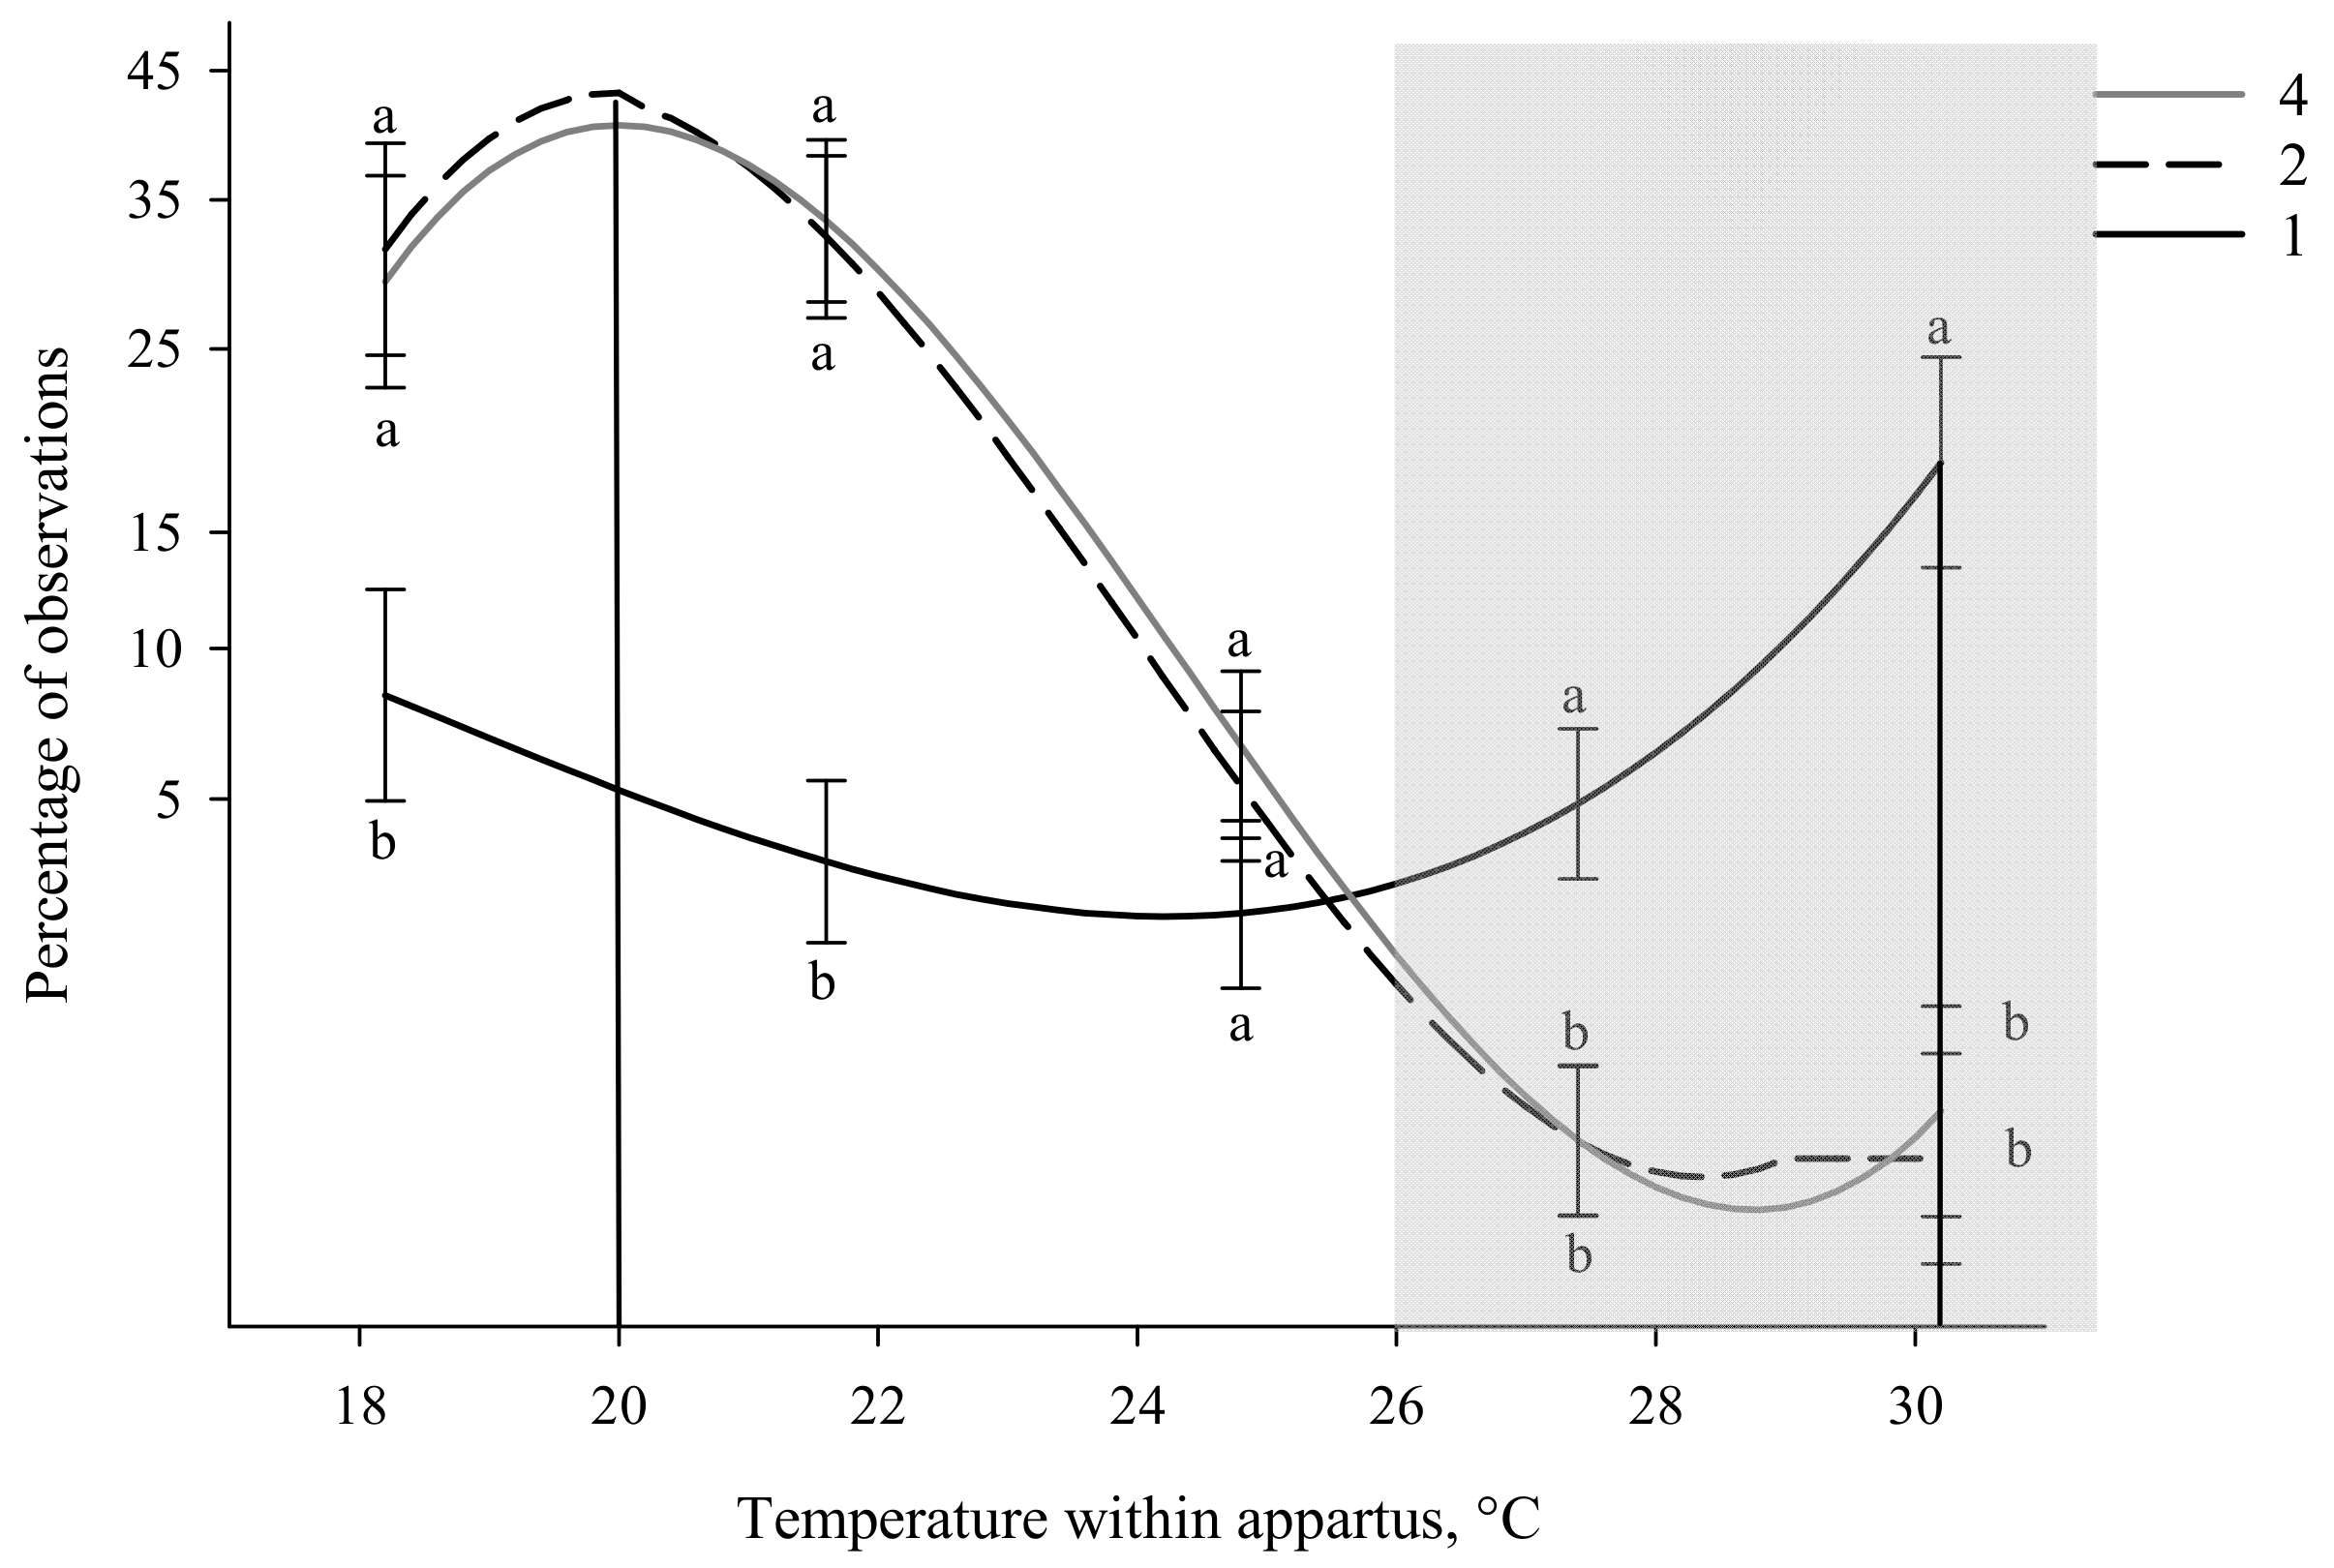
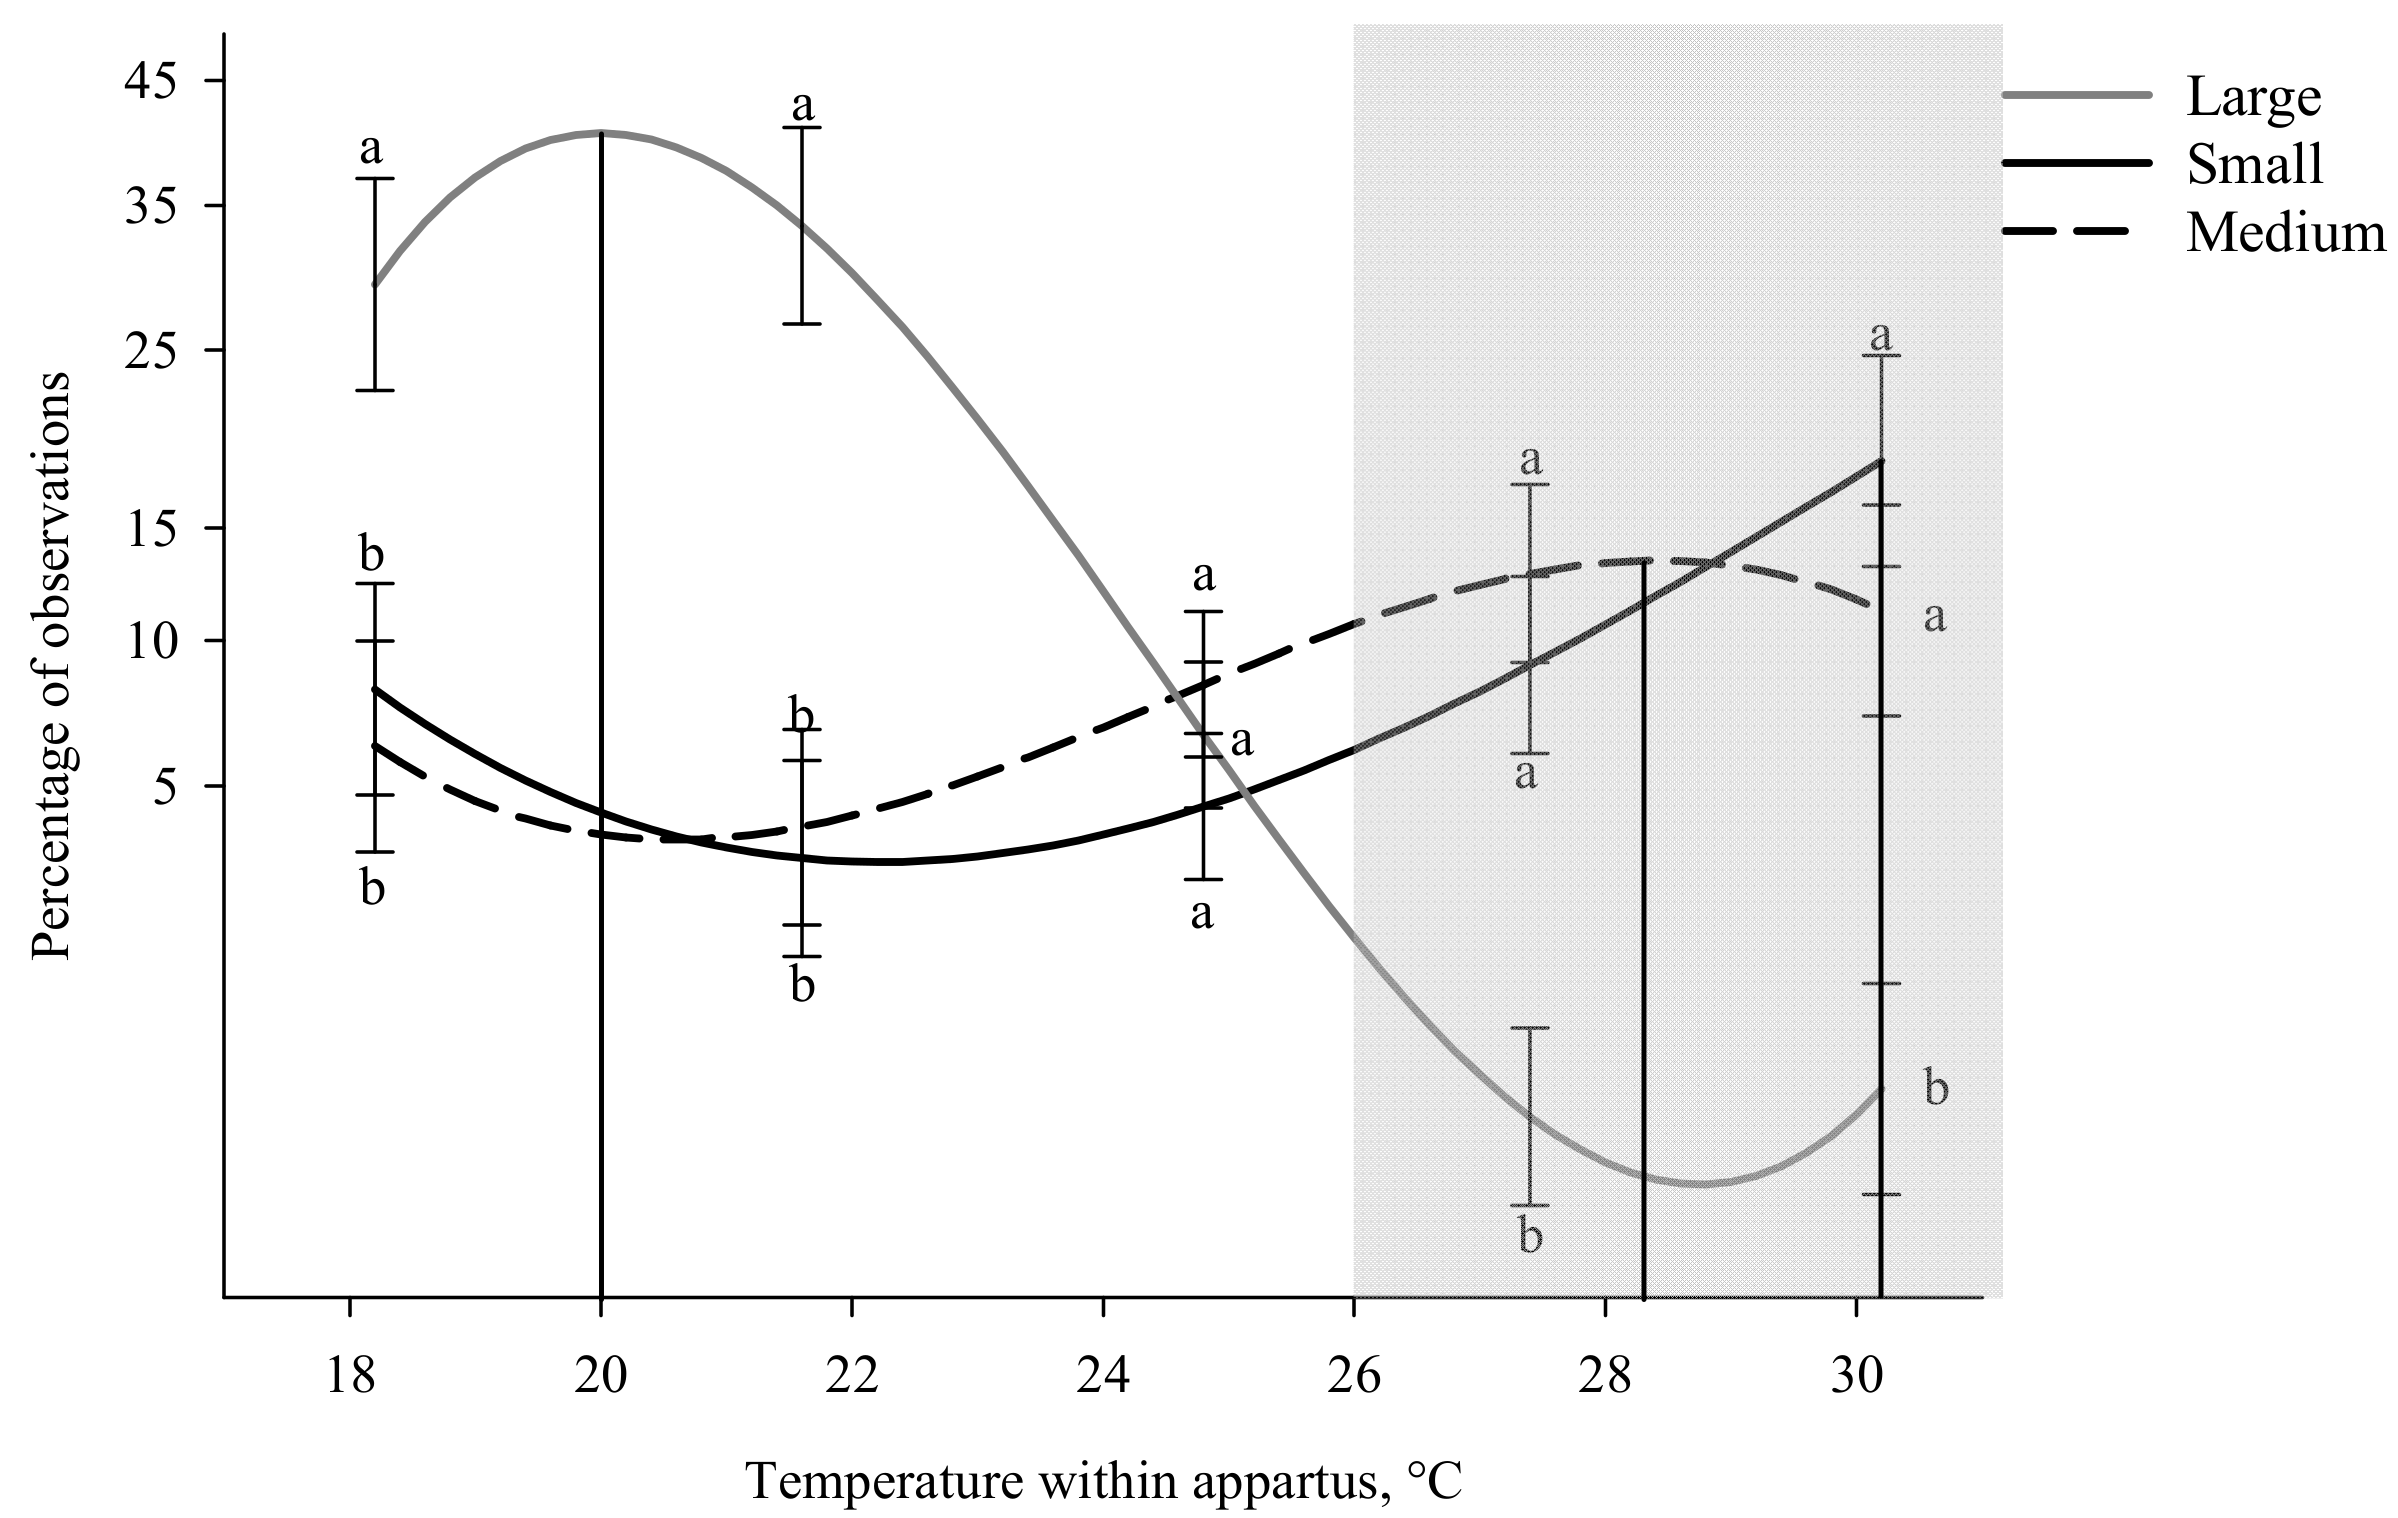
3.1. Behavior by Location
3.2. Posture by Location
4. Discussion
5. Conclusions
Supplementary Materials
Author Contributions
Funding
Institutional Review Board Statement
Acknowledgments
Conflicts of Interest
References
- Glancy, J.; Groß, R.; Stone, J.V.; Wilson, S.P. A Self-Organising Model of Thermoregulatory Huddling. PLoS Comput. Biol. 2015, 11, e1004283. [Google Scholar] [CrossRef] [PubMed] [Green Version]
- Gordon, C.J. Introduction to temperature regulation. In Temperature Regulation in Laboratory Rodents; Cambridge University Press (CUP): Cambridge, UK, 1993; pp. 1–18. [Google Scholar]
- Heldmaier, G. The influence of the social thermoregulation on the cold-adaptive growth of BAT in hairless and furred mice. Pflügers Arch.-Eur. J. Physiol. 1975, 355, 261–266. [Google Scholar] [CrossRef] [PubMed]
- Gilbert, C.; McCafferty, D.; Le Maho, Y.; Martrette, J.-M.; Giroud, S.; Blanc, S.; Ancel, A. One for all and all for one: The energetic benefits of huddling in endotherms. Biol. Rev. 2009, 85, 545–569. [Google Scholar] [CrossRef] [PubMed]
- Mount, L.E.; Stephens, D.B. The relation between body size and maximum and minimum metabolic rates in the new-born pig. J. Physiol. 1970, 207, 417–427. [Google Scholar] [CrossRef] [PubMed]
- White, C.R.; Seymour, R.S. Mammalian Basal Metabolic Rate Is Proportional to Body Mass2/3. Proc. Natl. Acad. Sci. USA 2003, 100, 4046–4049. [Google Scholar] [CrossRef] [PubMed] [Green Version]
- Canals, M.; Rosenmann, M.; Bozinovic, F. Energetics and geometry of huddling in small mammals. J. Theor. Biol. 1989, 141, 181–189. [Google Scholar] [CrossRef]
- Baldwin, B.; Ingram, D. Behavioural thermoregulation in pigs. Physiol. Behav. 1967, 2, 15–16. [Google Scholar] [CrossRef]
- Mount, L. The assessment of thermal environment in relation to pig production. Livest. Prod. Sci. 1975, 2, 381–392. [Google Scholar] [CrossRef]
- Balsbaugh, R.K.; Curtis, S.E.; Meyer, R.C.; Norton, H.W. Cold Resistance and Environmental Temperature Preference in Diarrheic Piglets. J. Anim. Sci. 1986, 62, 315–326. [Google Scholar] [CrossRef] [PubMed]
- Vasdal, G.; Møgedal, I.; Bøe, K.E.; Kirkden, R.; Andersen, I.L. Piglet preference for infrared temperature and flooring. Appl. Anim. Behav. Sci. 2010, 122, 92–97. [Google Scholar] [CrossRef]
- Federation of Animal Science Societies. Chapter 9: Swine. In Guide for the Care and Use of Agricultural Animals in Research and Teaching, 4th ed.; American Dairy Science Association: Champaign, IL, USA, 2020; p. 128. [Google Scholar]
- Mead, R. Part IV CODA 0.8 Block x treatment and experiment x treatment interactions. In The Design of Experiments: Statistical Principles for Practical Applications; Cambridge University Press: Cambridge, UK, 1990; pp. 605–609. [Google Scholar]
- Robbins, L.A.; Green-Miller, A.R.; Johnson, J.S.; Gaskill, B.N. Early Life Thermal Stress: Impacts on Future Temperature Pref-erence in Weaned Pigs (3 to 15 kg). J. Anim. Sci. 2020, 98, skaa327. [Google Scholar] [PubMed]
- Robbins, L.; Green-Miller, A.R.; Johnson, J.S.; Gonzales, C.; Gaskill, B.N. Thermocline Design for Thermal Preference Testing in Piglets. In Proceedings of the 10th International Livestock Environment Symposium (ILES X), Omaha, NE, USA, 25–27 September 2018. [Google Scholar]
- Ledgerwood, D.; Winckler, C.; Tucker, C. Evaluation of data loggers, sampling intervals, and editing techniques for measuring the lying behavior of dairy cattle. J. Dairy Sci. 2010, 93, 5129–5139. [Google Scholar] [CrossRef] [PubMed]
- Grafen, A.; Hails, R. Chapter 3: Models, parameters and GLMs. In Modern Statistics for the Life Sciences; Oxford University Press: Oxford, UK, 2002; pp. 47–55. [Google Scholar]
- Newman, J.A.; Bergelson, J.; Grafen, A. Blocking Factors and Hypothesis Tests in Ecology: Is Your Statistics Text Wrong? Ecology 1997, 78, 1312–1320. [Google Scholar] [CrossRef]
- Vickery, W.L.; Millar, J.S. The Energetics of Huddling by Endotherms. Oikos 1984, 43, 88. [Google Scholar] [CrossRef]
- Martin, R.A.; Fiorentini, M.; Connors, F. Social facilitation of reduced oxygen consumption in Mus musculus and Meriones unguiculatus. Comp. Biochem. Physiol. Part A Physiol. 1980, 65, 519–522. [Google Scholar] [CrossRef]
- Orloff, S.; Bali, K.; Putnam, D. Deficit irrigation of alfalfa and grasses: What are the impacts/options. In Proceedings of the California Alfalfa and Grains Symposium Proceedings, Fresno, CA, USA, 10–12 December 2014. [Google Scholar]
- Wang, L.-H.; Li, Y.-Z.; Johnston, L.J. Effects of Reduced Nocturnal Temperature on Performance and Behavior of Nursery Pigs. J. Integr. Agric. 2012, 11, 1509–1516. [Google Scholar] [CrossRef]
- Roverud, R.C.; Chappell, M.A. Energetic and Thermoregulatory Aspects of Clustering Behavior in the Neotropical Bat Noctilio albiventris. Physiol. Zoöl. 1991, 64, 1527–1541. [Google Scholar] [CrossRef]
- Bench, C.J.; Gonyou, H.W. Temperature preference in piglets weaned at 12–14 days of age. Can. J. Anim. Sci. 2007, 87, 299–302. [Google Scholar] [CrossRef]
- Mount, L.E. The influence of huddling and body size on the metabolic rate of the young pig. J. Agric. Sci. 1960, 55, 101–105. [Google Scholar] [CrossRef]
- NRC. Effects of Environment on Nutrient Requirements of Domestic Animals, 11th ed.; National Academies Press: Washington, DC, USA, 1981. [Google Scholar]
- De Shazer, J.A.; Overhults, D.G. Energy Demand in Livestock Production. In Proceedings of the Livestock Environment II, 2nd International Livestock Environmental Symposium American Society of Agricultural Engineers, St. Joseph, MI, USA, 20–23 April 1982; pp. 17–27. [Google Scholar]
- Curtis, S.E. Physiological Responses and Adaptations of Swine. In Stress Physiology in Livestock; Ungulates; CRC Press: Boca Raton, FL, USA, 1985; Volume 2, pp. 129–139. [Google Scholar]
- Hahn, G.L. Housing and Management to Reduce Climatic Impacts on Livestock. J. Anim. Sci. 1981, 52, 175–186. [Google Scholar] [CrossRef] [PubMed]


| Weight Category, kg (n = 12) | Group Size (n = 4) | Average Weight, kg (Average ± SD) |
|---|---|---|
| Small (3–7) | 1 | 5.08 ± 1.22 |
| 2 | 5.15 ± 0.73 | |
| 4 | 5.65 ± 1.34 | |
| Medium (7.1–11) | 1 | 9.23 ± 1.78 |
| 2 | 9.23 ± 1.11 | |
| 4 | 9.09 ± 2.36 | |
| Large (11.1–15) | 1 | 12.79 ± 1.32 |
| 2 | 14.67 ± 0.49 | |
| 4 | 14.29 ± 1.15 |
| Parameter | Peak Temperature Preference, °C | Temperature Preference Range, °C | |
|---|---|---|---|
| Behavior Data | Group Size | ||
| 1 | 30.2 * | N/A | |
| 2 | 20.2 + | 18.6–21.0 | |
| 4 | 20.2 + | 18.6–21.2 | |
| Weight Category | |||
| Small | 30.2 * | N/A | |
| Medium | 28.4 * | 26.2–29.6 | |
| Large | 20.0 + | 19.0–21.0 | |
| Posture Data | Upright | ||
| Small | |||
| Medium | 30.2 ¶ | N/A | |
| Large | 30.2 ¶ | N/A | |
| Sternal | 19.8 § | 19.0–20.6 | |
| Small | |||
| Medium | 30.2 ¶ | N/A | |
| Large | 30.2 ¶ | N/A | |
| Lateral | 19.6 § | 18.8–20.6 | |
| Small | |||
| Medium | 30.2 ¶ | N/A | |
| Large | 29.4 ¶ | 28.4–30.2 | |
| Huddling | 20.6 § | 19.2–21.8 | |
| Huddling | 18.2 | 18.2–18.8 | |
Publisher’s Note: MDPI stays neutral with regard to jurisdictional claims in published maps and institutional affiliations. |
© 2021 by the authors. Licensee MDPI, Basel, Switzerland. This article is an open access article distributed under the terms and conditions of the Creative Commons Attribution (CC BY) license (https://creativecommons.org/licenses/by/4.0/).
Share and Cite
Robbins, L.A.; Green-Miller, A.R.; Johnson, J.S.; Gaskill, B.N. One Is the Coldest Number: How Group Size and Body Weight Affect Thermal Preference in Weaned Pigs (3 to 15 kg). Animals 2021, 11, 1447. https://0-doi-org.brum.beds.ac.uk/10.3390/ani11051447
Robbins LA, Green-Miller AR, Johnson JS, Gaskill BN. One Is the Coldest Number: How Group Size and Body Weight Affect Thermal Preference in Weaned Pigs (3 to 15 kg). Animals. 2021; 11(5):1447. https://0-doi-org.brum.beds.ac.uk/10.3390/ani11051447
Chicago/Turabian StyleRobbins, Lindsey A., Angela R. Green-Miller, Jay S. Johnson, and Brianna N. Gaskill. 2021. "One Is the Coldest Number: How Group Size and Body Weight Affect Thermal Preference in Weaned Pigs (3 to 15 kg)" Animals 11, no. 5: 1447. https://0-doi-org.brum.beds.ac.uk/10.3390/ani11051447