Article

Stable Isotopes Reveal the Dominant Species to Have the Widest Trophic Niche of Three Syntopic Microtus Voles

by
Linas Balčiauskas
1,*,
Raminta Skipitytė
1,2,
Andrius Garbaras
2,
Vitalijus Stirkė
1,
Laima Balčiauskienė
1 and
Vidmantas Remeikis
2
1
Nature Research Centre, Akademijos 2, 08412 Vilnius, Lithuania
2
Center for Physical Sciences and Technology, Saulėtekio av. 3, 02300 Vilnius, Lithuania
*
Author to whom correspondence should be addressed.
Submission received: 7 May 2021 / Revised: 8 June 2021 / Accepted: 15 June 2021 / Published: 17 June 2021
(This article belongs to the Section Wildlife)

Abstract

:

Simple Summary

Diets and the trophic positions of animals are fundamental issues in their ecology. We analysed the isotopic niches (as a proxy for trophic niches) of common (Microtus arvalis), field (M. agrestis), and root (M. oeconomus) voles co-occurring in orchards, berry plantations, and nearby meadows using isotopic (δ15N and δ13C) compositions from hair samples. We tested if the niche of the dominant common vole was widest, whether its width was related to the presence of other Microtus species, and whether there were intraspecific differences in average δ13C and δ15N stable isotope values. The obtained results showed relative stability in the trophic niche across the vegetative period. The isotopic niche of the common vole was the widest, exceeding the other two Microtus species by 1.6–3 times. Co-occurring vole species were separated according to δ13C (i.e., used different plants as main food), but they maintained similarity according to δ15N distribution. The effect of animal age and gender on the width of the trophic niche was strongest in root vole, which is a species that has spread across the country in the last 70 years. These results give new insights into the trophic ecology small herbivores, showing the impact of species co-occurrence.

Abstract

Diets and trophic positions of co-occurring animals are fundamental issues in their ecology, and these issues in syntopic rodents have been studied insufficiently. Using carbon (δ13C) and nitrogen (δ15N) stable isotope ratios from hair samples, we analysed the trophic niches of common (Microtus arvalis), field (M. agrestis), and root (M. oeconomus) voles co-occurring in orchards, berry plantations, and nearby meadows (as control habitat to orchards and plantations). We tested if the niche of the dominant common vole was the widest, whether its width depended on the presence of other vole species, and whether there were intraspecific differences. Results suggest stability in the trophic niches of all three Microtus species, as season explained only 2% of the variance. The widest trophic niche was a characteristic of the dominant common vole, the range of δ13C values exceeding the other two species by 1.6, the range of δ15N values exceeding the other two species by 1.9, and the total area of niche exceeding that of the other voles by 2.3–3 times. In the meadows and apple orchards, co-occurring vole species were separated according to δ13C (highest values in the dominant common vole), but they maintained similar δ15N values. Results give new insights into the trophic ecology small herbivores, showing the impact of species co-occurrence.

1. Introduction

Animal diets and their trophic positions are fundamental issues in ecology; therefore, they are studied through a number of different methods [1,2]. The variety of diets in rodents [3,4,5] depends, among other factors, on the sympatry and syntopy of their species and the diversity of inhabited habitats [6]. While investigations into the diet of sympatric rodents, i.e., those occurring in the same region, are quite common, analysis of the diet of syntopic species (those using the same habitat, sensu Hart et al. [7]) is not (see [8]).
In the temperate climate zone, most rodent species belong to one of three groups according to their diet: granivores, herbivores (Microtus and Arvicola species), or omnivores [9].
Our study concentrated on the evaluation of the trophic niche of three Microtus vole species, being sympatric and syntopic at the same time [10,11]. All of these species are herbivores [12,13,14,15], though food of animal origin can constitute up to 4.5% of volume or 12.3% of frequency in the diet of the field vole [16]. The foraging ecology of small herbivores has been less intensively studied [17,18], as studies of herbivory have mainly been based on data from ungulates, mostly cervids (i.e., [19]).
However, voles are territorial non-ruminants [17], inhabiting a variety of habitats, including those under anthropogenic influence [20,21] (and references therein). As they use dietary items of both agricultural and natural origin, the trophic structure in mammals inhabiting human modified landscapes may be altered [22]. In our case, all of the investigated vole species use moderately anthropogenic habitats, such as grazed grasslands, orchards, and suburban gardens [11,23,24]. It is known that dietary specialists are more sensitive to land use than generalists, but in all cases, the responses of the species are mostly negative [25]. Not all species in the different taxonomic groups are equally able to naturalize in the changed environments; therefore, they may have different patterns of abundance, diet, breeding, etc. [26].
In terms of animal niche, three primary axes are defined: time, space, and resources [27,28,29]. In co-occurring syntopic vole species, two of these dimensions (time and space, as voles were trapped in the same trapping sessions) overlap; therefore, we should expect resource partitioning [10]. Anthropogenic impact alters spatial and temporal niches, but it is not clear how changes in the diet and resource partitioning are affected, [29]. Shifts of trophic niches in relation to human-induced changes require further investigations [30]. In the case of Microtus voles, niche research has so far mostly targeted the temporal and spatial niche elements [31,32,33,34,35]. Therefore, we oriented to the evaluation of the trophic niche in agricultural habitats, considering also the opinion of Bolnick et al. [36] that ecological release from interspecific competition can lead to increases in niche width.
First used in diet studies over 40 years ago (see [37,38]), stable isotope analysis has become a frequent tool in mammalian ecology, using isotope ratios of carbon (δ13C) and nitrogen (δ15N) to determine basal food resources and trophic positions [39]. This approach is powerful in its application to communities, e.g., for the analysis of resource partitioning and trophic niche dimensions [10,29,40,41,42,43]. Carbon and nitrogen stable isotope ratios allow the identification of diet changes [44] or the influence of habitat conditions [45]. Variance of stable isotope ratios offer a significant technique for estimating trophic niche widths in animals [46]. Despite some concerns expressed by [47], stable isotope ratios can be used as a proxy for trophic niche [48].
The aim of our study was to evaluate the width of the trophic niche of three sympatrically or syntopically co-occurring species of Microtus voles according to stable isotope (δ13C and δ15N) ratios. We tested three working hypotheses:
  • Interspecific differences of stable isotope distribution in common (Microtus arvalis), field (M. agrestis), and root (M. oeconomus) voles do exist, with the trophic niche of the dominant species, the common vole, being widest,
  • The width of the trophic niche of the dominant species is related to the presence of syntopically co-occurring Microtus species,
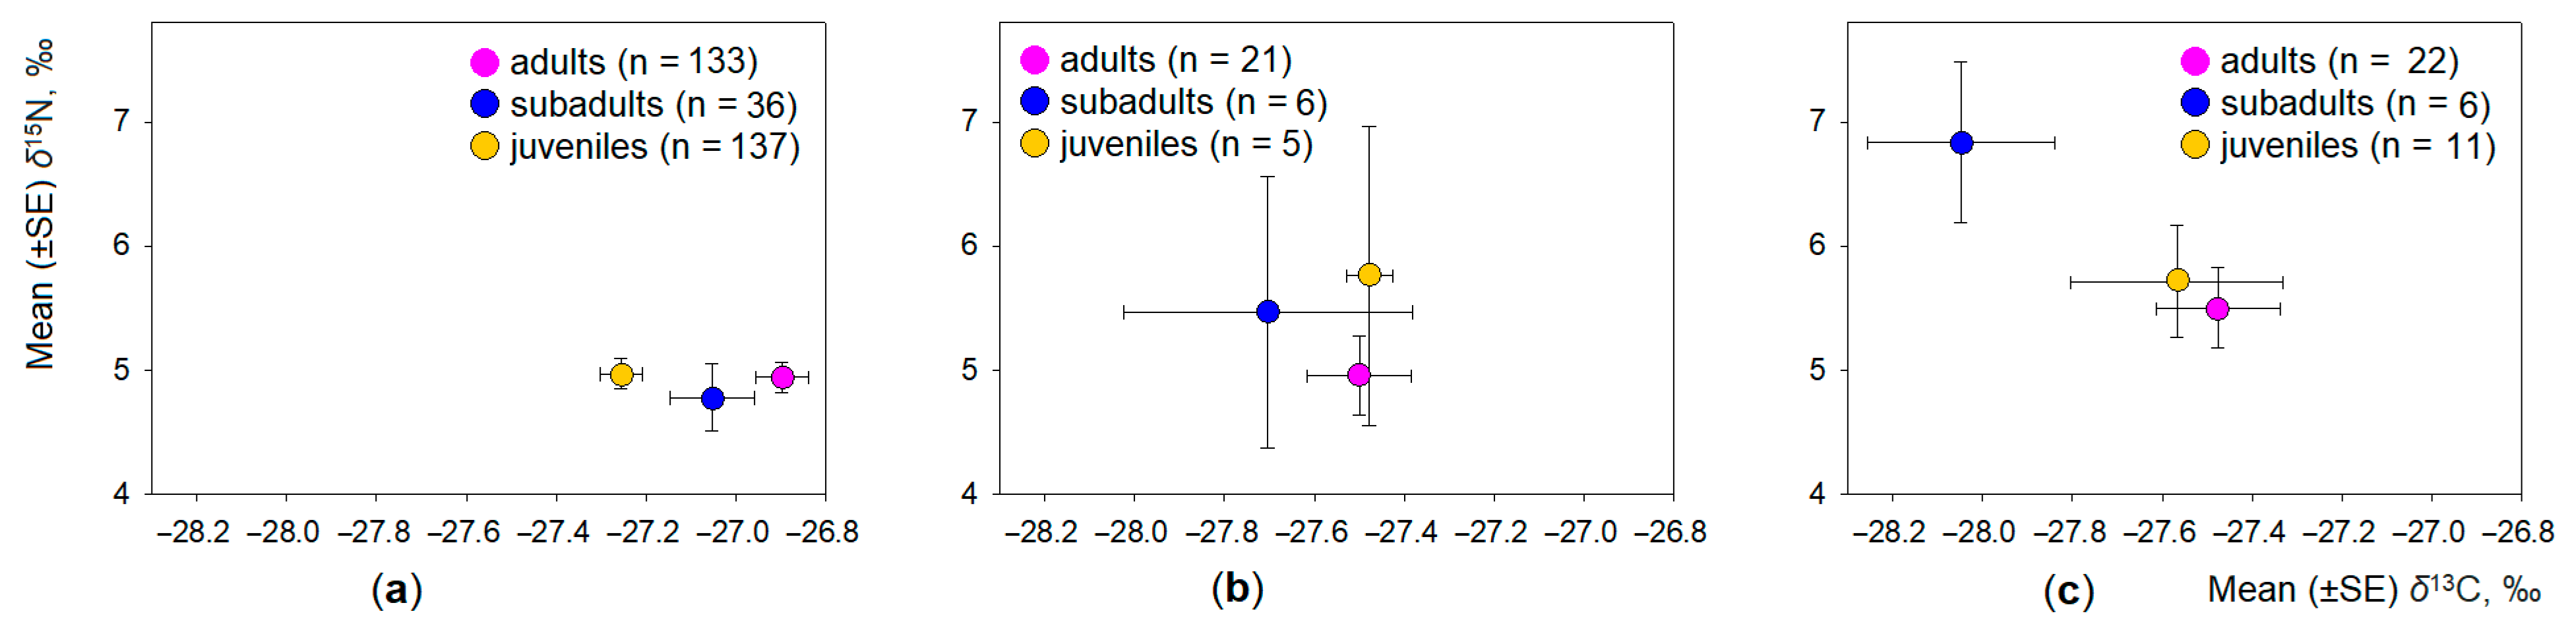
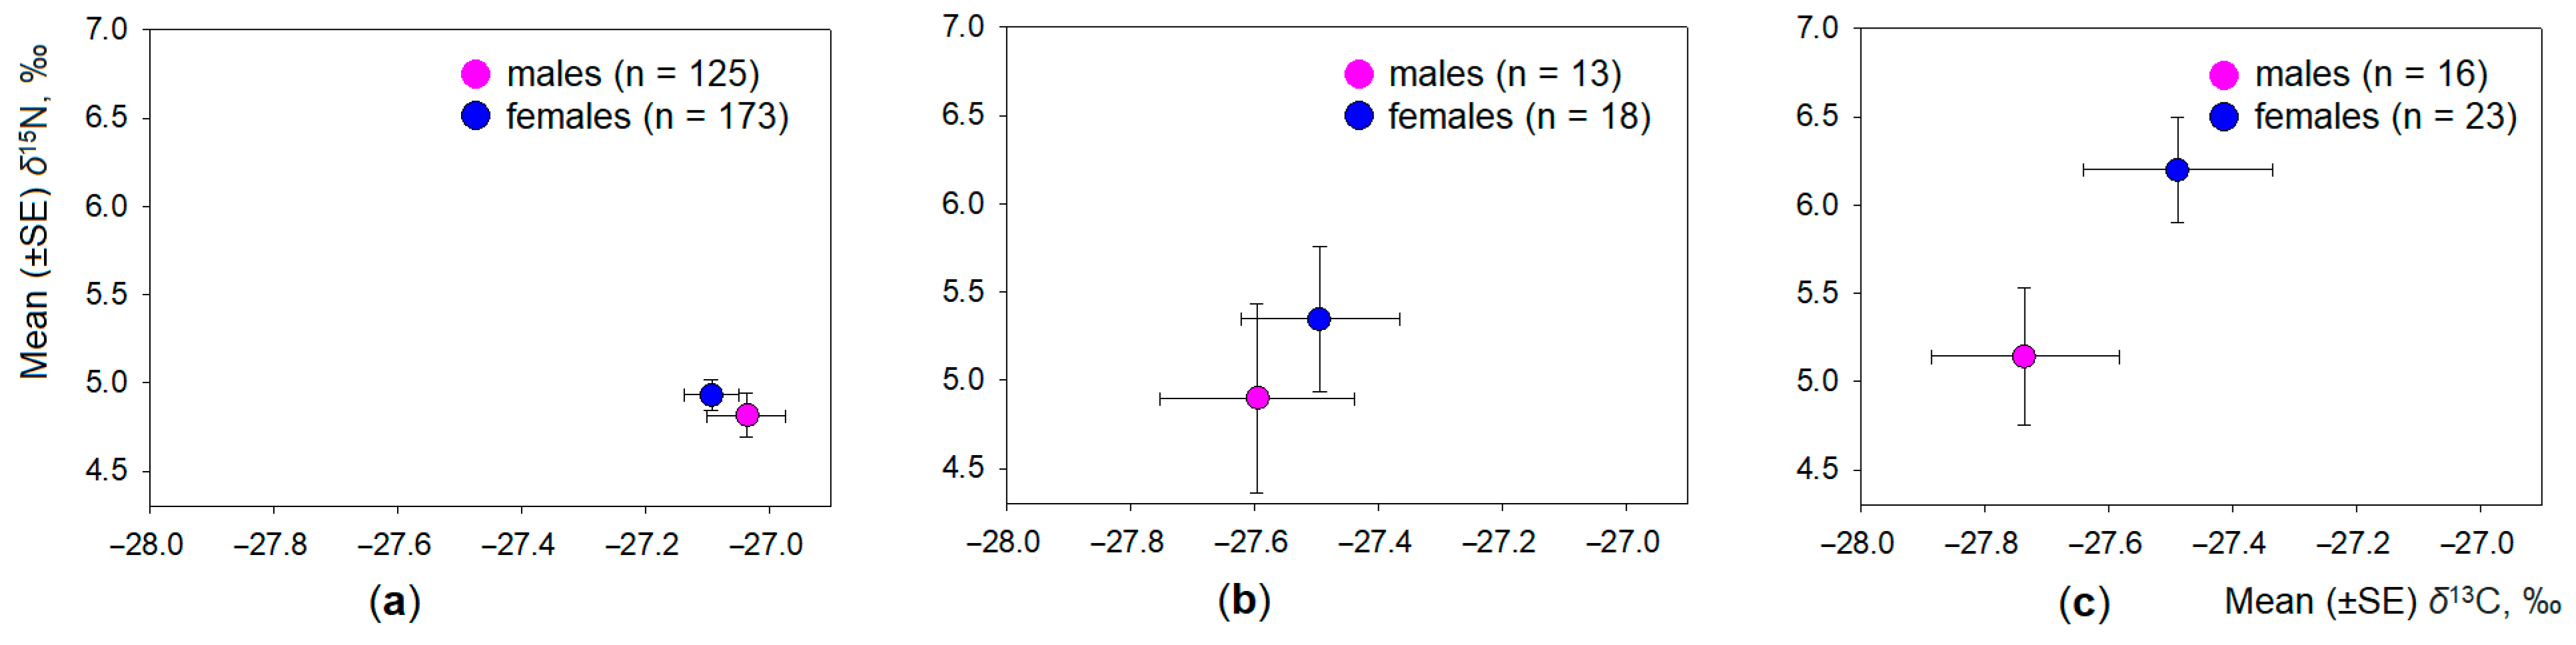
  • Intraspecific differences of the stable isotope distribution are absent, with no differences in average carbon and nitrogen stable isotope values in males and females and between the age groups of the same species.

2. Material and Methods

2.1. Study Sites and Small Mammal Trapping

Voles were trapped at 18 study sites in Lithuania (northern Europe, 55° 19′ N, 23° 54′ E) in 2018–2020, covering agricultural habitats (apple or plum orchards, currant, raspberry, and highbush blueberry plantations) and neighboring meadows as control habitats being in the vicinity of agricultural ones. At each study site, there was one orchard or plantation and one meadow. More site and habitat details are presented in Balčiauskas et al. [11] and Stirkė et al. [24]. At four sites, common voles, field voles, and root voles lived sympatrically. At five sites, two Microtus species were trapped, one of these being common vole. Eight other sites were inhabited by common voles only, while no Microtus were trapped at one site (Figure 1). At all sites with co-occurrence, common vole strongly dominated over the other two species by numbers.
Voles were snap-trapped using the standard method, with lines of 25 traps set at 5 m intervals, exposed for three days, and checked once per day in the morning [49]. Total trapping effort was 25,503 trap days over 168 trapping sessions. We define the trapping session as a three-day trapping period in the same habitat, season, and year. Thus, four trapping sessions per site were conducted each year (one in the crops, a second in the control habitat, both carried out two times per year—summer and autumn).
Voles were identified to the species level by their teeth [50] during dissection or after cleaning the skulls with Dermestes beetles in the laboratory. The gender of the voles and age groups were identified at dissection. We used three age categories: adults, subadults, and juveniles. Identification of the age groups was based on the status of the sex organs, body mass, and the level of atrophy of the thymus [51]. Thymus reduction occurs with animal age, the maximum size being in juveniles, down to nearly full involution in adults [52,53,54].

2.2. Stable Isotope Analysis

Samples of hair for carbon and nitrogen stable isotope analysis were collected from 376 of the 509 trapped vole individuals (Table 1). All suitable field vole and root vole samples were analysed. The most numerous vole species, the common vole, was sub-sampled in 2020.
The small tuft of hair (ca 5 mm wide) was clipped from between the shoulders of each specimen and stored dry. Before analysis, the samples were weighed and packed in tin capsules. The samples of the hair were not pre-treated, as earlier, we ascertained that this procedure did not change the obtained results [55]. Dirty (covered by soil or blood) samples were washed in deionised water and methanol and then dried. Very dirty samples were discarded. Carbon and nitrogen stable isotope ratios were measured at the Center for Physical Sciences and Technology, Vilnius, Lithuania, using an elemental analyser (EA) (Flash EA1112) coupled to an isotope ratio mass spectrometer (IRMS) (Thermo Delta V Advantage) via a ConFlo III interface (EA-IRMS). Five percent of the samples were run in duplicate, and the obtained results for these samples were averaged.
As reference materials, we used Caffeine IAEA-600 (δ13C = −27.771 ± 0.043‰, δ15N = 1 ± 0.2‰), Ammonium Sulfate IAEA-N-1 (δ15N = 0.4 ± 0.2‰), and Graphite USGS24 (δ13C = −16.049 ± 0.035‰) provided by the International Atomic Energy Agency (IAEA). These standards were run every 12 samples. Repeated analysis of these reference materials gave a standard deviation of less than 0.08‰ for carbon and 0.2‰ for nitrogen (see [56]).
Carbon and nitrogen stable isotope data are reported as δX values (where X represents the heavier isotope 13C or 15N) or differences from given standards, expressed in parts per thousand (‰) and are calculated according to the formula:
δX = [Rsample/Rstandard − 1] × 1000,
where Rsample = 13C/12C or 15N/14N of the sample, Rstandard = 13C/12C or 15N/14N of the standard.

2.3. Statistical Analyses

We tested if the δ15N and δ13C values were distributed normally, using Kolmogorov–Smirnov’s D test. The distributions of both isotopes in all three vole species were normal: in common vole, δ13C (D = 0.06, p = 0.25) and δ15N (D = 0.06, p = 0.21), in field vole (D = 0.12, p = 0.68 and D = 0.13, p = 0.63, respectively), and in root vole (D = 0.11, p = 0.73 and D = 0.15, p = 0.33, respectively). Based on conformity to normal distribution, parametric tests were further applied.
The proportions and 95% confidence interval of trapping sessions (or sites) where the co-occurrence of two or all three vole species was recorded was evaluated using the Wilson method and WinPepi ver. 11.39 software (Abramson, J., Jerusalem, Izrael).
The δ13C and δ15N values in the samples were expressed as arithmetic mean ± 1 SE. ANOVA was used to find the relationship of year, season, species, age, and sex of individuals to paired δ15N and δ13C distribution, using Hotteling’s two sample T2 test for significance. The effect size was assessed according to values of the partial eta-squared (eta2), which shows the proportion of the variability in the dependent variables that is explained by the effect. The interspecific influences of species, as well as intraspecific differences (between males and females, and between the three age groups), on the carbon and nitrogen stable isotope values were tested with parametric ANOVA, using Wilk’s lambda test for significance. Differences between groups were evaluated with post-hoc Tukey test.
The positions of species and intraspecific groups, including those with sample size n < 5, in the isotopic biplot was shown using SigmaPlot ver. 12.5 (Systat Software Inc., San Jose, CA, USA). Isotopic niches of species, using parameters of TA (total area), SEA (standard ellipse area), and SEAc (as corrected central ellipses, unbiased for the sample size), were calculated using the package SIBER [57] under R ver. 3.5.0 (https://cran.r-project.org/bin/windows/base/rdevel.html, accessed on 2 March 2019). All other calculations were performed using Statistica for Windows ver. 6 (StatSoft, Inc., Tulsa, OK, USA).

3. Results

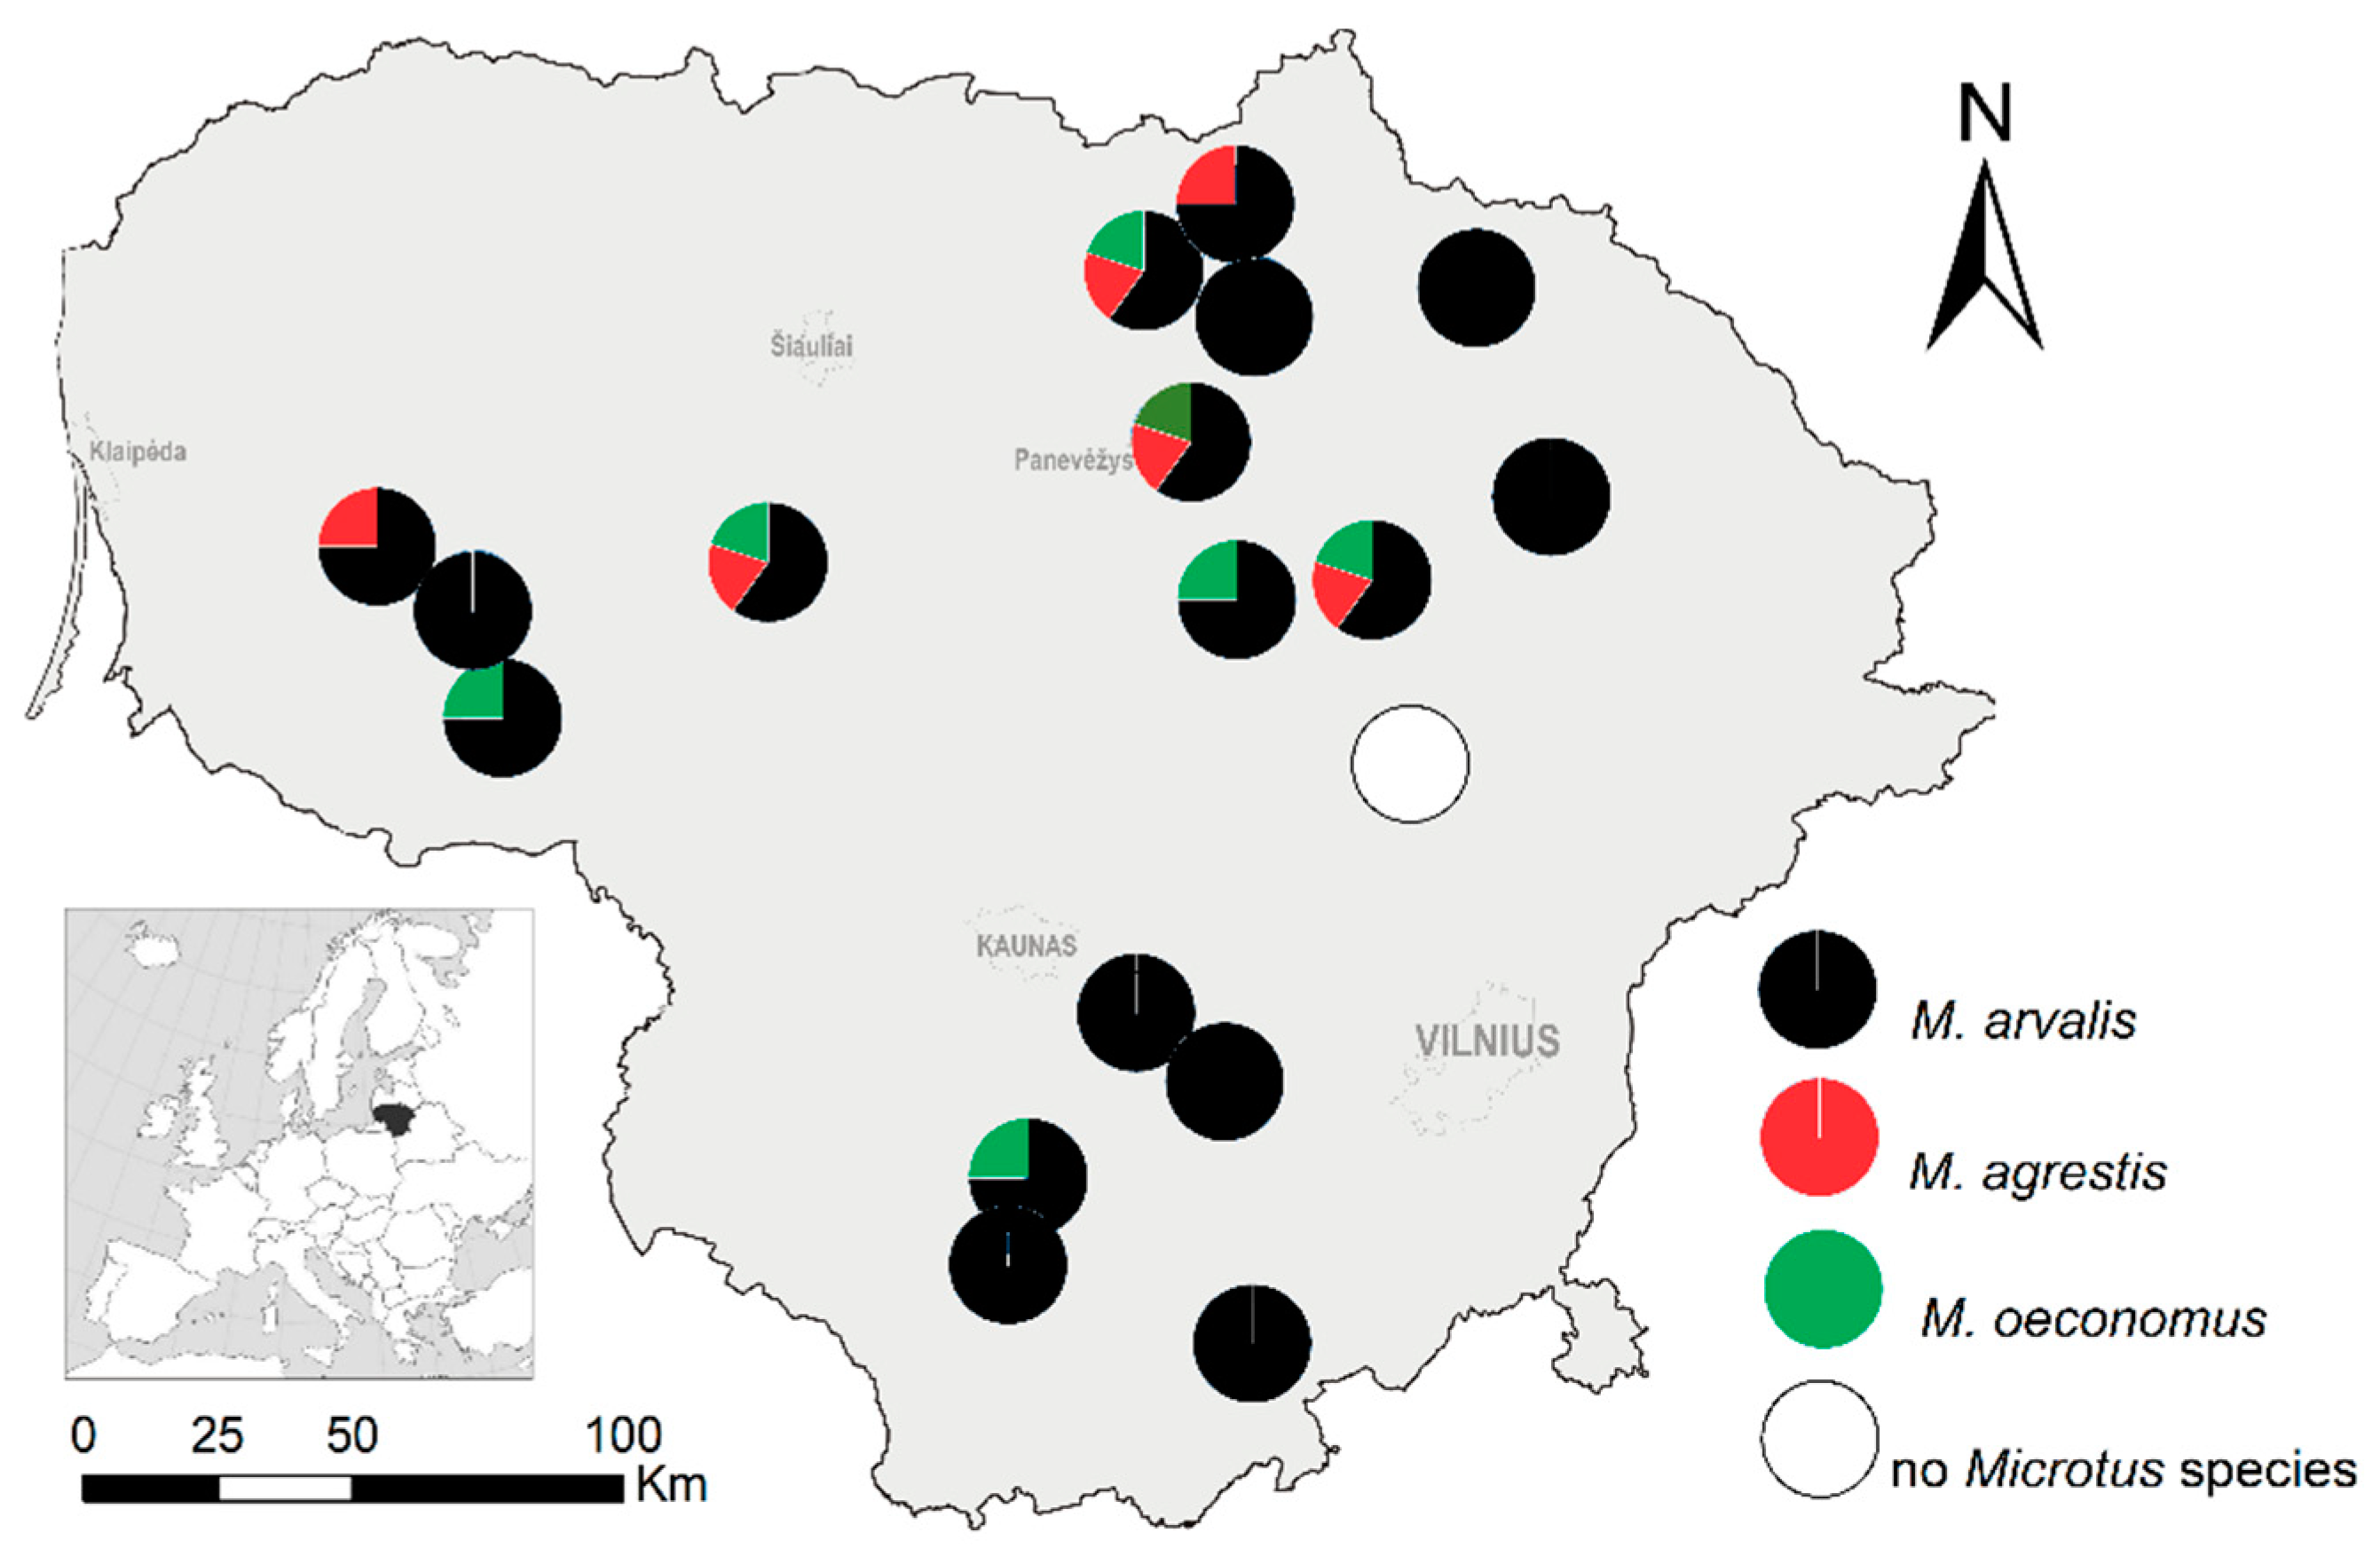
3.1. Distribution of Co-Occurring Microtus Populations

We tested if the investigated three Microtus vole species were syntopic, analysing their co-occurrence in all trapping sessions. In 46.4% (95% CI = 39.1–54.0%) of sessions, Microtus species were not trapped (Table 2). Common vole, as a single Microtus species, was trapped in 36.9% (CI = 30.0–44.4%) of sessions, field vole in 3.0% (1.3–6.8%), and root vole in 4.8% (2.4–9.1%). Two of the three species were co-trapped in 8.9% (5.5–14.2%) of sessions. All of these co-trappings were in the apple orchards or control habitats (Table 2). In the plum orchards and currant plantations, only common voles were present, while in the raspberry plantations, single individual of the root vole was trapped in addition to common voles (Table 2).
Sympatric co-occurrence (the same site, but not necessary the same habitat) was more frequent: at 22.2% (CI = 9.0–45.2%) of sites, common voles, field voles, and root voles occurred in sympatry, and at 27.8% (12.5–50.9%) of sites, two species co-occurred.

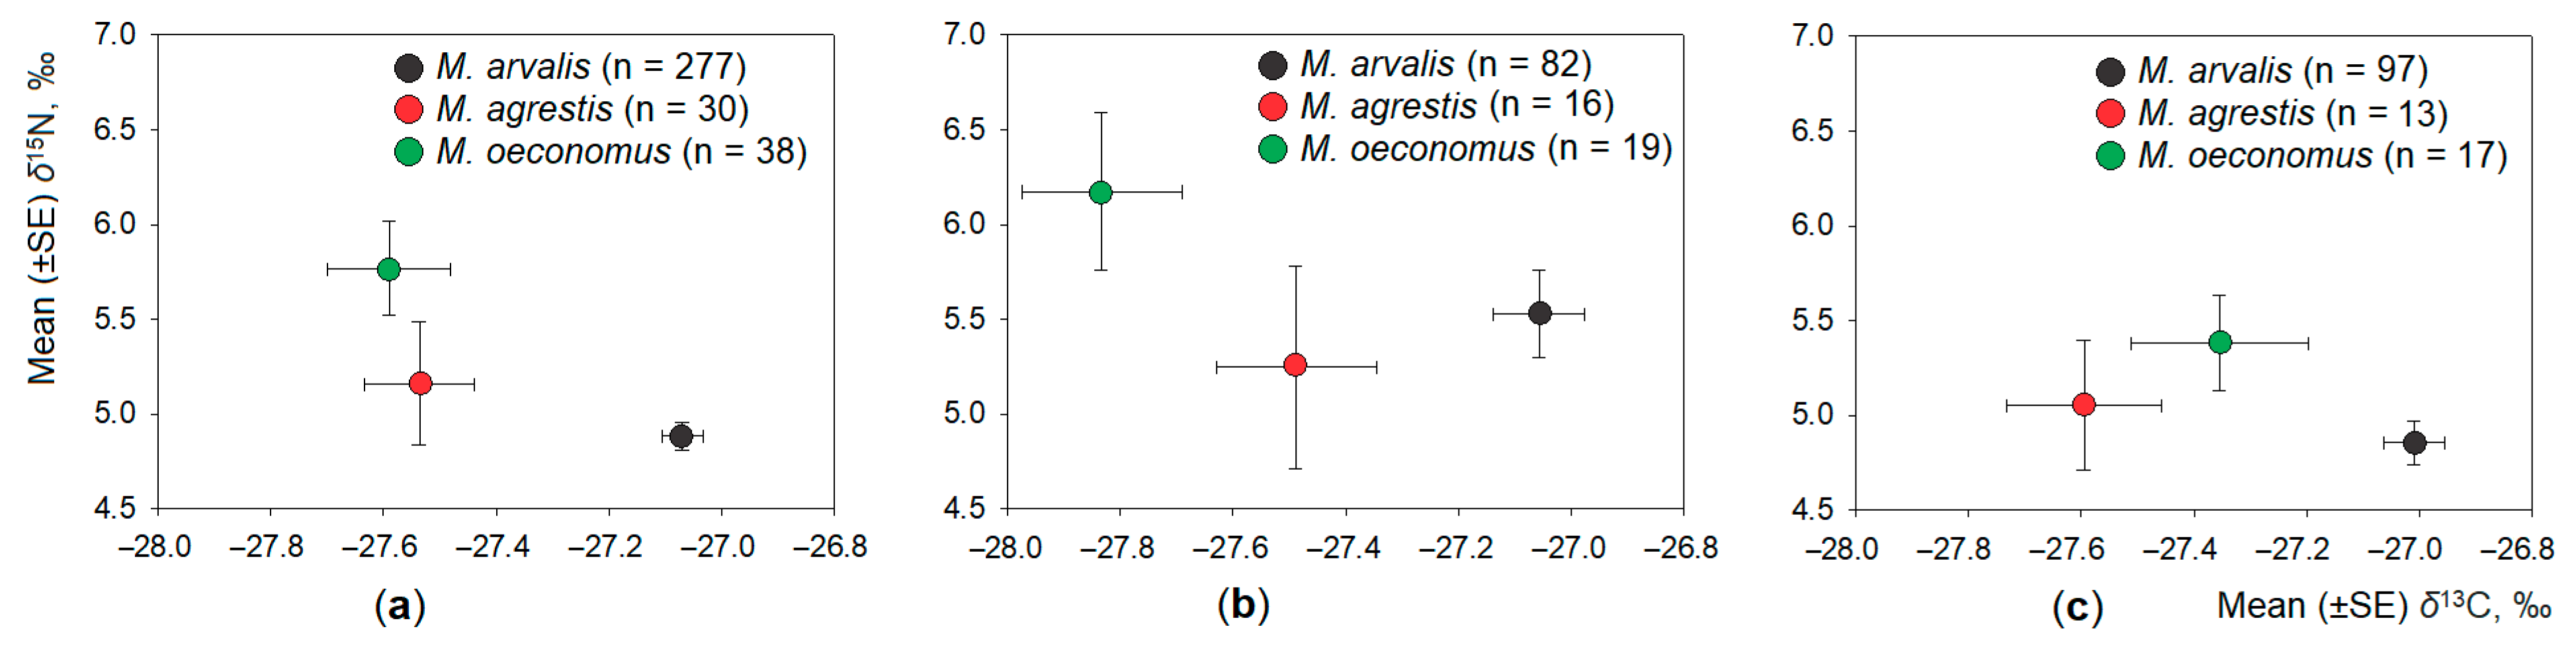
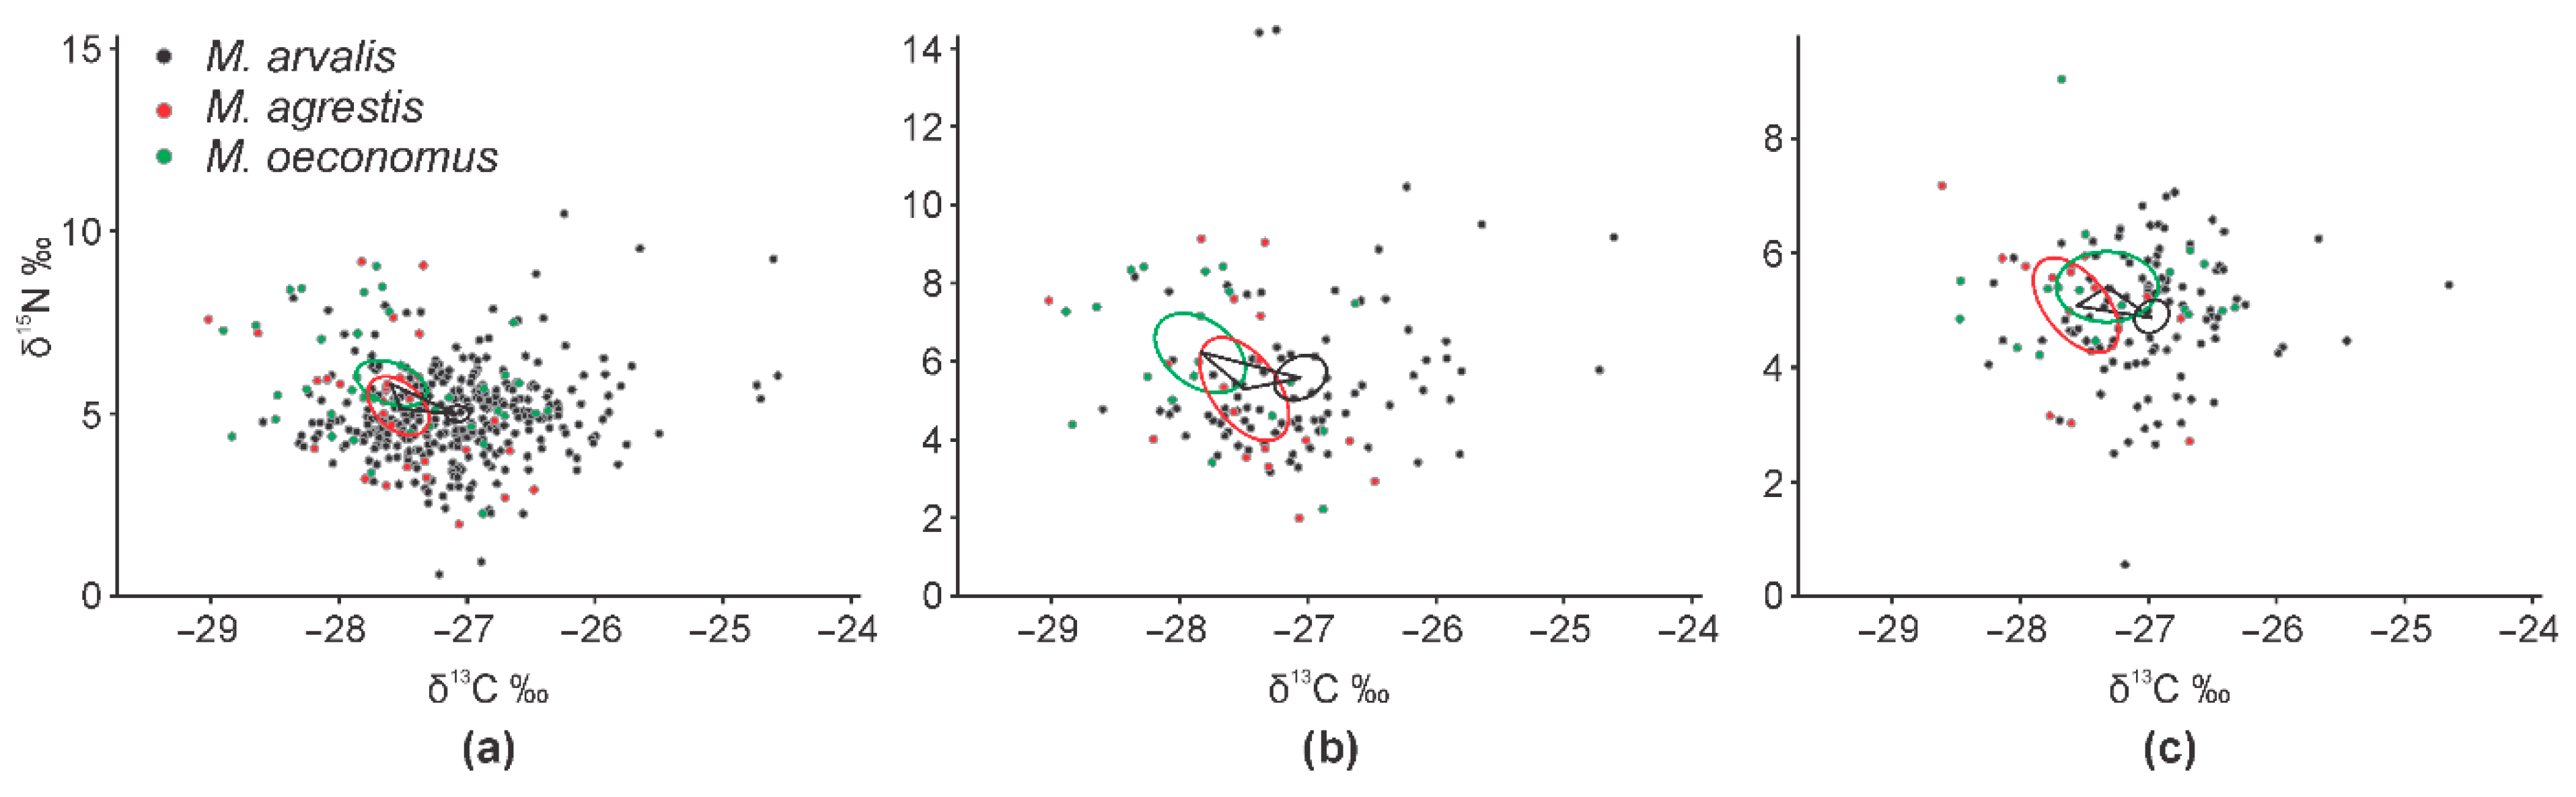
3.2. Interspecific Differences in Dietary Space between Three Microtus Vole Species

The species-related distribution of δ13C and δ15N values is presented in Table 3. Irrespective of other factors, the widest trophic niche was found in the common vole, exceeding other two species in the ranges of both carbon (δ13C) and nitrogen (δ15N) stable isotope ratios. The ranges of the other two species, field vole and root vole, were similar. Therefore, our first hypothesis was confirmed.
We tested the influence of the year and season on the distribution of δ13C and δ15N values in the three vole species. The cumulative influence was significant on both of the stable isotope ratios, but it explained only a very small part of the variance (year: T2 = 0.21, F4,740 = 19.4, eta2 = 0.095; season: T2 = 0.02, F2,371 = 3.5, eta2 = 0.019). Given the fact that the cumulative effect of the time factor on the distribution of δ13C and δ15N values is about 10%, this showing the relative stability of the diets, we further analysed the data irrespective of year and season.
Irrespective of the habitat (Figure 2a), we found significant differences in both δ13C and δ15N average values in the hair of co-occurring Microtus voles (Wilks lambda = 0.89, F4,744 = 11.2, p < 0.001). Differences in δ13C (F2,373 = 17.33, p < 0.001) were better expressed than differences in δ15N (F2,373 = 5.36, p < 0.01). The highest average value of δ13C was found in the common vole, significantly exceeding that in the field vole (Tukey HSD, p < 0.025) and root vole (HSD, p < 0.001). The highest average value of δ15N in the hair of root voles significantly exceeded that in common voles (HSD, p < 0.05), not differing from field voles (Figure 2a).
Significant differences in both δ13C and δ15N average values in the hair of co-occurring Microtus voles (Wilks lambda = 0.83, F4,232 = 5.82, p < 0.001) were found in the control habitats. Differences in δ13C (F2,117 = 10.99, p < 0.001) were significant, while no interspecies differences were observed in δ15N (F2,117 = 1.07, p = 0.35). The highest average value of δ13C was found in the common vole (Figure 2b), significantly exceeding that in the field vole (Tukey HSD, p < 0.005).
Interspecific differences in stable isotope values were less expressed in Microtus voles co-occurring in the apple orchards (Wilks lambda = 0.86, F4,252 = 15.11, p < 0.001), being significant in δ13C (F2,127 = 8.78, p < 0.001) but not in δ15N (F2,373 = 1.71, p = 0.19). The highest average value of δ13C was found in the common vole, significantly exceeding that in the field vole (Tukey HSD, p < 0.025) but not in the root vole. Differences in δ15N were all not significant (Figure 2c).
The dietary niches of common voles, field voles, and root voles, shown as core ellipses in the isotopic space, had a certain degree of overlap (Figure 3). The widest niche was characteristic to the common vole (TA = 12.45), being three times wider than that of the field vole (TA = 4.08) and 2.3 times wider than that of the root vole (TA = 5.41). However, core areas were of the same width (SEA = 1.87, 1.71 and 2.23; SEAc = 1.90, 1.86 and 2.38, respectively). Irrespective of the habitat, the core dietary niche of the common vole was separated from that of the other two species (Figure 3a). The overlap with the core dietary niche of the field vole in the control habitats (Figure 3b) and with the root vole in the apple orchards (Figure 3c) was less than 0.5%. The core dietary niches of the root and field voles widely overlapped in all cases: 4.3% irrespective of habitat (Figure 3a), 7.2% in the control meadows (Figure 3b), and 9.3% in the apple orchards (Figure 3c).
In the plum orchards (Figure 4a) and currant plantation (Figure 4b), we trapped only common voles, while in raspberry plantations (Figure 4c), only a single root vole individual was trapped along with a number of common voles. The influence of co-occurrence with other Microtus species on both of the analysed stable isotope ratios in the common vole hair was significant (T2 = 16.18, F2,373 = 8.07, p < 0.001). However, this difference (Figure 4 compared to Figure 2) related to the distribution of δ15N values only, being 14.1% higher in co-occurring common voles (5.26‰, CI = 5.08–5.45‰ versus 4.61‰, 95% CI = 4.35–4.87% in common voles without co-occurring other Microtus species, F1,374 = 15.94, p < 0.001; Tukey HSD, p < 0.001). The distribution of δ13C values was not affected by co-occurrence (F1,374 = 0.30, p = 0.56). Average δ13C values in the hair of common voles co-occurring with other Microtus species (−27.14‰, CI = −27.25–−27.02‰) were very close to those of common voles without co-occurrence (−27.18‰, CI = −27.27–−27.10‰). Thus, the second hypothesis was confirmed for nitrogen but not confirmed for carbon stable isotope distribution.

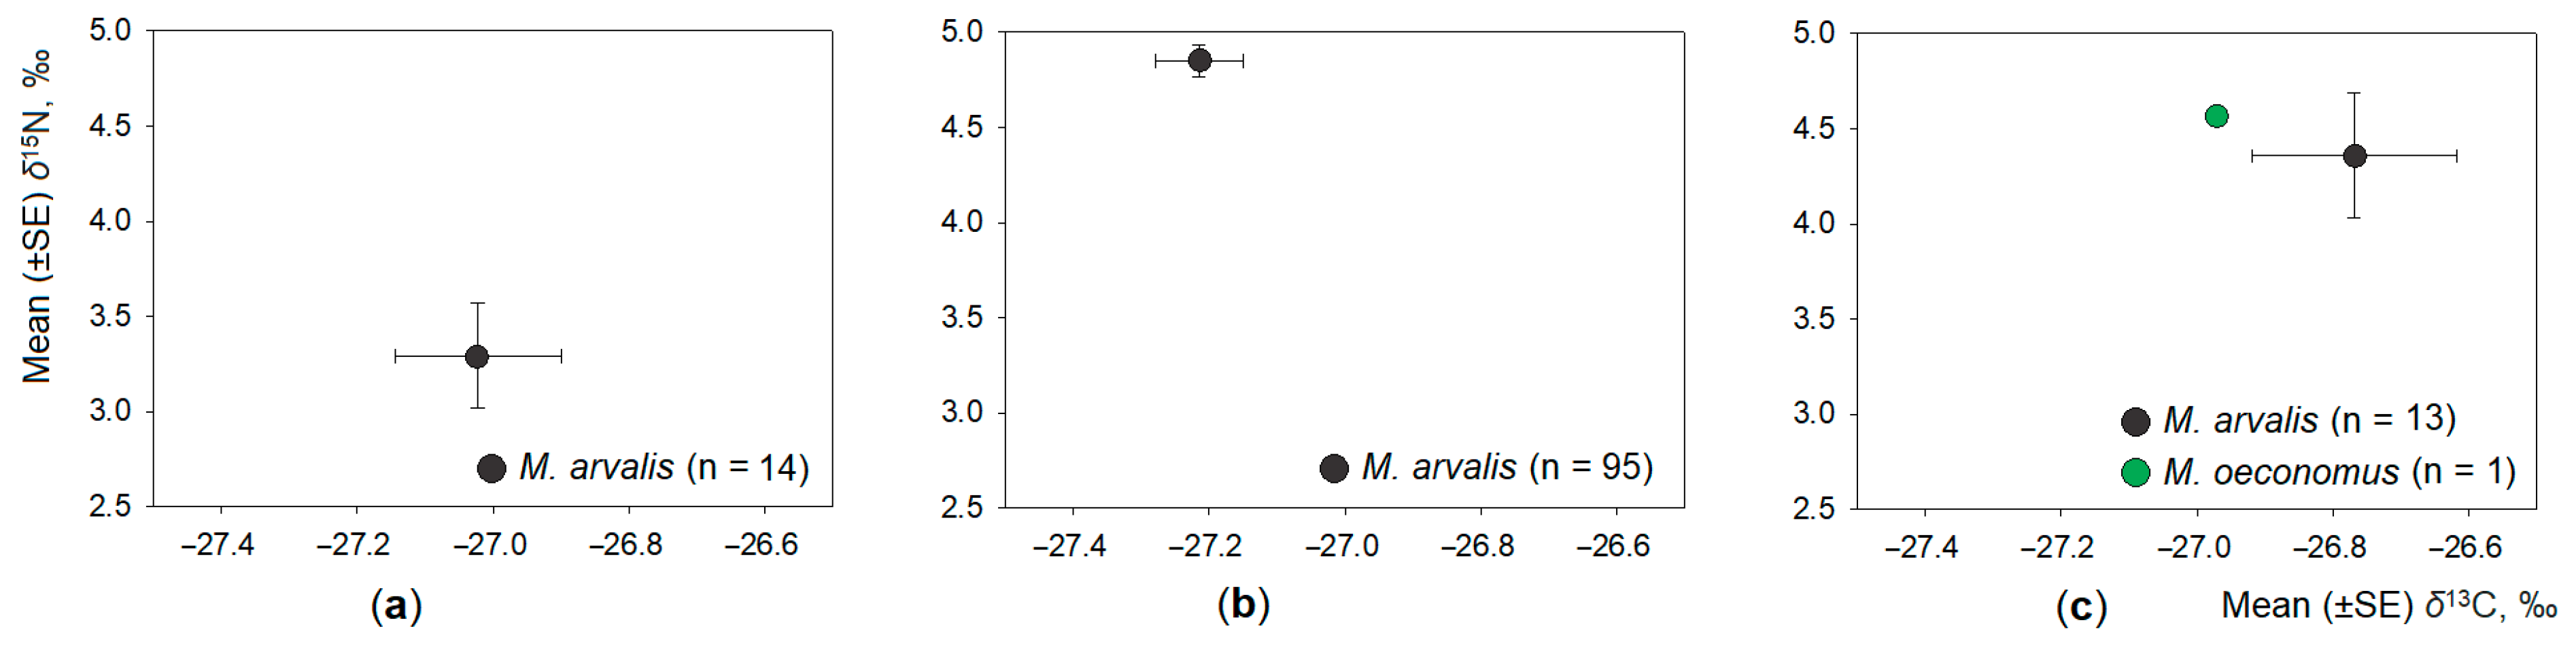
3.3. Intraspecific Differences in Dietary Space of Microtus Voles

The intraspecific differences in the dietary space of common, field, and root voles were analysed according to age (Figure 5) and gender of the individuals (Figure 6). Irrespective of the species, the influence of age was stronger (T2 = 0.04, F4,740 = 3.7, p < 0.01) than that of the gender (T2 = 0.10, F2,371 = 1.90, p = 0.15).
In the common vole, the effect of age on the variance of both stable isotope ratios in the hair was significant (T2 = 0.10, F4,600 = 7.3, p < 0.001, eta2 = 0.095), but it explained less than 10% of variance. The effect of gender was weak (T2 = 0.02, F2,301 = 2.6, p = 0.07, eta2 = 0.017). Univariate results show the distribution of δ13C values being dependent on the animal age (F2,302 = 14.1, p < 0.001) and gender (F1,302 = 4.9, p < 0.05). The distribution of δ15N values was not dependent on the common vole age (Figure 5a) or gender (Figure 6a). The average δ13C value in juveniles of common vole was significantly less than in adults (Tukey HSD, p < 0.001); the difference from subadults was not significant (HSD, p = 0.17).
In the field vole, the effect of age and the effect of gender on the variance of both stable isotope ratios in the hair was not significant (T2 = 0.07, F4,50 = 0.42, p = 0.79, and T2 = 0.06, F2,26 = 0.77, p = 0.47, respectively). No differences between age groups (Figure 5b) or between males and females (Figure 6b) were observed.
The effect of age (Figure 5c) and gender (Figure 6c) on the variance of both stable isotope ratios in the hair was strongest in the root vole. Animal age explained 10.7% of variance in both isotope ratios (T2 = 0.24, F4,66 = 1.99, p = 0.11), while animal gender explained 24.9% of variance (T2 = 0.33, F2,33 = 5.63, p < 0.01). Univariate results show the distribution of δ15N values being dependent on the animal age (F2,35 = 3.88, p < 0.05) and gender (F2,35 = 8.86, p < 0.01), while the distribution of δ13C values was not. The average δ15N value in males of the root vole was significantly higher than in females (Tukey HSD, p < 0.05), and in subadult animals, it was higher than in adults (HSD, p = 0.10). Other pairwise differences were not significant. Therefore, the third hypothesis was partially confirmed.

4. Discussion

Although the isotopic niche can be a result of many ecological and environmental factors, it is synonymous with the trophic niche when primarily driven by consumer-resource interactions [58]. Our results suggest relative stability in the trophic niches of the common vole, field vole, and root vole over time, the effect of the season being not significant and explaining just 2% of the variance. The widest trophic niche was characteristic of the dominant species, the common vole, the range of δ13C values exceeding the other two species by 1.6 times, the range of δ15N values exceeding the other two species by 1.9 times, and the total area of the isotopic niche exceeding that of the other voles by 2.3–3 times. In the control habitat (meadows) and apple orchards, the co-occurring vole species were separated according to δ15N (the highest values in common vole), but they maintained similar δ13C values.

4.1. Trophic Niche of Microtus Voles in Different Habitats

Compared to these moderately anthropogenic habitats, the trophic niches of root and field voles in spring-flooded meadows in west Lithuania [10] were much narrower, with lower average δ15N values and higher average δ13C values. The range of δ13C values for the root vole was just 0.91‰ (average −26.0 ± 0.07‰) and the range of δ15N was 1.27‰ (5.23 ± 0.10‰), while the respective values for field vole were 0.91‰ (average −26.6 ± 0.15‰) and 1.01‰ (4.68 ± 0.29‰). In flooded forest, the root vole had even lower values of both isotope ratios, δ15N = 3.98‰ and δ13C = −29.86‰ [10]. Therefore, we confirm that the small herbivore Microtus voles have seen a shift of the trophic niche under the influence of anthropogenic impact upon their habitat.
Here, we fully agree with [59] that relatively low values of δ15N cannot always be related to herbivory. Relatively higher δ15N values may be related to fertilisation [55], which may be of great importance in resource-limited orchard habitats. However, greater δ15N values in field vole hair may also be related to an increase in the proportion of animal food in their diet [43,60]. Among the investigated Microtus voles, only the field vole was characterised as using foods of animal origin [16,61], especially in the spring and summer periods [62]. It should be noted that many other herbivore species, including common voles, are capable of omnivory to some extent [63]. In addition, field voles can exhibit preferences for food that is not common in the habitat [62].
Differences in the trophic niche of Microtus voles are important when choosing focal small herbivore species for pesticide risk assessment. As Lithuania is currently included within the Northern Zone, the field vole has been referred to as the representative herbivore [64]. However, as well as common vole being much more abundant and well-represented in the orchards [24], diet differences are also obvious, as shown above.

4.2. Possible Factors Influencing Changes in Trophic Niche

Our results are of interest for small mammal trophic ecology in general [5,18,59,65,66]. Due to agricultural activities, orchards and berry plantations are most possibly not places of abundant and diverse resources for herbivores. Grass is mowed (and removed from the orchards), while herbicides and other plant protection measures are applied [11,67,68,69], despite the knowledge that cover crops in the orchards may enable ecosystem services [70]. The limited availability of resources should lead to narrow trophic niches and reduced niche overlap in small mammals [43,66,71].
Insufficient resources of the accustomed foods also change the diets and the position of the trophic niche in other mammal groups, including carnivores [29,72]. One of the main factors responsible for niche reduction in wild mammals is human activity, creating disturbance and reducing spatial and temporal niches [73,74]. Therefore, the partitioning of the trophic niche becomes very important, allowing species to co-exist when they live in sympatry [11,29].
The role of alternative foods is also of high importance to rodents characterised by diverse diets. Diet diversity is one of the factors affecting the trophic niche for voles, especially when alternative food sources are considered [18,75].
According to [36], individual variation of the trophic niche depends on intra-individual variation (i.e., the change of individual niche breadth) and inter-individual variation (i.e., the reduction or contraction of niche overlap among individuals).

4.3. Role of Community and Intraspecific Patterns in Defining Trophic Niche

Our results highlight the importance of considering interspecific competition when interpreting patterns of habitat selection among coexisting species [35,36]. The common vole and field vole are morphologically similar species. They have similar ways of life [32], though they differ in their preferred habitats [76]. According to the findings of [36], a termination of interspecific competition may increase the niche width of a species, but the authors did not consider trophic niche. Based on this, syntopic populations of the three Microtus species should be characterised by narrowing niches in all vole species due to interspecific competition. However, this was not true: δ13C values were not affected by co-occurrence, while the range of δ15N values was significantly wider in co-occurring common voles. This finding requires further investigation, as it foresees possible species divergence in using foods of animal origin. Beyond doubt, stable isotope values indicate the trophic niches of species [48], as our samples were from the same habitats and thus not biased by habitat influence.
Bergeron and Joudoin pointed out that diet changes under interspecific competition may be very important, as diet quality is related to survivorship and health status [77]. These authors wrote that herbivores are also limited by food sources and do have different food preferences. The situation is complicated by diet dependence on population densities [77]. Wider isotopic niches are expected in human-modified landscapes [22], and this was also true for the Microtus voles in our study. Therefore, we see that the alteration of the trophic niche in Microtus voles in the orchards (agricultural habitat) could be further affected by interspecific competition between syntopic species.

4.4. Specificity of Agricultural Habitats to Microtus Voles

Understanding that agriculture is one of the main factors that negatively influences biological diversity, environmentally friendly farming systems in the EU were introduced from the 1980s [78]. Hedgerows, grassland inclusions, flower strips, and woodland inclusions were recognised as positive agroecological infrastructures [79]. However, investigations into the effect of environmentally friendly schemes and structures have seen a bias towards insects, birds, and other groups, but not mammals.
According to [80], 76% of publications related to biological diversity in fruit orchards were from West Europe and North America, and only 8.7% were devoted to mammals. Voles and mice in agricultural habitats are mostly treated as pests [81] (and references therein) and agrophilic rodents are mostly treated as invasive species [82]. Therefore, our approach to study the trophic niche of Microtus voles is rather original.
The mechanisms of coexistence of such closely related species are factors that have still not been addressed by community ecologists. Two important factors in this coexistence are, firstly, resource use and competition for these resources [83], and secondly, dietary comparisons of similar, coexisting species that can help define species niches [84]. We understand that competition for resources may be reduced due to the density-dependent selection of habitat, thus increasing the chances of co-existence [85]. However, even with three years of study at 18 sites, our materials are insufficient for such analysis. While food preferences may affect the distribution of granivores and herbivores in the agrolandscape [86], no such studies concerning syntopic herbivores have been conducted so far.
Generalising, trophic interactions may shape rodent population dynamics in resource-abundant landscapes [87], including even their number outbreaks [32,88]. In resource-poor habitats, choice of plant species is foreseen in Microtus [89]. However, a lack of multi-species diet investigations in agricultural habitats, let alone orchards, prevents the comparing of our conclusions regarding habitat influence on syntopic Microtus trophic niche with other results.

5. Conclusions

  • Shown on sympatric and syntopic Microtus voles, our results highlight the importance of interspecific competition for interpreting patterns of habitat selection and resource sharing among coexisting herbivore species.
  • The widest trophic niche was characteristic to the dominant species, common vole.
  • In the case of co-occurrence with other Microtus species, the width of the trophic niche of the common vole increased, separating the species according to δ15N values.
  • Intraspecific differences in the dietary space were best expressed in the dominant common vole (differences according to δ13C, but not δ15N values) and in the root vole (according δ15N values).

Author Contributions

Conceptualisation and investigation, L.B. (Linas Balčiauskas), R.S., A.G., V.S. and L.B. (Laima Balčiauskienė); methodology and formal analysis L.B. (Linas Balčiauskas), R.S., A.G.; data curation, V.S. and L.B. (Laima Balčiauskienė); resources, A.G. and V.R.; supervision, project administration and funding acquisition, L.B. (Linas Balčiauskas) and V.R. All authors participated in writing the draft and have read and agreed to the published version of the manuscript.

Funding

In 2018 and 2019, this research was funded by the MINISTRY OF AGRICULTURE OF THE REPUBLIC OF LITHUANIA, grant number MT-18-3.

Institutional Review Board Statement

The study was approved by the Animal Welfare Committee of the Nature Research Centre, protocol No GGY-7. It was conducted in accordance with Lithuanian (the Republic of Lithuania Law on the Welfare and Protection of Animals No. XI-2271) and European legislation (Directive 2010/63/EU) on the protection of animals.

Data Availability Statement

After publication, research data will be available from the corresponding author upon request. The data are not publicly available due to usage in the ongoing study.

Acknowledgments

We thank Jos Stratford for editing the language and Gintautas Vaitonis for the help with graphics.

Conflicts of Interest

The authors declare no conflict of interest.

References

  1. Ishikawa, N.F. Use of compound-specific nitrogen isotope analysis of amino acids in trophic ecology: Assumptions, applications, and implications. Ecol. Res. 2018, 33, 825–837. [Google Scholar] [CrossRef]
  2. Whitaker, M.R.; Baker, C.C.; Salzman, S.M.; Martins, D.J.; Pierce, N.E. Combining stable isotope analysis with DNA metabarcoding improves inferences of trophic ecology. PLoS ONE 2019, 14, e0219070. [Google Scholar] [CrossRef] [PubMed] [Green Version]
  3. Galetti, M.; Rodarte, R.R.; Neves, C.L.; Moreira, M.; Costa-Pereira, R. Trophic niche differentiation in rodents and marsupials revealed by stable isotopes. PLoS ONE 2016, 11, e0152494. [Google Scholar] [CrossRef]
  4. Gasperini, S.; Bonacchi, A.; Bartolommei, P.; Manzo, E.; Cozzolino, R. Seasonal cravings: Plant food preferences of syntopic small mammals. Ethol. Ecol. Evol. 2017, 30, 12–25. [Google Scholar] [CrossRef]
  5. Verde Arregoitia, L.D.; D’Elía, G. Classifying rodent diets for comparative research. Mammal. Rev. 2021, 51, 51–65. [Google Scholar] [CrossRef]
  6. Cramer, M.J.; Willig, M.R. Habitat heterogeneity, species diversity and null models. Oikos 2005, 108, 209–218. [Google Scholar] [CrossRef]
  7. Hart, K.M.; Iverson, A.R.; Fujisaki, I.; Lamont, M.M.; Bucklin, D.; Shaver, D.J. Sympatry or syntopy? Investigating drivers of distribution and co-occurrence for two imperiled sea turtle species in Gulf of Mexico neritic waters. Ecol. Evol. 2018, 8, 12656–12669. [Google Scholar] [CrossRef] [PubMed] [Green Version]
  8. Mauffrey, J.F.; Catzeflis, F. Ecological and isotopic discrimination of syntopic rodents in a neotropical rain forest of French Guiana. J. Trop. Ecol. 2003, 19, 209–214. Available online: https://0-www-jstor-org.brum.beds.ac.uk/stable/4092159 (accessed on 12 February 2021). [CrossRef]
  9. Butet, A.; Delettre, Y.R. Diet differentiation between European arvicoline and murine rodents. Acta Theriol. 2011, 56, 297. [Google Scholar] [CrossRef]
  10. Balčiauskas, L.; Skipitytė, R.; Balčiauskienė, L.; Jasiulionis, M. Resource partitioning confirmed by isotopic signatures allows small mammals to share seasonally flooded meadows. Ecol. Evol. 2019, 9, 5479–5489. [Google Scholar] [CrossRef]
  11. Balčiauskas, L.; Balčiauskienė, L.; Stirkė, V. Mow the Grass at the Mouse’s Peril: Diversity of Small Mammals in Commercial Fruit Farms. Animals 2019, 9, 334. [Google Scholar] [CrossRef] [Green Version]
  12. Evans, D.M. Seasonal variations in the body composition and nutrition of the vole Microtus agrestis. J. Anim. Ecol. 1973, 42, 1–18. [Google Scholar] [CrossRef]
  13. Yigit, N.; Hutterer, R.; Kryštufek, B.; Amori, G. Microtus arvalis. The IUCN Red List of Threatened Species. 2016. Available online: https://www.iucnredlist.org/species/13488/22351133 (accessed on 16 June 2021).
  14. Linzey, A.V.; Shar, S.; Lkhagvasuren, D.; Juškaitis, R.; Sheftel, B.; Meinig, H.; Amori, G.; Henttonen, H. Microtus oeconomus (errata version published in 2017). The IUCN Red List of Threatened Species. 2016. Available online: https://www.iucnredlist.org/species/13451/115113894 (accessed on 16 June 2021).
  15. Kryštufek, B.; Vohralík, V.; Zima, J.; Zagorodnyuk, I. Microtus agrestis (errata version published in 2017). The IUCN Red List of Threatened Species. 2016. Available online: https://www.iucnredlist.org/species/13426/115112050 (accessed on 16 June 2021).
  16. Heroldová, M. Food selection of Microtus agrestis in air-pollution affected clearings in the Beskydy Mts, Czech Republic. Folia Zool. 2002, 51, 83–91. [Google Scholar]
  17. Ostfeld, R.S. Limiting resources and territoriality in microtine rodents. Am. Nat. 1985, 126, 1–15. [Google Scholar] [CrossRef]
  18. Soininen, E.M.; Ravolainen, V.T.; Bräthen, K.A.; Yoccoz, N.G.; Gielly, L.; Ims, R.A. Arctic Small Rodents Have Diverse Diets and Flexible Food Selection. PLoS ONE 2013, 8, e68128. [Google Scholar] [CrossRef] [Green Version]
  19. Fortin, D.; Boyce, M.S.; Merrill, E.H. Multi-tasking by mammalian herbivores: Overlapping processes during foraging. Ecology 2004, 85, 2312–2322. [Google Scholar] [CrossRef]
  20. Romanowski, J.; Lesiński, G.; Bardzińska, M. Small mammals of the suburban areas of Warsaw in the diet of the tawny owl Strix Aluco. Studia Ecol. Bioethicae 2020, 18, 349–354. [Google Scholar] [CrossRef]
  21. Sîtnic, V.; Nistreanu, V.; Larion, A.; Savin, A. The demographic structure of Microtus arvalis and Microtus rossiaemeridionalis (Mammalia, Rodentia, Cricetidae) populations in agrocenoses from the Republic of Moldova. Olten. Stud. Si Comun. Stiintele Nat. 2020, 36, 129–136. [Google Scholar]
  22. Magioli, M.; Moreira, M.Z.; Fonseca, R.C.B.; Ribeiro, M.C.; Rodrigues, M.G.; de Barros, K.M.P.M. Human-modified landscapes alter mammal resource and habitat use and trophic structure. Proc. Natl. Acad. Sci. USA 2019, 116, 18466–18472. [Google Scholar] [CrossRef] [Green Version]
  23. Balčiauskas, L.; Balčiauskienė, L. On the Doorstep, Rodents in Homesteads and Kitchen Gardens. Animals 2020, 10, 856. [Google Scholar] [CrossRef] [PubMed]
  24. Stirkė, V.; Balčiauskas, L.; Balčiauskienė, L. Common Vole as a Focal Small Mammal Species in Orchards of the Northern Zone. Diversity 2021, 13, 134. [Google Scholar] [CrossRef]
  25. Winfree, R.; Bartomeus, I.; Cariveau, D.P. Native pollinators in anthropogenic habitats. Annu. Rev. Ecol. Evol. Syst. 2011, 42, 1–22. [Google Scholar] [CrossRef] [Green Version]
  26. Sánchez-Guzmán, J.M.; Morán, R.; Masero, J.A.; Corbacho, C.; Costillo, E.; Villegas, A.; Santiago-Quesada, F. Identifying new buffer areas for conserving waterbirds in the Mediterranean basin: The importance of the rice fields in Extremadura, Spain. Biodivers. Conserv. 2007, 16, 3333–3344. [Google Scholar] [CrossRef]
  27. Pianka, E.R. Niche overlap and diffuse competition. Proc. Natl. Acad. Sci. USA 1974, 71, 2141–2145. [Google Scholar] [CrossRef] [PubMed] [Green Version]
  28. Costa-Pereira, R.; Araújo, M.S.; Souza, F.L.; Ingram, T. Competition and resource breadth shape niche variation and overlap in multiple trophic dimensions. Proc. R. Soc. B 2019, 286, 20190369. [Google Scholar] [CrossRef] [Green Version]
  29. Manlick, P.J.; Pauli, J.N. Human disturbance increases trophic niche overlap in terrestrial carnivore communities. Proc. Natl. Acad. Sci. USA 2020, 117, 26842–26848. [Google Scholar] [CrossRef]
  30. Krause, A.; Sandmann, D.; Bluhm, S.L.; Ermilov, S.; Widyastuti, R.; Haneda, N.F.; Scheu, S.; Maraun, M. Shift in trophic niches of soil microarthropods with conversion of tropical rainforest into plantations as indicated by stable isotopes (15N, 13C). PLoS ONE 2019, 14, e0224520. [Google Scholar] [CrossRef] [Green Version]
  31. Koplin, J.R.; Hoffmann, R.S. Habitat overlap and competitive exclusion in voles (Microtus). Am. Midl. Nat. 1968, 80, 494–507. [Google Scholar] [CrossRef]
  32. Myllymäki, A. Interactions between the field vole Microtus agrestis and its microtine competitors in Central-Scandinavian populations. Oikos 1977, 29, 570–580. [Google Scholar] [CrossRef]
  33. Santos, S.M.; da Luz Mathias, M.; Mira, A.P. Local coexistence and niche differences between the Lusitanian and Mediterranean pine voles (Microtus lusitanicus and M. duodecimcostatus). Ecol. Res. 2010, 25, 1019–1031. [Google Scholar] [CrossRef] [Green Version]
  34. Jancewicz, E.; Gliwicz, J. Niche dynamics and biodiversity: Many rodent species on one marshy meadow. Pol. J. Ecol. 2017, 65, 371–379. [Google Scholar] [CrossRef]
  35. Koivisto, E.; Hoset, K.S.; Huitu, O.; Korpimäki, E. Habitat use of coexisting Microtus vole species under competition and predation risk. Can. J. Zool. 2018, 96, 237–244. [Google Scholar] [CrossRef]
  36. Bolnick, D.I.; Ingram, T.; Stutz, W.E.; Snowberg, L.K.; Lau, O.L.; Paull, J.S. Ecological release from interspecific competition leads to decoupled changes in population and individual niche width. Proc. R. Soc. B Biol. Sci. 2010, 277, 1789–1797. [Google Scholar] [CrossRef]
  37. DeNiro, M.J.; Epstein, S. Influence of diet on the distribution of carbon isotopes in animals. Geochim. Cosmochim. Acta 1978, 42, 495–506. [Google Scholar] [CrossRef]
  38. Matthews, D.E.; Bier, D.M. Stable Isotope Methods for Nutritional Investigation. Annu. Rev. Nutr. 1983, 3, 309–339. [Google Scholar] [CrossRef]
  39. Crawford, K.; Mcdonald, R.A.; Bearhop, S. Applications of stable isotope techniques to the ecology of mammals. Mammal Rev. 2008, 38, 87–107. [Google Scholar] [CrossRef]
  40. Polis, G.A. Age structure component of niche width and intraspecific resource partitioning: Can age groups function as ecological species? Am. Nat. 1984, 123, 541–564. [Google Scholar] [CrossRef]
  41. Sheppard, C.E.; Inger, R.; McDonald, R.A.; Barker, S.; Jackson, A.L.; Thompson, F.J.; Vitikainen, E.I.K.; Cant, M.A.; Marshall, H.H. Intragroup competition predicts individual foraging specialisation in a group-living mammal. Ecol. Lett. 2018, 21, 665–673. [Google Scholar] [CrossRef]
  42. Costa, A.F.; Botta, S.; Siciliano, S.; Giarrizzo, T. Resource partitioning among stranded aquatic mammals from Amazon and Northeastern coast of Brazil revealed through Carbon and Nitrogen Stable Isotopes. Sci. Rep. 2020, 10, 12897. [Google Scholar] [CrossRef]
  43. de Camargo, N.F.; Reis, G.G.; Camargo, A.C.L.; Nardoto, G.B.; Kneitel, J.M.; Vieira, E.M. Seasonal isotopic niche of a rodent: High between-individual variation but no changes in individual niche width during the rich-resource period. Biotropica 2021, 53, 966–975. [Google Scholar] [CrossRef]
  44. Koike, S.; Nakashita, R.; Kozakai, C.; Nakajima, A.; Nemoto, Y.; Yamazaki, K. Baseline characterization of the diet and stable isotope signatures of bears that consume natural foods in central Japan. Eur. J. Wildl. Res. 2016, 62, 23–31. [Google Scholar] [CrossRef]
  45. Hopkins, J.B.; Kurle, C.M. Measuring the realized niches of animals using stable isotopes: From rats to bears. Methods Ecol. Evol. 2016, 7, 210–221. [Google Scholar] [CrossRef]
  46. Bearhop, S.; Adams, C.E.; Waldron, S.; Fuller, R.A.; MacLeod, H. Determining trophic niche width: A novel approach using stable isotope analysis. J. Anim. Ecol. 2004, 73, 1007–1012. [Google Scholar] [CrossRef] [Green Version]
  47. Hette-Tronquart, N. Isotopic niche is not equal to trophic niche. Ecol. Lett. 2019, 22, 1987–1989. [Google Scholar] [CrossRef]
  48. Marshall, H.H.; Inger, R.; Jackson, A.L.; McDonald, R.A.; Thompson, F.J.; Cant, M.A. Stable isotopes are quantitative indicators of trophic niche. Ecol. Lett. 2019, 22, 1990–1992. [Google Scholar] [CrossRef]
  49. Balčiauskas, L. Methods of Investigation of Terrestrial Ecosystems. Part. I. Animal Surveys; VU Leidykla: Vilnius, Lithuania, 2004; p. 183. [Google Scholar]
  50. Prūsaitė, J. (Comp.). Fauna of Lithuania. Mammals; Mokslas: Vilnius, Lithuania, 1988; p. 295. [Google Scholar]
  51. Balciauskas, L.; Balciauskiene, L.; Janonyte, A. Reproduction of the root vole (Microtus oeconomus) at the edge of its distribution range. Turk. J. Zool. 2012, 36, 668–675. [Google Scholar]
  52. Metcalf, D. Multiple Thymus Grafts in Aged Mice. Nature 1965, 208, 87–88. [Google Scholar] [CrossRef] [PubMed]
  53. Gui, J.; Mustachio, L.M.; Su, D.M.; Craig, R.W. Thymus Size and Age-related Thymic Involution: Early Programming, Sexual Dimorphism, Progenitors and Stroma. Aging Dis. 2012, 3, 280–290. [Google Scholar]
  54. Rezzani, R.; Nardo, L.; Favero, G.; Peroni, M.; Rodella, L.F. Thymus and aging: Morphological, radiological, and functional overview. Age 2014, 36, 313–351. [Google Scholar] [CrossRef] [PubMed] [Green Version]
  55. Balčiauskas, L.; Skipitytė, R.; Jasiulionis, M.; Balčiauskienė, L.; Remeikis, V. Immediate increase in isotopic enrichment in small mammals following the expansion of a great cormorant colony. Biogeosciences 2018, 15, 3883–3891. [Google Scholar] [CrossRef] [Green Version]
  56. Balčiauskas, L.; Skipitytė, R.; Jasiulionis, M.; Trakimas, G.; Balčiauskienė, L.; Remeikis, V. The impact of Great Cormorants on biogenic pollution of land ecosystems: Stable isotope signatures in small mammals. Sci. Total Environ. 2016, 565, 376–383. [Google Scholar] [CrossRef]
  57. Jackson, A.L.; Inger, R.; Parnell, A.C.; Bearhop, S. Comparing isotopic niche widths among and within communities: SIBER—Stable Isotope Bayesian Ellipses in R. J. Anim. Ecol. 2011, 80, 595–602. [Google Scholar] [CrossRef] [PubMed]
  58. Yeakel, J.D.; Bhat, U.; Elliott Smith, E.A.; Newsome, S.D. Exploring the isotopic niche: Isotopic variance, physiological incorporation, and the temporal dynamics of foraging. Front. Ecol. Evol. 2016, 4, 1. [Google Scholar] [CrossRef] [Green Version]
  59. Missagia, R.V.; Patterson, B.D.; Perini, F.A. Stable isotope signatures and the trophic diversification of akodontine rodents. Evol. Ecol. 2019, 33, 855–872. [Google Scholar] [CrossRef]
  60. Ribeiro, J.F.; Guaraldo, A.; Nardoto, G.B.; Santoro, G.; Vieira, E.M. Habitat type and seasonality influence the isotopic trophic niche of small mammals in a neotropical savanna. Hystrix Ital. J. Mammal. 2019, 30, 30–38. [Google Scholar] [CrossRef]
  61. Mathias, M.D.L.; Hart, E.B.; Ramalhinho, M.D.G.; Jaarola, M. Microtus agrestis (Rodentia: Cricetidae). Mamm. Species 2017, 49, 23–39. [Google Scholar] [CrossRef]
  62. Faber, J.; Ma, W.C. Observations on seasonal dynamics in diet composition of the field vole, Microtus agrestis, with some methodological remarks. Acta Theriol. 1986, 31, 479–490. [Google Scholar] [CrossRef] [Green Version]
  63. Landry, S.O. The Rodentia as omnivores. Q. Rev. Biol. 1970, 45, 351–372. [Google Scholar] [CrossRef]
  64. Northern Zone Pesticide Risk Assessment for Birds and Mammals. Selection of Relevant Species and Development of Standard Scenarios for Higher Tier Risk Assessment in the Northern Zone in Accordance with Regulation EC 1107/2009. Version 2.1, December 2021. Available online: https://eng.mst.dk/media/211955/birds-and-mammals-higher-tier-risk-assesment-northern-zone-april-2020-ver-2-0.docx (accessed on 15 February 2021).
  65. Ozaki, S.; Fritsch, C.; Valot, B.; Mora, F.; Cornier, T.; Scheifler, R.; Raoul, F. Does pollution influence small mammal diet in the field? A metabarcoding approach in a generalist consumer. Mol. Ecol. 2018, 27, 3700–3713. [Google Scholar] [CrossRef]
  66. Hope, A.G.; Gragg, S.F.; Nippert, J.B.; Combe, F.J. Consumer roles of small mammals within fragmented native tallgrass prairie. Ecosphere 2021, 12, e03441. [Google Scholar] [CrossRef]
  67. Cotes, B.; Castro, J.; Cardenas, M.; Campos, M. Responses of epigeal beetles to the removal of weed cover crops in organic olive orchards. Bull. Insectol. 2009, 62, 47–52. [Google Scholar]
  68. Sullivan, T.P.; Sullivan, D.S.; Granatstein, D.M. Influence of living mulches on vole populations and feeding damage to apple trees. Crop. Prot. 2018, 108, 78–86. [Google Scholar] [CrossRef]
  69. Samnegård, U.; Alins, G.; Boreux, V.; Bosch, J.; García, D.; Happe, A.K.; Klein, A.-M.; Miñarro, M.; Mody, K.; Mario Porcel, M.; et al. Management trade-offs on ecosystem services in apple orchards across Europe: Direct and indirect effects of organic production. J. Appl. Ecol. 2019, 56, 802–811. [Google Scholar] [CrossRef] [Green Version]
  70. Das, B.; Kandpal, B.K.; Devi, H.L. Cover Crops for Orchard Soil Management. In Cover Crops and Sustainable Agriculture; Islam, R., Sherman, B., Eds.; CRC Press: Boca Raton, FL, USA, 2021; pp. 147–168. [Google Scholar]
  71. Reid, R.E.; Greenwald, E.N.; Wang, Y.; Wilmers, C.C. Dietary niche partitioning by sympatric Peromyscus boylii and P. californicus in a mixed evergreen forest. J. Mammal. 2013, 94, 1248–1257. [Google Scholar] [CrossRef]
  72. Lanszki, Z.; Horváth, G.F.; Bende, Z.; Lanszki, J. Differences in the diet and trophic niche of three sympatric carnivores in a marshland. Mammal. Res. 2020, 65, 93–104. [Google Scholar] [CrossRef] [Green Version]
  73. Tucker, M.A.; Böhning-Gaese, K.; Fagan, W.F.; Fryxell, J.M.; van Moorter, B.; Alberts, S.C.; Ali, A.H.; Allen, A.M.; Attias, N.; Avgar, T.; et al. Moving in the Anthropocene: Global reductions in terrestrial mammalian movements. Science 2018, 359, 466–469. [Google Scholar] [CrossRef] [Green Version]
  74. Smith, J.A.; Thomas, A.C.; Levi, T.; Wang, Y.; Wilmers, C.C. Human activity reduces niche partitioning among three widespread mesocarnivores. Oikos 2018, 127, 890–901. [Google Scholar] [CrossRef]
  75. Stenseth, N.C.; Hansson, L.; Myllymäki, A.; Myllymaki, A. Food Selection of the Field Vole Microtus agrestis. Oikos 1977, 29, 511. [Google Scholar] [CrossRef]
  76. de Jonge, G. Aggression and Group Formation in the Voles Microtus agrestis, M. arvalis and Clethrionomys glareolus in Relation to Intra- and Interspecific Competition. Behaviour 1983, 84, 1–73. [Google Scholar] [CrossRef]
  77. Bergeron, J.M.; Joudoin, L. Patterns of resource use, food quality, and health status of voles (Microtus pennsylvanicus) trapped from fluctuating populations. Oecologia 1989, 79, 306–314. [Google Scholar] [CrossRef]
  78. Primdahl, J.; Peco, B.; Schramek, J.; Andersen, E.; Oñate, J.J. Environmental effects of agri-environmental schemes in Western Europe. J. Environ. Manag. 2003, 67, 129–138. [Google Scholar] [CrossRef]
  79. Albert, L.; Franck, P.; Gilles, Y.; Plantegenest, M. Impact of agroecological infrastructures on the dynamics of Dysaphis plantaginea (hemiptera: Aphididae) and its natural enemies in apple orchards in northwestern France. Environ. Entomol. 2017, 46, 528–537. [Google Scholar] [CrossRef]
  80. van der Meer, M.; Kay, S.; Lüscher, G.; Jeanneret, P. What evidence exists on the impact of agricultural practices in fruit orchards on biodiversity? A systematic map. Environ. Evid. 2020, 9, 2. [Google Scholar] [CrossRef]
  81. Prieur, A.-G.A.; Swihart, R.K. Field attributes and farming practices associated with vole (Microtus) damage in cover-cropped fields. Agric. Ecosyst. Environ. 2020, 300, 106950. [Google Scholar] [CrossRef]
  82. Khlyap, L.A.; Warshavsky, A.A. Synanthropic and agrophilic rodents as invasive alien mammals. Russ. J. Biol. Invasions 2010, 1, 301–312. [Google Scholar] [CrossRef]
  83. Shiels, A.B.; Flores, C.A.; Khamsing, A.; Krushelnycky, P.D.; Mosher, S.M.; Drake, D.R. Dietary niche differentiation among three species of invasive rodents (Rattus rattus, R. exulans, Mus musculus). Biol. Invasions 2013, 15, 1037–1048. [Google Scholar] [CrossRef]
  84. Biró, Z.; Lanszki, J.; Szemethy, L.; Heltai, M.; Randi, E. Feeding habits of feral domestic cats (Felis catus), wild cats (Felis silvestris) and their hybrids: Trophic niche overlap among cat groups in Hungary. J. Zool. 2005, 266, 187–196. [Google Scholar] [CrossRef]
  85. Eccard, J.A.; Ylönen, H. Interspecific competition in small rodents: From populations to individuals. Evol. Ecol. 2003, 17, 423–440. [Google Scholar] [CrossRef]
  86. Heroldová, M.; Tkadlec, E.; Bryja, J.; Zejda, J. Wheat or barley? Appl. Anim. Behav. Sci. 2008, 110, 354–362. [Google Scholar] [CrossRef]
  87. Hansson, L. An Interpretation of Rodent Dynamics as Due to Trophic Interactions. Oikos 1987, 50, 308–318. [Google Scholar] [CrossRef]
  88. Myllymäki, A. Outbreaks and Damage by the Field Vole, Microtus agrestis (L.), since World War II in Europe. EPPO Bull. 1977, 7, 177–207. [Google Scholar] [CrossRef]
  89. Wheeler, P. The diet of field voles Microtus agrestis at low population density in upland Britain. Acta Theriol. 2005, 50, 483–492. [Google Scholar] [CrossRef]
Figure 1. Distribution of sympatric Microtus species at the trapping sites in Lithuania, 2018–2020. Due to small numbers of trapped field and root voles, the proportions of these species do not correspond to the width of slices in the pie charts.
Animals 11 01814 g001
Figure 2. Distribution of syntopic Microtus species according to stable isotope ratios: (a) irrespective of habitat; (b) in control habitats (meadows); and (c) in apple orchards. Sample size is shown in the legend.
Animals 11 01814 g002
Figure 3. Central ellipses of syntopic Microtus species in the isotopic space, representing fundamental niches: (a) irrespective of habitat; (b) in control habitats; and (c) in apple orchards. Sample size is the same, as in Figure 2.
Animals 11 01814 g003
Figure 4. Central position (mean ± SE) of stable isotope ratios of the common vole without or in limited co-occurrence: (a) plum orchards; (b) currant plantations; (c) raspberry plantations. Sample size is shown in the legend.
Animals 11 01814 g004
Figure 5. Intraspecific differences in the stable isotope values in the hair of adult, subadult, and young animals: (a) common vole; (b) field vole; (c) root vole. Sample size is shown in the legend.
Animals 11 01814 g005
Figure 6. Intraspecific differences in the stable isotope values in the hair of males and females: (a) common vole; (b) field vole; (c) root vole. Sample size is shown in the legend.
Animals 11 01814 g006
Table 1. Samples of Microtus voles from commercial orchards of Lithuania, 2018–2020, used for stable isotope analysis.
SpeciesTrapped Analysed AdultsSub-AdultsJuveniles MalesFemales
M. arvalis43630613336137129177
M. agrestis313121641318
M. oeconomus4239 *226111623
* Some individuals were partially destroyed; therefore, their hair was not suitable.
Table 2. Co-occurring of three Microtus species. N—number of trapping sessions (different years, seasons, and habitats), NONE—no Microtus trapped, CV—common vole only, FV—field vole only, RV—root vole only, and combinations of these species, n—number of sites with the habitat present.
Habitat NNONECVFVRVCV + FVCV + RVFV + RV
Apple orchards (n = 10)46211512241
Plum orchards (n = 2)835
Raspberry plantations (n = 3)1577 1
Currant plantations (n = 3)1459
High blueberry plantations (n = 1)33
Control meadows (n = 16)82392645161
Table 3. Central position (mean ± SE) and ranges of stable isotope ratios in the hair of three Microtus species from commercial orchards of Lithuania, 2018–2020.
Species δ13C Values, ‰δ15N Values, ‰
Mean ± SE Min–MaxRangeMean ± SEMin–MaxRange
M. arvalis−27.08 ± 0.04−28.58–−24.584.004.93 ± 0.080.52–14.5013.98
M. agrestis−27.54 ± 0.10−29.00–−26.482.525.16 ± 0.331.91–9.137.22
M. oeconomus−27.59 ± 0.11−28.88–−26.372.515.77 ± 0.252.16–9.016.85
Publisher’s Note: MDPI stays neutral with regard to jurisdictional claims in published maps and institutional affiliations.

