
Signals of Potential Species Associations Offer Clues about Community Organisation of Stream Fish across Seasons

 ,
, 
Abstract
:Simple Summary
Abstract
1. Introduction
2. Methods
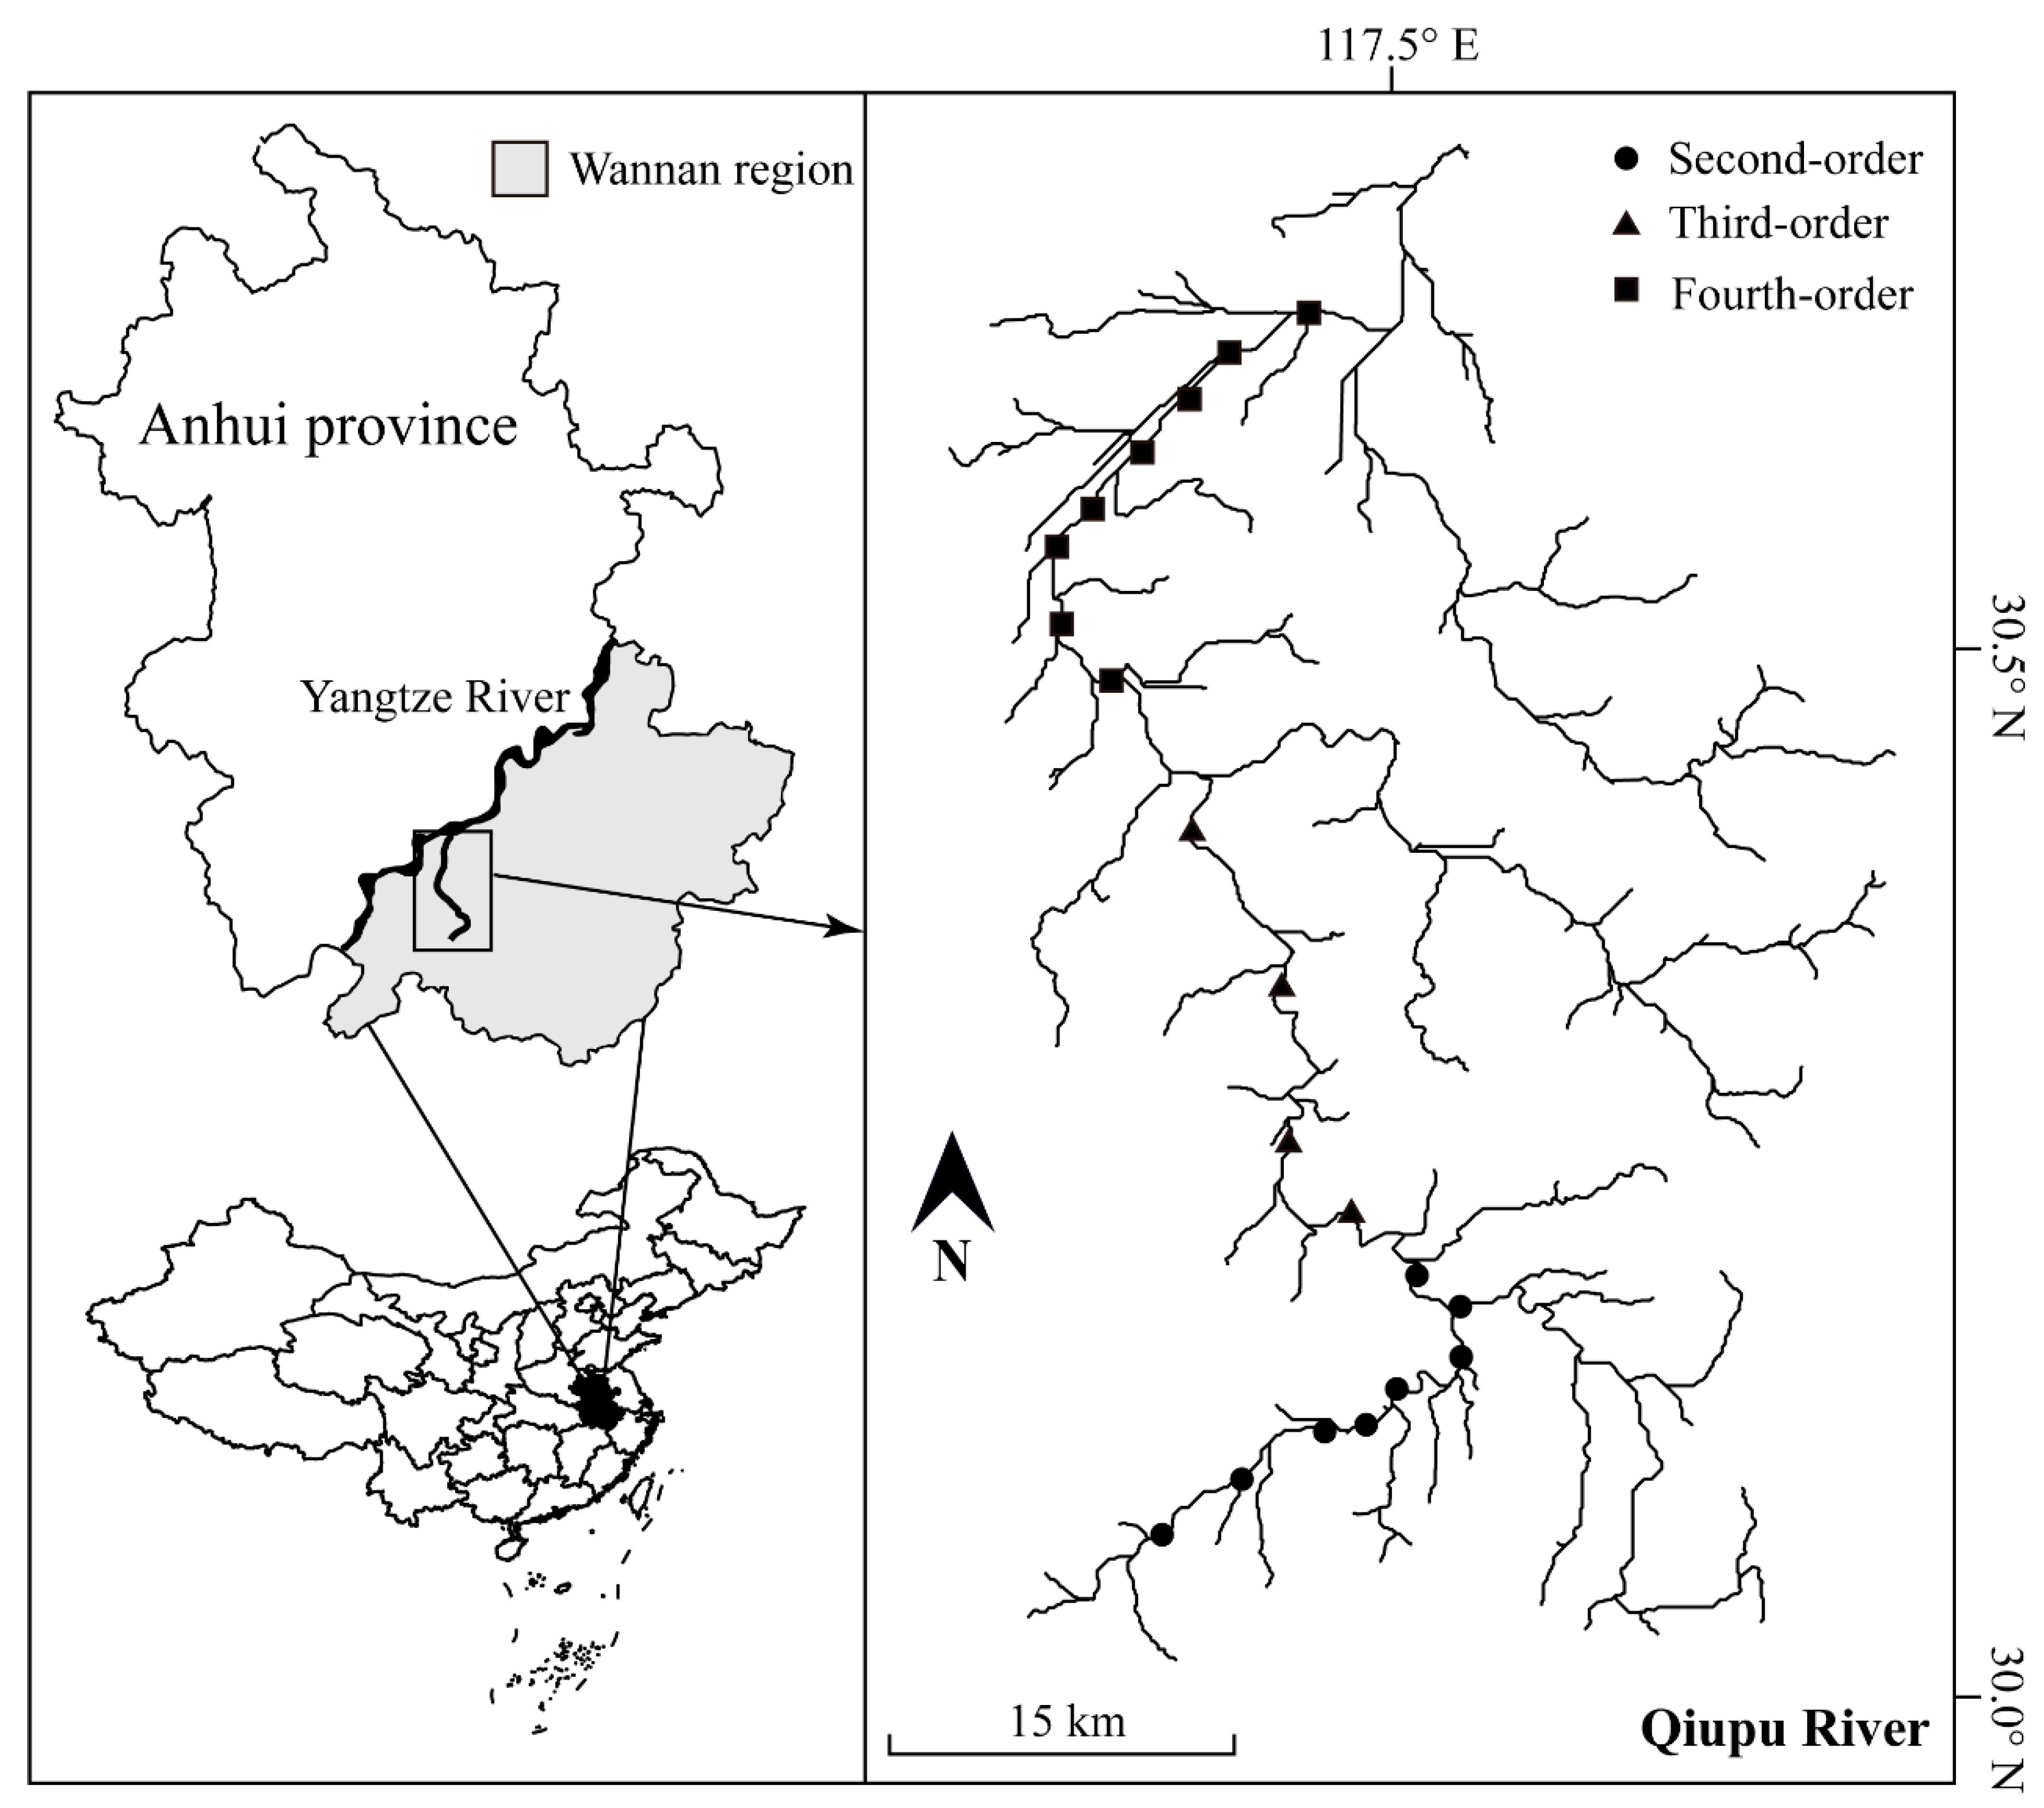
2.1. Study Area
2.2. Fish Sampling
2.3. Local Environmental Conditions and Land Use
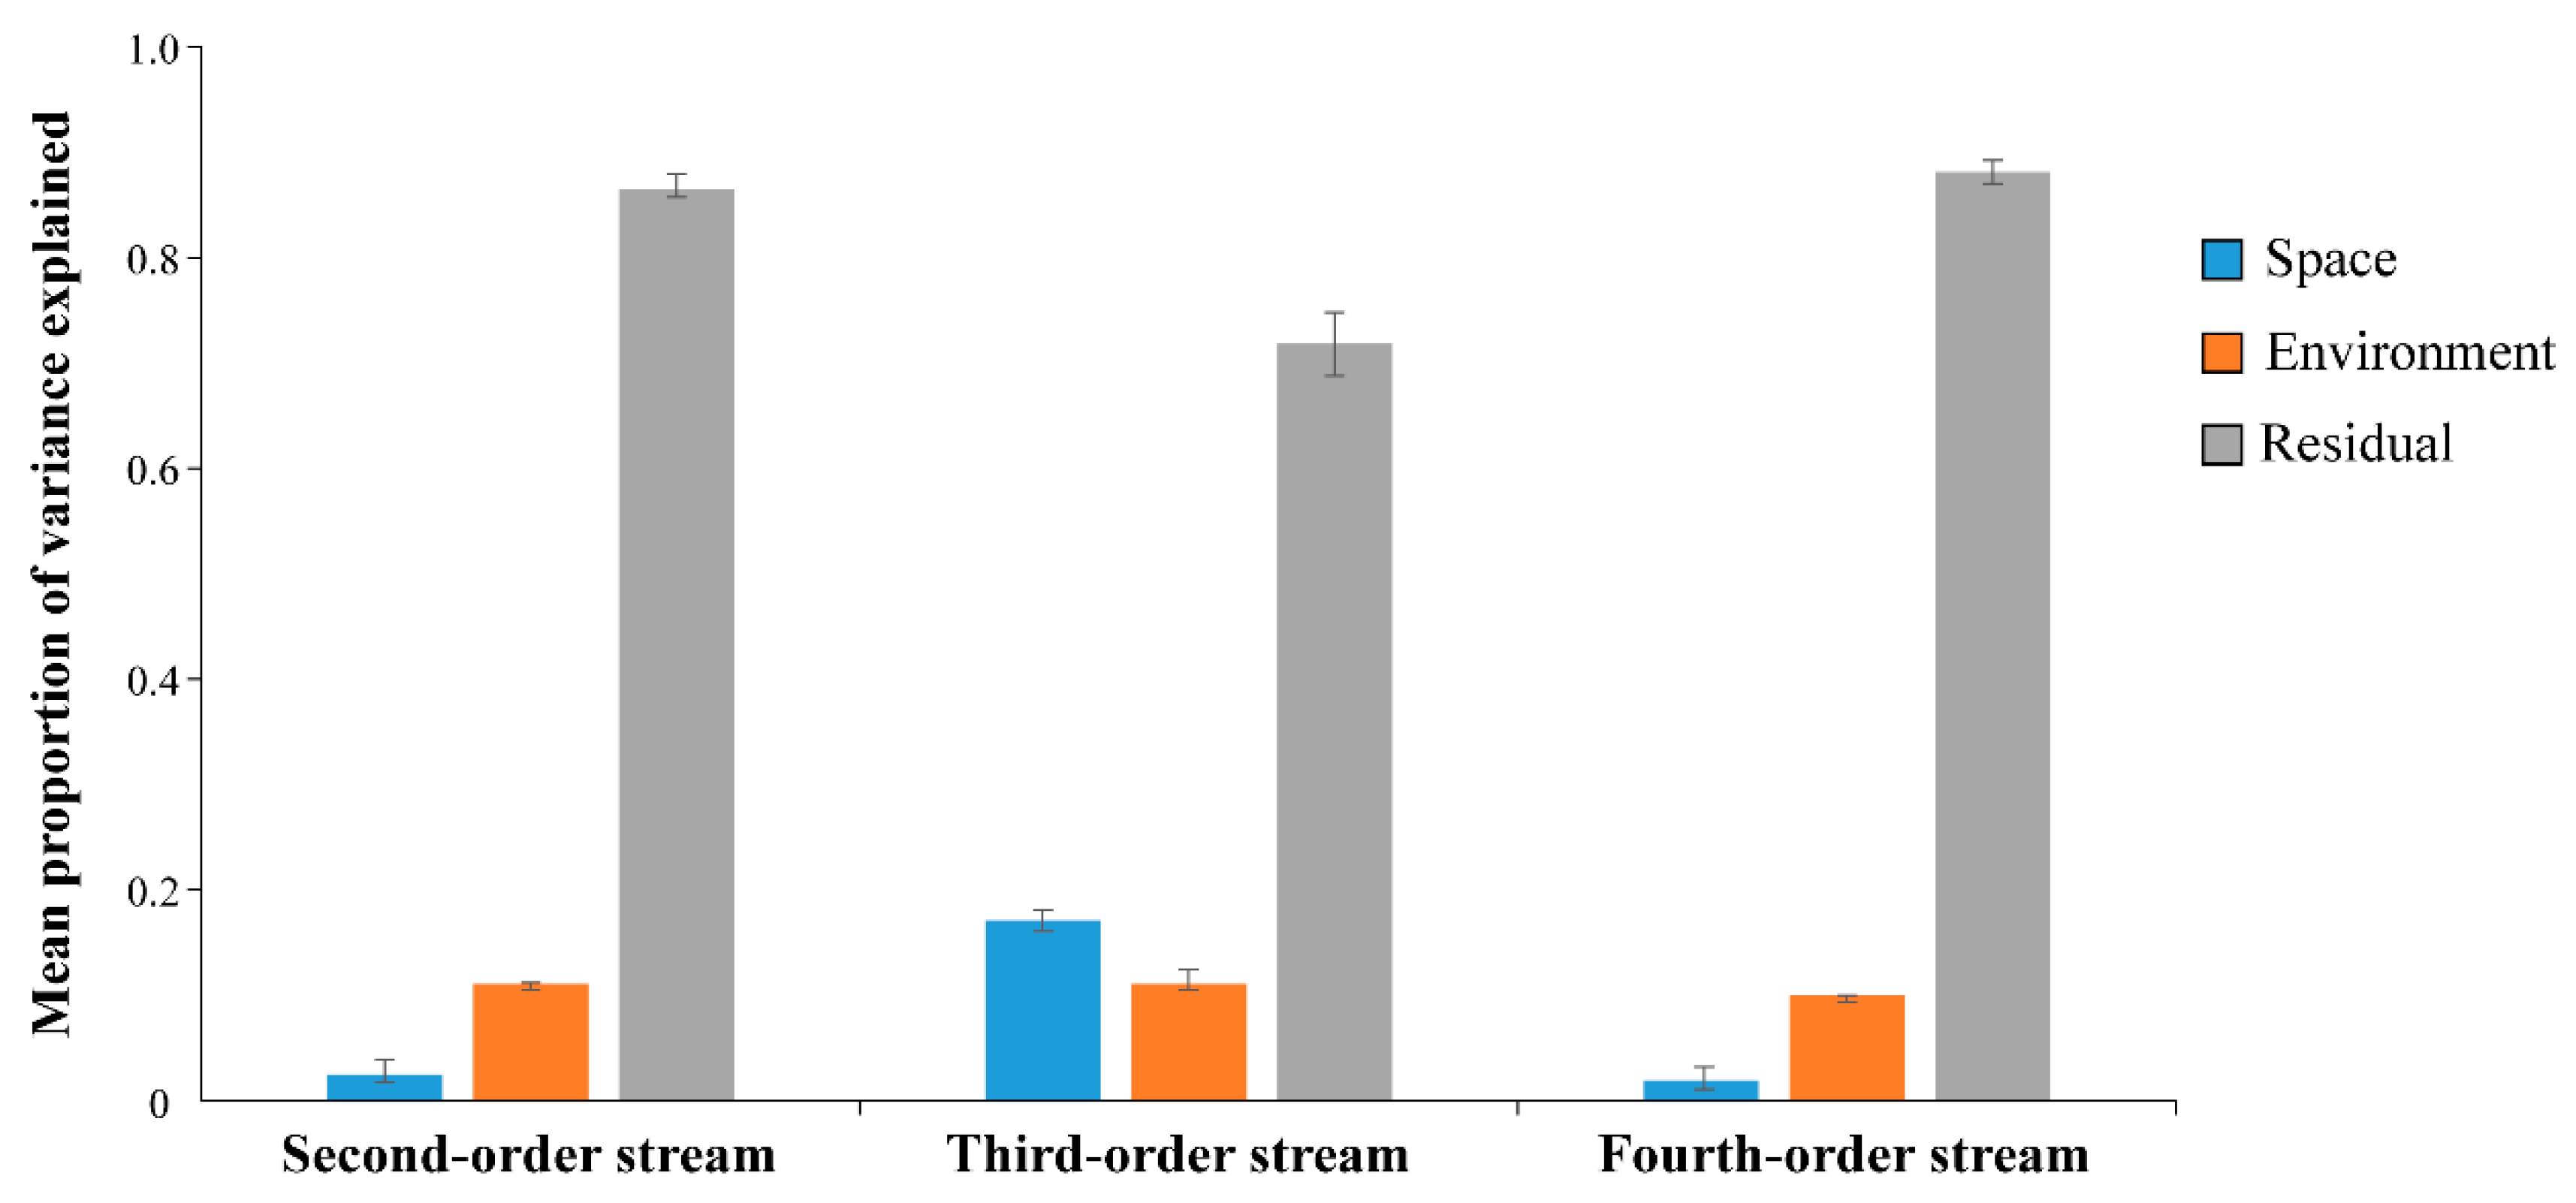
2.4. Partitioning the Drivers of Fish Community Organisation
2.5. Constructing Poisson Log-Normal (PLN) Models
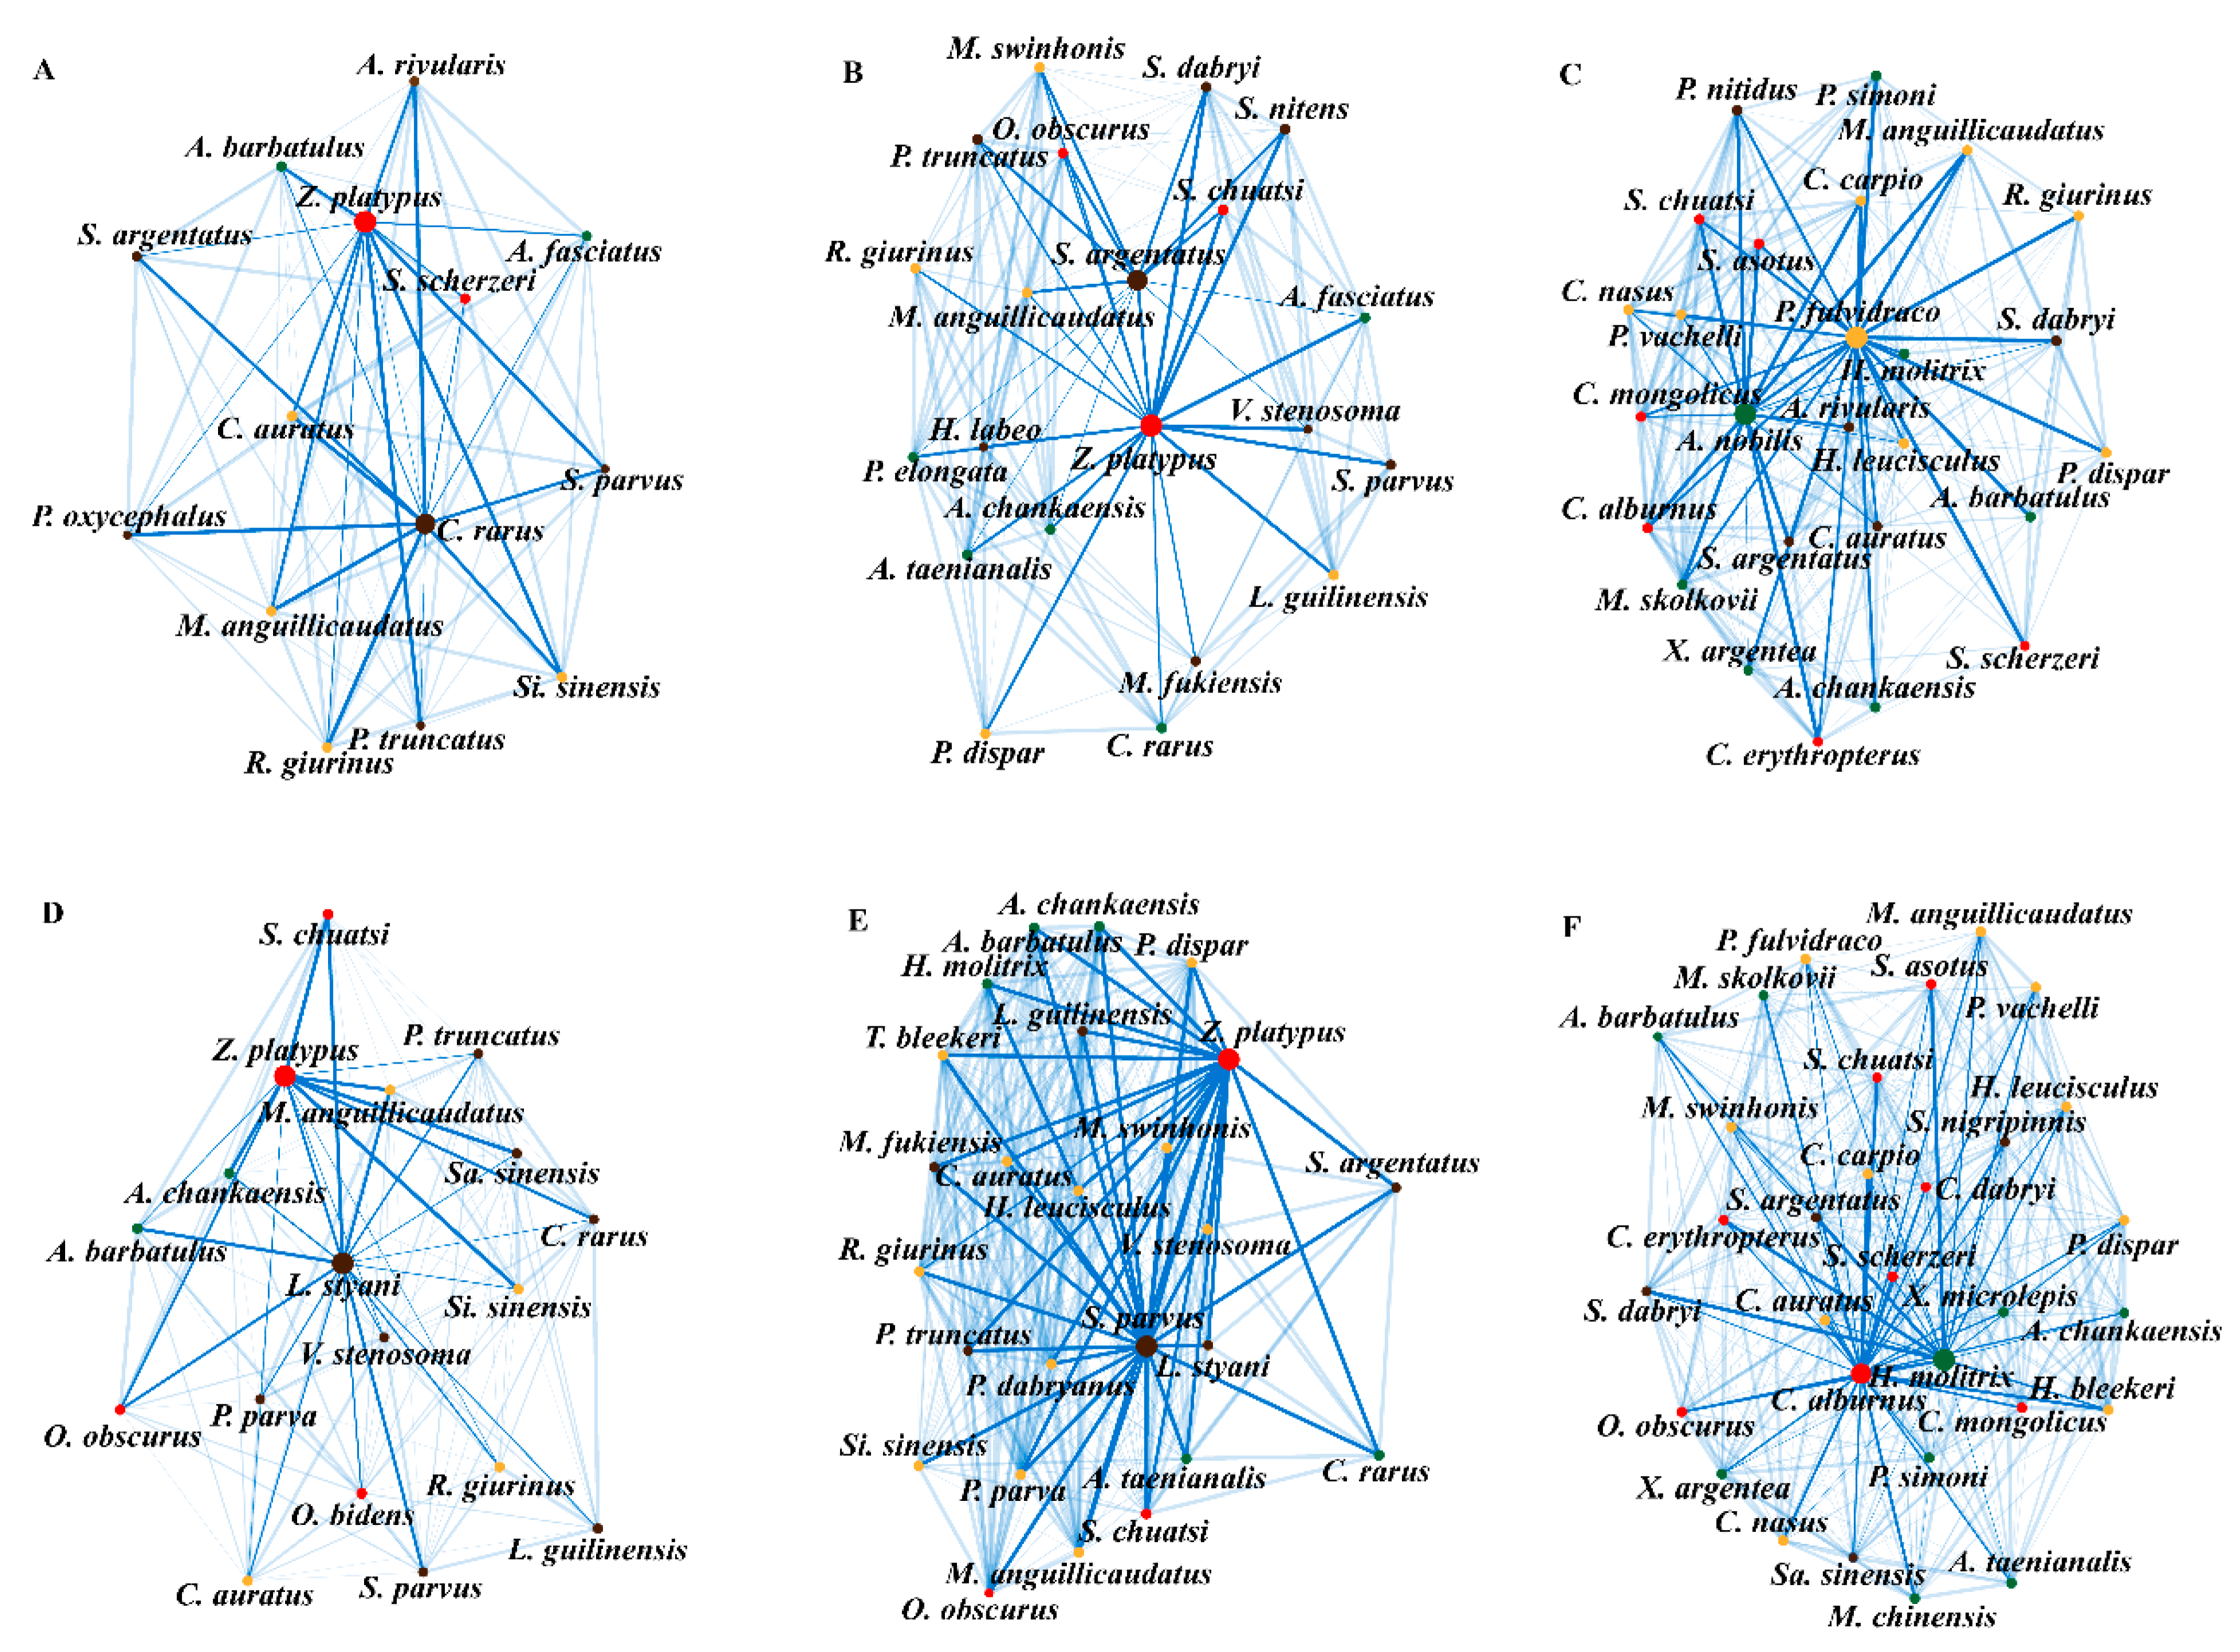
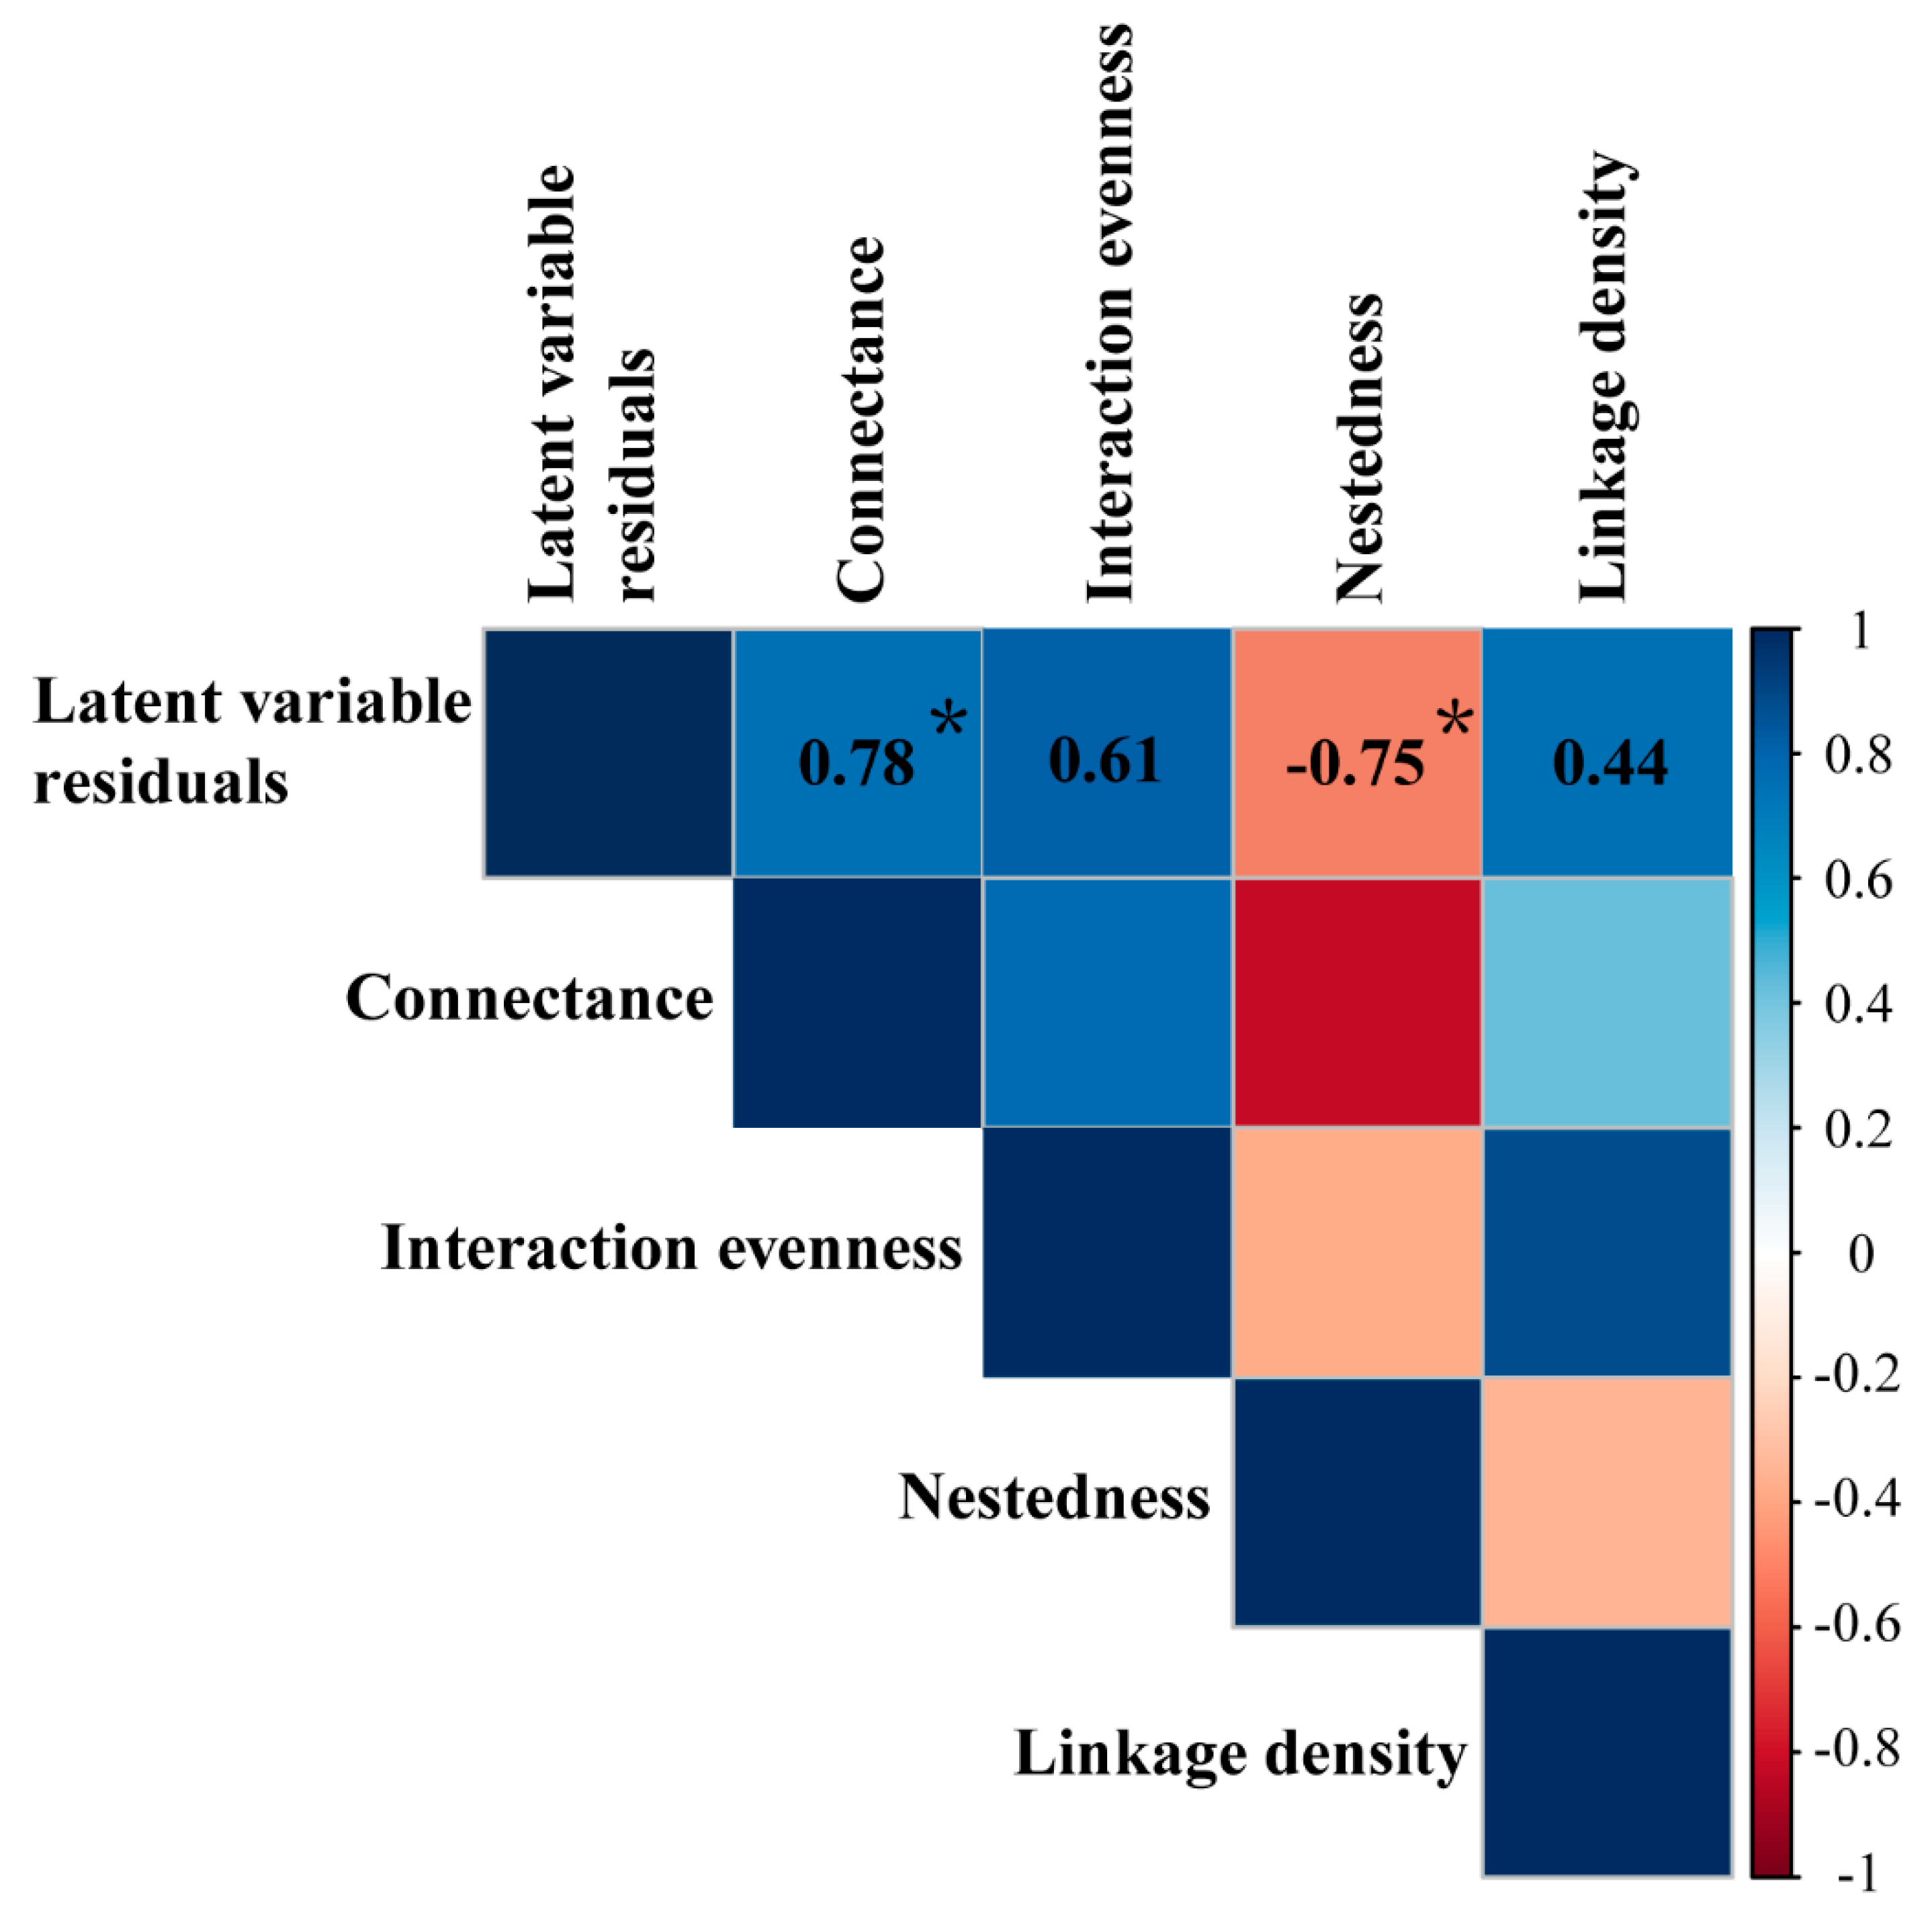
2.6. Inferring Species Interaction Networks
3. Results
4. Discussion
5. Conclusions
Supplementary Materials
Author Contributions
Funding
Institutional Review Board Statement
Informed Consent Statement
Data Availability Statement
Acknowledgments
Conflicts of Interest
References
- Mori, A.S.; Isbell, F.; Seidl, R. β–diversity, community assembly, and ecosystem functioning. Trends Ecol. Evol. 2018, 33, 549–564. [Google Scholar] [CrossRef] [PubMed]
- Weiher, E.; Freund, D.; Bunton, T.; Stefanski, A.; Lee, T.; Bentivenga, S. Advances, challenges and a developing synthesis of ecological community assembly theory. Philos. Trans. R. Soc. B Biol. Sci. 2011, 366, 2403–2413. [Google Scholar] [CrossRef] [PubMed]
- Ponisio, L.C.; Valdovinos, F.S.; Allhoff, K.T.; Gaiarsa, M.P.; Barner, A.; Guimarães, P.R., Jr.; Gillespie, R. A network perspective for community assembly. Front. Ecol. Evol. 2019, 7, 103. [Google Scholar] [CrossRef] [Green Version]
- Saito, V.S.; Perkins, D.M.; Kratina, P. A Metabolic Perspective of Stochastic Community Assembly. Trends Ecol. Evol. 2021, 36, 280–283. [Google Scholar] [CrossRef] [PubMed]
- Heino, J.; Melo, A.S.; Siqueira, T.; Soininen, J.; Valanko, S.; Bini, L.M. Metacommunity organisation, spatial extent and dispersal in aquatic systems: Patterns, processes and prospects. Freshw. Biol. 2015, 60, 845–869. [Google Scholar] [CrossRef]
- Kraft, N.J.; Adler, P.B.; Godoy, O.; James, E.C.; Fuller, S.; Levine, J.M. Community assembly, coexistence and the environmental filtering metaphor. Funct. Ecol. 2015, 29, 592–599. [Google Scholar] [CrossRef]
- Chase, J.M. Drought mediates the importance of stochastic community assembly. Proc. Natl. Acad. Sci. USA 2007, 104, 17430–17434. [Google Scholar] [CrossRef] [Green Version]
- Vellend, M. Conceptual synthesis in community ecology. Q. Rev. Biol. 2010, 85, 183–206. [Google Scholar] [CrossRef] [Green Version]
- Shipley, B.; Paine, C.T.; Baraloto, C. Quantifying the importance of local niche-based and stochastic processes to tropical tree community assembly. Ecology 2012, 93, 760–769. [Google Scholar] [CrossRef] [Green Version]
- Erős, T. Scaling fish metacommunities in stream networks: Synthesis and future research avenues. Community Ecol. 2017, 18, 72–86. [Google Scholar] [CrossRef] [Green Version]
- García-Girón, J.; Heino, J.; García-Criado, F.; Fernández-Aláez, C.; Alahuhta, J. Biotic interactions hold the key to understanding metacommunity organisation. Ecography 2020, 43, 1180–1190. [Google Scholar] [CrossRef]
- Donohue, I.; Petchey, O.L.; Montoya, J.M.; Jackson, A.L.; McNally, L.; Viana, M.; Emmerson, M.C. On the dimensionality of ecological stability. Ecol. Lett. 2013, 16, 421–429. [Google Scholar] [CrossRef] [PubMed]
- Gravel, D.; Baiser, B.; Dunne, J.A.; Kopelke, J.P.; Martinez, N.D.; Nyman, T.; Roslin, T. Bringing Elton and Grinnell together: A quantitative framework to represent the biogeography of ecological interaction networks. Ecography 2019, 42, 401–415. [Google Scholar] [CrossRef] [Green Version]
- Lee, C.K.; Laughlin, D.C.; Bottos, E.M.; Caruso, T.; Joy, K.; Barrett, J.E.; Cary, S.C. Biotic interactions are an unexpected yet critical control on the complexity of an abiotically driven polar ecosystem. Commun. Biol. 2019, 2, 62. [Google Scholar] [CrossRef]
- Poisot, T.; Stouffer, D.B.; Kéfi, S. Describe, understand and predict: Why do we need networks in ecology? Funct. Ecol. 2016, 30, 1878–1882. [Google Scholar] [CrossRef]
- Fort, H.; Vázquez, D.P.; Lan, B.L. Abundance and generalisation in mutualistic networks: Solving the chicken-and-egg dilemma. Ecol. Lett. 2016, 19, 4–11. [Google Scholar] [CrossRef]
- Sulliván, S.M.P.; Bohenek, J.R.; Cáceres, C.; Pomeroy, L.W. Multiple urban stressors drive fish-based ecological networks in streams of Columbus, Ohio, USA. Sci. Total Environ. 2021, 754, 141970. [Google Scholar] [CrossRef]
- Danet, A.; Mouchet, M.; Bonnaffé, W.; Thébault, E.; Fontaine, C. Species richness and food-web structure jointly drive community biomass and its temporal stability in fish communities. Ecol. Lett. 2021, 24, 2364–2377. [Google Scholar] [CrossRef]
- MacDougall, A.S.; Harvey, E.; McCune, J.L.; Nilsson, K.A.; Bennett, J.; Firn, J.; McCann, K.S. Context–dependent interactions and the regulation of species richness in freshwater fish. Nat. Commun. 2018, 9, 973. [Google Scholar] [CrossRef]
- Olivier, P.; Frelat, R.; Bonsdorff, E.; Kortsch, S.; Kröncke, I.; Möllmann, C.; Nordström, M.C. Exploring the temporal variability of a food web using long-term biomonitoring data. Ecography 2019, 42, 2107–2121. [Google Scholar] [CrossRef] [Green Version]
- Poisot, T.; Stouffer, D.B.; Gravel, D. Beyond species: Why ecological interaction networks vary through space and time. Oikos 2015, 124, 243–251. [Google Scholar] [CrossRef]
- Warton, D.I.; Blanchet, F.G.; O’Hara, R.B.; Ovaskainen, O.; Taskinen, S.; Walker, S.C.; Hui, F.K. So many variables: Joint modeling in community ecology. Trends Ecol. Evol. 2015, 30, 766–779. [Google Scholar] [CrossRef] [PubMed]
- Gorman, O.T.; Karr, J.R. Habitat structure and stream fish communities. Ecology 1978, 59, 507–515. [Google Scholar] [CrossRef]
- Zhang, D.; Heng, W.; Chu, L.; Xu, D.; Kang, B.; Yan, Y. Taxonomic and functional diversity in a subtropical stream: A longitudinal pattern analysis. Ecol. Freshw. Fish 2020, 29, 752–763. [Google Scholar] [CrossRef]
- Brimacombe, C.; Bodner, K.; Fortin, M.J. Inferred seasonal interaction rewiring of a freshwater stream fish network. Ecography 2021, 44, 219–230. [Google Scholar] [CrossRef]
- Hui, F.K. Boral–Bayesian ordination and regression analysis of multivariate abundance data in R. Methods Ecol. Evol. 2016, 7, 744–750. [Google Scholar] [CrossRef] [Green Version]
- Momal, R.; Robin, S.; Ambroise, C. Tree–based inference of species interaction networks from abundance data. Methods Ecol. Evol. 2020, 11, 621–632. [Google Scholar] [CrossRef]
- Zhang, L.; Xu, W.H.; Ouyang, Z.Y.; Zhu, C.Q. Determination of priority nature conservation areas and human disturbances in the Yangtze River Basin, China. J. Nat. Conserv. 2014, 22, 326–336. [Google Scholar] [CrossRef]
- Wang, X.; Li, S.; Price, M.; Lei, Y.; Wu, B.; Liu, K.; Song, Z. Longitudinal and seasonal patterns of fish assemblage structure in the Zhougong River, Sichuan Province, southwest China. Ecol. Indic. 2019, 107, 105656. [Google Scholar] [CrossRef]
- Li, Q.; Li, Y.; Jiang, M.; Wang, Y.; Xu, D.; Chu, L.; Yan, Y. Effects of low–head dams on fish assemblages in subtropical streams: Context dependence on local habitat and landscape conditions. Ecol. Indic. 2021, 121, 107190. [Google Scholar] [CrossRef]
- Kondolf, G.M. Application of the pebble count notes on purpose, method, and variants. J. Am. Water Resour. Assoc. 1997, 33, 79–87. [Google Scholar] [CrossRef]
- Dormann, C.F.; Bobrowski, M.; Dehling, D.M.; Harris, D.J.; Hartig, F.; Lischke, H.; Moretti, M.D.; Pagel, J.; Pinkert, S.; Schleuning, M.; et al. Biotic interactions in species distribution modelling: 10 questions to guide interpretation and avoid false conclusions. Glob. Ecol. Biogeogr. 2018, 27, 1004–1016. [Google Scholar] [CrossRef] [Green Version]
- Legendre, P.; Gallagher, E.D. Ecologically meaningful transformations for ordination of species data. Oecologia 2001, 129, 271–280. [Google Scholar] [CrossRef] [PubMed]
- Holm, S. A simple sequentially rejective multiple test procedure. Scand. J. Stat. 1979, 6, 65–70. [Google Scholar]
- Mehner, T.; Argillier, C.; Hesthagen, T.; Holmgren, K.; Jeppesen, E.; Kelly, F.; Brucet, S. Model-based decomposition of environmental, spatial and species-interaction effects on the community structure of common fish species in 772 European lakes. Glob. Ecol. Biogeogr. 2021, 30, 1558–1571. [Google Scholar] [CrossRef]
- R Core Team. R: A Language and Environment for Statistical Computing; R Foundation for Statistical Computing: Vienna, Austria, 2019; Available online: www.r.project.org/ (accessed on 10 March 2022).
- Chiquet, J.; Mariadassou, M.; Robin, S. Variational inference for probabilistic Poisson PCA. Ann. Appl. Stat. 2018, 12, 2674–2698. [Google Scholar] [CrossRef] [Green Version]
- Chiquet, J.; Mariadassou, M.; Robin, S. The Poisson–lognormal model as a versatile framework for the joint analysis of species abundances. Front. Ecol. Evol. 2021, 9, 188. [Google Scholar] [CrossRef]
- Kärnä, O.M.; Grönroos, M.; Antikainen, H.; Hjort, J.; Ilmonen, J.; Paasivirta, L.; Heino, J. Inferring the effects of potential dispersal routes on the metacommunity structure of stream insects: As the crow flies, as the fish swims or as the fox runs? J. Anim. Ecol. 2015, 84, 1342–1353. [Google Scholar] [CrossRef]
- Bassett, D.S.; Meyer–Lindenberg, A.; Achard, S.; Duke, T.; Bullmore, E. Adaptive reconfiguration of fractal small–world human brain functional networks. Proc. Natl. Acad. Sci. USA 2006, 103, 19518–19523. [Google Scholar] [CrossRef] [Green Version]
- Dormann, C.F.; Gruber, B.; Fründ, J. Introducing the bipartite package: Analysing ecological networks. R News. 2008, 8, 8–11. Available online: http://www.biom.uni-freiburg.de/Dateien/PDF/dormann2008rnews.pdf (accessed on 23 April 2022).
- Soliveres, S.; Eldridge, D.J. Dual community assembly processes in dryland biocrust communities. Funct. Ecol. 2020, 34, 877–887. [Google Scholar] [CrossRef]
- Faisal, A.; Dondelinger, F.; Husmeier, D.; Beale, C.M. Inferring species interaction networks from species abundance data: A comparative evaluation of various statistical and machine learning methods. Ecol. Inform. 2010, 5, 451–464. [Google Scholar] [CrossRef] [Green Version]
- Schmera, D.; Árva, D.; Boda, P.; Bódis, E.; Bolgovics, Á.; Borics, G.; Csercsa, A.; Deák, C.; Krasznai, E.Á.; Lukács, B.A.; et al. Does isolation influence the relative role of environmental and dispersal-related processes in stream networks? An empirical test of the network position hypothesis using multiple taxa. Freshw. Biol 2018, 63, 74–85. [Google Scholar] [CrossRef]
- Henriques–Silva, R.; Logez, M.; Reynaud, N.; Tedesco, P.A.; Brosse, S.; Januchowski-Hartley, S.R.; Argillier, C. A comprehensive examination of the network position hypothesis across multiple river metacommunities. Ecography 2019, 42, 284–294. [Google Scholar] [CrossRef] [Green Version]
- López-Delgado, E.O.; Winemiller, K.O.; Villa-Navarro, F.A. Local environmental factors influence beta-diversity patterns of tropical fish assemblages more than spatial factors. Ecology 2020, 101, e02940. [Google Scholar] [CrossRef]
- Zbinden, Z.D.; Matthews, W.J. Beta diversity of stream fish assemblages: Partitioning variation between spatial and environmental factors. Freshw. Biol. 2017, 62, 1460–1471. [Google Scholar] [CrossRef]
- Bystrova, D.; Poggiato, G.; Bektaş, B.; Arbel, J.; Clark, J.S.; Guglielmi, A.; Thuiller, W. Clustering species with residual covariance matrix in Joint Species Distribution models. Front. Ecol. Evol. 2021, 9, 128. [Google Scholar] [CrossRef]
- De Araújo, C.B.; Marcondes-Machado, L.O.; Costa, G.C. The importance of biotic interactions in species distribution models: A test of the Eltonian noise hypothesis using parrots. J. Biogeogr. 2014, 41, 513–523. [Google Scholar] [CrossRef]
- Poggiato, G.; Münkemüller, T.; Bystrova, D.; Arbel, J.; Clark, J.S.; Thuiller, W. On the interpretations of joint modeling in community ecology. Trends Ecol. Evol. 2021, 36, 391–401. [Google Scholar] [CrossRef]
- Darwin, C. On the Origin of Species, 1859; Routledge: London, UK, 2004. [Google Scholar]
- Borcard, D.; Legendre, P.; Drapeau, P. Partialling out the spatial component of ecological variation. Ecology 1992, 73, 1045–1055. [Google Scholar] [CrossRef] [Green Version]
- Soininen, J. A quantitative analysis of species sorting across organisms and ecosystems. Ecology 2014, 95, 3284–3292. [Google Scholar] [CrossRef]
- Valiente-Banuet, A.; Aizen, M.A.; Alcántara, J.M.; Arroyo, J.; Cocucci, A.; Galetti, M.; Zamora, R. Beyond species loss: The extinction of ecological interactions in a changing world. Funct. Ecol. 2015, 29, 299–307. [Google Scholar] [CrossRef]
- Hutchinson, J.T. Interactions between Hygrophila polysperma and Ludwigia repens grown in saturated soil and shallow water under ex situ conditions. Fundam. Appl. Limnol. 2021, 195, 187–198. [Google Scholar] [CrossRef]
- Chu, L.; Wang, W.; Zhu, R.; Yan, Y.; Chen, Y.; Wang, L. Variation in fish assemblages across impoundments of low-head dams in headwater streams of the Qingyi River, China: Effects of abiotic factors and native invaders. Environ. Biol. Fishes 2015, 98, 101–112. [Google Scholar] [CrossRef]
- Delmas, E.; Besson, M.; Brice, M.H.; Burkle, L.A.; Dalla Riva, G.V.; Fortin, M.J.; Poisot, T. Analysing ecological networks of species interactions. Biol. Rev. 2019, 94, 16–36. [Google Scholar] [CrossRef] [Green Version]
- Heleno, R.; Devoto, M.; Pocock, M. Connectance of species interaction networks and conservation value: Is it any good to be well connected? Ecol. Indic. 2012, 14, 7–10. [Google Scholar] [CrossRef] [Green Version]
- Dunne, J.A.; Williams, R.J.; Martinez, N.D. Network structure and biodiversity loss in food webs: Robustness increases with connectance. Ecol. Lett. 2002, 5, 558–567. [Google Scholar] [CrossRef] [Green Version]
- Thébault, E.; Fontaine, C. Stability of ecological communities and the architecture of mutualistic and trophic networks. Science 2010, 329, 853–856. [Google Scholar] [CrossRef]
- Dell, J.E.; Salcido, D.M.; Lumpkin, W.; Richards, L.A.; Pokswinski, S.M.; Loudermilk, E.L.; Dyer, L.A. Interaction diversity maintains resiliency in a frequently disturbed ecosystem. Front. Ecol. Evol. 2019, 7, 145. [Google Scholar] [CrossRef] [Green Version]
- Bastolla, U.; Fortuna, M.A.; Pascual–García, A.; Ferrera, A.; Luque, B.; Bascompte, J. The architecture of mutualistic networks minimizes competition and increases biodiversity. Nature 2009, 458, 1018–1020. [Google Scholar] [CrossRef]
- Zaret, T.M.; Rand, A.S. Competition in tropical stream fishes: Support for the competitive exclusion principle. Ecology 1971, 52, 336–342. [Google Scholar] [CrossRef]
- Zhang, C.; Li, M.; Chang, T.; Gao, X.; Liu, H.; Cao, W. The interaction processes of the fish assemblages between the Yangtze River and Poyang Lake, China. Ecol. Freshw. Fish 2021, 30, 541–550. [Google Scholar] [CrossRef]
- Gross, N.; Kunstler, G.; Liancourt, P.; De Bello, F.; Suding, K.N.; Lavorel, S. Linking individual response to biotic interactions with community structure: A trait-based framework. Funct. Ecol. 2009, 23, 1167–1178. [Google Scholar] [CrossRef]
- Vannote, R.L.; Minshall, G.W.; Cummins, K.W.; Sedell, J.R.; Cushing, C.E. The river continuum concept. Can. J. Fish. Aquat. Sci. 1980, 37, 130–137. [Google Scholar] [CrossRef]
- González, A.M.M.; Dalsgaard, B.; Olesen, J.M. Centrality measures and the importance of generalist species in pollination networks. Ecol. Complex. 2010, 7, 36–43. [Google Scholar] [CrossRef]
- Bascompte, J.; Jordano, P.; Melián, C.J.; Olesen, J.M. The nested assembly of plant–animal mutualistic networks. Proc. Natl. Acad. Sci. USA 2003, 100, 9383–9387. [Google Scholar] [CrossRef] [Green Version]


| Season | Stream Orders | Selected Variables | BIC | RMSE | R2 |
|---|---|---|---|---|---|
| Dry | Second-order | Site + elevation | −267.714 | 0.567 | 0.946 |
| Third-order | Site + elevation | −256.428 | 0.235 | 0.945 | |
| Fourth-order | Site | −557.069 | 0.338 | 0.770 | |
| Wet | Second-order | Site + dissolved oxygen | −385.017 | 0.487 | 0.875 |
| Third-order | Site + velocity | −330.697 | 0.032 | 0.932 | |
| Fourth-order | Site + dissolved oxygen | −820.550 | 0.253 | 0.908 |
Publisher’s Note: MDPI stays neutral with regard to jurisdictional claims in published maps and institutional affiliations. |
© 2022 by the authors. Licensee MDPI, Basel, Switzerland. This article is an open access article distributed under the terms and conditions of the Creative Commons Attribution (CC BY) license (https://creativecommons.org/licenses/by/4.0/).
Share and Cite
Zhang, C.; Zhang, Y.; García-Girón, J.; Tan, K.; Wang, L.; Ge, Y.; Yan, Y. Signals of Potential Species Associations Offer Clues about Community Organisation of Stream Fish across Seasons. Animals 2022, 12, 1721. https://0-doi-org.brum.beds.ac.uk/10.3390/ani12131721
Zhang C, Zhang Y, García-Girón J, Tan K, Wang L, Ge Y, Yan Y. Signals of Potential Species Associations Offer Clues about Community Organisation of Stream Fish across Seasons. Animals. 2022; 12(13):1721. https://0-doi-org.brum.beds.ac.uk/10.3390/ani12131721
Chicago/Turabian StyleZhang, Chen, Yuzhou Zhang, Jorge García-Girón, Kai Tan, Lei Wang, Yihao Ge, and Yunzhi Yan. 2022. "Signals of Potential Species Associations Offer Clues about Community Organisation of Stream Fish across Seasons" Animals 12, no. 13: 1721. https://0-doi-org.brum.beds.ac.uk/10.3390/ani12131721