
Analysis of Movements and Behavior of Bighead Carps (Hypophthalmichthys nobilis) Considering Fish Passage Energetics in an Experimental Vertical Slot Fishway

Abstract
:Simple Summary
Abstract
1. Introduction
2. Materials and Methods
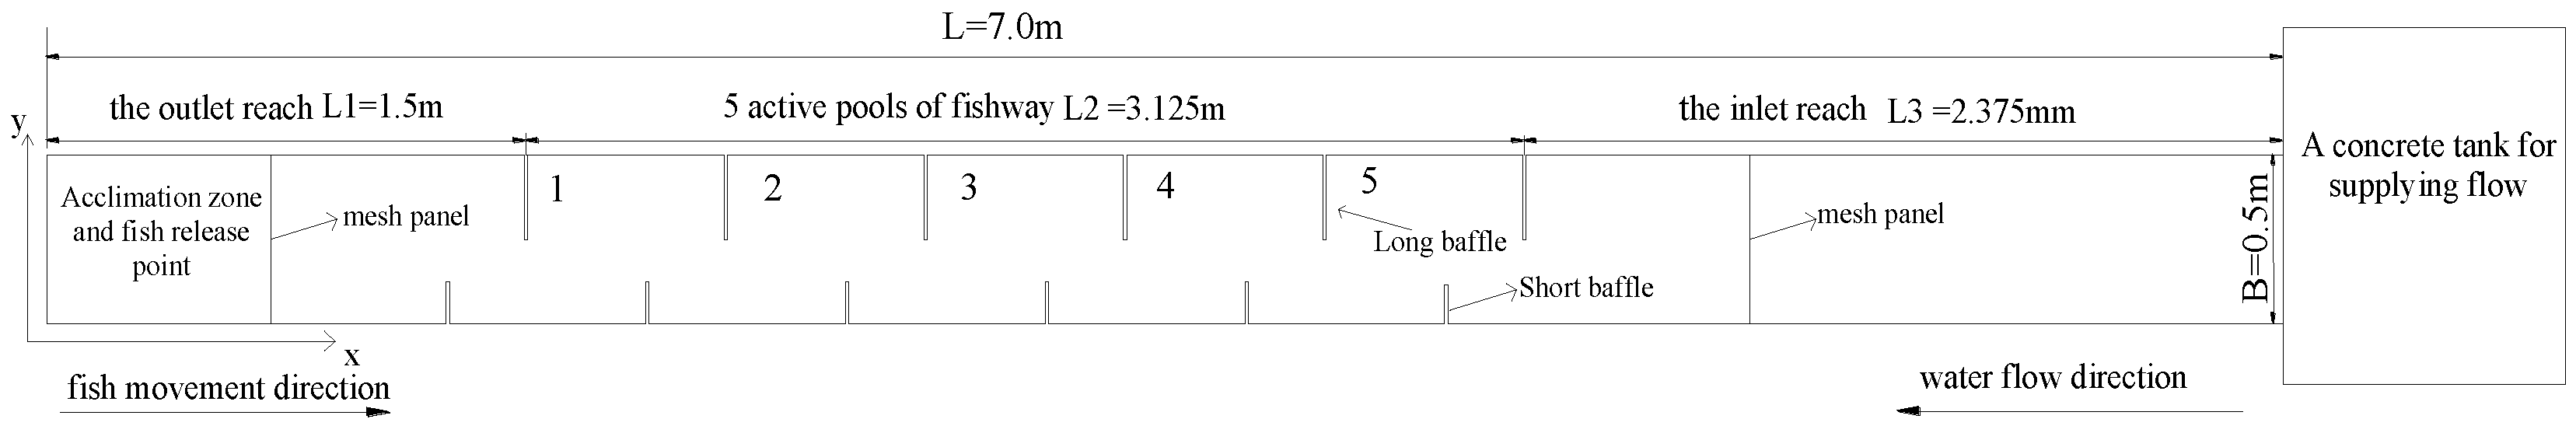
2.1. Experiments
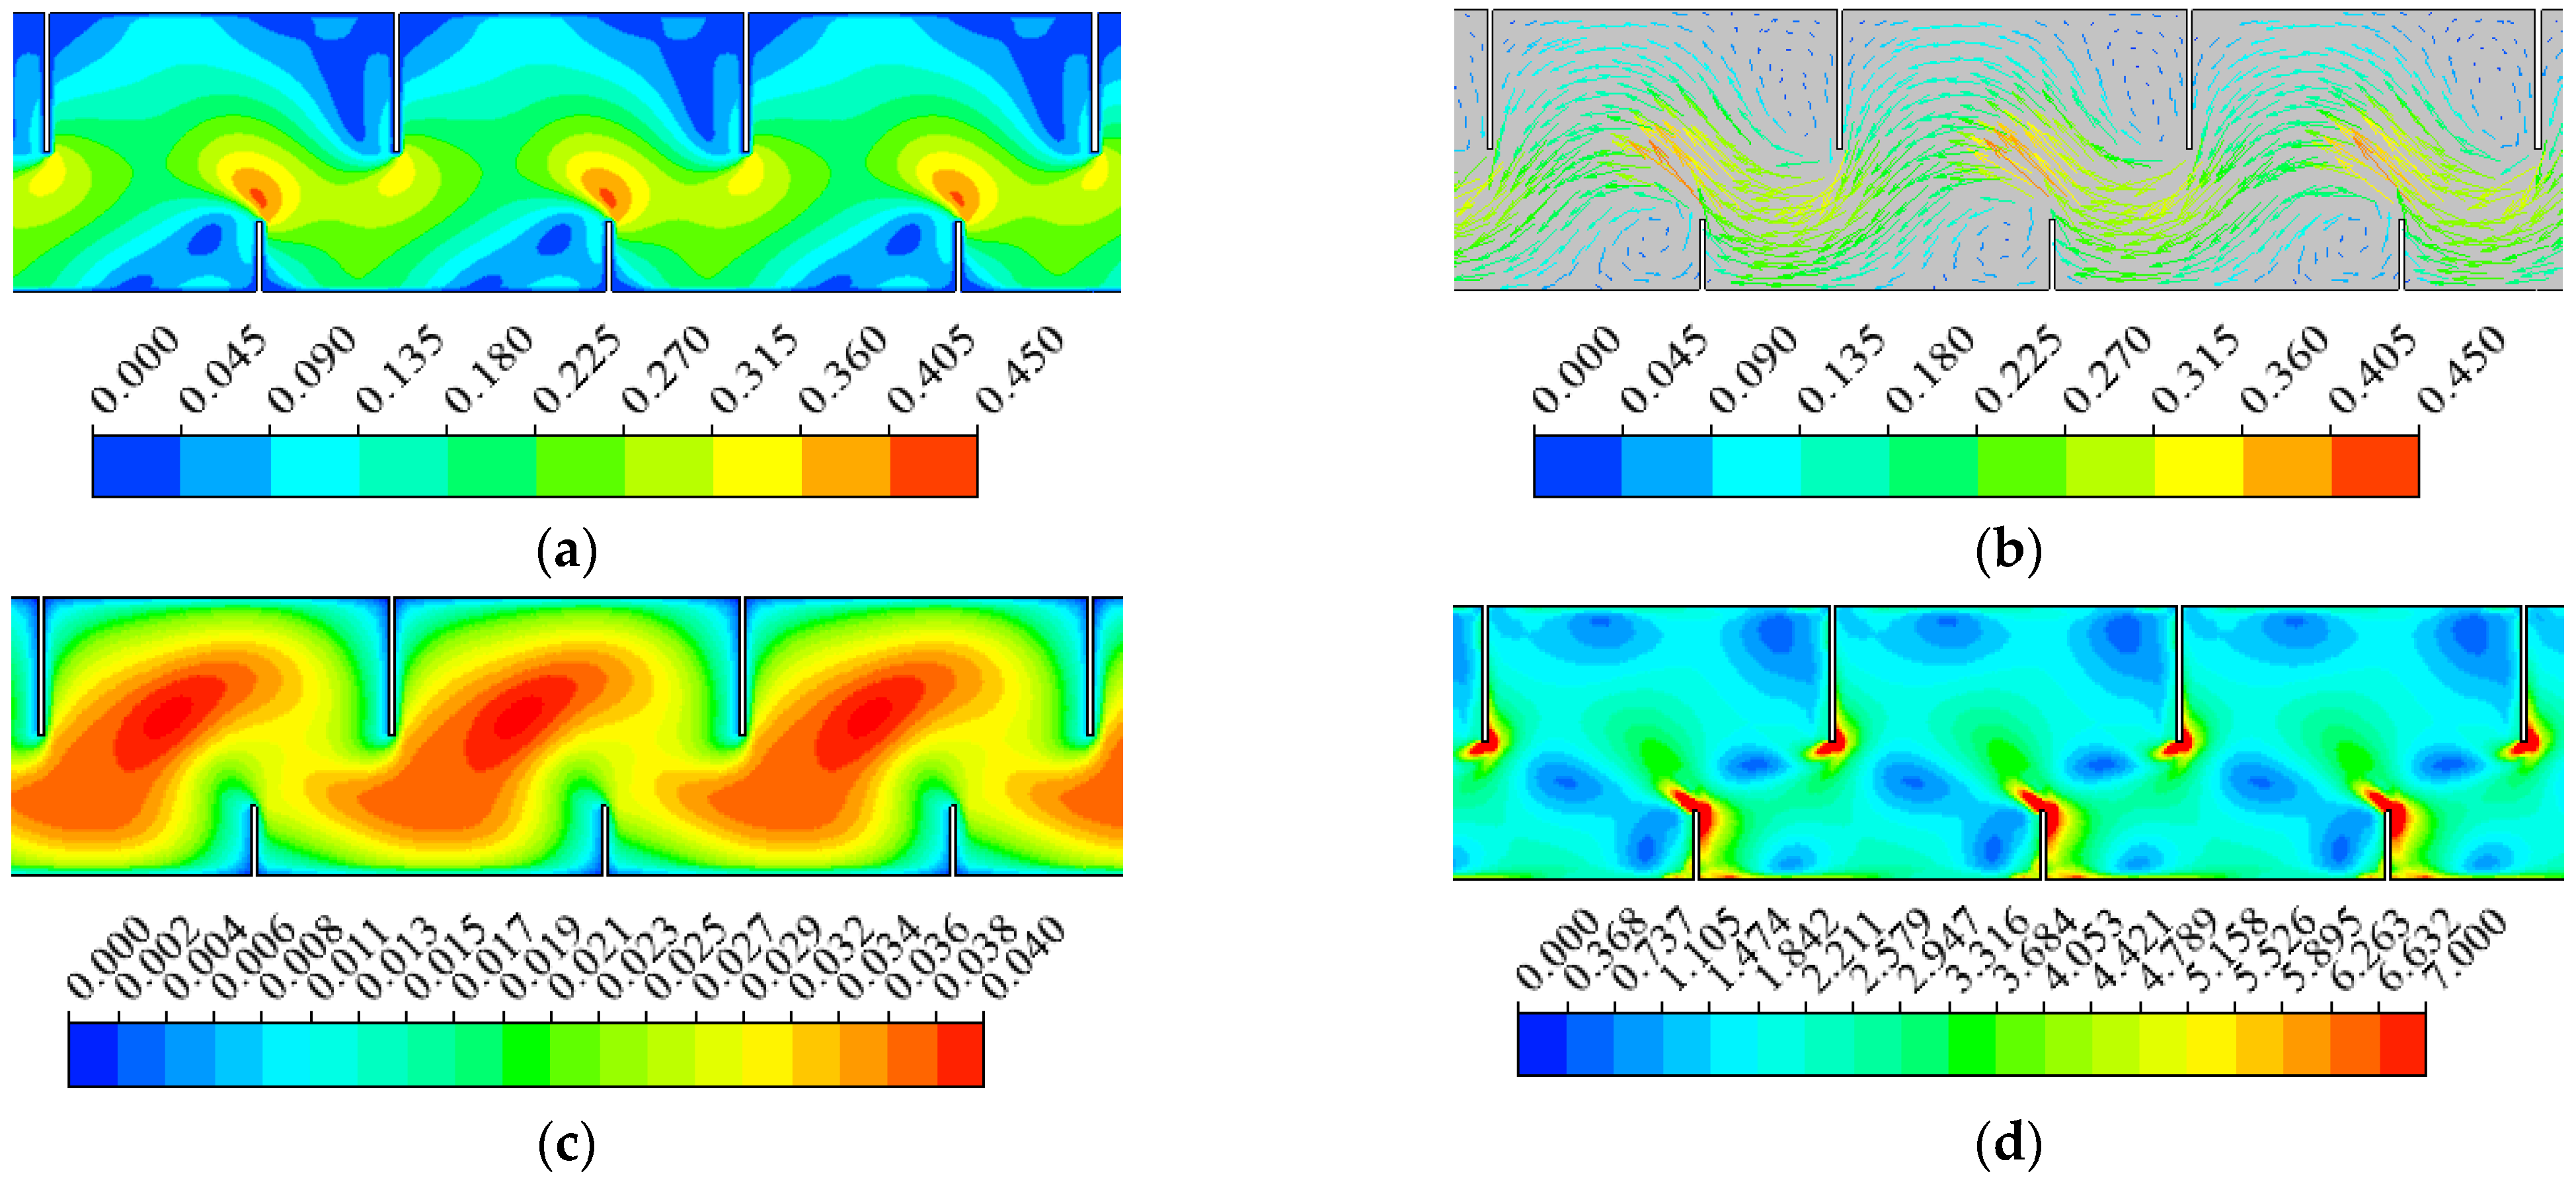
2.2. Hydraulics
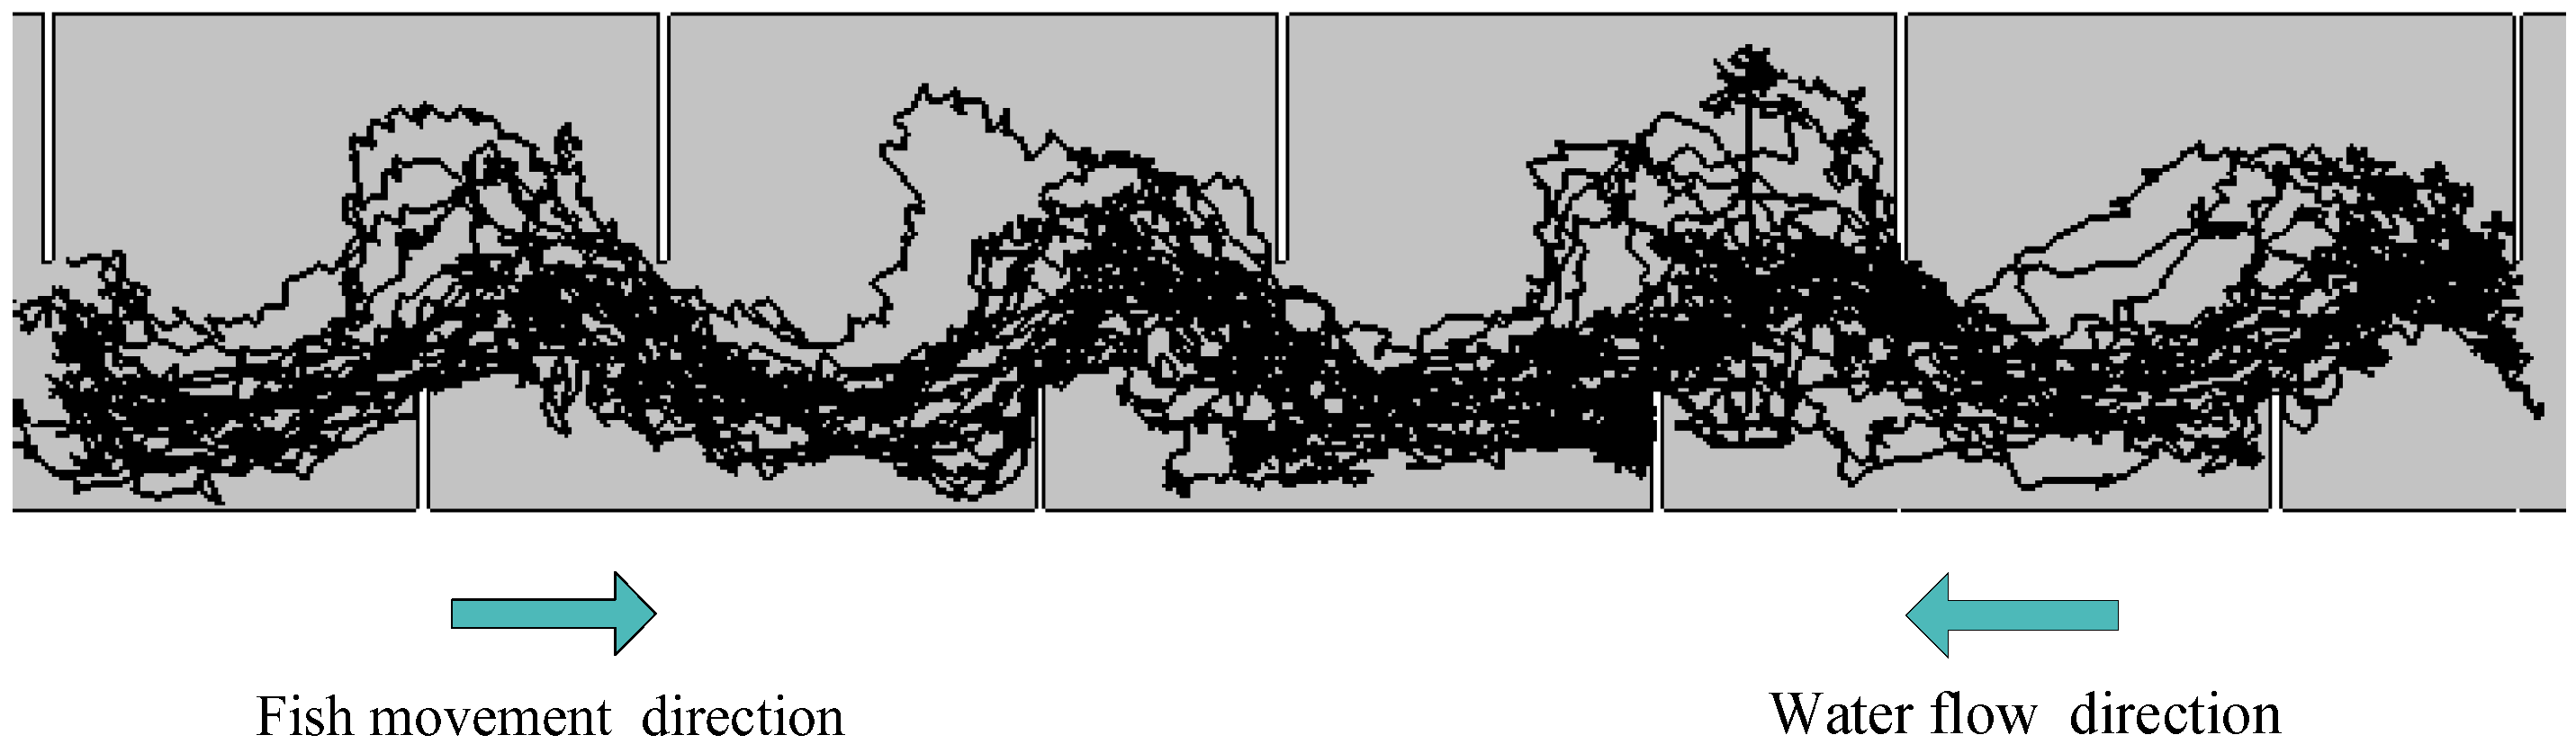
2.3. Fish and Fish Trajectories
2.4. Analysis of Fish Movement Using an IBM Approach
2.4.1. Hydrodynamic Model
2.4.2. Fish Movement Model
2.5. Data Analysis
3. Results
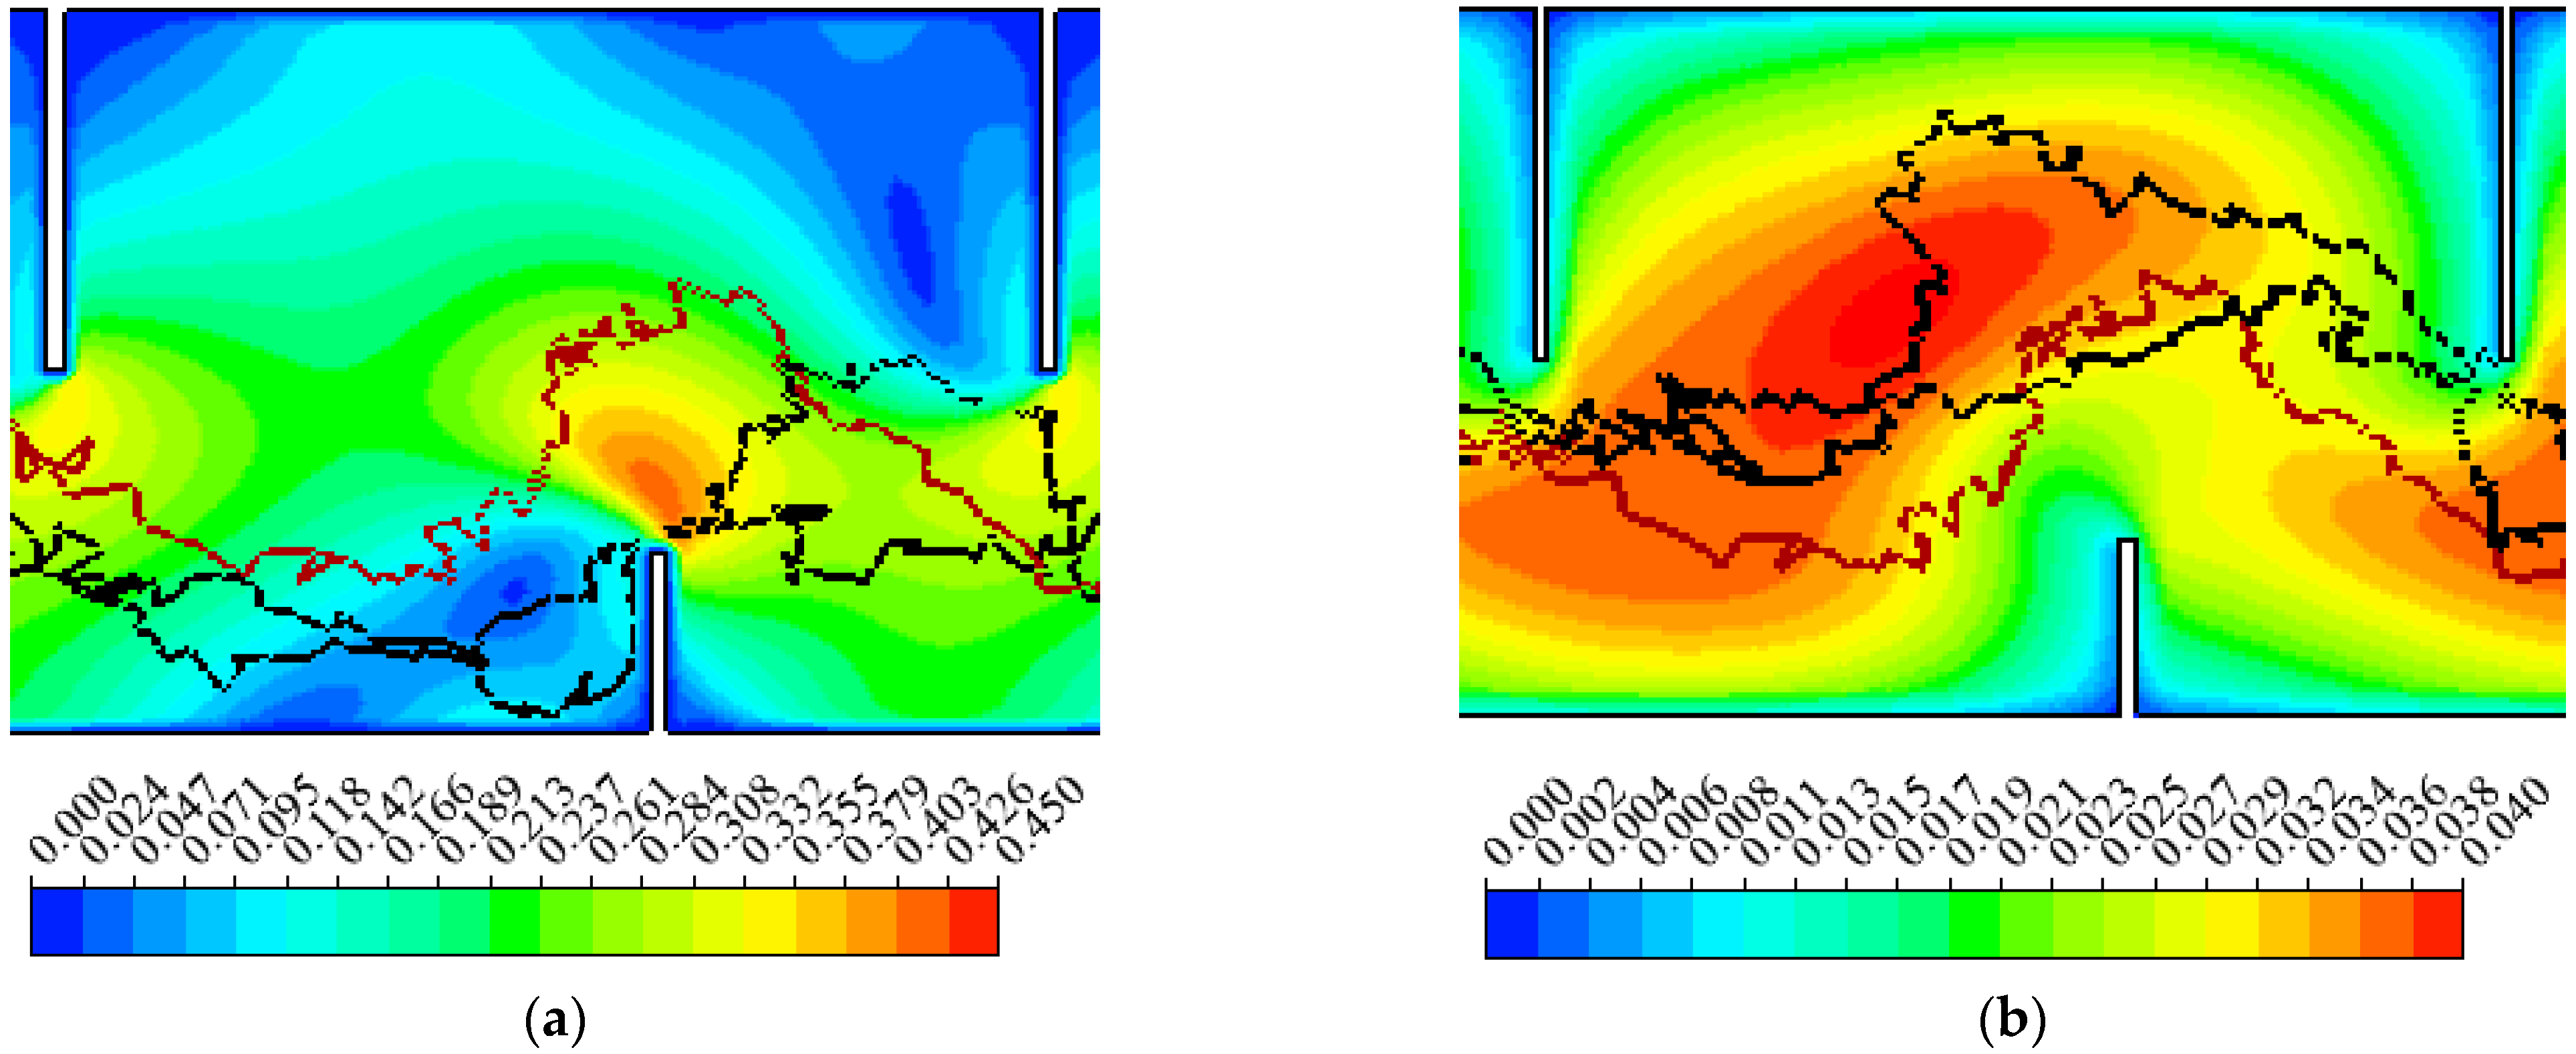
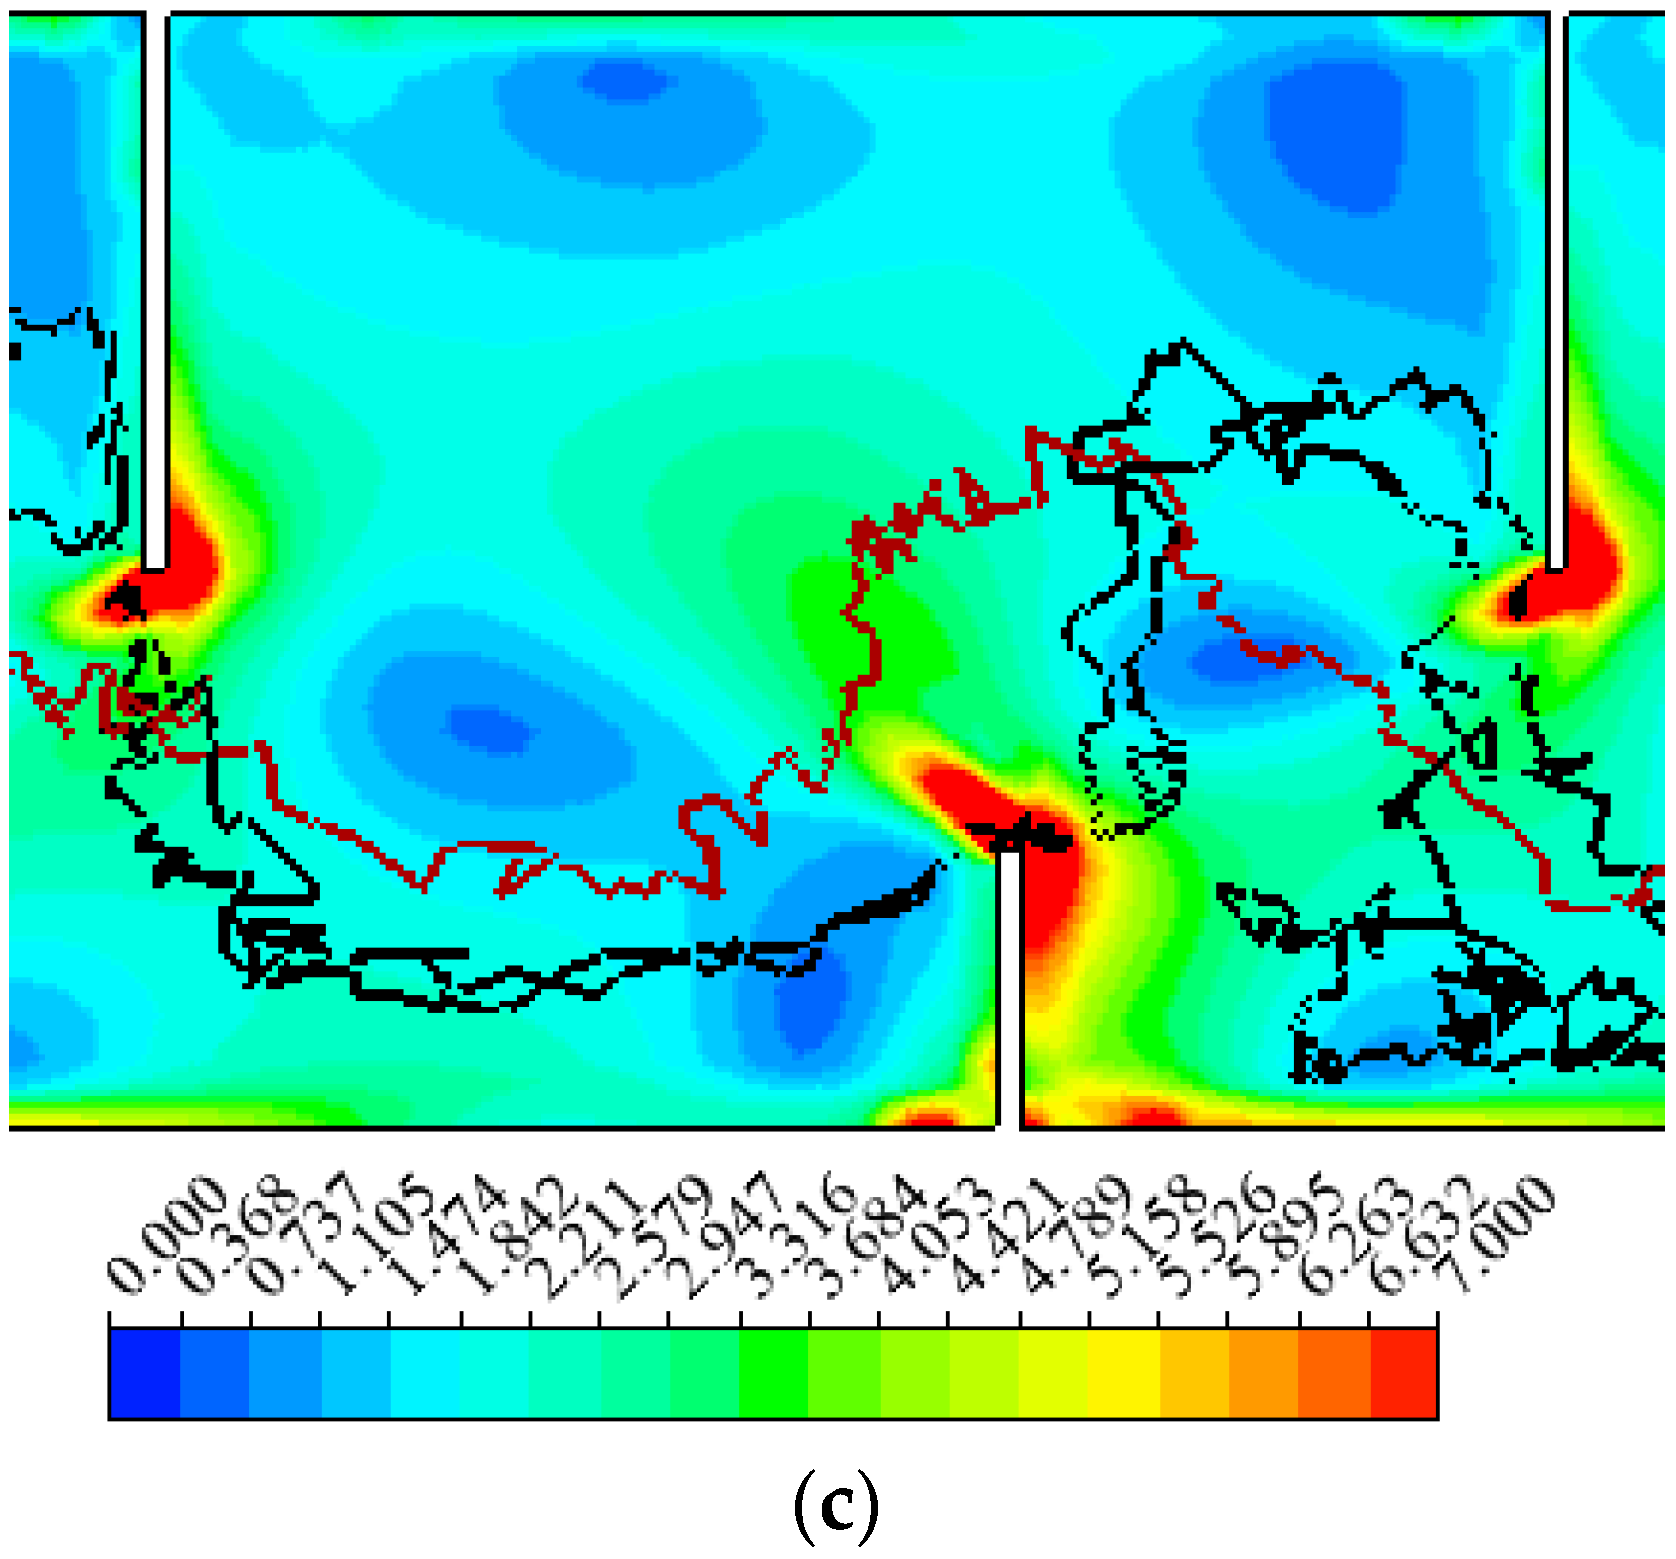
3.1. Hydraulics
3.2. Fish Movement Trajectories
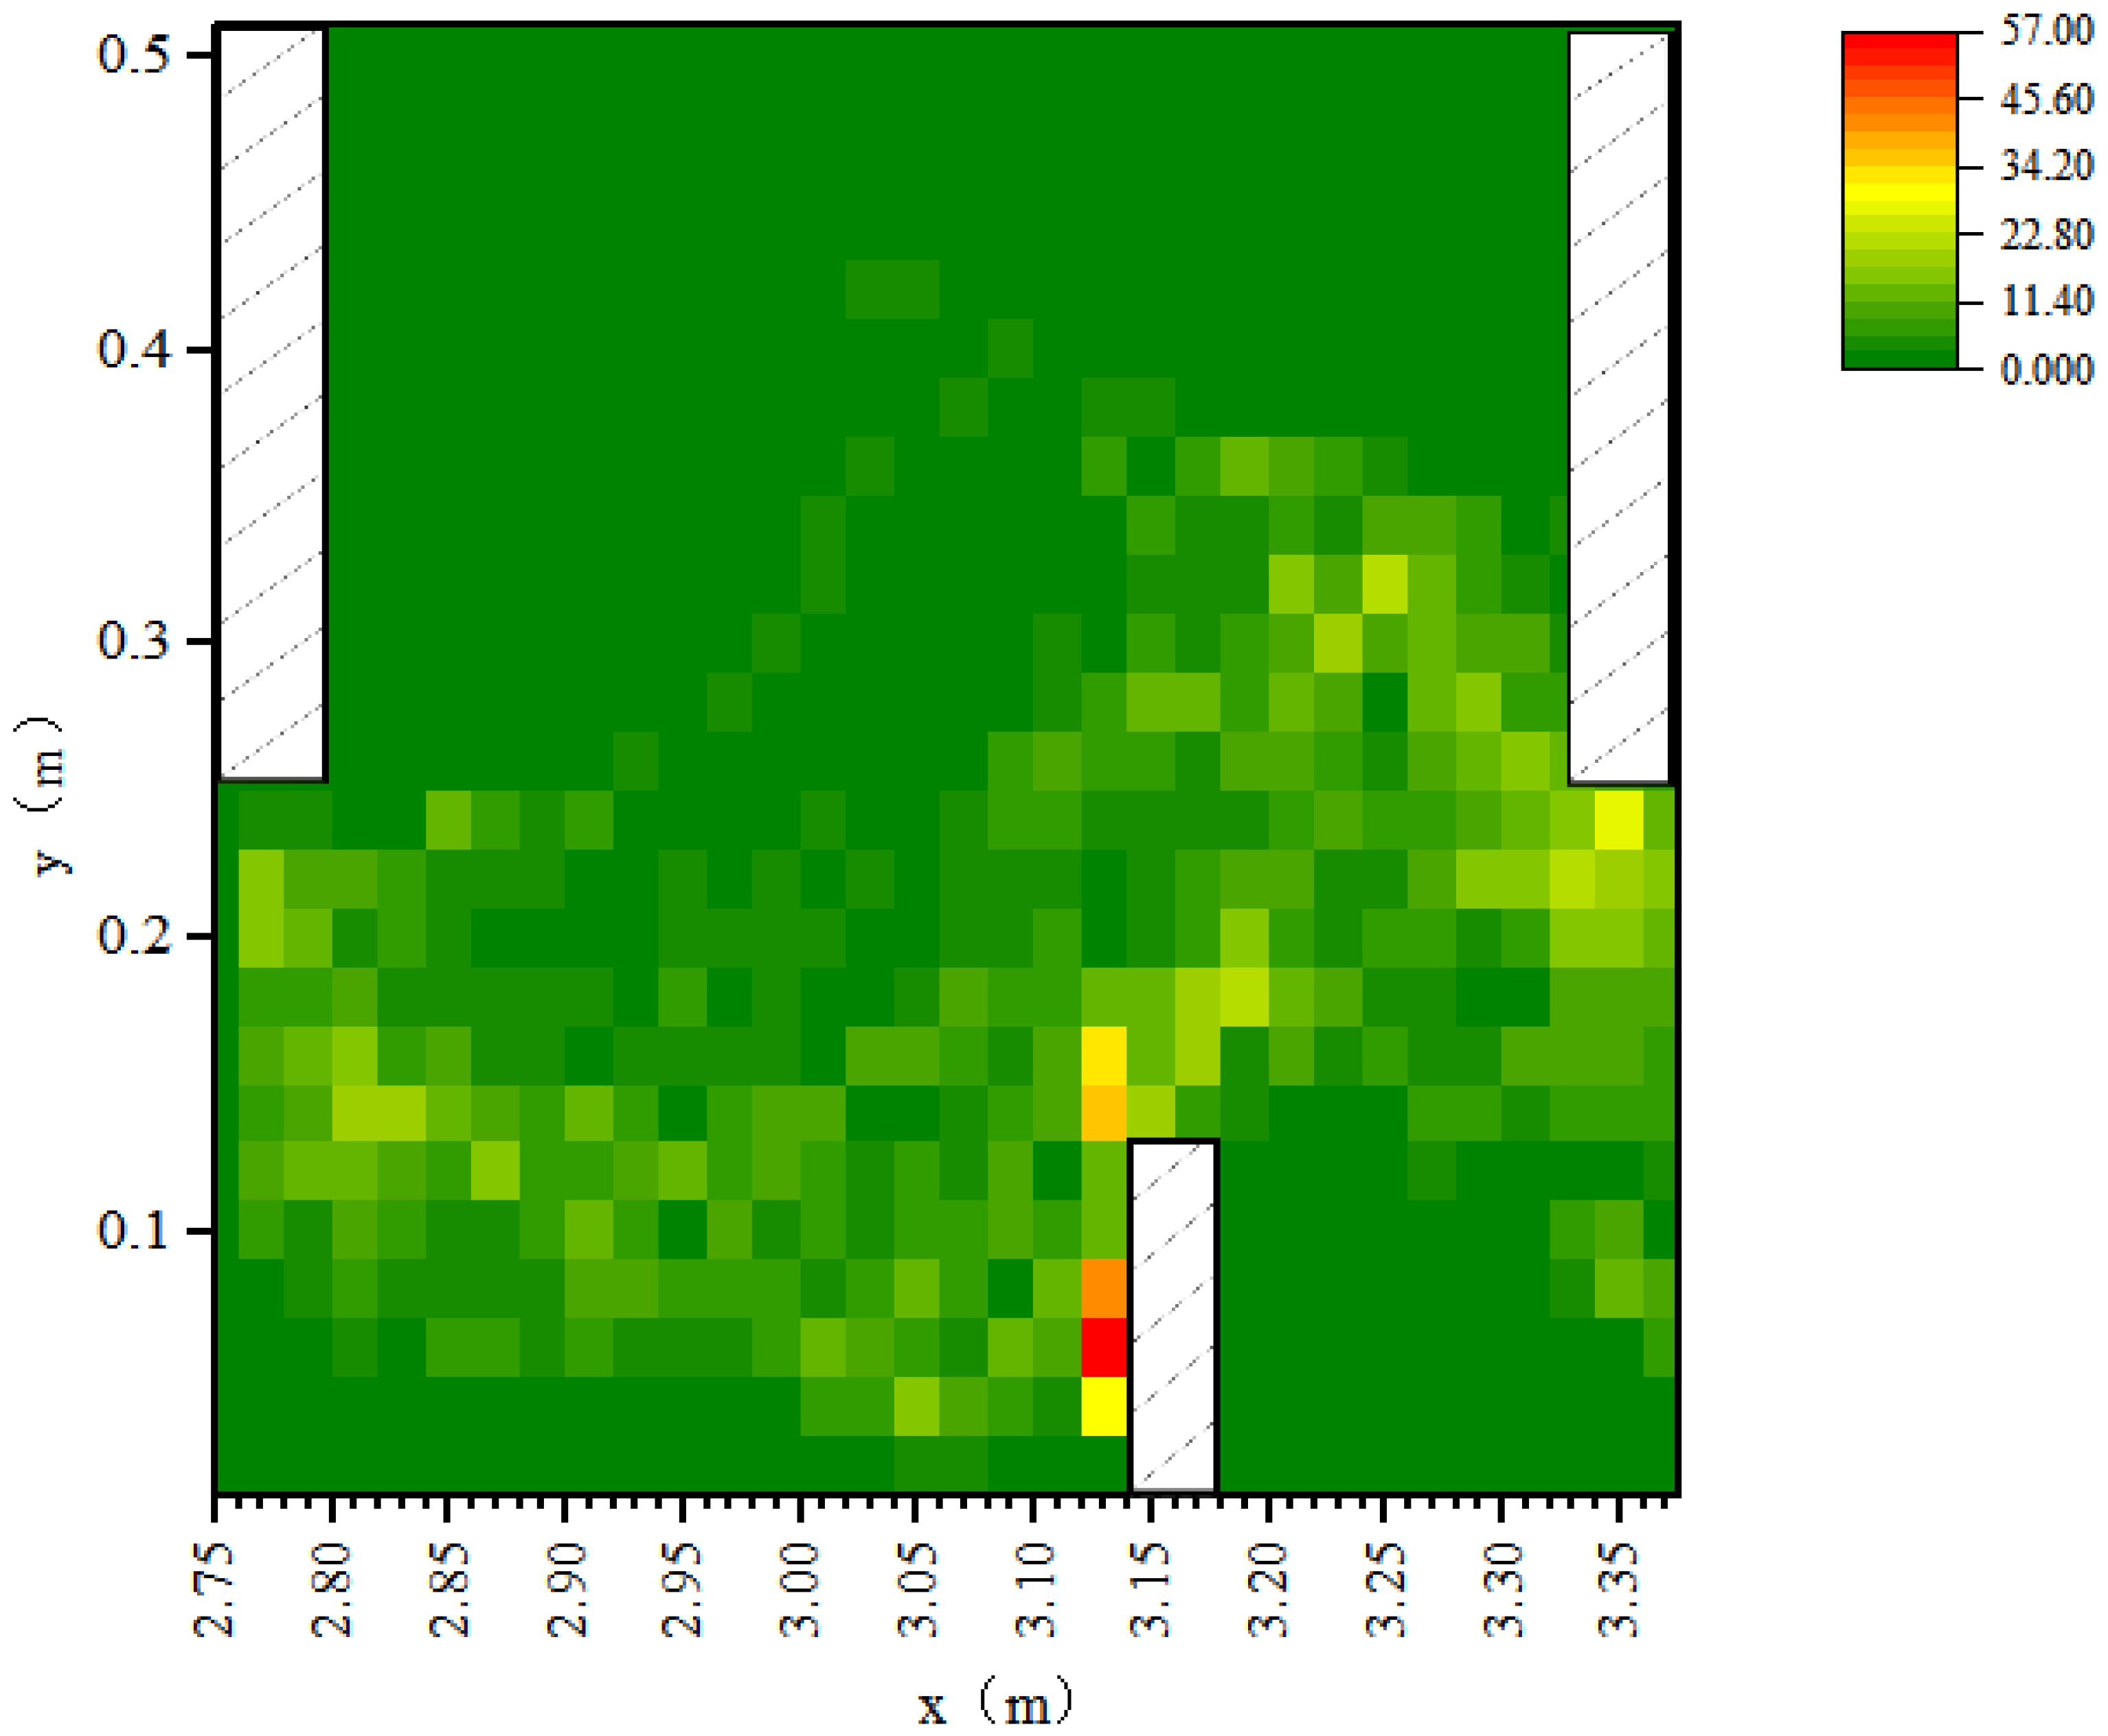
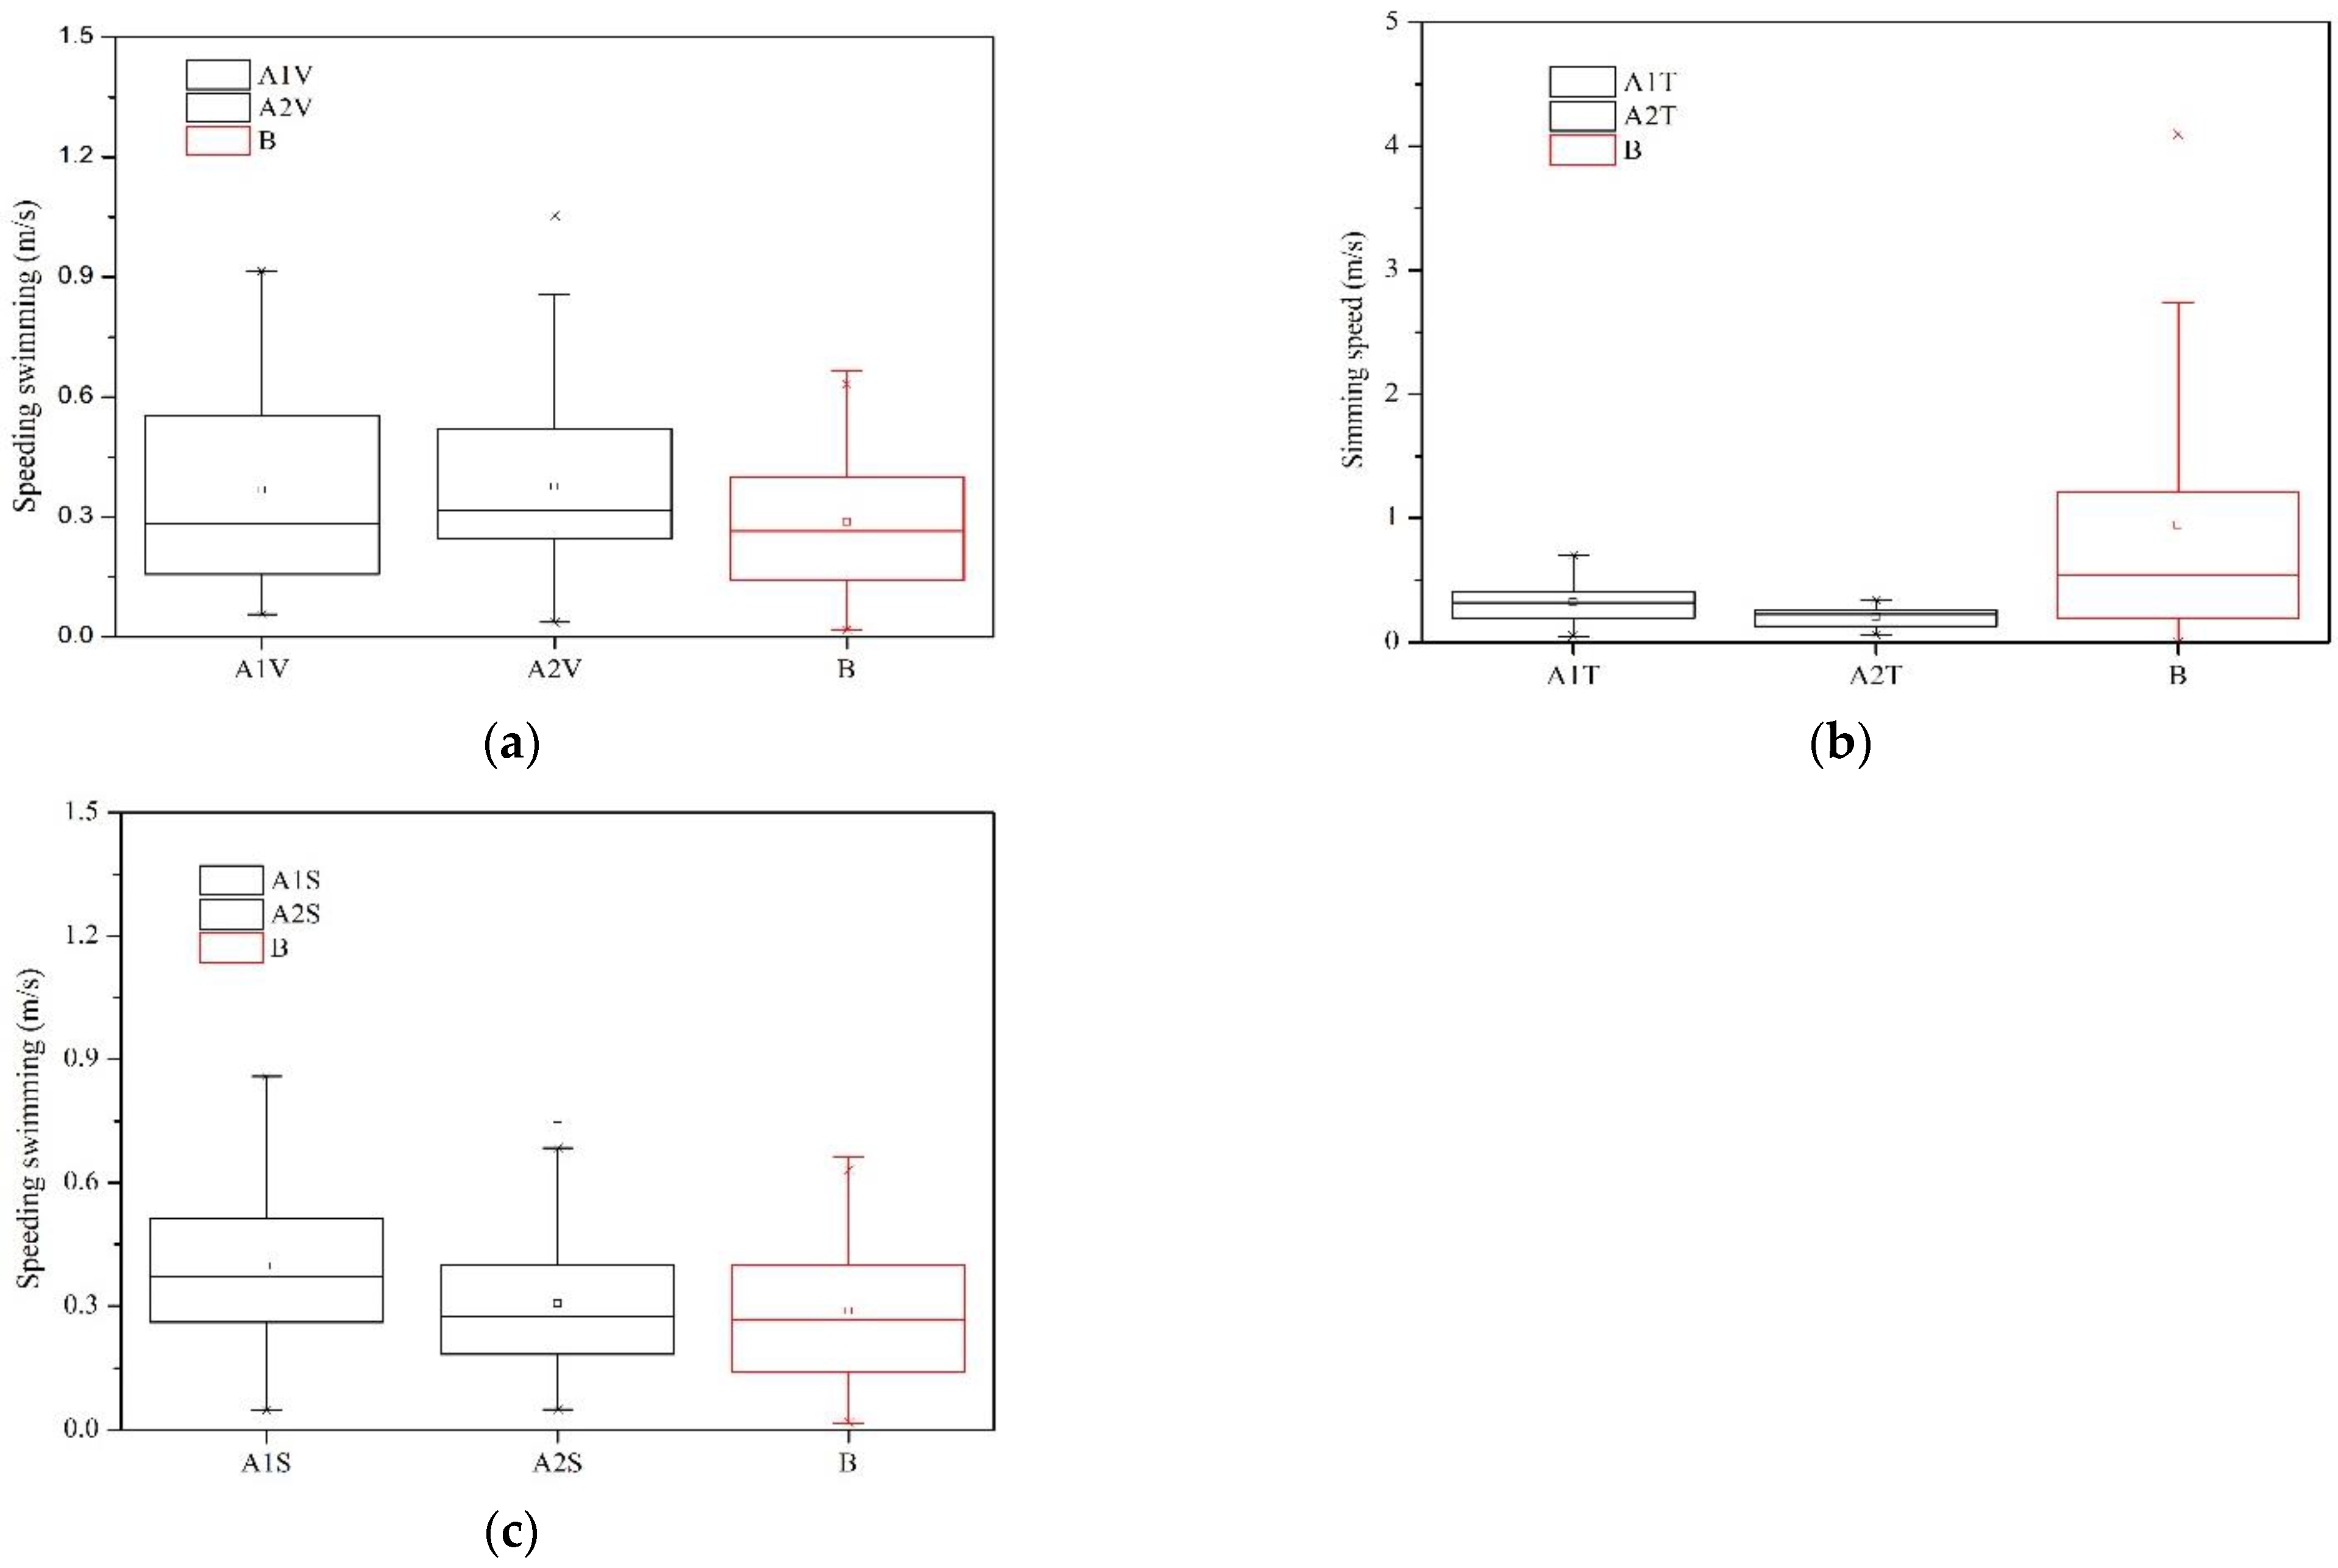
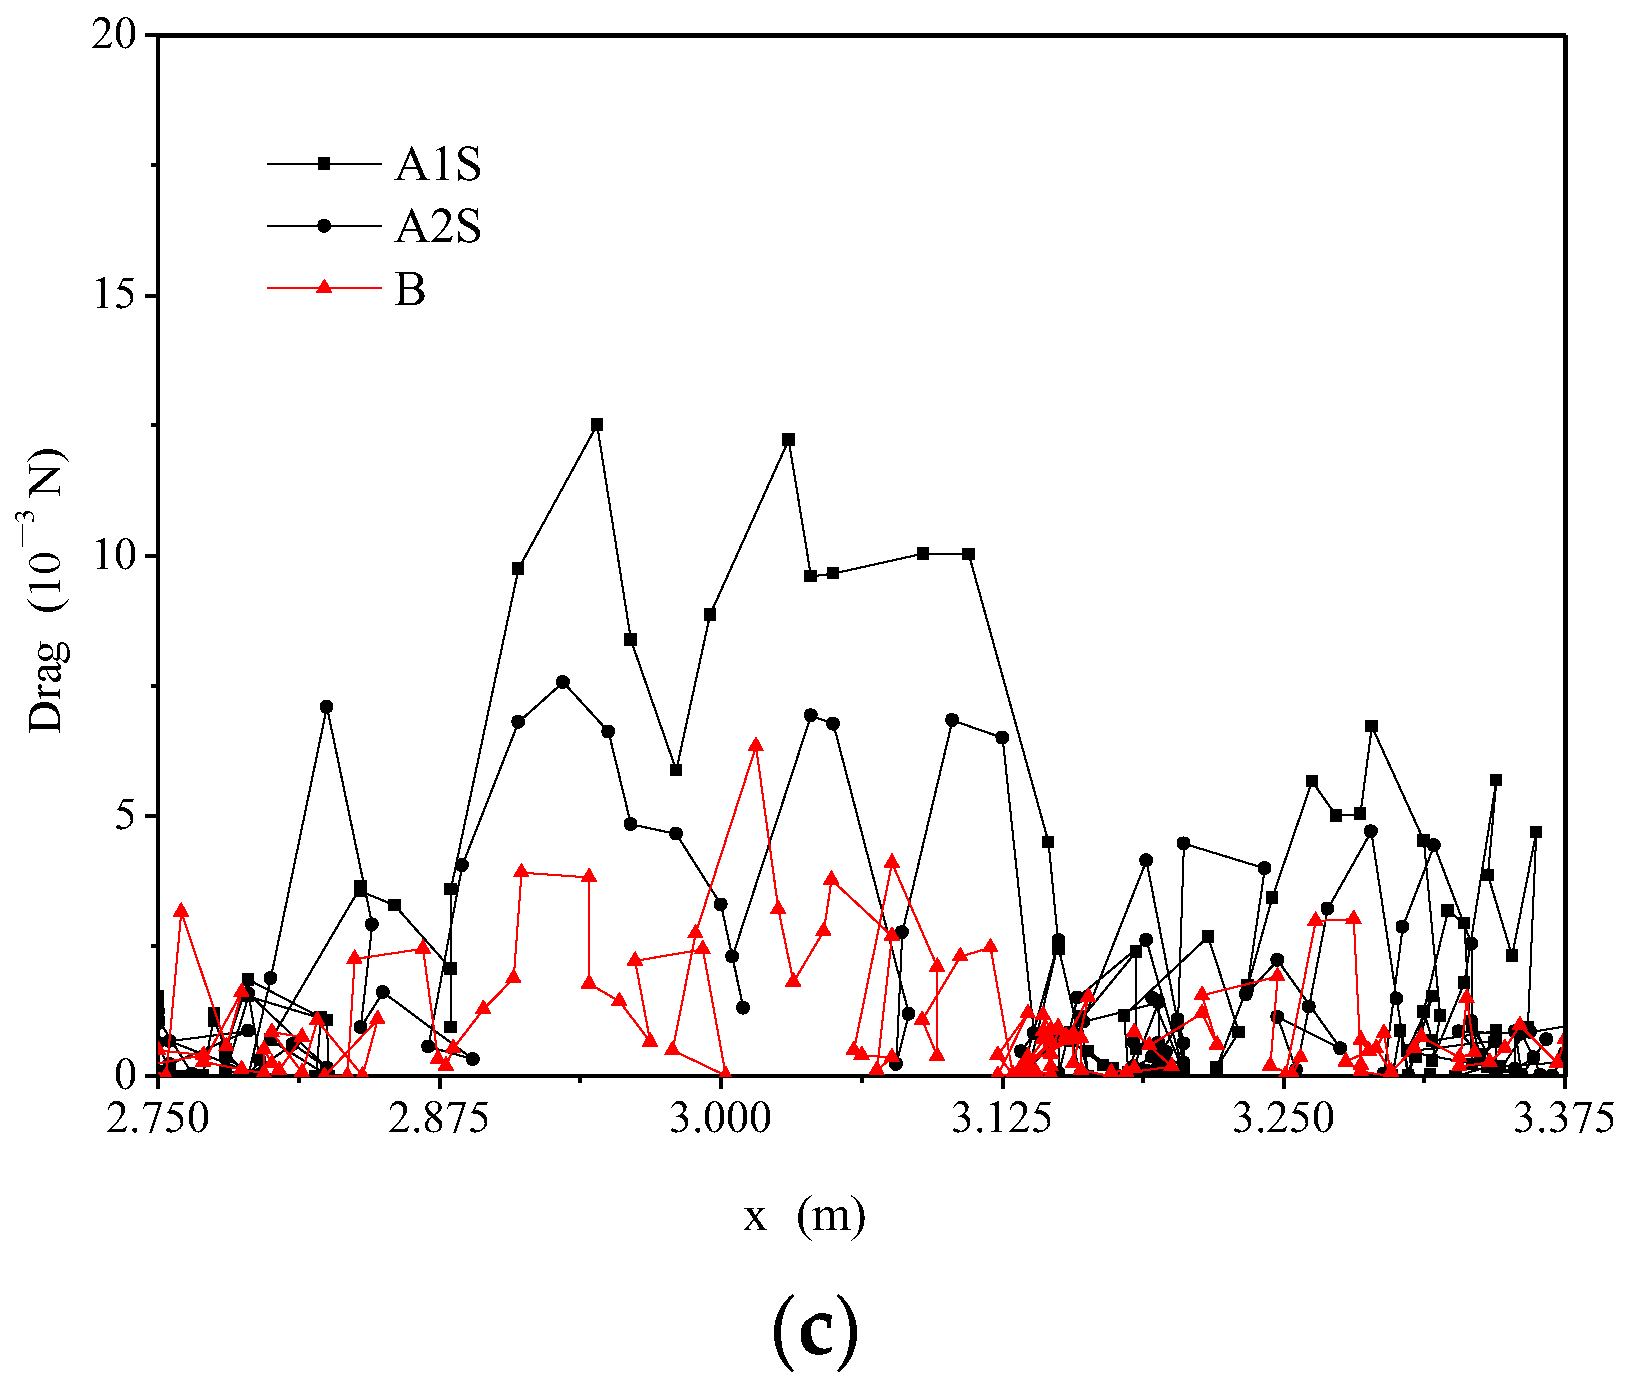
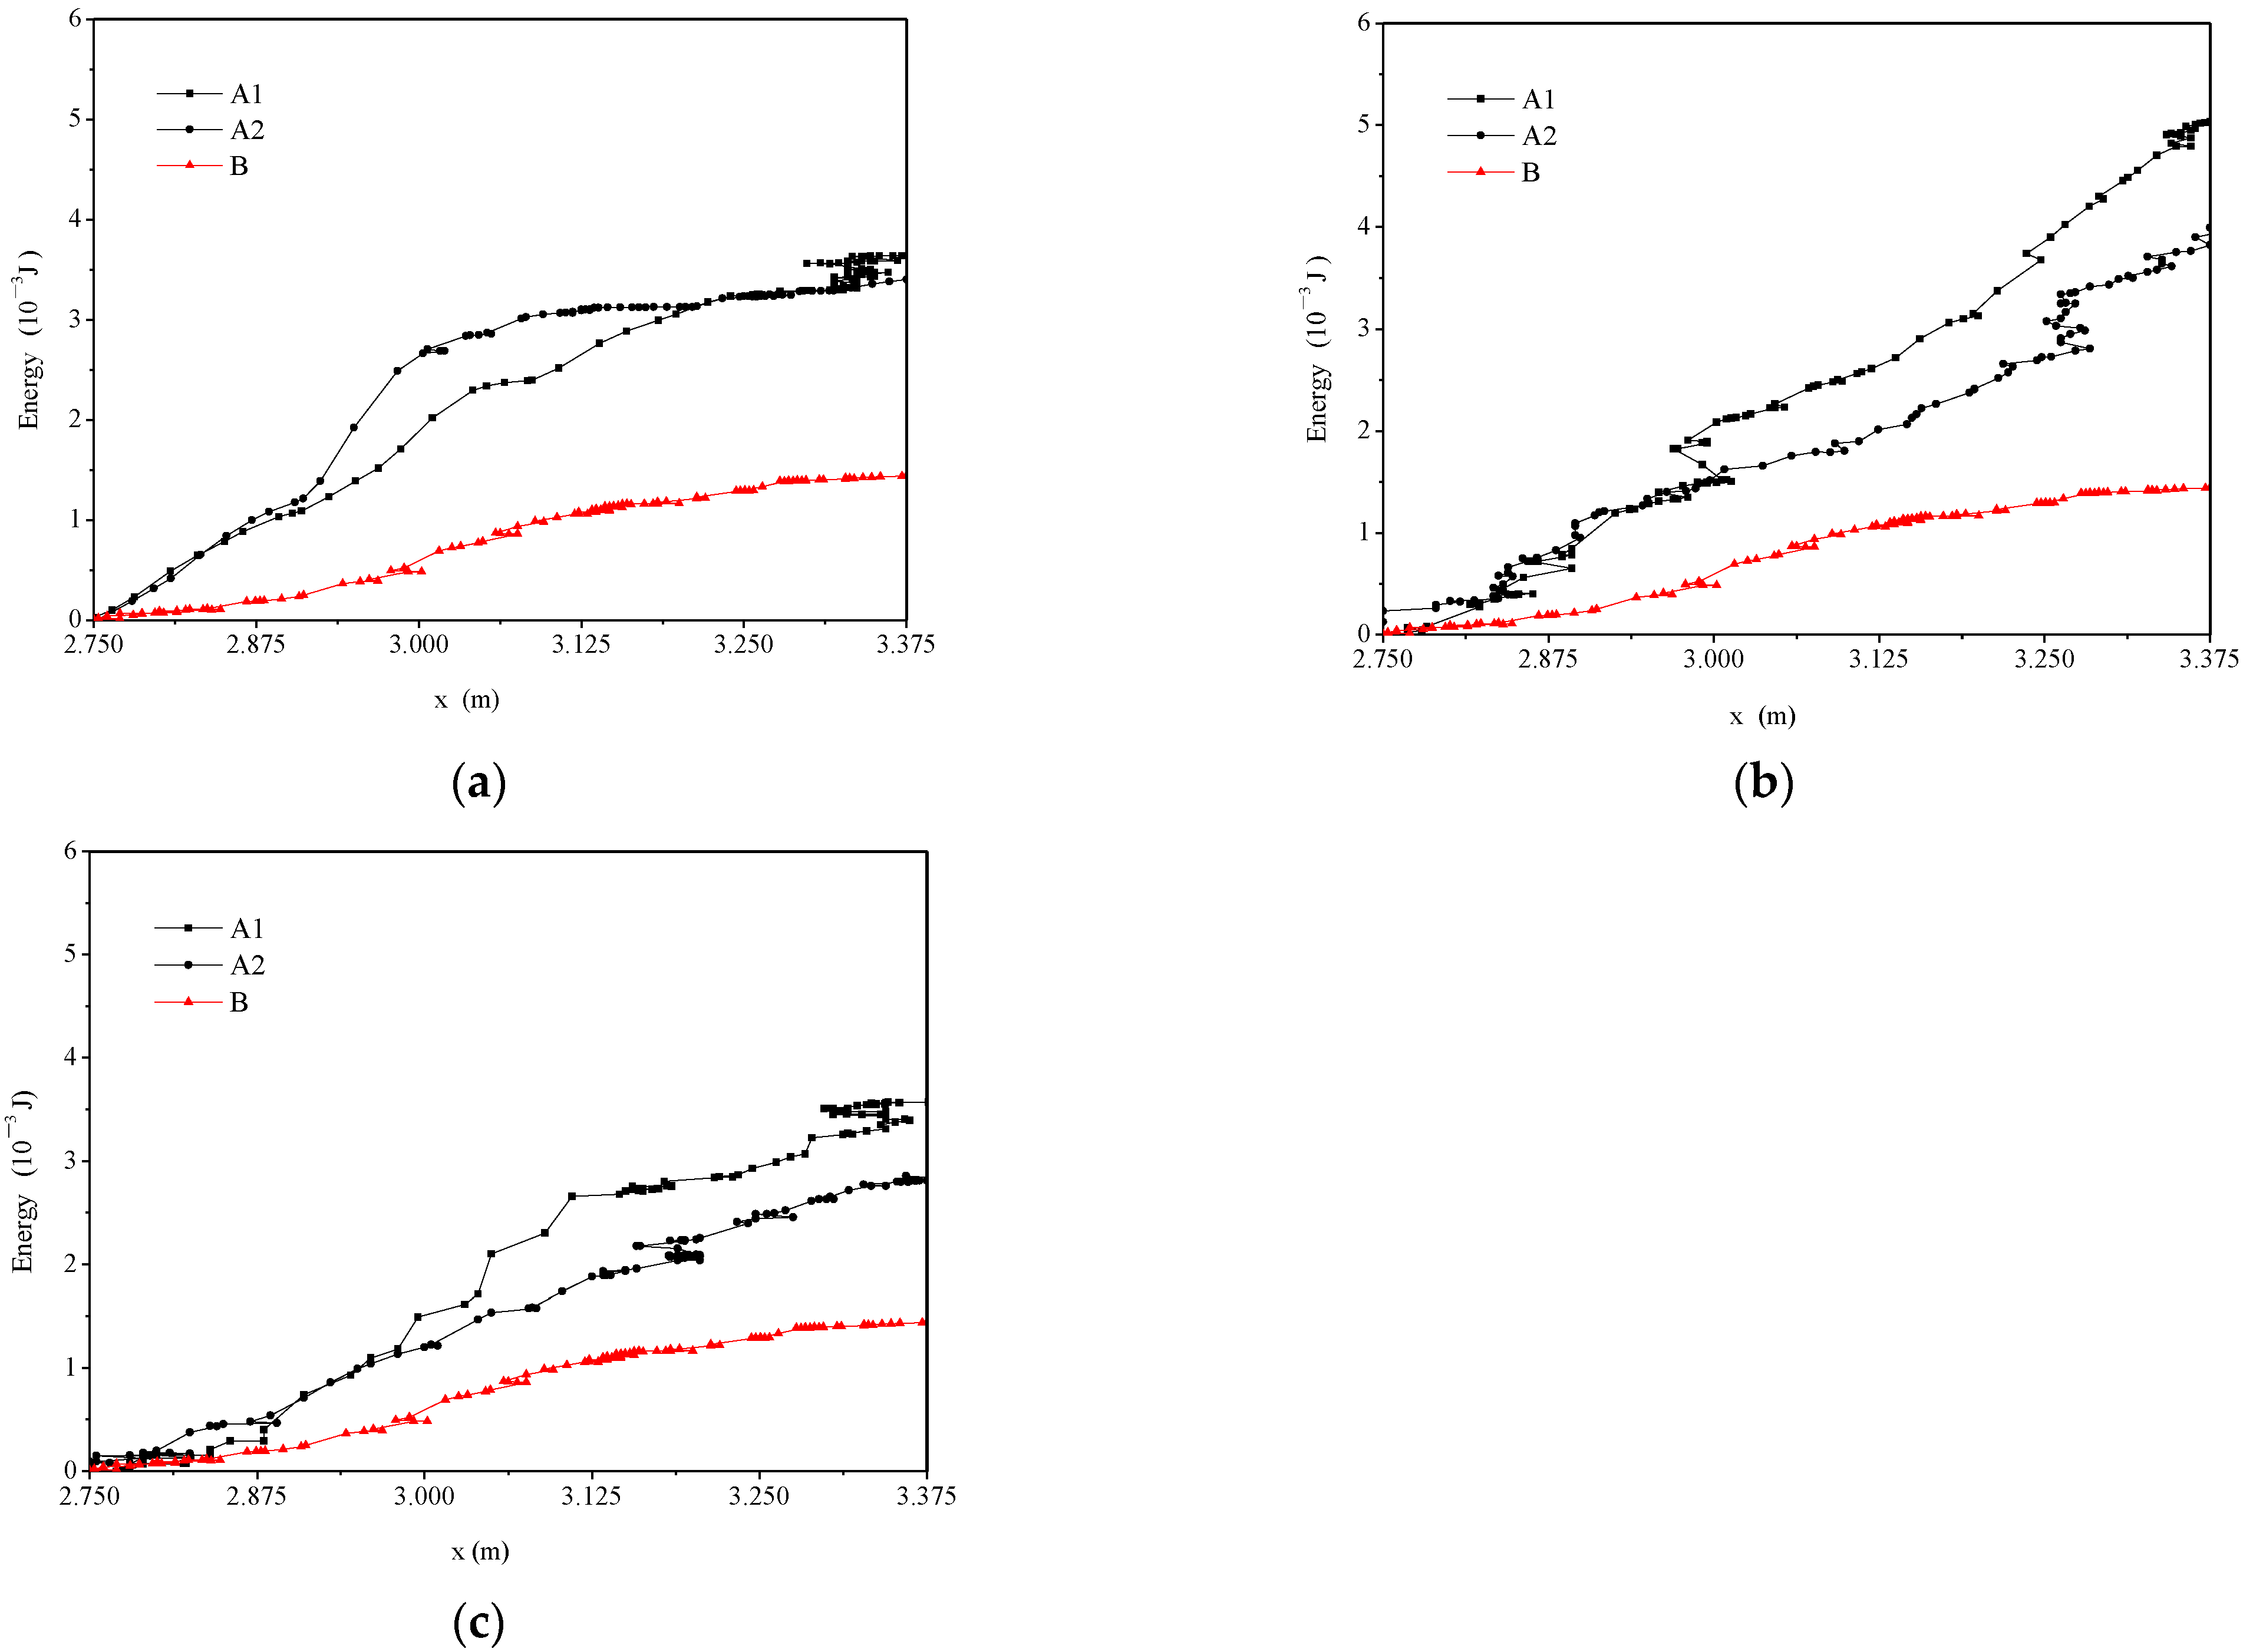
3.3. Fish Movement Energetic Expenditure
4. Discussion
4.1. The Effects of Hydraulics on Fish’s Energy Expenditure
4.2. The Fish Swimming Strategies
5. Conclusions
Author Contributions
Funding
Institutional Review Board Statement
Informed Consent Statement
Data Availability Statement
Conflicts of Interest
References
- Tonkin, Z.; Moloney, P.; Lyon, J.; Kitchingman, A.; Mahony, J.O.; Raymond, S.; Hackett, G.; Saddlier, S.; Greenfield, A.; Wood, D.; et al. Movement behavior of a threatened native fish informs flow management in a modified floodplain river system. Ecosphere 2022, 13, e3916. [Google Scholar] [CrossRef]
- Zhu, L.; Li, J.; Deng, Y.; Liao, B.; Liao, L.; An, R. Based on a biological particle model to predict the trace behavior of fish. W Sup. 2021, 21, 4044. [Google Scholar] [CrossRef]
- Katopodis, C.; Cai, L.; Johnson, D. Sturgeon survival: The role of swimming performance and fish passage research. Fish Res. 2019, 212, 162–171. [Google Scholar] [CrossRef]
- Tan, J.; Tan, H.; Goerig, E.; Ke, S.; Huang, H.; Liu, Z.; Shi, X. Optimization of fishway attraction flow based on endemic fish swimming performance and hydraulics. Ecol. Eng. 2021, 170, 106332. [Google Scholar] [CrossRef]
- Silva, A.T.; Katopodis, C.; Santos, J.M.; Ferreira, M.T.; Pinheiro, A.N. Cyprinid swimming behaviour in response to turbulent flow. Ecol. Eng. 2012, 44, 314–328. [Google Scholar] [CrossRef] [Green Version]
- Silva, A.T.; Santos, J.M.; Ferreira, M.T.; Pinheiro, A.N.; Katopodis, C. Effects of water velocity and turbulence on the behaviour of Iberian barbel (Luciobarbus bocagei, Steindachner 1864) in an experimental pool-type fishway. River Res. Appl. 2011, 27, 360–373. [Google Scholar] [CrossRef]
- Quaranta, E.; Katopodis, C.; Revelli, R.; Comoglio, C. Turbulent flow field comparison and related suitability for fish passage of a standard and a simplified low-gradient vertical slot fishway. River Res. Appl. 2017, 33, 1295–1305. [Google Scholar] [CrossRef]
- An, R.; Li, J.; Liang, R.; Tuo, Y. Three-dimensional simulation and experimental study for optimising a vertical slot fishway. J. Hydro-Environ. Res. 2016, 12, 119–129. [Google Scholar] [CrossRef]
- Tan, J.; Gao, Z.; Dai, H.; Yang, Z.; Shi, X. Effects of turbulence and velocity on the movement behaviour of bighead carp (Hypophthalmichthys nobilis) in an experimental vertical slot fishway. Ecol. Eng. 2019, 127, 363–374. [Google Scholar] [CrossRef]
- Dizabadi, S.; Azimi, A.H. Hydraulic and turbulence structure of triangular labyrinth weir-pool fishways. River Res. Appl. 2020, 36, 280–295. [Google Scholar] [CrossRef]
- Goodwin, R.A.; Nestler, J.M.; Anderson, J.J.; Weber, L.J.; Loucks, D.P. Forecasting 3-D fish movement behavior using a Eulerian-Lagrangian-agent method (ELAM). Ecol. Model. 2006, 192, 197–223. [Google Scholar] [CrossRef]
- Goodwin, R.A.; Politano, M.; Garvin, J.W.; Nestler, J.M.; Hay, D.; Anderson, J.J.; Weber, L.J.; Dimperio, E.; Smith, D.L.; Timko, M. Fish navigation of large damsemerges from their modulation of flow field experience. Proc. Natl. Acad. Sci. USA 2014, 111, 5277–5282. [Google Scholar] [CrossRef] [PubMed] [Green Version]
- Haefner, J.W.; Bowen, M.D. Physical-based model of fish movement in fish extraction facilities. Ecol. Model. 2002, 152, 227–245. [Google Scholar] [CrossRef]
- DeAngelis, D.L.; Gross, L.J. Individual-Based Models and Approaches in Ecology; Chapman & Hall: New York, NY, USA, 1992. [Google Scholar]
- Han, R.; Chen, Q.; Blanckaert, K.; Li, W.; Li, R. Fish (Spinibarbus Hollandi) dynamics in relation to changing hydrological conditions: Physical modelling, individual-based numerical modelling, and case study. Ecohydrology 2013, 6, 586–597. [Google Scholar] [CrossRef]
- Matthew, D.B. Advanced Studies of Fish Passage through Culverts: 1-D and 3-D Hydraulic Modeling of Velocity, Fish Energy Expenditure, and a New Barrier Assessment Method. Ph.D. Dissertation, Montana State University, Bozeman, MT, USA, 2004. [Google Scholar]
- Khan, L.A. A three-dimensional computational fluid dynamics (CFD) model analysis of free surface hydrodynamics and fish passage energetics in a vertical-slot fishway. N. Am. J. Fish Manag. 2006, 26, 255–267. [Google Scholar] [CrossRef]
- Arenas, A.; Politano, M.; Weber, L.; Timko, M. Analysis of movements and behavior of smolts swimming in hydropower reservoirs. Ecol. Eng. 2015, 312, 292–307. [Google Scholar] [CrossRef]
- Guiny, E.; Ervine, D.A.; Armstrong, J.D. Hydraulic and Biological Aspects of Fish Passes for Atlantic Salmon. J. Hyd. Eng. 2005, 131, 542–553. [Google Scholar] [CrossRef] [Green Version]
- Hu, M.; Hua, Q.; Zhou, H.; Wu, Z.; Wu, X. The effect of dams on the larval abundance and composition of four carp species in key river systems in China. Environ. Biol. Fish. 2015, 98, 1201–1205. [Google Scholar] [CrossRef] [Green Version]
- Castro-Santos, T.; Letcher, B.H. Modeling migratory energetic of Connecticut River American shad (Alosa sapidissma): Implications of the conservation of an iteroparous anadromous fish. Can. J. Fish Aquat. Sci. 2010, 67, 806–830. [Google Scholar] [CrossRef]
- Goodwin, R.A. Hydrodynamics and Juvenile Salmon Movement Behavior at Lower Granite Dam: Decoding the Relationship Using 3-D Space-Time (CEL Agent IBM) Simulation. Ph.D. Dissertation, Cornell University Ithaca, Ithaca, NY, USA, 2004. [Google Scholar]
- Tan, J.; Gao, Z.; Dai, H.; Shi, X. The correlation analysis between hydraulic characteristics of vertical slot fishway and fish movement characteristics. J. Hydraul. Eng. 2017, 48, 924–932. [Google Scholar] [CrossRef]
- Vogel, S. Life in Moving Fluids; Princeton University Press: Princeton, NJ, USA, 1994. [Google Scholar]
- Webb, P.W. Locomotion. In Physiological Ecology of Pacific Salmon; Groot, C., Margolis, W.C., Eds.; University of British Columbia Press: Vancouver, BC, Canada, 1995; pp. 71–99. [Google Scholar]
- Pettersson, L.B.; Brönmark, C. Energetic consequences of an inducible morphological defence in crucian carp. Oecologia 1999, 121, 12–18. [Google Scholar] [CrossRef]
- Webb, P.W. The swimming energetics of trout I. thrust and power output at cruising speeds. J. Exp. Biol. 1971, 55, 489–520. [Google Scholar] [CrossRef] [PubMed]
- Standen, E.M.; Hinch, S.G.; Healey, M.C.; Parrell, A.P. Energetic costs of migration through the Fraser River Canyon, British Columbia, in adult pink (Oncorhynchus garbuscha) and sockeye (Oncorhynchus nerka) salmon as assessed by EGM telemetry. Can. J. Fish Aquat. Sci. 2002, 59, 1808–1818. [Google Scholar] [CrossRef]
- Beauchamp, D.A.; Stewart, D.J.; Thomas, G.L. Corroboration of a bioenergetics model for sockeye salmon. T. Am. Fish Soc. 1989, 118, 597–607. [Google Scholar] [CrossRef]
- Enders, E.C.; Boisclair, D.; Roy, A.G. A model of total swimming costs in turbulent flow for juvenile Atlantic salmon (Salmo salar). Can. J. Fish Aquat. Sci. 2005, 62, 1079–1089. [Google Scholar] [CrossRef] [Green Version]
- Liao, J.C. A review of fish swimming mechanics and behavior in altered flows. Phil. Trans. R. Soc. B 2007, 362, 1973–1993. [Google Scholar] [CrossRef] [Green Version]
- Tang, J.; Wardle, C.S. Power output of two sizes of Atlantic Salmon (Salmo Salar) at their maximum sustained swimming speeds. J. Exp. Biol. 1992, 166, 33–46. [Google Scholar] [CrossRef]


| (a) | ||||
| Q(L/s) | H(m) | Slope (%) | Length of Pool (m) | Width of Pool (m) |
| 13.5 | 0.3 | 1 | 0.625 | 0.5 |
| (b) | ||||
| Fish | N | Total Length (cm) | Weight (g) | |
| bighead carp | 54 | 11.41 ± 0.69 | 21.26 ± 3.63 | |
| Index | Different Hydraulic Conditions | p Value |
|---|---|---|
| Swimming speed | TKE and V | p < 0.05 |
| TKE and SR | p < 0.05 | |
| SR and V | p > 0.05 |
| Trajectories | Length of Trajectories (m) | Movement Time (s) | The Maximum Swimming Speed M (m/s) | The Average Swimming Speed (m/s) | The Average Drag (10−3 N) | The Maximum Drag Force (10−3 N) | The Cumulative Energy Consumption (10−3 J) |
|---|---|---|---|---|---|---|---|
| (a) | |||||||
| A1 (Black line) | 1.042 | 3.4 | 0.887 | 0.368 | 2.263 | 12.771 | 3.639 |
| A2 (Black line) | 0.842 | 3.28 | 1.054 | 0.375 | 2.295 | 20.675 | 3.403 |
| B (Red line) | 1.176 | 4.76 | 0.664 | 0.288 | 0.944 | 6.336 | 1.44 |
| (b) | |||||||
| A1 (Black line) | 1.426 | 3.8 | 0.645 | 0.259 | 0.603 | 6.011 | 3.993 |
| A2 (Black line) | 1.159 | 4.72 | 0.719 | 0.323 | 1.449 | 8.851 | 5.03 |
| B (Red line) | 1.176 | 4.76 | 0.664 | 0.288 | 0.944 | 6.336 | 1.44 |
| (c) | |||||||
| A1 (Black line) | 1.195 | 3.76 | 0.859 | 0.398 | 2.255 | 12.51 | 3.571 |
| A2 (Black line) | 1.516 | 4.8 | 0.684 | 0.301 | 1.429 | 7.563 | 2.857 |
| B (Red line) | 1.176 | 4.76 | 0.664 | 0.288 | 0.944 | 6.336 | 1.44 |
Publisher’s Note: MDPI stays neutral with regard to jurisdictional claims in published maps and institutional affiliations. |
© 2022 by the authors. Licensee MDPI, Basel, Switzerland. This article is an open access article distributed under the terms and conditions of the Creative Commons Attribution (CC BY) license (https://creativecommons.org/licenses/by/4.0/).
Share and Cite
Tan, J.; Liu, Z.; Wang, Y.; Wang, Y.; Ke, S.; Shi, X. Analysis of Movements and Behavior of Bighead Carps (Hypophthalmichthys nobilis) Considering Fish Passage Energetics in an Experimental Vertical Slot Fishway. Animals 2022, 12, 1725. https://0-doi-org.brum.beds.ac.uk/10.3390/ani12131725
Tan J, Liu Z, Wang Y, Wang Y, Ke S, Shi X. Analysis of Movements and Behavior of Bighead Carps (Hypophthalmichthys nobilis) Considering Fish Passage Energetics in an Experimental Vertical Slot Fishway. Animals. 2022; 12(13):1725. https://0-doi-org.brum.beds.ac.uk/10.3390/ani12131725
Chicago/Turabian StyleTan, Junjun, Zhenbiao Liu, Yu Wang, Yuanyang Wang, Senfan Ke, and Xiaotao Shi. 2022. "Analysis of Movements and Behavior of Bighead Carps (Hypophthalmichthys nobilis) Considering Fish Passage Energetics in an Experimental Vertical Slot Fishway" Animals 12, no. 13: 1725. https://0-doi-org.brum.beds.ac.uk/10.3390/ani12131725