
Similarity in Temporal Movement Patterns in Laying Hens Increases with Time and Social Association

 , , , , and
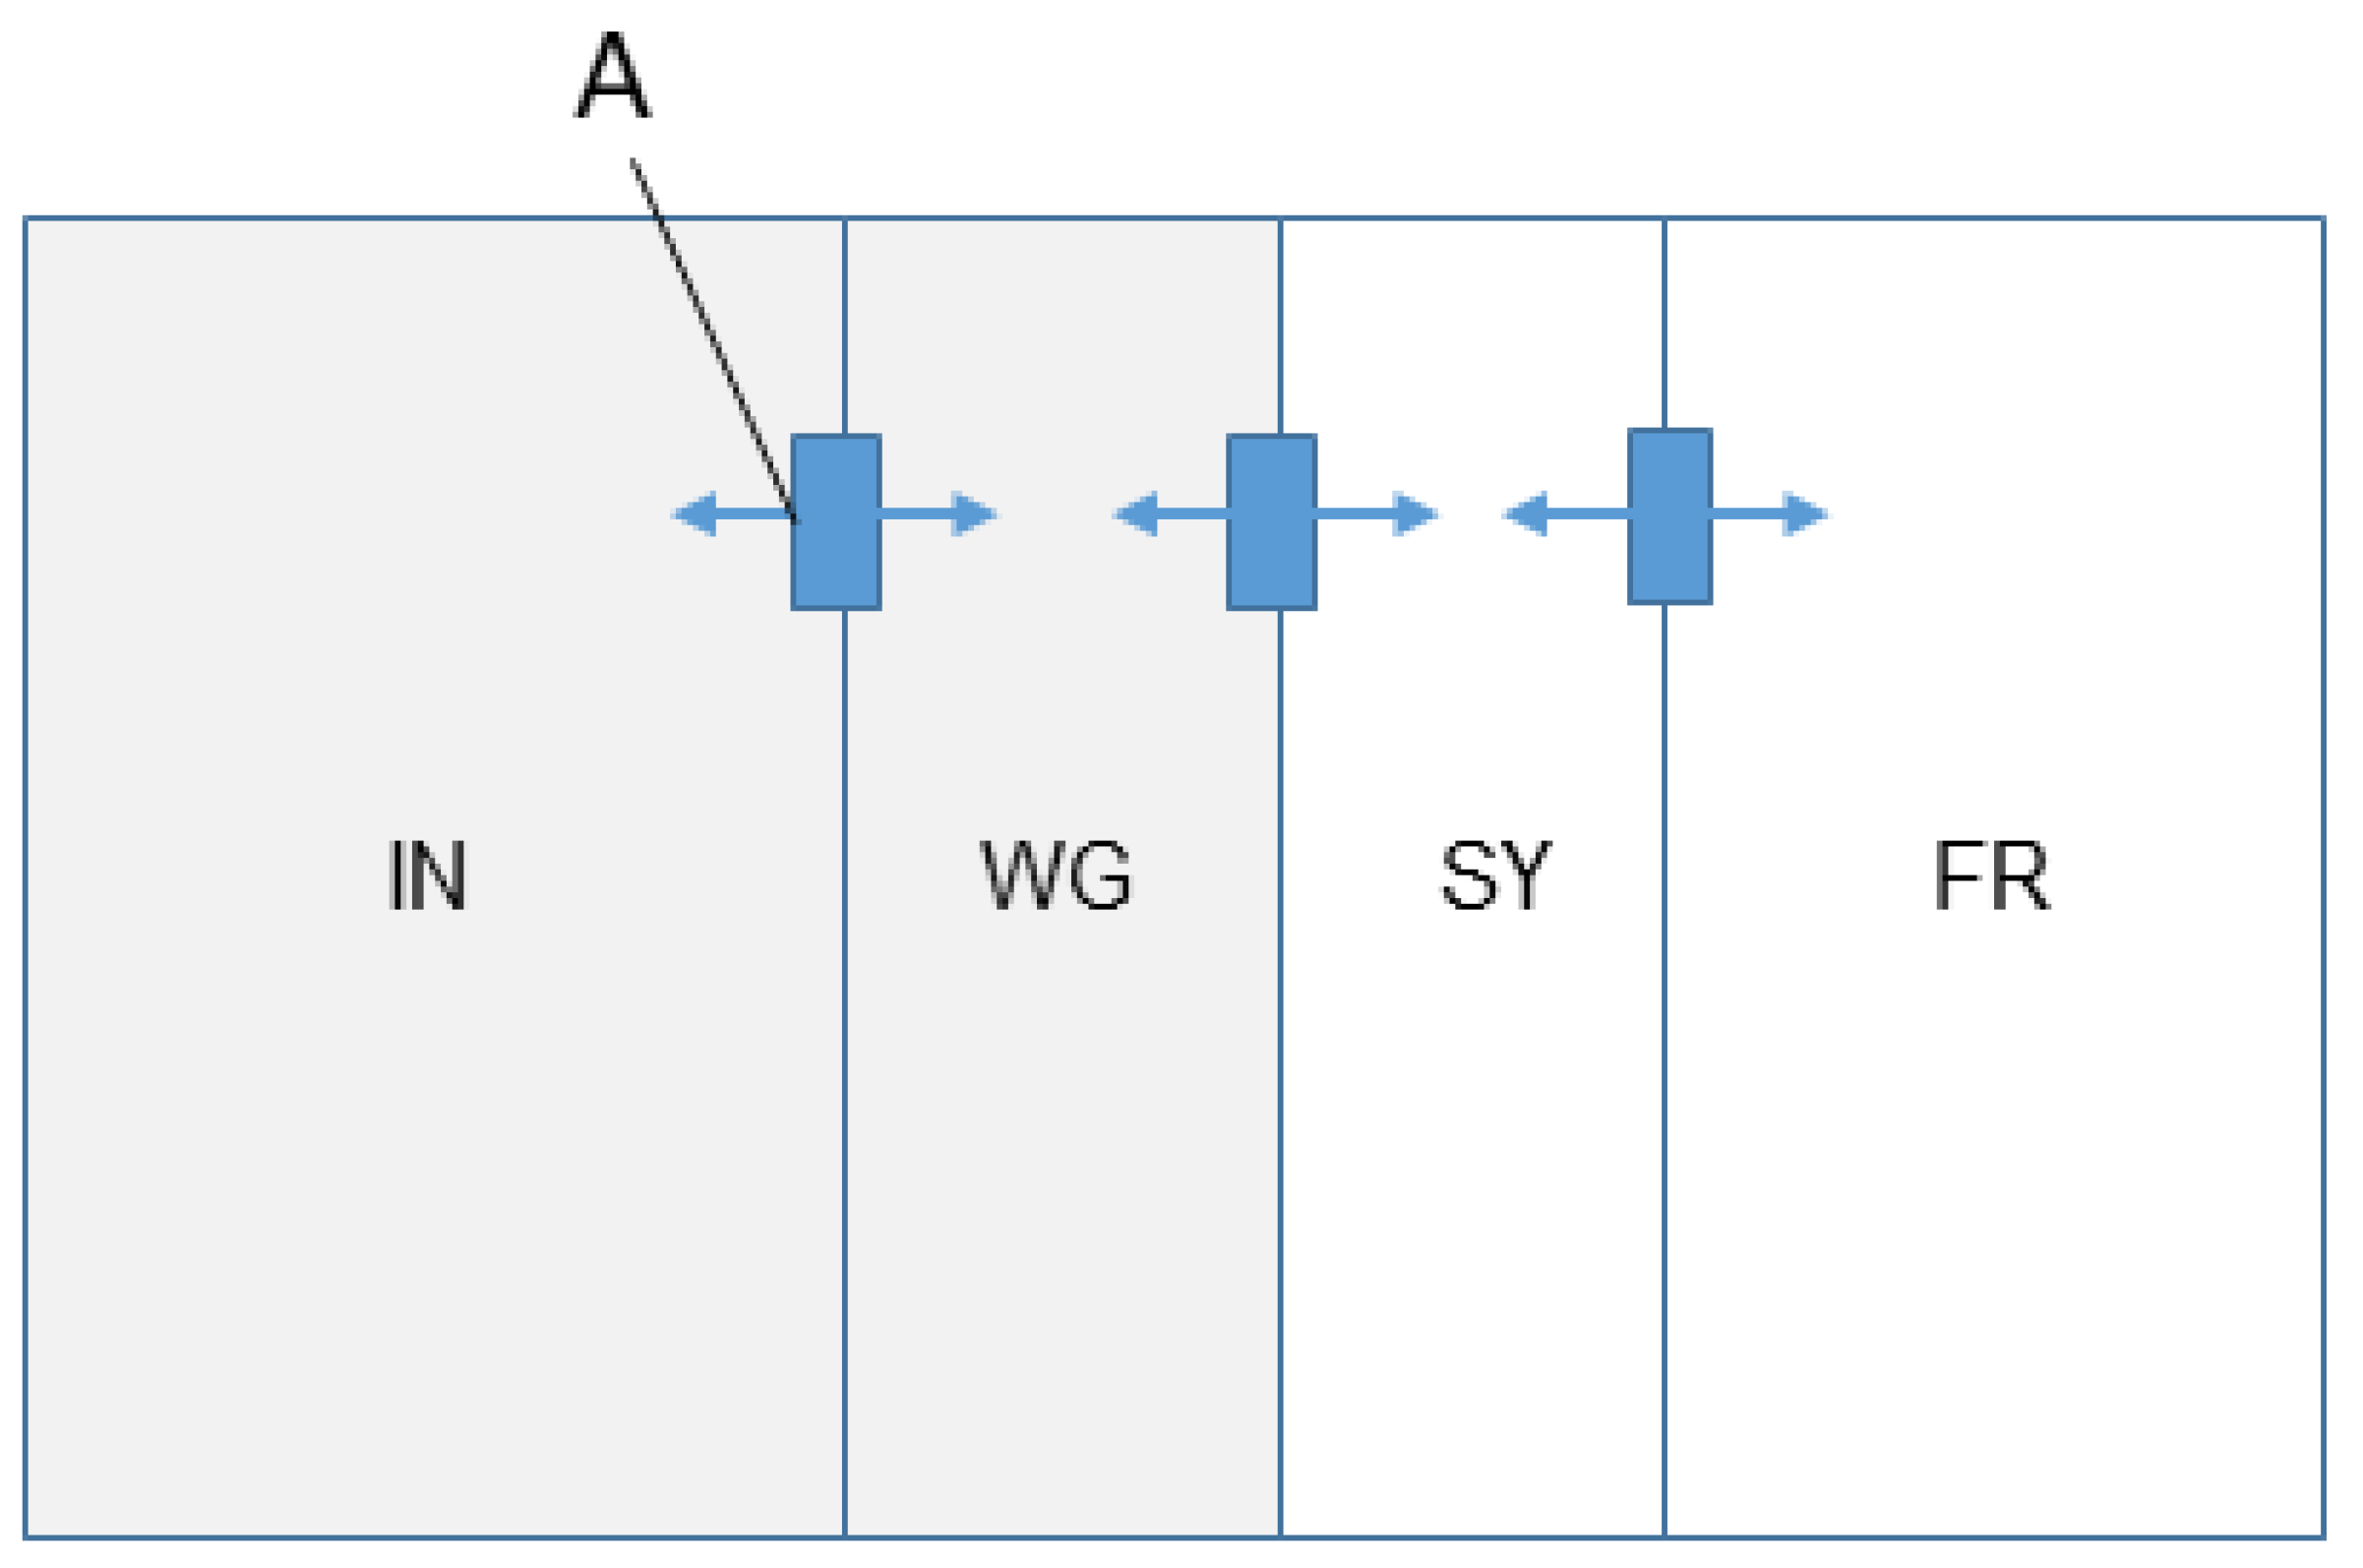
Abstract
:Simple Summary
Abstract
1. Introduction
2. Materials and Methods
2.1. Ethical Approval
2.2. Animals and Housing
2.3. Data Acquisition
2.4. Movement Data
2.5. Social Network
2.6. Dynamic Time Warping Analysis
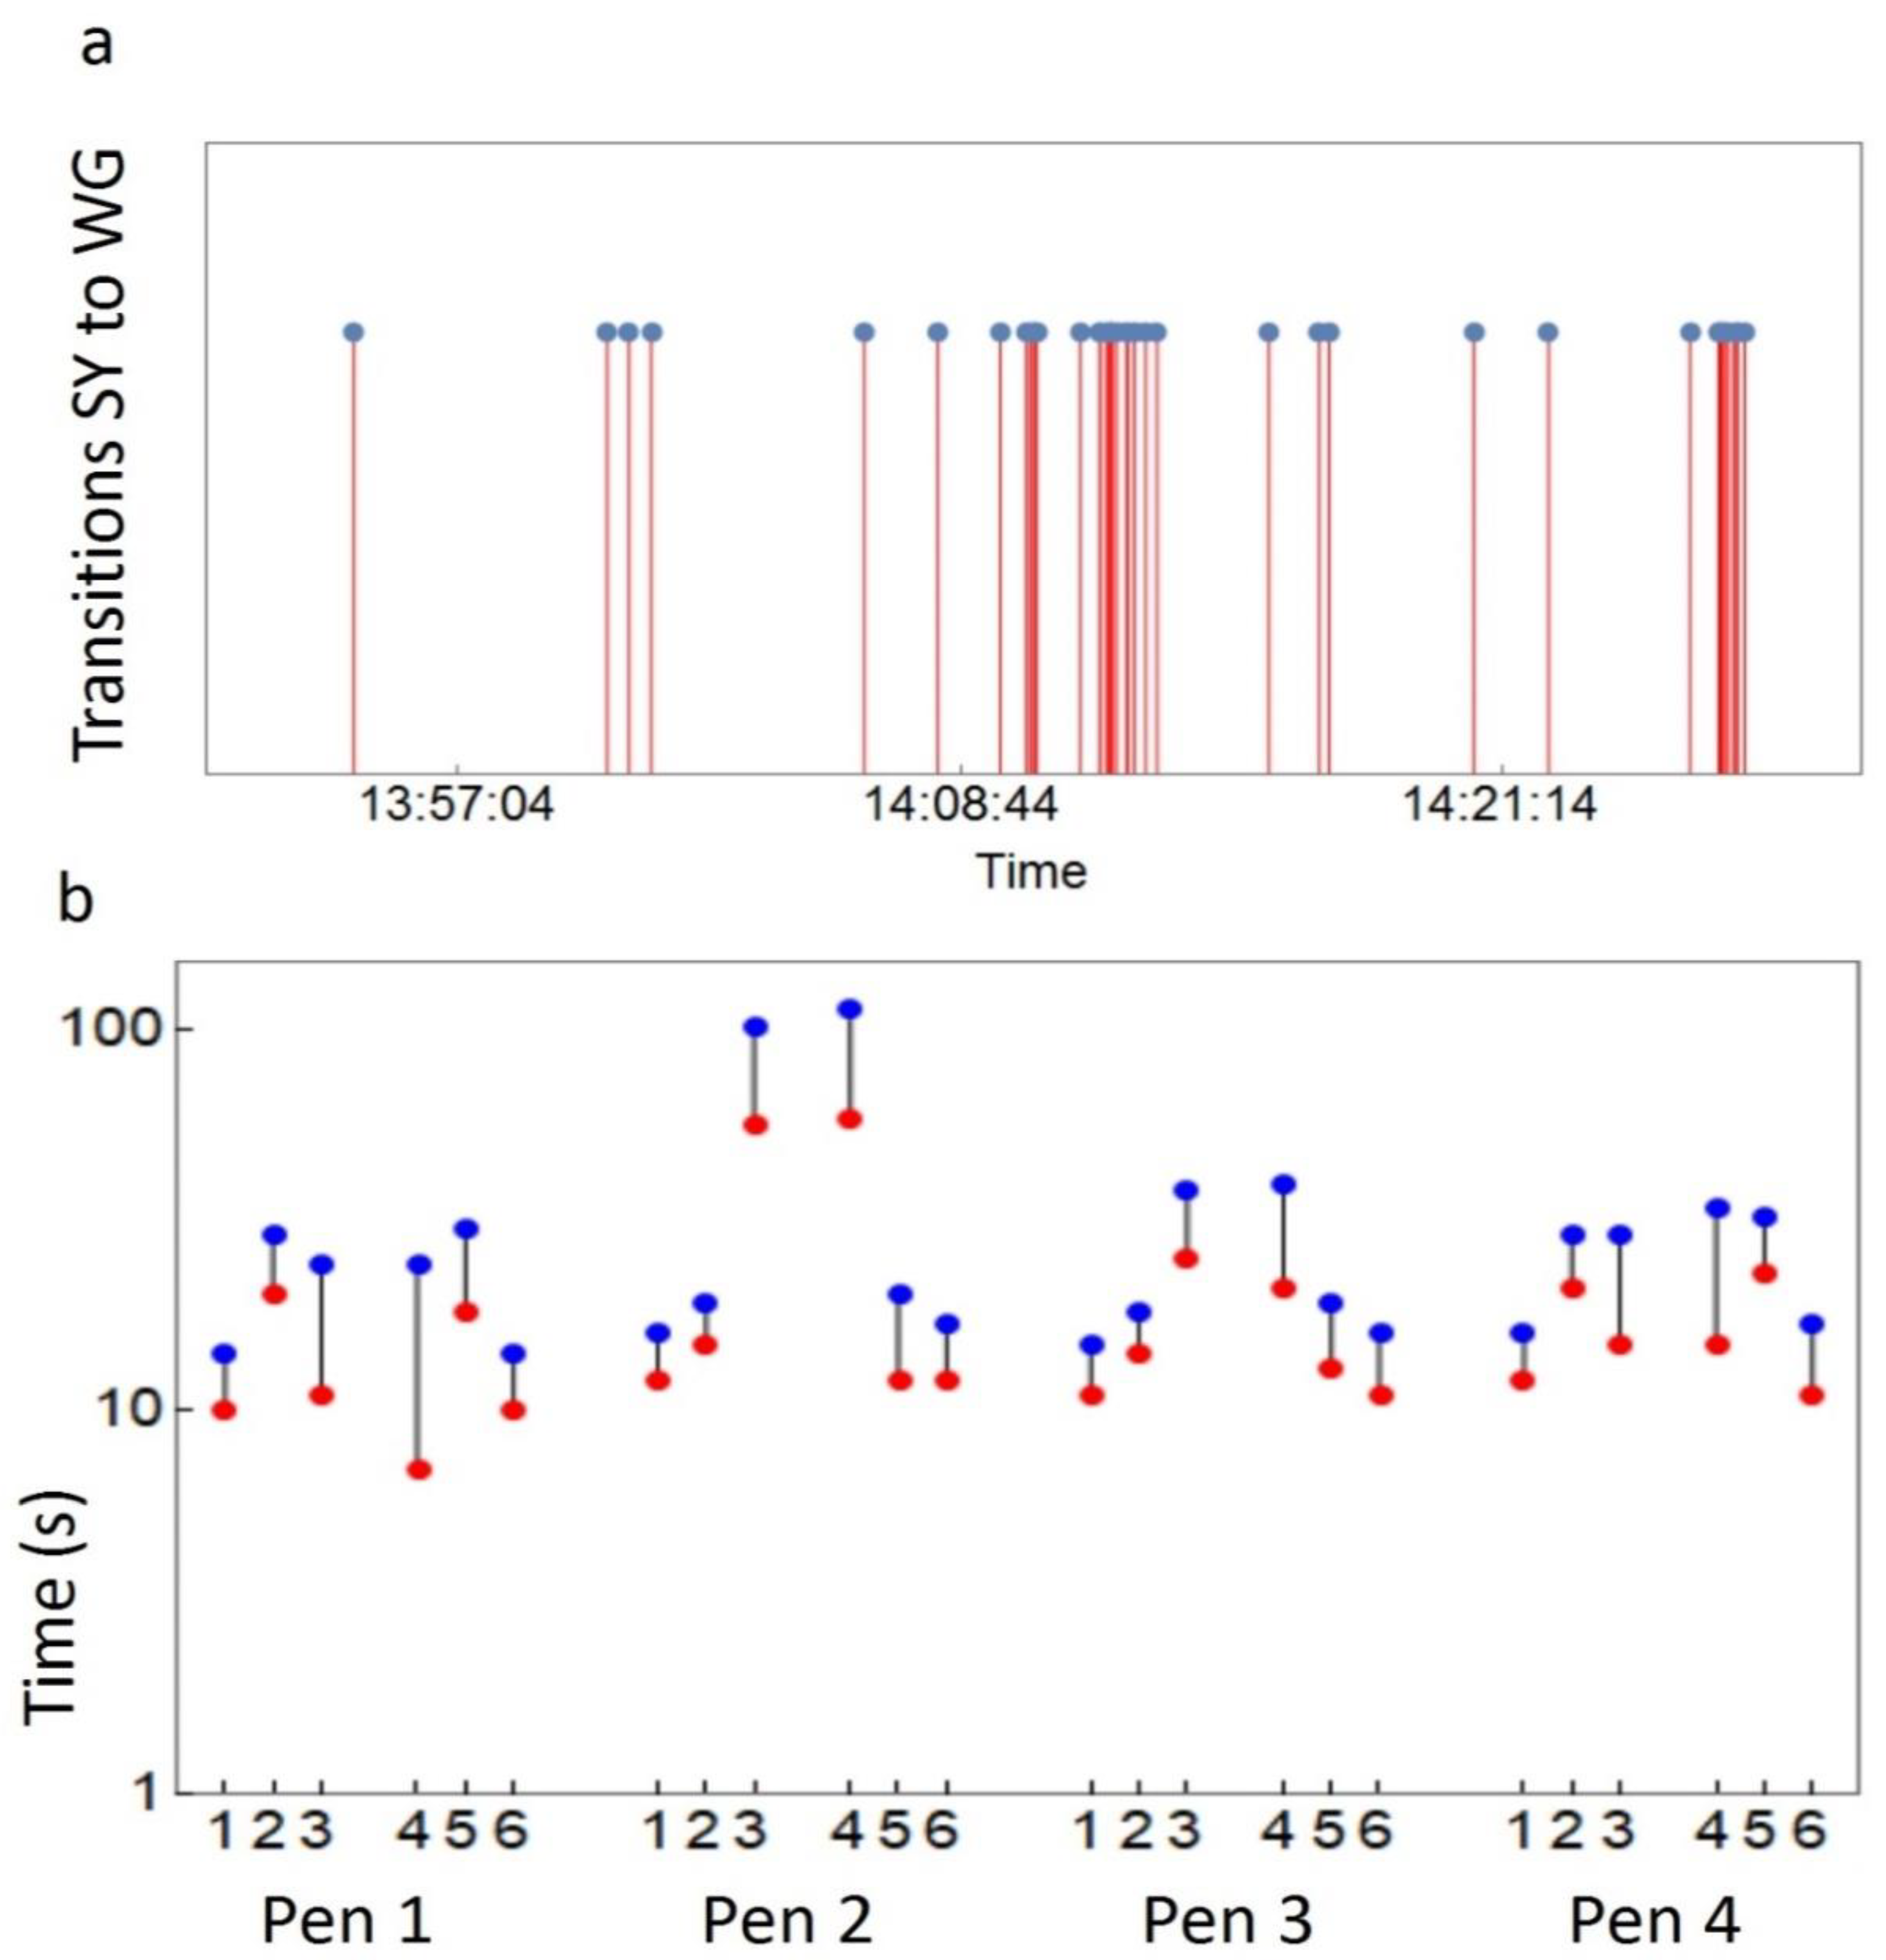
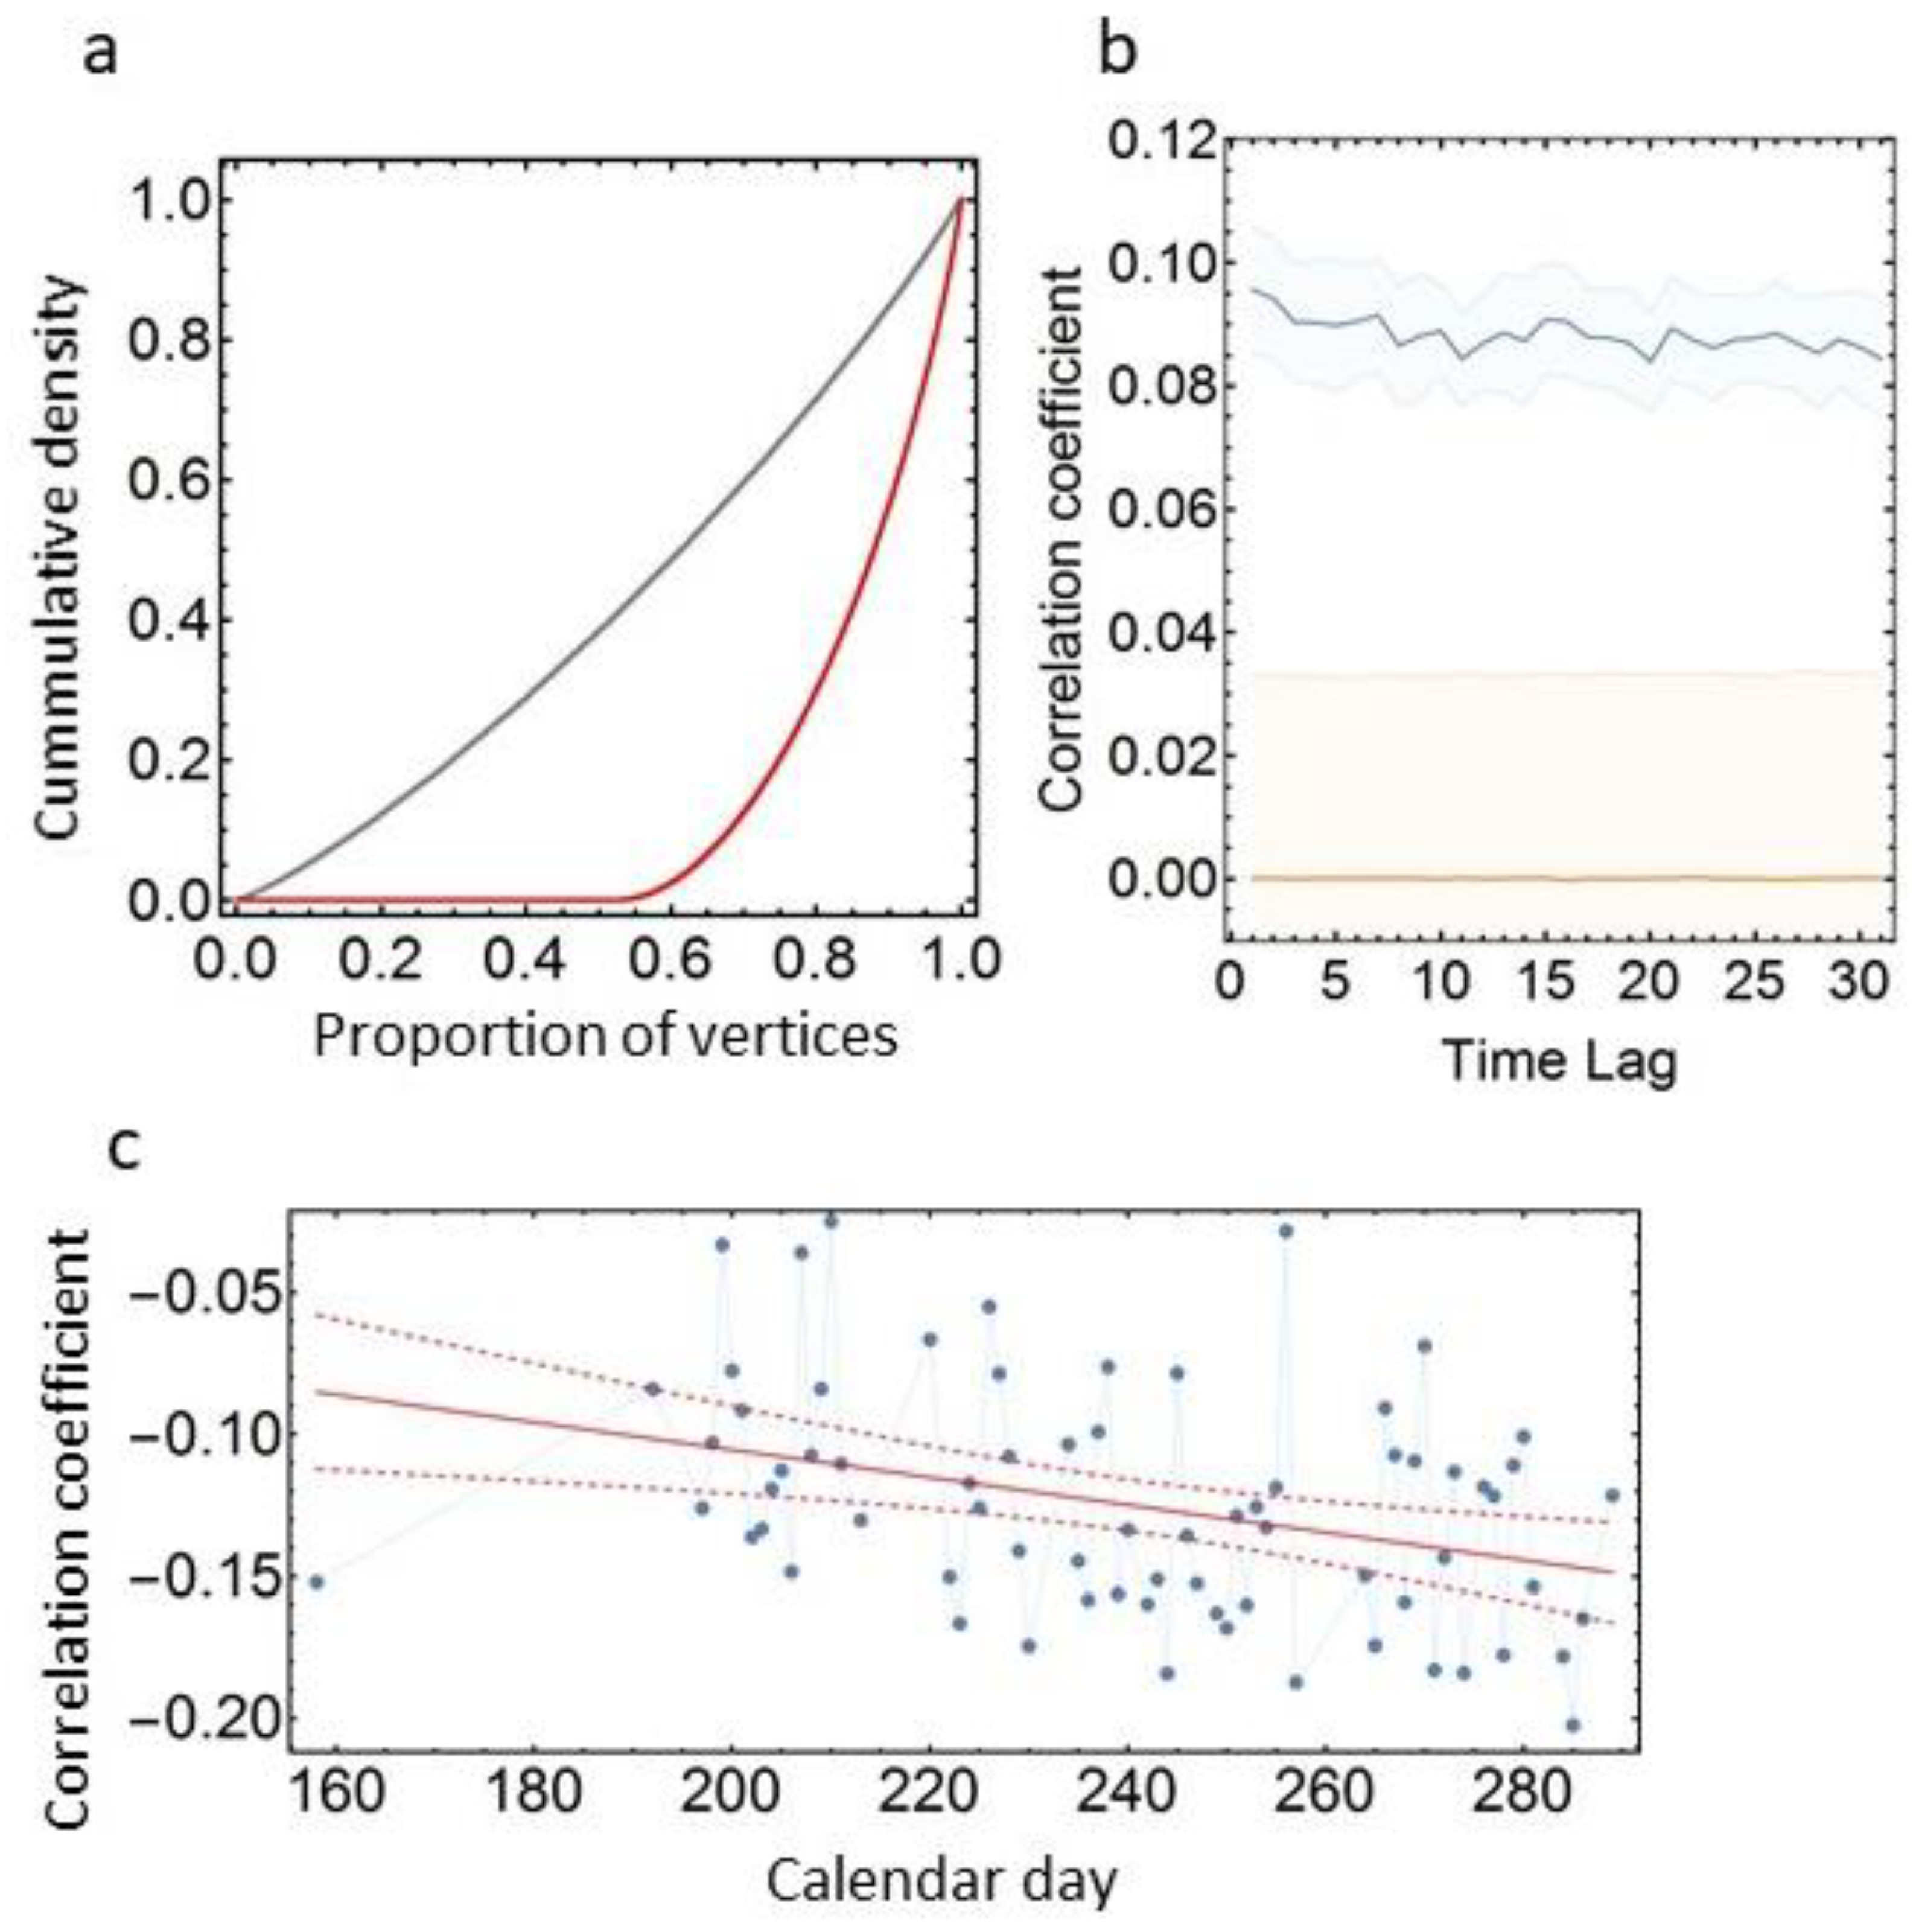
2.7. Timeshift Test for the Correlation between Social Association and Dynamic Time Warping
3. Results
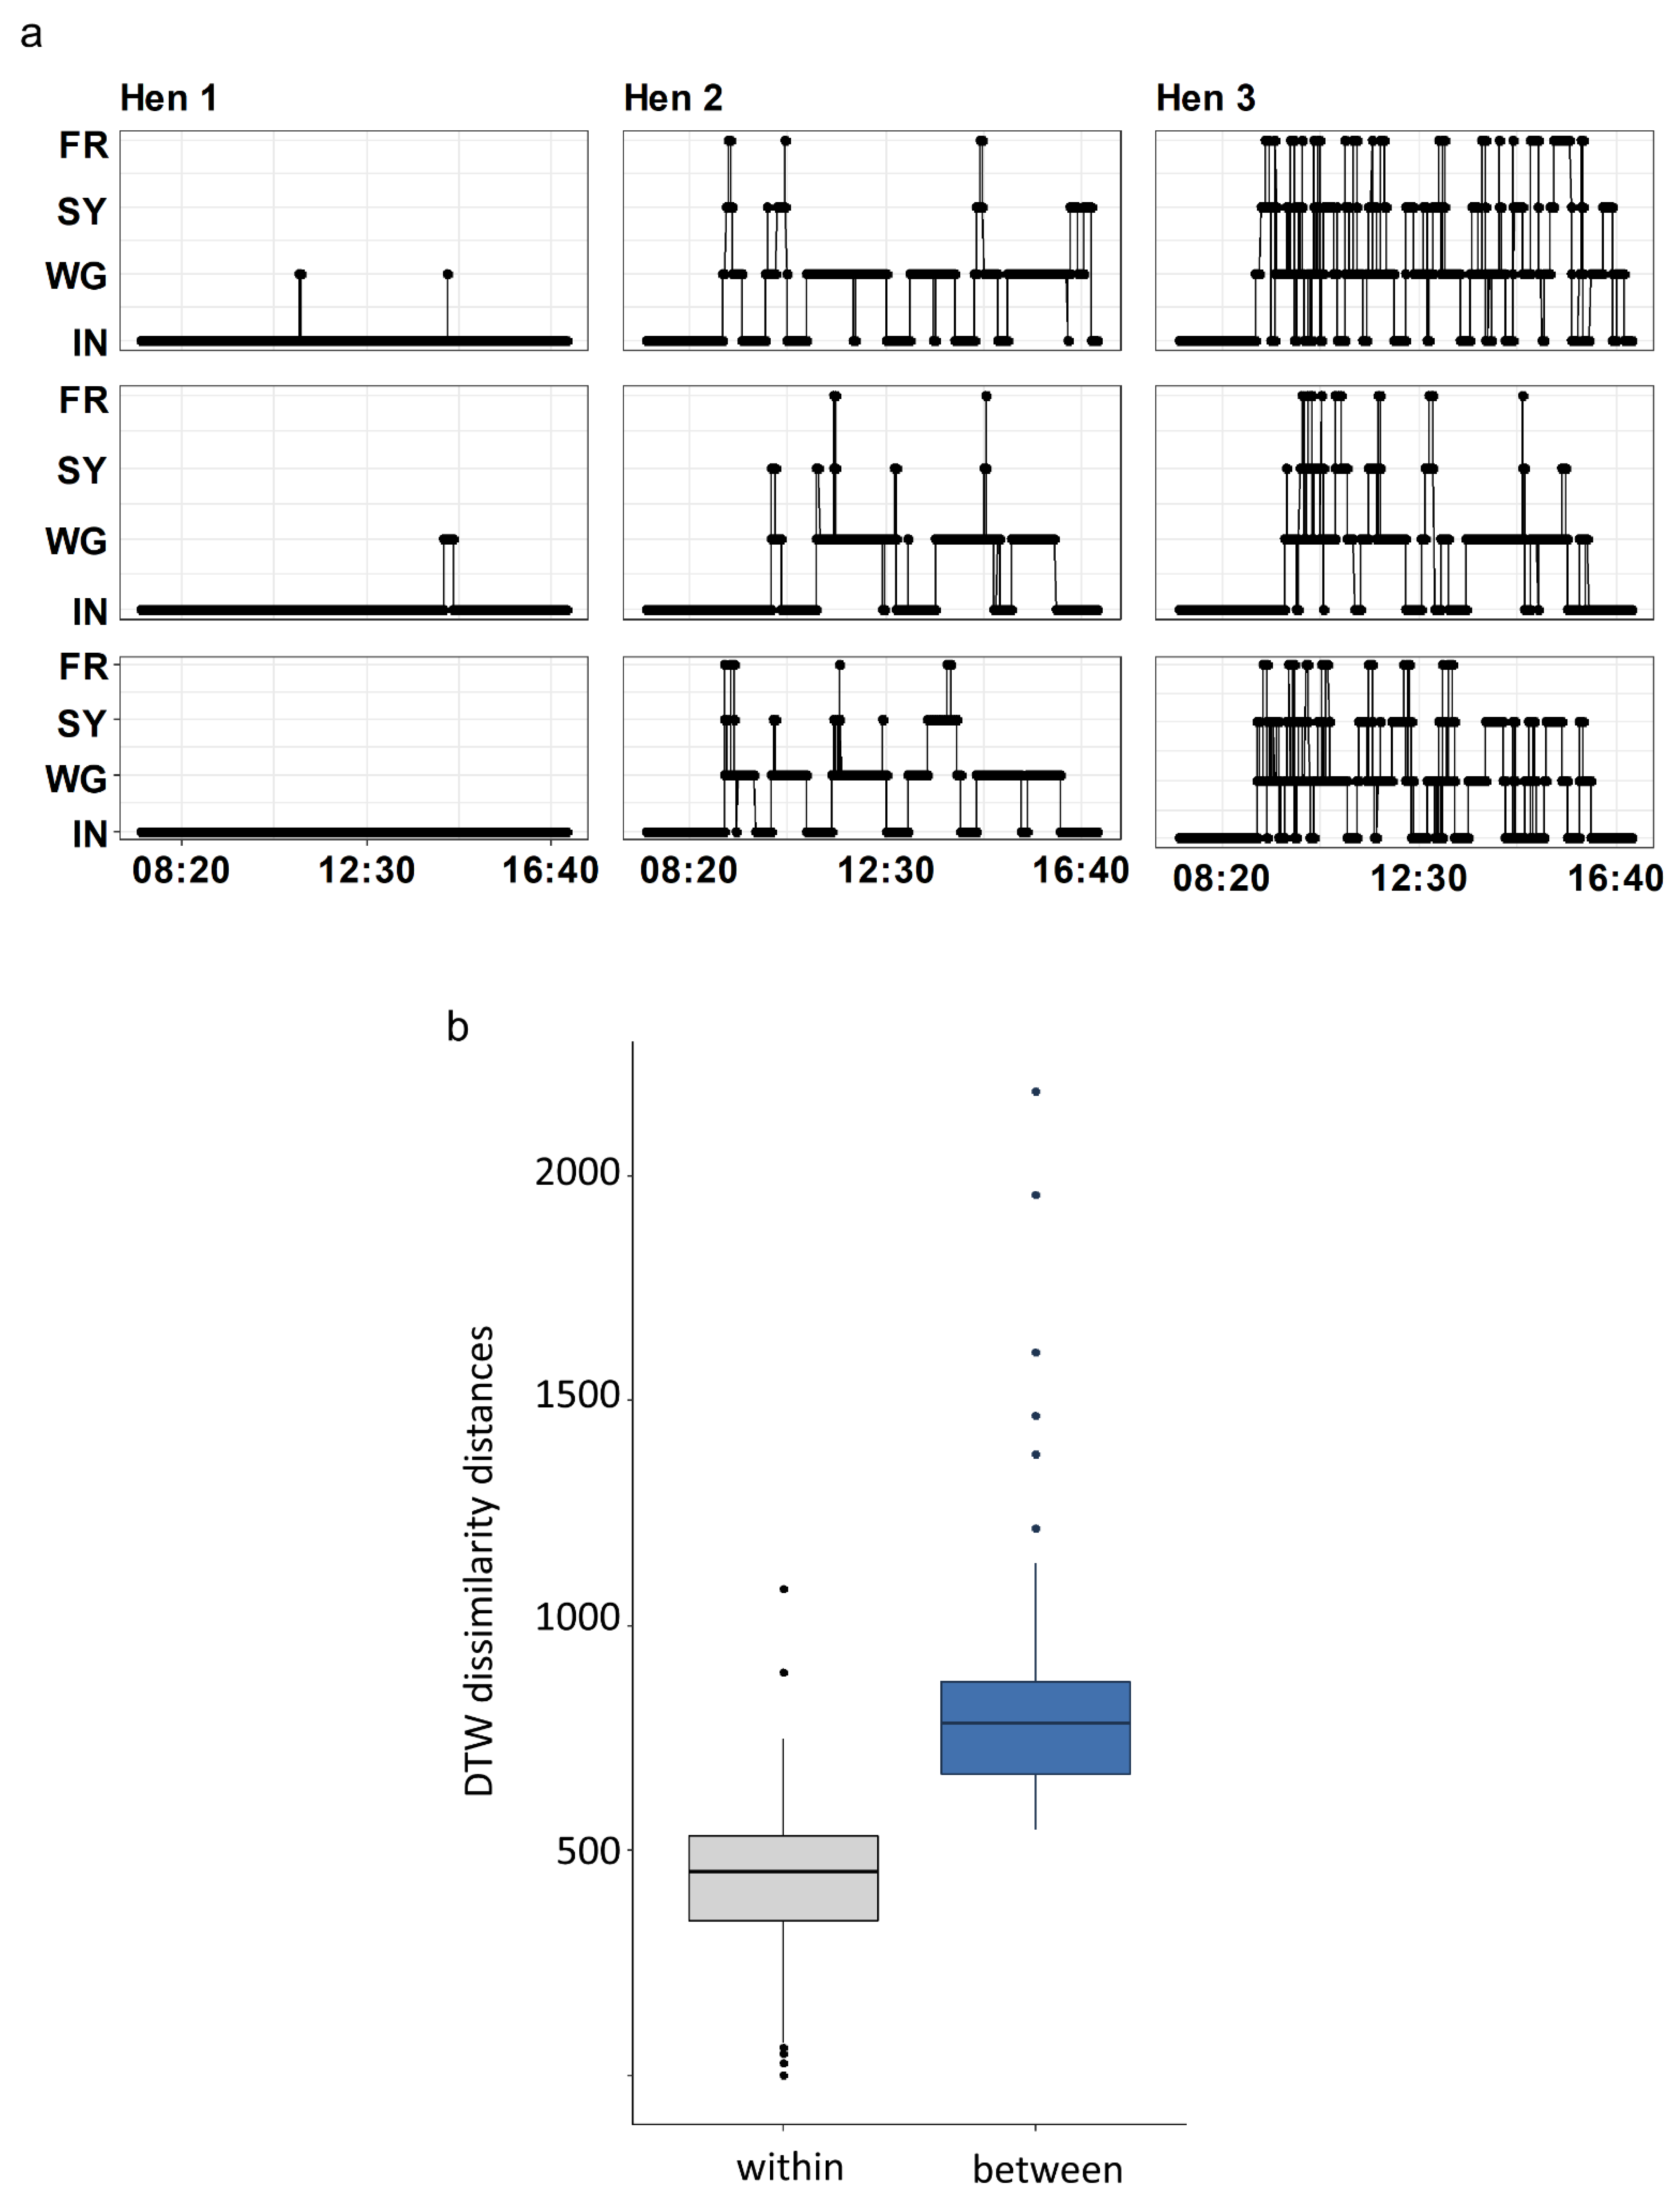
3.1. Comparing Movement Patterns within and between Hens
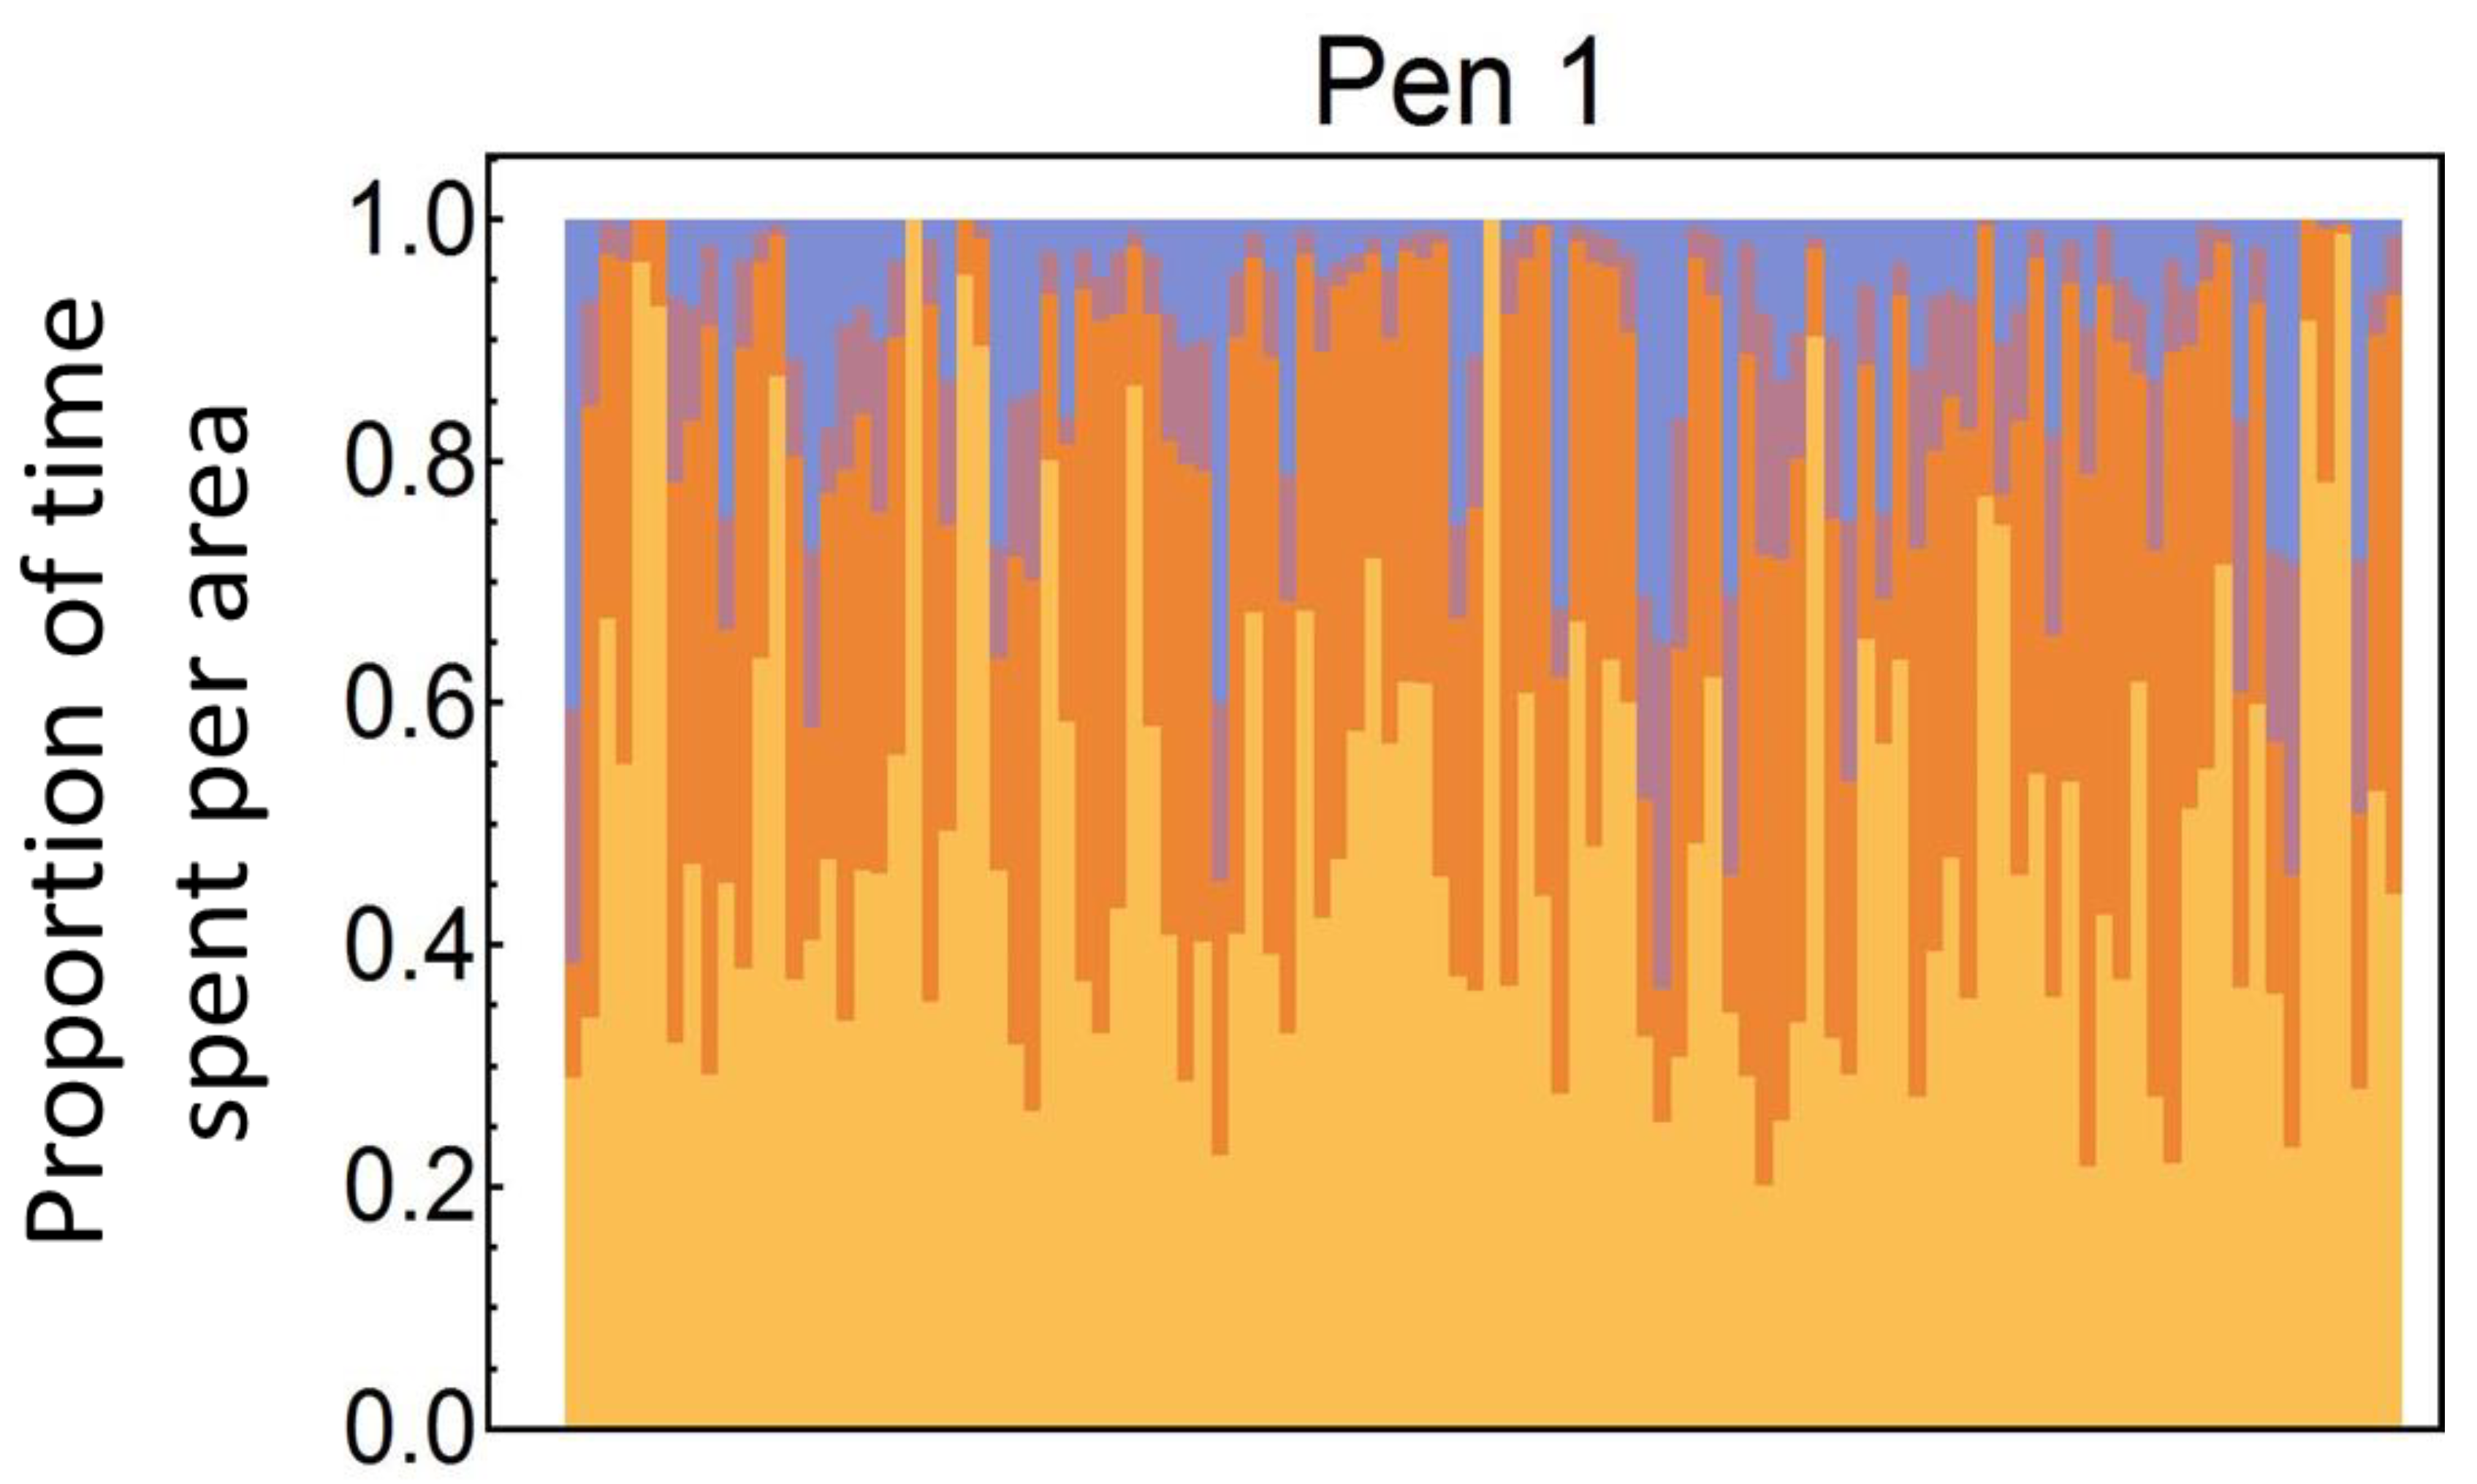
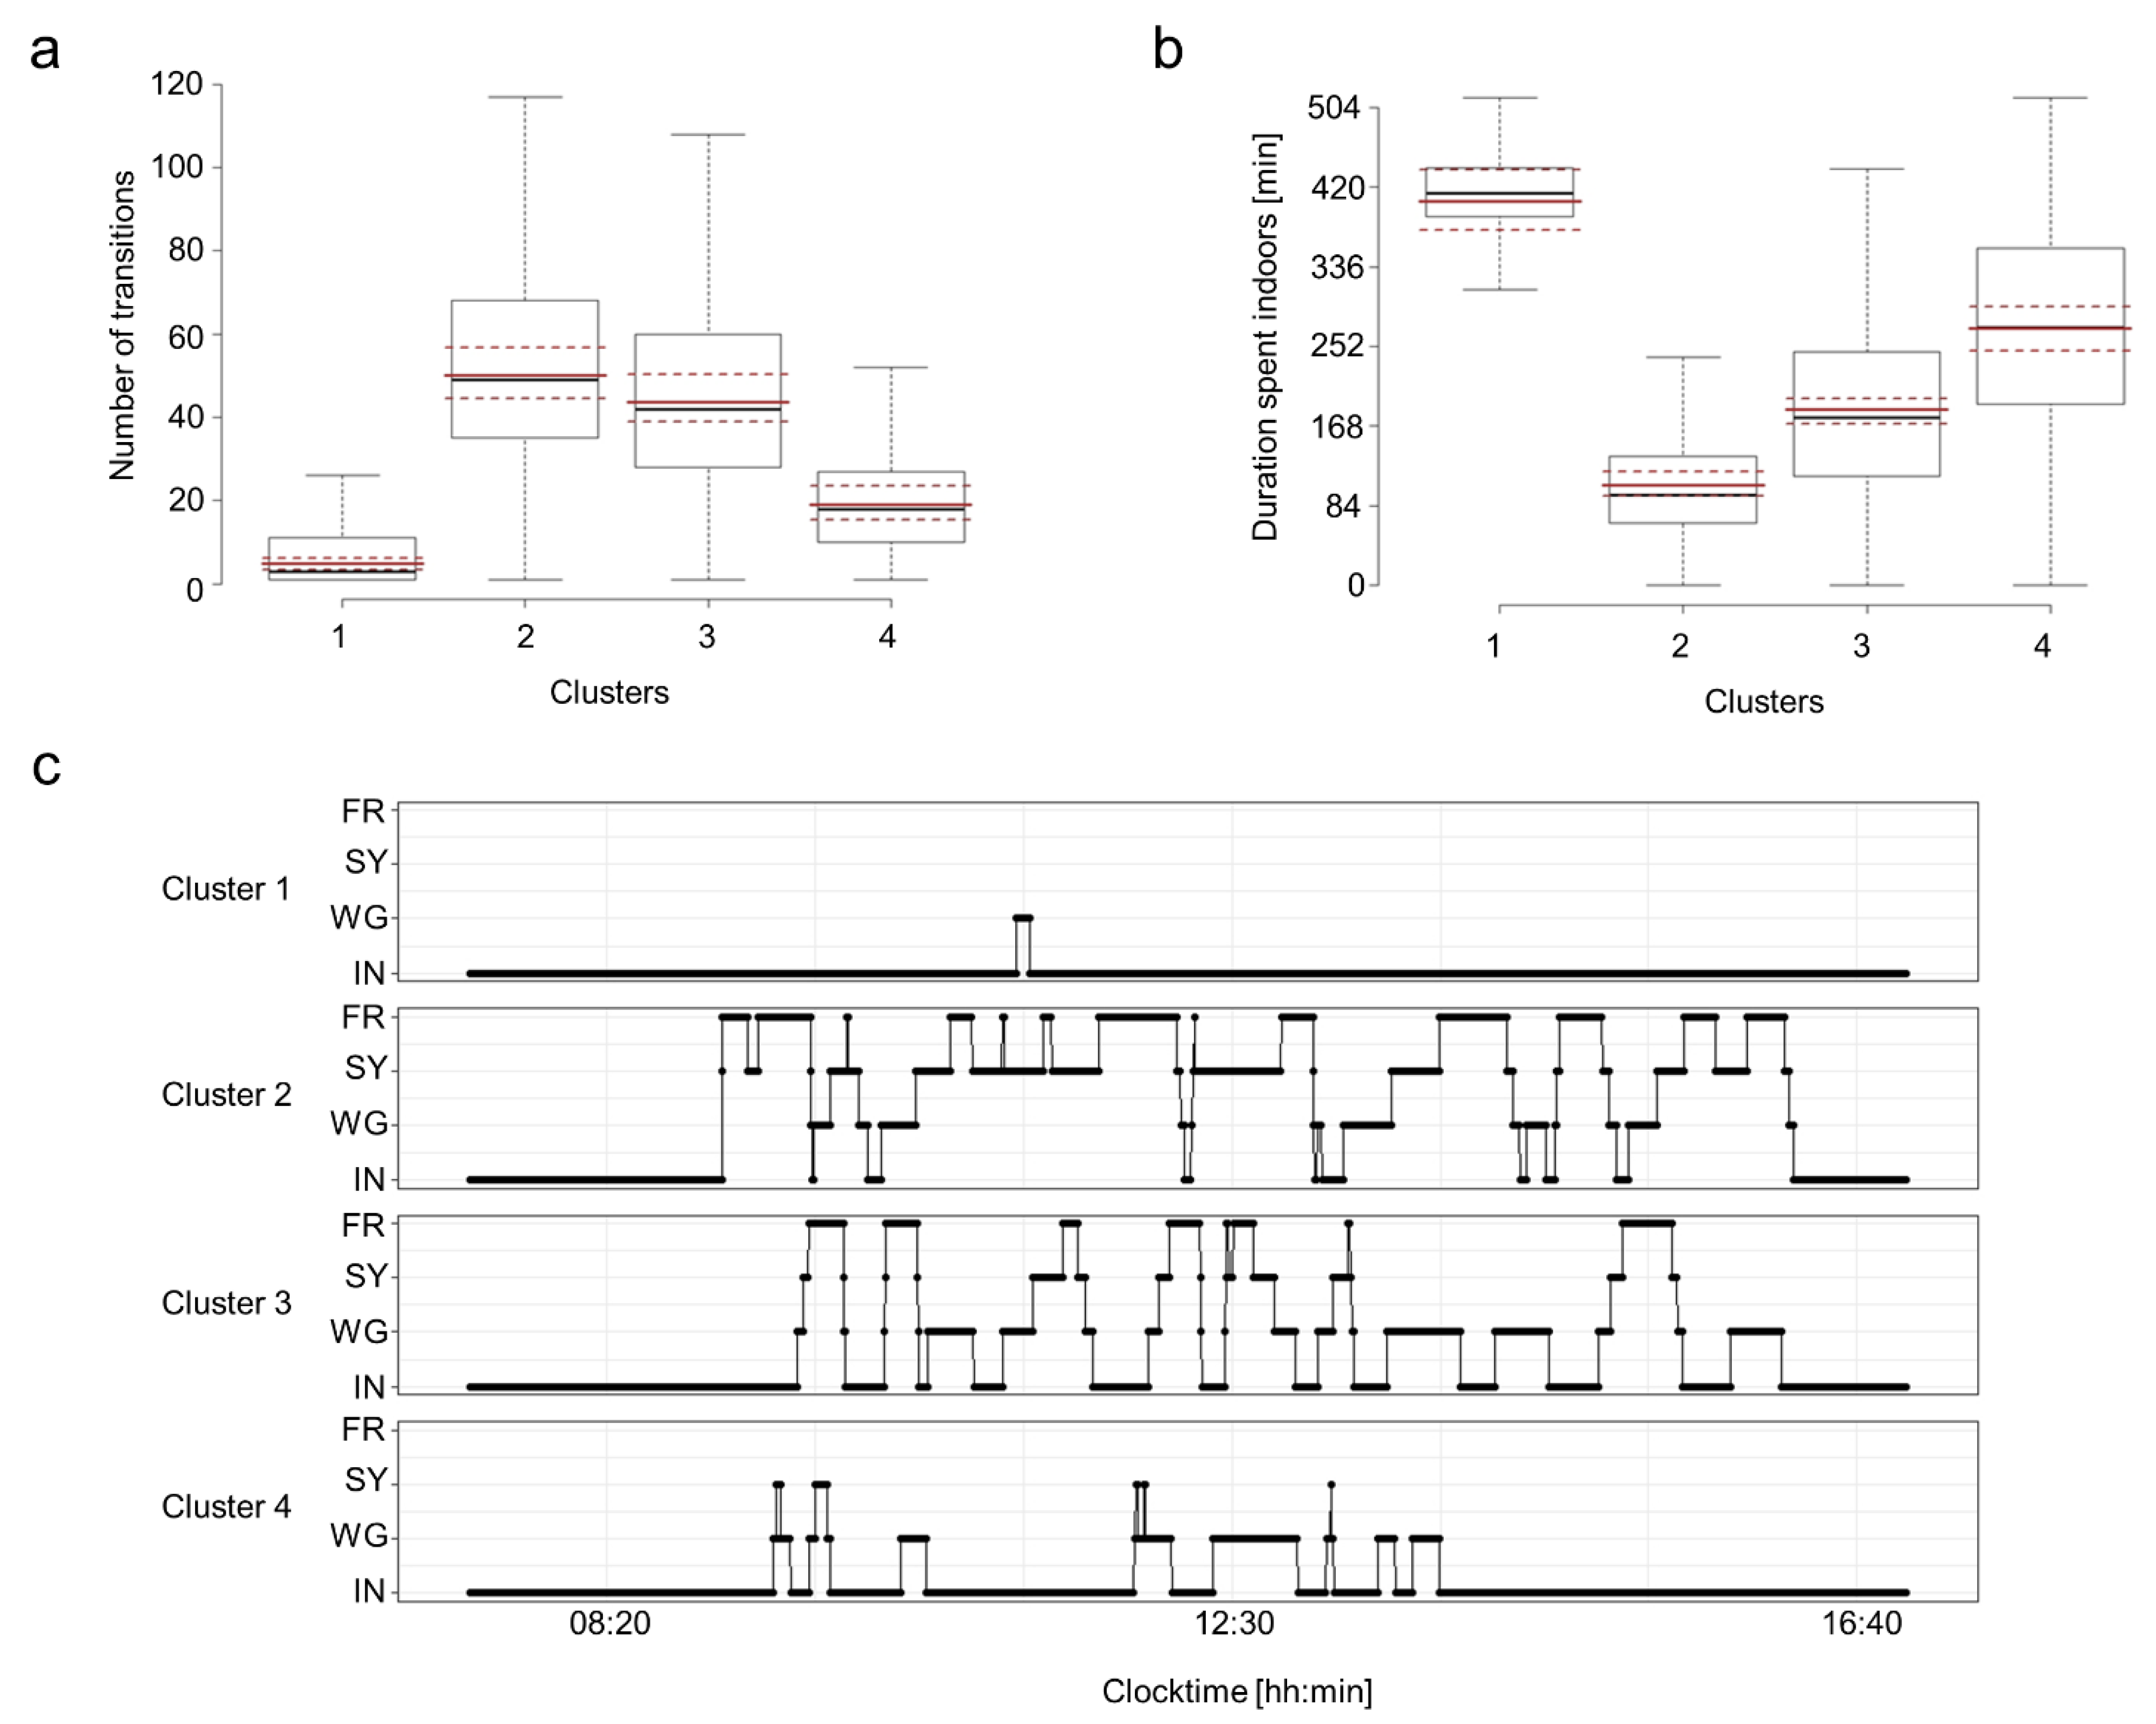
3.2. Cluster Characteristics of the Movement Patterns Per Pen
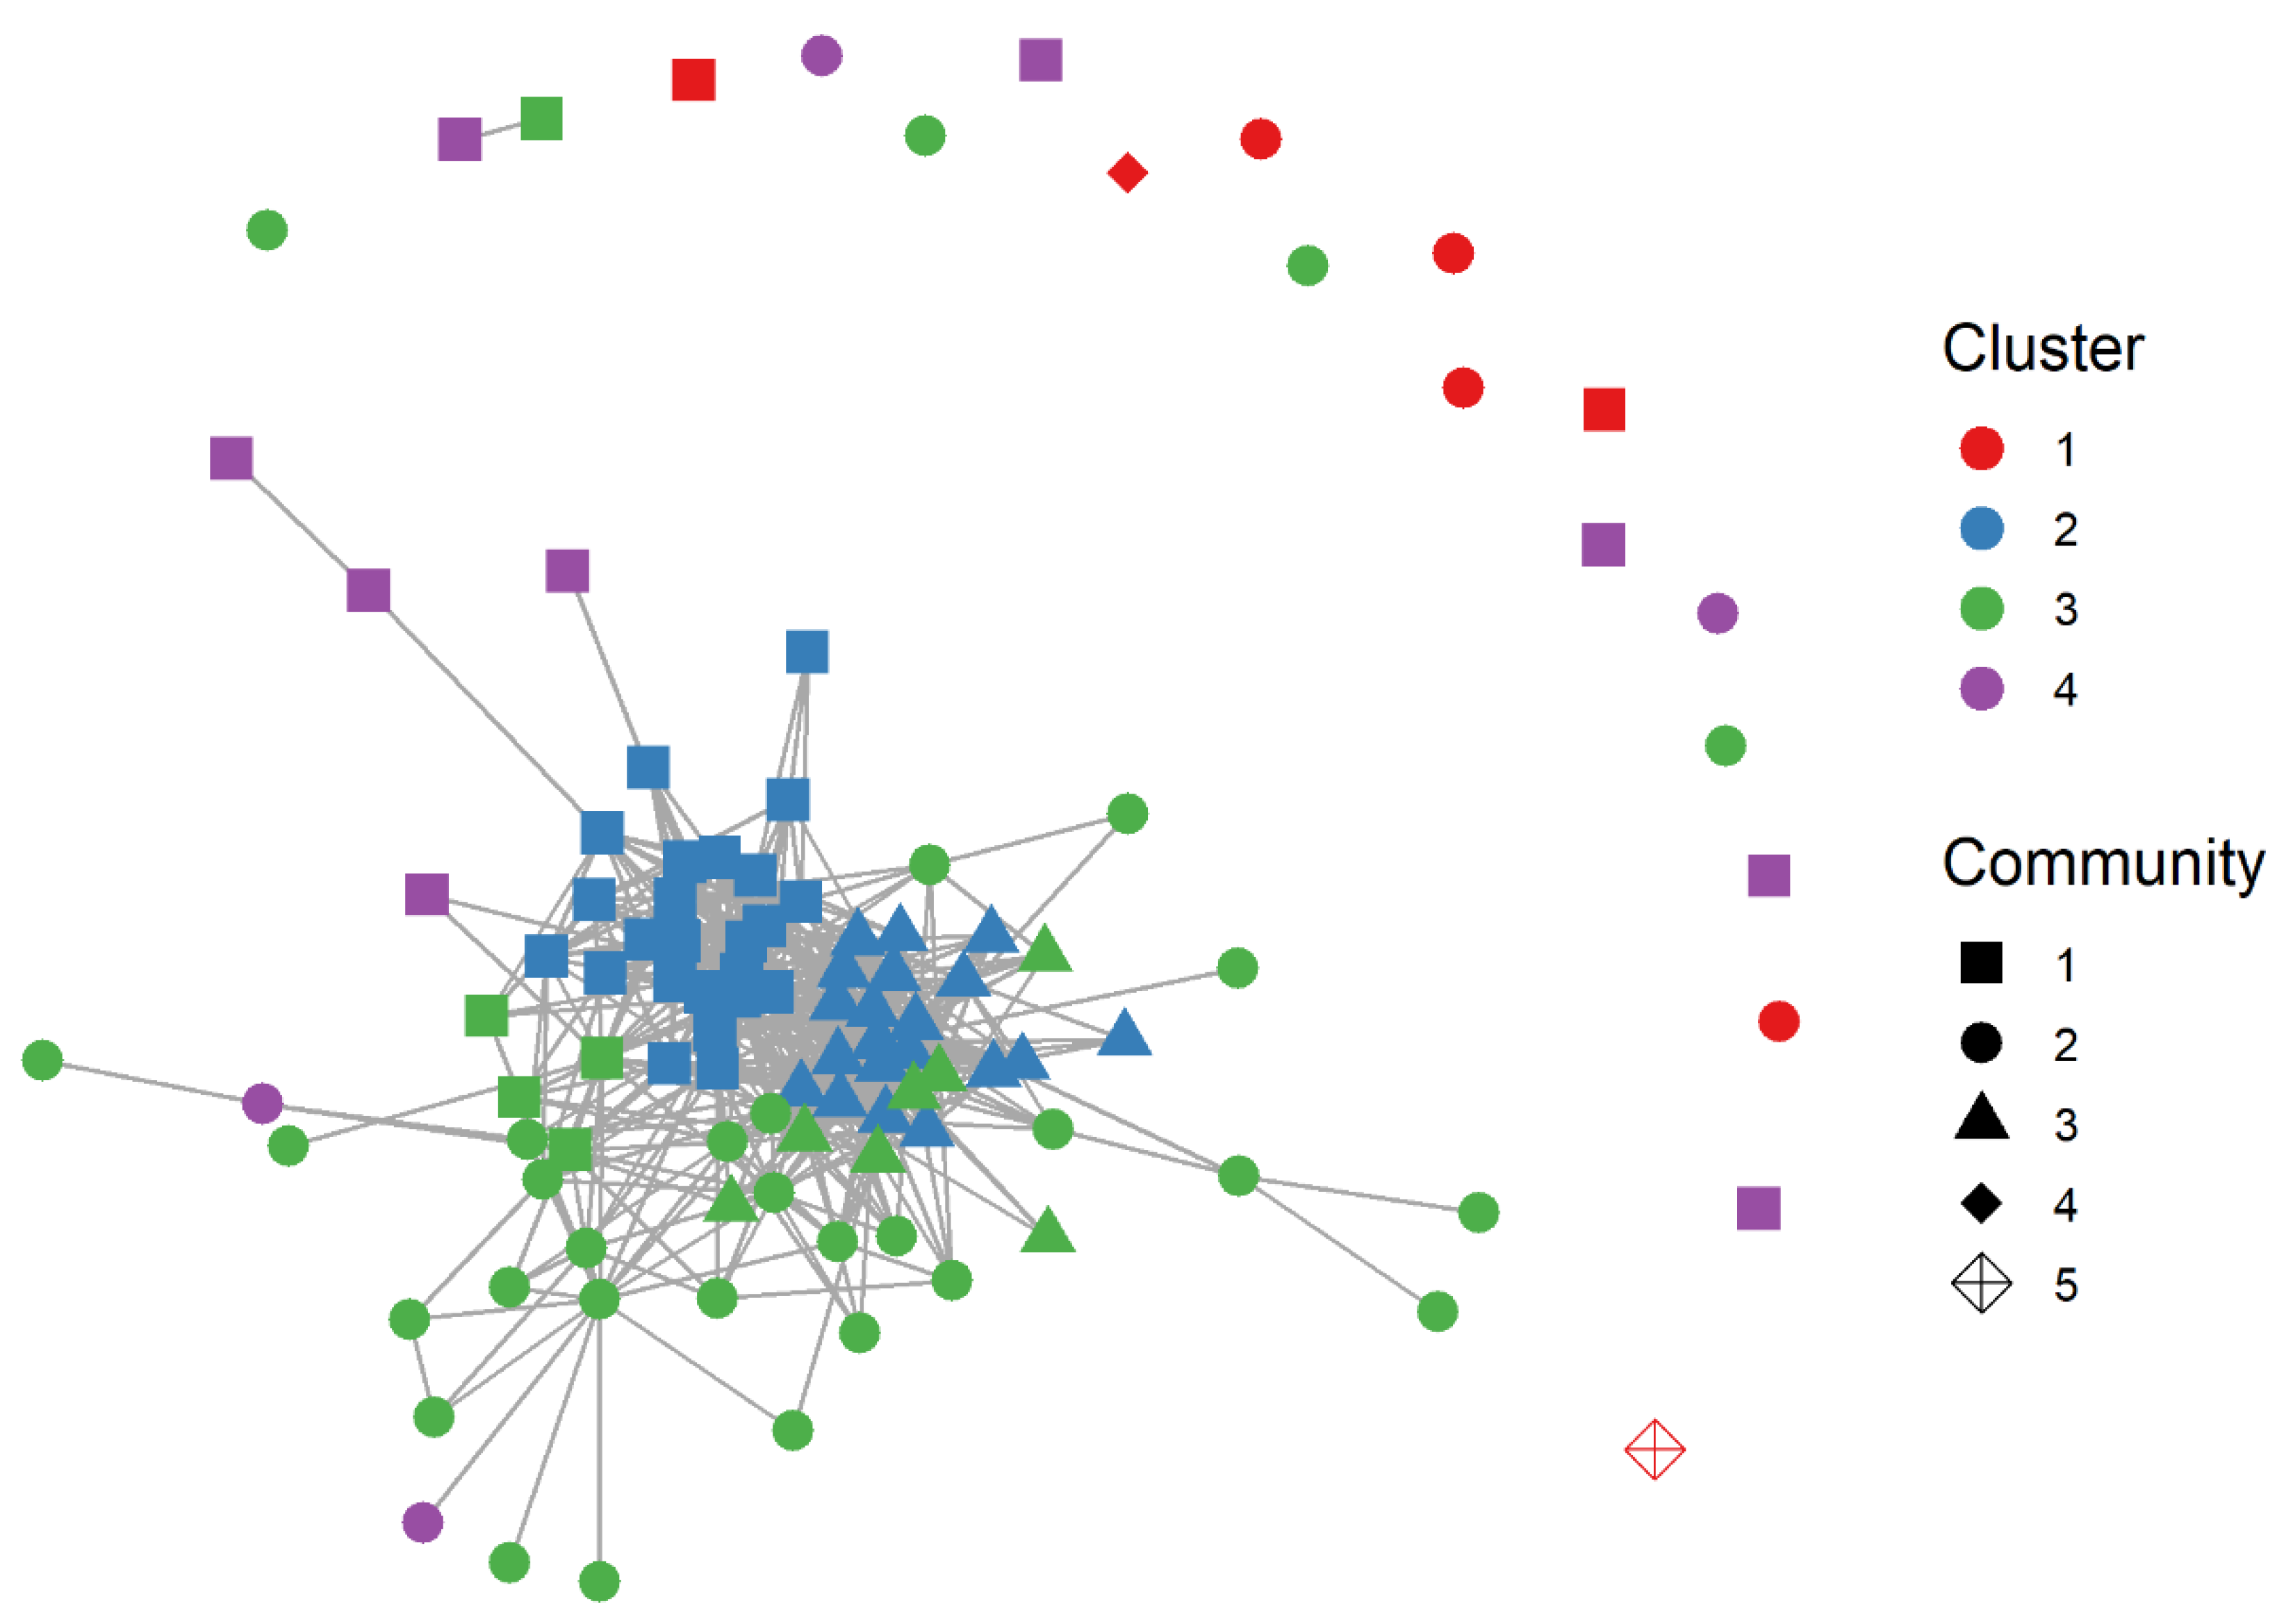
3.3. Social Network Analyses
4. Discussion
5. Conclusions
Supplementary Materials
Author Contributions
Funding
Institutional Review Board Statement
Informed Consent Statement
Data Availability Statement
Acknowledgments
Conflicts of Interest
References
- Dunbar, R.I.M. Primate Social Systems; Springer: Berlin, Germany, 2013. [Google Scholar]
- Wilson, E. Sociobiology; Belknap Press of Harvard University Press: Cambridge, MA, USA, 1975. [Google Scholar]
- Wolf, J.B.; Brodie, E.D., III; Moore, A.J. Interacting phenotypes and the evolutionary process. II. Selection resulting from social interactions. Am. Nat. 1999, 153, 254–266. [Google Scholar] [CrossRef] [PubMed]
- Tokita, C.K.; Tarnita, C.E. Social influence and interaction bias can drive emergent behavioural specialization and modular social networks across systems. J. R. Soc. Interface 2020, 17, 20190564. [Google Scholar] [CrossRef] [PubMed] [Green Version]
- Tuliozi, B.; Fracasso, G.; Hoi, H.; Griggio, M. House sparrows’ (Passer domesticus) behaviour in a novel environment is modulated by social context and familiarity in a sex-specific manner. Front. Zool. 2018, 15, 16. [Google Scholar] [CrossRef] [PubMed] [Green Version]
- Tóth, Z.; Bókony, V.; Lendvai, Á.Z.; Szabó, K.; Pénzes, Z.; Liker, A. Effects of relatedness on social-foraging tactic use in house sparrows. Anim. Behav. 2009, 77, 337–342. [Google Scholar] [CrossRef]
- Campbell, P.; Akbar, Z.; Adnan, A.M.; Kunz, T.H. Resource distribution and social structure in harem-forming Old World fruit bats: Variations on a polygynous theme. Anim. Behav. 2006, 72, 687–698. [Google Scholar] [CrossRef]
- Fernandez-Duque, E. Social monogamy in wild owl monkeys (Aotus azarae) of Argentina: The potential influences of resource distribution and ranging patternsSocial monogamy in wild owl monkeys (Aotus azarae) of Argentina: The potential influences of resource distribution and r. Am. J. Primatol. 2016, 78, 355–371. [Google Scholar] [CrossRef] [PubMed] [Green Version]
- Sirovnik, J.; Voelkl, B.; Keeling, L.J.; Würbel, H.; Toscano, M.J. Breakdown of the ideal free distribution under conditions of severe and low competition. Behav. Ecol. Sociobiol. 2021, 75, 1–11. [Google Scholar] [CrossRef]
- Wong, M.; Jordan, A.; Marsh-Rollo, S.; St-Cyr, S.; Reynolds, J.; Stiver, K.; Desjardins, J.K.; Fitzpatrick, J.; Balshine, S. Mating systems in cooperative breeders: The roles of resource dispersion and conflict mitigation. Behav. Ecol. 2012, 23, 521–530. [Google Scholar] [CrossRef] [Green Version]
- Firth, J.A.; Voelkl, B.; Farine, D.R.; Sheldon, B. Experimental Evidence that Social Relationships Determine Individual Foraging Behavior. Curr. Biol. 2015, 25, 3138–3143. [Google Scholar] [CrossRef] [Green Version]
- Krause, J.; Ruxton, G. Important topics in group living. In Social Behaviour: Genes, Ecology and Evolution; Cambridge University Press: Cambridge, UK, 2010; pp. 203–225. [Google Scholar] [CrossRef]
- Conradt, L.; Roper, T.J. Consensus decision making in animals. Trends Ecol. Evol. 2005, 20, 449–456. [Google Scholar] [CrossRef]
- Stillman, R.A.; Goss-Custard, J.D.; Alexander, M.J. Predator search pattern and the strength of interference through prey depression. Behav. Ecol. 2000, 11, 597–605. [Google Scholar] [CrossRef]
- Giraldeau, L.-A.; Lefebvre, L. Scrounging prevents cultural transmission of food-finding behaviour in pigeons. Anim. Behav. 1987, 35, 387–394. [Google Scholar] [CrossRef]
- Goss-Custard, J.D. Competition for Food and Interference among Waders. Ardea 2002, 38–90, 31–52. [Google Scholar] [CrossRef] [Green Version]
- Kasper, C.; Voelkl, B.; Huber, L. Tolerated mouth-to-mouth food transfers in common marmosets. Primates 2007, 49, 153–156. [Google Scholar] [CrossRef]
- Coussi-Korbel, S.; Fragaszy, D.M. On the relation between social dynamics and social learning. Anim. Behav. 1995, 50, 1441–1453. [Google Scholar] [CrossRef]
- Dunbar, R.I.M. Time: A hidden constraint on the behavioural ecology of baboons. Behav. Ecol. Sociobiol. 1992, 31, 35–49. [Google Scholar] [CrossRef]
- Couzin, I.D.; Krause, J.; James, R.; Ruxton, G.D.; Franks, N.R. Collective Memory and Spatial Sorting in Animal Groups. J. Theor. Biol. 2002, 218, 1–11. [Google Scholar] [CrossRef] [Green Version]
- Krause, J. Differential fitness returns in relation to spatial position in groups. Biol. Rev. 1994, 69, 187–206. [Google Scholar] [CrossRef]
- Gebhardt-Henrich, S.G.; Fröhlich, E.K.; Burose, F.; Fleurent, J.; Gantner, M.; Zähner, M. Individual tracking of laying hens with an RFID-System. Landtechnik 2014, 69, 301. [Google Scholar]
- Larsen, H.; Cronin, G.M.; Gebhardt-Henrich, S.G.; Smith, C.L.; Hemsworth, P.H.; Rault, J.-L. Individual Ranging Behaviour Patterns in Commercial Free-Range Layers as Observed through RFID Tracking. Animals 2017, 7, 21. [Google Scholar] [CrossRef]
- Richards, G.J.; Wilkins, L.J.; Knowles, T.; Booth, F.; Toscano, M.J.; Nicol, C.; Brown, S.N. Continuous monitoring of pop hole usage by commercially housed free-range hens throughout the production cycle. Veter. Rec. 2011, 169, 338. [Google Scholar] [CrossRef] [PubMed]
- Rufener, C.; Berezowski, J.; Sousa, F.M.; Abreu, Y.; Asher, L.; Toscano, M.J. Finding hens in a haystack: Consistency of movement patterns within and across individual laying hens maintained in large groups. Sci. Rep. 2018, 8, 12303. [Google Scholar] [CrossRef] [PubMed]
- Guerrero-Bosagna, C.; Pértille, F.; Gomez, Y.; Rezaei, S.; Gebhardt-Henrich, S.G.; Vögeli, S.; Stratmann, A.; Voelkl, B.; Toscano, M.J. DNA methylation variation in the brain of laying hens in relation to differential behavioral patterns. Comp. Biochem. Physiol. Part D Genom. Proteom. 2020, 35, 100700. [Google Scholar] [CrossRef] [PubMed]
- Richman, J.S.; Moorman, J.R. Physiological time-series analysis using approximate entropy and sample entropy. Am. J. Physiol. -Heart Circ. Physiol. 2000, 278, H2039–H2049. [Google Scholar] [CrossRef] [PubMed] [Green Version]
- Whitehead, H. Analyzing Animal Societies: Quantitative Methods for Vertebrate Social Analysis; University of Chicago Press: Chicago, IL, USA, 2008. [Google Scholar]
- Keogh, E.; Ratanamahatana, C.A. Exact indexing of dynamic time warping. Knowl. Inf. Syst. 2005, 7, 358–386. [Google Scholar] [CrossRef]
- Development Core Team. R: A Language and Environment for Statistical Computing; R Foundation for Statistical Computing: Vienna, Austria, 2019. [Google Scholar]
- Sarda-Espinoas, A. Dtwclust: Time Series Clustering Along with Optimizations for the Dynamic Time Warping Distance. 2019. Version 5.5.8. Available online: https://CRAN.R-project.org/package=dtwclust (accessed on 13 February 2022).
- Wood, S.N.; Pya, N.; Saefken, B. Smoothing parameter and model selection for general smooth models (with discussion). J. Am. Stat. Assoc. 2016, 111, 1548–1575. [Google Scholar] [CrossRef]
- Sardá-Espinosa, A. Time-Series Clustering in R Using the dtwclust Package. R J. 2019, 11, 22–43. [Google Scholar] [CrossRef]
- Bates, D.; Mächler, M.; Bolker, B.; Walker, S. Fitting Linear Mixed-Effects Models Using lme4. J. Stat. Softw. 2015, 67, 1–48. [Google Scholar] [CrossRef]
- Halekoh, U.; Højsgaard, S. A Kenward-Roger Approximation and Parametric Bootstrap Methods for Tests in Linear Mixed Models—The {R} Package {pbkrtest}. J. Stat. Softw. 2014, 59, 1–30. [Google Scholar] [CrossRef] [Green Version]
- Koller, M. robustlmm: An R Package for Robust Estimation of Linear Mixed-Effects Models. J. Stat. Softw. 2016, 75, 1–24. [Google Scholar] [CrossRef] [Green Version]
- Baayen, H.; Davidson, D.; Bates, D. Mixed-effects modeling with crossed random effects for subjects and items. J. Mem. Lang. 2008, 59, 390–412. [Google Scholar] [CrossRef] [Green Version]
- Girvan, M.; Newman, M.E.J. Community structure in social and biological networks. Proc. Natl. Acad. Sci. USA 2002, 99, 7821–7826. [Google Scholar] [CrossRef] [PubMed] [Green Version]
- Mantel, N. The detection of disease clustering and a generalized regression approach. Cancer Res. 1967, 27, 209–220. [Google Scholar] [PubMed]
- Pettersson, I.; Freire, R.; Nicol, C. Factors affecting ranging behaviour in commercial free-range hens. World’s Poult. Sci. J. 2016, 72, 137–150. [Google Scholar] [CrossRef] [Green Version]
- Richards, G.J.; Wilkins, L.J.; Knowles, T.G.; Booth, F.; Toscano, M.J.; Nicol, C.J.; Brown, S.N. Pop hole use by hens with different keel fracture status monitored throughout the laying period. Veter. Rec. 2012, 170, 494. [Google Scholar] [CrossRef]
- Lambton, S.; Knowles, T.; Yorke, C.; Nicol, C. The risk factors affecting the development of gentle and severe feather pecking in loose housed laying hens. Appl. Anim. Behav. Sci. 2010, 123, 32–42. [Google Scholar] [CrossRef]
- Sibanda, T.Z.; Walkden-Brown, S.W.; Kolakshyapati, M.; Dawson, B.; Schneider, D.; Welch, M.; Iqbal, Z.; Cohen-Barnhouse, A.; Morgan, N.K.; Boshoff, J.; et al. Flock use of the range is associated with the use of different components of a multi-tier aviary system in commercial free-range laying hens. Br. Poult. Sci. 2019, 61, 97–106. [Google Scholar] [CrossRef]
- Campbell, D.L.; Horton, B.J.; Hinch, G.N. Using Radio-Frequency Identification Technology to Measure Synchronised Ranging of Free-Range Laying Hens. Animals 2018, 8, 210. [Google Scholar] [CrossRef] [Green Version]
- Hartcher, K.M.; Hickey, K.A.; Hemsworth, P.H.; Cronin, G.M.; Wilkinson, S.J.; Singh, M. Relationships between range access as monitored by radio frequency identification technology, fearfulness, and plumage damage in free-range laying hens. Animal 2016, 10, 847–853. [Google Scholar] [CrossRef] [Green Version]
- Chielo, L.I.; Pike, T.; Cooper, J. Ranging behavior of commercial free-range laying hens. Animals 2016, 6, 28. [Google Scholar] [CrossRef]
- Sibanda, T.Z.; Kolakshyapati, M.; Welch, M.; Schneider, D.; Boshoff, J.; Ruhnke, I. Managing Free-Range Laying Hens—Part A: Frequent and Non-Frequent Range Users Differ in Laying Performance but Not Egg Quality. Animals 2020, 10, 991. [Google Scholar] [CrossRef] [PubMed]
- Weeks, C.; Nicol, C. Behavioural needs, priorities and preferences of laying hens. World’s Poult. Sci. J. 2006, 62, 296–307. [Google Scholar] [CrossRef]
- Réale, D.; Dingemanse, N.J. Personality and individual social specialisation. Soc. Behav. Genes Ecol. Evol. 2012, 16, 417–441. [Google Scholar] [CrossRef]
- Giraldeau, L.-A.; Dubois, F. Social foraging and the study of exploitative behavior. Adv. Study Behav. 2008, 38, 59–104. [Google Scholar]
- Morand-Ferron, J.; Giraldeau, L.-A.; Lefebvre, L. Wild Carib grackles play a producer scrounger game. Behav. Ecol. 2007, 18, 916–921. [Google Scholar] [CrossRef]
- Watters, J.V.; Sih, A. The mix matters: Behavioural types and group dynamics in water striders. Behaviour 2005, 142, 1417–1431. [Google Scholar] [CrossRef] [Green Version]
- Ward, A.J.W.; Thomas, P.; Hart, P.J.B.; Krause, J. Correlates of boldness in three-spined sticklebacks (Gasterosteus aculeatus). Behav. Ecol. Sociobiol. 2004, 55, 561–568. [Google Scholar] [CrossRef]
- Ballerini, M.; Cabibbo, N.; Candelier, R.; Cavagna, A.; Cisbani, E.; Giardina, I.; Orlandi, A.; Parisi, G.; Procaccini, A.; Viale, M.; et al. Empirical investigation of starling flocks: A benchmark study in collective animal behaviour. Anim. Behav. 2008, 76, 201–215. [Google Scholar] [CrossRef]
- Ballerini, M.; Cabibbo, N.; Candelier, R.; Cavagna, A.; Cisbani, E.; Giardina, I.; Lecomte, V.; Orlandi, A.; Parisi, G.; Procaccini, A.; et al. Interaction ruling animal collective behavior depends on topological rather than metric distance: Evidence from a field study. Proc. Natl. Acad. Sci. USA 2008, 105, 1232–1237. [Google Scholar] [CrossRef] [Green Version]
- Hemelrijk, C.K.; Hildenbrandt, H. Schools of fish and flocks of birds:their shape and internal structureby self-organization. Interface Focus 2012, 2, 726–737. [Google Scholar] [CrossRef] [Green Version]
- Nicol, C.J.; Caplen, G.; Edgar, J.; Browne, W.J. Associations between welfare indicators and environmental choice in laying hens. Anim. Behav. 2009, 78, 413–424. [Google Scholar] [CrossRef]
- Collias, N.E.; Collias, E.C. A Field Study of the Red Jungle Fowl in North-Central India. Ornithol. Appl. 1967, 69, 360–386. [Google Scholar] [CrossRef]
- Pagel, M.; Dawkins, M. Peck orders and group size in laying hens: ‘futures contracts’ for non-aggression. Behav. Process. 1997, 40, 13–25. [Google Scholar] [CrossRef]
- Estevez, I.; Keeling, L.J.; Newberry, R.C. Decreasing aggression with increasing group size in young domestic fowl. Appl. Anim. Behav. Sci. 2003, 84, 213–218. [Google Scholar] [CrossRef]
- Estevez, I.; Newberry, R.; Keeling, L. Dynamics of aggression in the domestic fowl. Appl. Anim. Behav. Sci. 2002, 76, 307–325. [Google Scholar] [CrossRef]
- Estevez, I.; Newberry, R.; Rayna, L. Broiler chickens: A tolerant social system? Etologia 1997, 5, 19–29. [Google Scholar]
- D’Eath, R.B.; Keeling, L.J. Social discrimination and aggression by laying hens in large groups: From peck orders to social tolerance. Appl. Anim. Behav. Sci. 2003, 84, 197–212. [Google Scholar] [CrossRef]
- Clutton-Brock, T.H. Review lecture: Mammalian mating systems. Proc. R. Soc. London. B. Biol. Sci. 1989, 236, 339–372. [Google Scholar]
- Crook, J.H. Social organization and the environment: Aspects of contemporary social ethology. Anim. Behav. 1970, 18, 197–209. [Google Scholar] [CrossRef]
- Emlen, S.T.; Oring, L.W. Ecology, sexual selection, and the evolution of mating systems. Science 1977, 197, 215–223. [Google Scholar] [CrossRef] [Green Version]
- MacDonald, D.W. The ecology of carnivore social behavior. Nature 1983, 301, 379–384. [Google Scholar] [CrossRef]


Publisher’s Note: MDPI stays neutral with regard to jurisdictional claims in published maps and institutional affiliations. |
© 2022 by the authors. Licensee MDPI, Basel, Switzerland. This article is an open access article distributed under the terms and conditions of the Creative Commons Attribution (CC BY) license (https://creativecommons.org/licenses/by/4.0/).
Share and Cite
Gómez, Y.; Berezowski, J.; Jorge, Y.A.; Gebhardt-Henrich, S.G.; Vögeli, S.; Stratmann, A.; Toscano, M.J.; Voelkl, B. Similarity in Temporal Movement Patterns in Laying Hens Increases with Time and Social Association. Animals 2022, 12, 555. https://0-doi-org.brum.beds.ac.uk/10.3390/ani12050555
Gómez Y, Berezowski J, Jorge YA, Gebhardt-Henrich SG, Vögeli S, Stratmann A, Toscano MJ, Voelkl B. Similarity in Temporal Movement Patterns in Laying Hens Increases with Time and Social Association. Animals. 2022; 12(5):555. https://0-doi-org.brum.beds.ac.uk/10.3390/ani12050555
Chicago/Turabian StyleGómez, Yamenah, John Berezowski, Yandy Abreu Jorge, Sabine G. Gebhardt-Henrich, Sabine Vögeli, Ariane Stratmann, Michael Jeffrey Toscano, and Bernhard Voelkl. 2022. "Similarity in Temporal Movement Patterns in Laying Hens Increases with Time and Social Association" Animals 12, no. 5: 555. https://0-doi-org.brum.beds.ac.uk/10.3390/ani12050555