
Sustained Effects of Muscle Calpain System Genotypes on Tenderness Phenotypes of South African Beef Bulls during Ageing up to 20 Days

 , and
, and
Abstract
:Simple Summary
Abstract
1. Introduction
2. Materials and Methods
2.1. Animals
2.2. Slaughter and Sampling
2.3. Tenderness
2.4. Muscle Calpain Protease System
2.5. DNA Extraction and Genotyping
2.6. Statistical Analyses
3. Results
3.1. Tenderness
3.2. SNP
3.2.1. cast_736
3.2.2. cast_763
3.2.3. capn2_780
3.2.4. capn1_184
3.2.5. capn1_187
3.2.6. capn1_4751
4. Discussion
5. Conclusions
Author Contributions
Funding
Institutional Review Board Statement
Informed Consent Statement
Data Availability Statement
Acknowledgments
Conflicts of Interest
References
- Culler, R.D.; Parrish, F.C.; Smith, G.C.; Cross, H.R. Relationship of myofibril fragmentation index to certain chemical, physical and sensory characteristics of bovine longissimus muscle. J. Food Sci. 1978, 43, 1177–1180. [Google Scholar] [CrossRef]
- Koohmaraie, M. The role of Ca2+-dependent proteases (calpains) in post mortem proteolysis and meat tenderness. Biochimie 1992, 74, 239–245. [Google Scholar] [CrossRef]
- Koohmaraie, M.; Seidemann, S.C.; Schollmeyer, J.E.; Dutson, T.R.; Crouse, J.D. Effect of post-mortem storage on Ca++-dependent proteases, their inhibitor and myofibril fragmentation. Meat Sci. 1987, 19, 187–196. [Google Scholar] [CrossRef]
- Morton, J.D.; Bickerstaffe, R.; Kent, M.P.; Dransfield, E.; Keeley, G.M. Calpain-calpastatin and toughness in M. longissimus from electrically stimulated lamb and beef carcasses. Meat Sci. 1999, 52, 71–79. [Google Scholar] [CrossRef]
- Geesink, G.H.; Kuchay, S.; Chishti, A.H.; Koohmaraie, M. µ-Calpain is essential for postmortem proteolysis of muscle proteins. J. Anim. Sci. 2006, 84, 2834–2840. [Google Scholar] [CrossRef] [Green Version]
- Koohmaraie, M.; Geesink, G.H. Contribution of postmortem muscle biochemistry to the delivery of consistent meat quality with particular focus on the calpain system. Meat Sci. 2006, 74, 34–43. [Google Scholar] [CrossRef] [Green Version]
- Colle, M.J.; Doumit, M.E. Effect of extended aging on calpain-1 and -2 activity in beef longissimus lumborum and semimembranosus muscles. Meat Sci. 2017, 131, 142–145. [Google Scholar] [CrossRef]
- Lian, T.; Wang, L.; Liu, Y. A new insight into the role of calpains in post-mortem meat tenderization in domestic animals: A review. Asian-Australas. J. Anim. Sci. 2013, 26, 443–454. [Google Scholar] [CrossRef] [Green Version]
- Watanabe, A.; Daly, C.C.; Devine, C.E. The effects of the ultimate pH of meat on tenderness changes during ageing. Meat Sci. 1996, 42, 67–78. [Google Scholar] [CrossRef]
- O’Connor, S.F.; Tatum, J.D.; Wulf, D.M.; Green, R.D.; Smith, G.C. Genetic effects on beef tenderness in Bos indicus composite and Bos taurus cattle. J. Anim. Sci. 1997, 75, 1822–1830. [Google Scholar] [CrossRef]
- Warner, R.D.; McDonnell, C.K.; Bekhit, A.E.D.; Claus, J.; Vaskoska, R.; Sikes, A.; Dunshea, F.R.; Ha, M. Systematic review of emerging and innovative technologies for meat tenderisation. Meat Sci. 2017, 132, 72–89. [Google Scholar] [CrossRef] [PubMed]
- Dransfield, E. Optimisation of tenderisation, ageing and tenderness. Meat Sci. 1994, 36, 105–121. [Google Scholar] [CrossRef]
- Taylor, J.F.; McKay, S.D.; Rolf, M.M.; Ramey, H.R.; Decker, J.E.; Schnabel, R.D. Genomic selection in beef cattle. In Bovine Genomics; Womack, J., Ed.; John Wiley & Sons, Incorporated: Hoboken, NJ, USA, 2012; pp. 211–233. ISBN 9781118301715. [Google Scholar]
- Allais, S.; Journaux, L.; Levéziel, H.; Payet-Duprat, N.; Raynaud, P.; Hocquette, J.F.; Lepetit, J.; Rousset, S.; Denoyelle, C.; Bernard-Capel, C.; et al. Effects of polymorphisms in the calpastatin and µ-calpain genes on meat tenderness in 3 French beef breeds. J. Anim. Sci. 2011, 89, 1–11. [Google Scholar] [CrossRef] [Green Version]
- Madilindi, M.A.; Banga, C.B.; Bhebhe, E.; Sanarana, Y.P.; Nxumalo, K.S.; Taela, M.G.; Magagula, B.S.; Mapholi, N.O. Genetic diversity and relationships among three Southern African Nguni cattle populations. Trop. Anim. Health Prod. 2020, 52, 753–762. [Google Scholar] [CrossRef] [PubMed]
- Makina, S.O.; Taylor, J.F.; Van Marle-Köster, E.; Muchadeyi, F.C.; Makgahlela, M.L.; MacNeil, M.D.; Maiwashe, A. Extent of linkage disequilibrium and effective population size in four South African Sanga cattle breeds. Front. Genet. 2015, 6, 337. [Google Scholar] [CrossRef] [Green Version]
- Wang, M.D.; Dzama, K.; Hefer, C.A.; Muchadeyi, F.C. Genomic population structure and prevalence of copy number variations in South African Nguni cattle. BMC Genom. 2015, 16, 894. [Google Scholar] [CrossRef] [Green Version]
- Makina, S.O.; Muchadeyi, F.C.; Van Marle-Köster, E.; MacNeill, M.D.; Maiwashe, A. Genetic diversity and population structure among six cattle breeds in South Africa using a whole genome SNP panel. Front. Genet. 2014, 5, 333. [Google Scholar] [CrossRef] [Green Version]
- Makina, S.O.; Muchadeyi, F.C.; Van Marle-Köster, E.; Taylor, J.F.; Makgahlela, M.L.; Maiwashe, A. Genome-wide scan for selection signatures in six cattle breeds in South Africa. Genet. Sel. Evol. 2015, 47, 92. [Google Scholar] [CrossRef] [Green Version]
- Qwabe, S.O.; Van Marle-Köster, E.; Maiwashe, A.; Muchadeyi, F.C. Evaluation of the BovineSNP50 genotyping array in four South African cattle populations. South Afr. J. Anim. Sci. 2013, 43, 64–67. [Google Scholar] [CrossRef]
- Bosman, L.; Van der Westhuizen, R.R.; Visser, C.; Van Marle-Köster, E. Influence of population structure on the compilation of the Bonsmara genomic reference population. Adv. Anim. Biosci. 2017, 8, s45–s47. [Google Scholar] [CrossRef]
- Van der Westhuizen, R.R.; Van Marle-Köster, E.; Theron, H.E.; Van der Westhuizen, J. Reference population for South African Bonsmara cattle. In Proceedings of the 10th World Congress of Genetics Applied to Livestock Production, Vancouver, BC, Canada, 17–22 August 2014; American Society of Animal Science (ASAS): Champaign, IL, USA, 2014; p. 498. [Google Scholar]
- Zwane, A.A.; Maiwashe, A.; Makgahlela, M.L.; Choudhury, A.; Taylor, J.F.; Van Marle-Köster, E. Genome-wide identification of breed-informative single-nucleotide polymorphisms in three South African indigenous cattle breeds. S. Afr. J. Anim. Sci. 2016, 46, 302–312. [Google Scholar] [CrossRef]
- Mapholi, N.O.; Maiwashe, A.; Matika, O.; Riggio, V.; Bishop, S.C.; MacNeil, M.D.; Banga, C.; Taylor, J.F.; Dzama, K. Genome-wide association study of tick resistance in South African Nguni cattle. Ticks Tick-Borne Dis. 2016, 7, 487–497. [Google Scholar] [CrossRef] [PubMed]
- Zwane, A.A.; Schnabel, R.D.; Hoff, J.; Choudhury, A.; Makgahlela, M.L.; Maiwashe, A.; Van Marle-Köster, E.; Taylor, J.F. Genome-wide SNP discovery in indigenous cattle breeds of South Africa. Front. Genet. 2019, 10, 273. [Google Scholar] [CrossRef] [PubMed]
- Frylinck, L.; Van Wyk, G.L.; Smith, T.P.L.; Strydom, P.E.; Van Marle-Köster, E.; Webb, E.C.; Koohmaraie, M.; Smith, M.F. Evaluation of biochemical parameters and genetic markers for association with meat tenderness in South African feedlot cattle. Meat Sci. 2009, 83, 657–665. [Google Scholar] [CrossRef] [PubMed]
- Raza, S.H.A.; Khan, S.; Amjadi, M.; Abdelnour, S.A.; Ohran, H.; Alanazi, K.M.; El-Hack, M.E.A.; Taha, A.E.; Khan, R.; Gong, C.; et al. Genome-wide association studies reveal novel loci associated with carcass and body measures in beef cattle. Arch. Biochem. Biophys. 2020, 694, 108543. [Google Scholar] [CrossRef]
- Williams, J.L.; Dunner, S.; Valentini, A.; Mazza, R.; Amarger, V.; Checa, M.L.; Crisà, A.; Razzaq, N.; Delourme, D.; Grandjean, F.; et al. Discovery, characterization and validation of single nucleotide polymorphisms within 206 bovine genes that may be considered as candidate genes for beef production and quality. Anim. Genet. 2009, 40, 486–491. [Google Scholar] [CrossRef]
- Mullen, A.M.; Stapleton, P.C.; Corcoran, D.; Hamill, R.M.; White, A. Understanding meat quality through the application of genomic and proteomic approaches. Meat Sci. 2006, 74, 3–16. [Google Scholar] [CrossRef]
- Warner, R.D.; Greenwood, P.L.; Pethick, D.W.; Ferguson, D.M. Genetic and environmental effects on meat quality. Meat Sci. 2010, 86, 171–183. [Google Scholar] [CrossRef] [Green Version]
- Sierra, V.; Fernández-Suárez, V.; Castro, P.; Osoro, K.; Vega-Naredo, I.; García-Macía, M.; Rodríguez-Colunga, P.; Coto-Montes, A.; Oliván, M. Identification of biomarkers of meat tenderisation and its use for early classification of Asturian beef into fast and late tenderising meat. J. Sci. Food Agric. 2012, 92, 2727–2740. [Google Scholar] [CrossRef]
- Burrow, H.M.; Moore, S.S.; Johnston, D.J.; Barendse, W.; Bindon, B.M. Quantitative and molecular genetic influences on properties of beef: A review. Aust. J. Exp. Agric. 2001, 41, 893–919. [Google Scholar] [CrossRef] [Green Version]
- Minick, J.A.; Dikeman, M.E.; Pollak, E.J.; Wilson, D.E. Heritability and correlation estimates of Warner-Bratzler shear force and carcass traits from Angus-, Charolais-, Hereford-, and Simmental-sired cattle. Can. J. Anim. Sci. 2004, 84, 599–609. [Google Scholar] [CrossRef]
- Smith, T.; Domingue, J.D.; Paschal, J.C.; Franke, D.E.; Bidner, T.D.; Whipple, G. Genetic parameters for growth and carcass traits of Brahman steers. J. Anim. Sci. 2007, 85, 1377–1384. [Google Scholar] [CrossRef] [PubMed]
- Iso-Touru, T.; Pesonen, M.; Fischer, D.; Huuskonen, A.; Sironen, A. The effect of CAPN1 and CAST gene variations on meat quality traits in Finnish Aberdeen Angus and Nordic Red Cattle populations. Agric. Food Sci. 2018, 27, 227–231. [Google Scholar] [CrossRef]
- Guillocheau, G.; Hou, A.E.; Meerssemann, C.; Esquerré, D.; Rebours, E.; Letaief, R.; Simao, M.; Hypolite, N.; Bourneuf, E.; Bruneau, N.; et al. Survey of allele specific expression in bovine muscle. Sci. Rep. 2019, 9, 4297. [Google Scholar] [CrossRef] [PubMed] [Green Version]
- Bennett, G.L.; Tait, R.G., Jr.; Shackelford, S.D.; Wheeler, T.L.; King, D.A.; Casas, E.; Smith, T.P.L. Enhanced estimates of carcass and meat quality effects for polymorphisms in myostatin and µ-calpain genes. J. Anim. Sci. 2019, 97, 569–577. [Google Scholar] [CrossRef]
- Morris, C.A.; Cullen, N.G.; Hickey, S.M.; Dobbie, P.M.; Veenvliet, B.A.; Manley, T.R.; Pitchford, W.S.; Kruk, Z.A.; Bottema, C.D.K.; Wilson, T. Genotypic effects of calpain 1 and calpastatin on the tenderness of cooked M. longissimus dorsi steaks from Jersey X Limousin, Angus and Hereford-cross cattle. Anim. Genet. 2006, 37, 411–414. [Google Scholar] [CrossRef]
- Iguácel, L.P.; Calvo, J.H.; Casasús, I.; Serrano, M.; Ripoll, G.; Sarto, P.; Villalba, D.; Blanco, M. Association of two single nucleotide polymorphisms in the calpastatin gene with tenderness under varying lengths of meat ageing in two native Spanish cattle breeds. Livest. Sci. 2019, 230, 103820. [Google Scholar] [CrossRef]
- Wang, Y.; Zhang, F.; Mukiibi, R.; Chen, L.; Vinsky, M.; Plastow, G.; Basarab, J.; Stothard, P.; Li, C. Genetic architecture of quantitative traits in beef cattle revealed by genome wide association studies of imputed whole genome sequence variants: II: Carcass merit traits. BMC Genom. 2020, 21, 38. [Google Scholar] [CrossRef]
- Van Marle-Köster, E.; Visser, C.; Makgahlela, M.; Cloete, W.P. Genomic technologies for food security: A review of challenges and opportunities in Southern Africa. Food Res. Int. 2015, 76, 971–979. [Google Scholar] [CrossRef]
- Grigoletto, L.; Ferraz, J.B.S.; Oliveira, H.R.; Eler, J.P.; Bussiman, F.O.; Abreu Silva, B.C.; Baldi, F.; Brito, L.F. Genetic architecture of carcass and meat quality traits in Montana Tropical® composite beef cattle. Front. Genet. 2020, 11, 123. [Google Scholar] [CrossRef] [Green Version]
- Marín-Garzón, N.A. Genome-wide association study identified genomic regions and putative candidate genes affecting meat color traits in Nellore cattle. Meat Sci. 2020, 171, 108288. [Google Scholar] [CrossRef] [PubMed]
- Bolormaa, S.; Pryce, J.E.; Kemper, K.; Savin, K.; Hayes, B.J.; Barendse, W.; Zhang, Y.; Reich, C.M.; Mason, B.A.; Bunch, R.J.; et al. Accuracy of prediction of genomic breeding values for residual feed intake and carcass and meat quality traits in Bos taurus, Bos indicus, and composite beef cattle. J. Anim. Sci. 2013, 91, 3088–3104. [Google Scholar] [CrossRef] [Green Version]
- Pinto, L.F.B.; Ferraz, J.B.S.; Meirelles, F.V.; Eler, J.P.; Rezende, F.M.; Carvalho, M.E.; Almeida, H.B.; Silva, R.C.G. Association of SNPs on CAPN1 and CAST genes with tenderness in Nellore cattle. Genet. Mol. Res. 2010, 9, 1431–1442. [Google Scholar] [CrossRef] [PubMed]
- Castro, S.; Rís, M.; Ortiz, Y.; Manrique, C.; Jiménez, A.; Ariza, F. Association of single nucleotide polymorphisms in CAPN1, CAST and MB genes with meat color of Brahman and crossbreed cattle. Meat Sci. 2016, 117, 44–49. [Google Scholar] [CrossRef] [PubMed]
- Mazzucco, J.P.; Melucci, L.M.; Villarreal, E.L.; Mezzadra, C.A.; Soria, L.; Corva, P.; Motter, M.M.; Schor, A.; Miquel, M.C. Effect of ageing and µ-calpain markers on meat quality from Brangus steers finished on pasture. Meat Sci. 2010, 86, 878–882. [Google Scholar] [CrossRef] [PubMed]
- Gruber, S.L.; Tatum, J.D.; Engle, T.E.; Chapman, P.L.; Enns, R.M.; Belk, K.E.; Smith, G.C. Effects of genetic markers and implant strategy on longissimus and gluteus muscle tenderness of calf-fed steers and heifers. J. Anim. Sci. 2011, 89, 1401–1411. [Google Scholar] [CrossRef] [PubMed]
- Chang, L.Y.; Pitchford, W.S.; Bottema, C.D.K. Modeling tenderness for genetic and quantitative trait loci analyses. J. Anim. Sci. 2014, 92, 39–47. [Google Scholar] [CrossRef]
- Schenkel, F.S.; Miller, S.P.; Jiang, Z.; Mandell, I.B.; Ye, X.; Li, H.; Wilton, J.W. Association of a single nucleotide polymorphism in the calpastatin gene with carcass and meat quality traits of beef cattle. J. Anim. Sci. 2006, 84, 291–299. [Google Scholar] [CrossRef]
- Government Notice No. R. 1621 of 13 July 1990. Agricultural Products Standards Act (119/1990): To Provide for Control over the Sale and Export of Certain Agricultural Products and Other Related Products; and for Matters Connected Therewith; Government Gazette No. 12641; Department of Agriculture, Forestry and Fisheries (DAFF): Pretoria, South Africa, 1990; Volume 301, pp. 1–29.
- Government Notice No. R. 55 of 30 January 2015. Agricultural Product Standards Act (119/1990): Regulations Regarding the Classification and Marking of Meat Intended for Sale in the Republic of South Africa; Government Gazette No. 38431; Department of Agriculture, Forestry and Fisheries (DAFF): Pretoria, South Africa, 2015; Volume 595, pp. 3–29.
- Wheeler, T.L.; Shackelford, S.D.; Koohmaraie, M. Standardizing collection and interpretation of Warner-Bratzler shear force and sensory tenderness data. In Proceedings of the 50th Annual Reciprocal Meat Science Conference; United States Department of Agriculture (USDA): St, Lincoln, NE, USA, 1997; pp. 68–77. [Google Scholar]
- AMSA. AMSA Research Guidelines for Cookery, Sensory Evaluation, and Instrumental Tenderness Measurements of Meat, 2nd ed.; American Meat Science Association: Kearney, MO, USA, 2016; pp. 1–106. [Google Scholar]
- Heinze, P.H.; Brüggemann, D. Ageing of beef: Influence of two ageing methods on sensory properties and myofibrillar proteins. Sci. Des Aliment. 1994, 14, 387–399. [Google Scholar]
- Geesink, G.H.; Koohmaraie, M. Effect of calpastatin on degradation of myofibrillar proteins by µ-calpain under post-mortem conditions. J. Anim. Sci. 1999, 77, 2685–2692. [Google Scholar] [CrossRef]
- Dransfield, E. Calpains from thaw rigor muscle. Meat Sci. 1996, 43, 311–320. [Google Scholar] [CrossRef]
- NCBI National Center for Biotechnology Information. Genome Data Viewer: Bos Taurus Assembly UMD_3.1.1; NCBI National Center for Biotechnology Information: Bethesda, ML, USA, 2021. [Google Scholar]
- Purcell, S.; Neale, B.; Todd-Brown, K.; Thomas, L.; Ferreira, M.A.R.; Bender, D.; Maller, J.; Sklar, P.; de Bakker, P.I.W.; Daly, M.J.; et al. PLINK: A tool set for whole-genome association and population-based linkage analyses. Am. J. Hum. Genet. 2007, 81, 559–575. [Google Scholar] [CrossRef] [PubMed] [Green Version]
- Yang, J.; Zaitlen, N.A.; Goddard, M.E.; Visscher, P.M.; Price, A.L. Advantages and pitfalls in the application of mixed-model association methods. Nat. Genet. 2014, 46, 100–106. [Google Scholar] [CrossRef] [PubMed] [Green Version]
- Yang, J.; Lee, S.H.; Goddard, M.E.; Visscher, P.M. GCTA: A Tool for Genome-wide Complex Trait Analysis. Am. J. Hum. Genet. 2011, 88, 76–82. [Google Scholar] [CrossRef] [PubMed] [Green Version]
- Benjamini, Y.; Hochberg, Y. Controlling the false discovery rate: A practical and powerful approoach to multiple testing. J. R. Stat. Soc. Ser. B (Methodol.) 1995, 57, 289–300. [Google Scholar] [CrossRef]
- SAS SAS/STAT User’s Guide, version 9.22; Statistical Analysis System Institute Inc.: Cary, NC, USA, 2010.
- Barrett, J.C.; Fry, B.; Maller, J.; Daly, M.J. Haploview: Analysis and visualization of LD and haplotype maps. Bioinformatics 2005, 21, 263–265. [Google Scholar] [CrossRef] [PubMed] [Green Version]
- Gabriel, S.B.; Schaffner, S.F.; Nguyen, H.; Moore, J.M.; Roy, J.; Blumenstiel, B.; Higgins, J.; DeFelice, M.; Lochner, A.; Faggart, M.; et al. The structure of haplotype blocks in the human genome. Science 2002, 296, 2225–2229. [Google Scholar] [CrossRef] [Green Version]
- Lewontin, R.C. The interaction of selection and linkage. I. General considerations; Heterotic models. Genetics 1964, 49, 49–67. [Google Scholar] [CrossRef]
- Lewontin, R.C. The detection of linkage disequilibrium in molecular sequence data. Genetics 1995, 140, 377–388. [Google Scholar] [CrossRef]
- Tizioto, P.C.; Decker, J.E.; Taylor, J.F.; Schnabel, R.D.; Mudadu, M.A.; Silva, F.L.; Mourão, G.B.; Coutinho, L.L.; Tholon, P.; Sonstegard, T.S.; et al. Genome scan for meat quality traits in Nelore beef cattle. Physiol. Genom. 2013, 45, 1012–1020. [Google Scholar] [CrossRef] [Green Version]
- Meuwissen, T.H.E.; Hayes, B.J.; Goddard, M.E. Prediction of total genetic value using genome-wide dense marker maps. Genetics 2001, 157, 1819–1829. [Google Scholar] [CrossRef] [PubMed]
- Wientjes, Y.C.J.; Veerkamp, R.F.; Calus, M.P.L. The effect of linkage disequilibrium and family relationships on the reliability of genomic prediction. Genetics 2013, 193, 621–631. [Google Scholar] [CrossRef] [PubMed] [Green Version]
- Wright, S. Genic and organismic selection. Evolution 1980, 34, 825–843. [Google Scholar] [CrossRef] [PubMed]
- Williams, J.L. The use of marker-assisted selection in animal breeding and biotechnology. Rev. Sci. Et Tech.-Off. Int. Des Epizoot. 2005, 24, 379–391. [Google Scholar] [CrossRef]
- McKay, S.D.; Schnabel, R.D.; Murdoch, B.M.; Matukumalli, L.K.; Aerts, J.; Coppieters, W.; Crews, D.; Neto, E.D.; Gill, C.A.; Gao, C.; et al. Whole genome linkage disequilibrium maps in cattle. BMC Genet. 2007, 8, 74. [Google Scholar] [CrossRef] [PubMed] [Green Version]
- Pérez O’Brien, A.M.; Mészáros, G.; Utsunomiya, Y.T.; Sonstegard, T.S.; Garcia, J.F.; Van Tassell, C.P.; Carvalheiro, R.; da Silva, M.V.B.; Sölkner, J. Linkage disequilibrium levels in Bos indicus and Bos taurus cattle using medium and high density SNP chip data and different minor allele frequency distributions. Livest. Sci. 2014, 166, 121–132. [Google Scholar] [CrossRef]
- White, K.L. Novel Traits for Genetic Selection in Gelbvieh Influenced Cattle. Ph.D. Thesis, Kansas State University Department of Animal Sciences & Industry College of Agriculture Kansas State University, Manhattan, KS, USA, 2020. [Google Scholar]
- McClure, M.C.; Ramey, H.R.; Rolf, M.M.; McKay, S.D.; Decker, J.E.; Chapple, R.H.; Kim, J.W.; Taxis, T.M.; Weaber, R.L.; Schnabel, R.D.; et al. Genome-wide association analysis for quantitative trait loci influencing Warner-Bratzler shear force in five taurine cattle breeds. Anim. Genet. 2012, 43, 662–673. [Google Scholar] [CrossRef] [Green Version]
- Bolormaa, S.; Pryce, J.E.; Kemper, K.E.; Hayes, B.J.; Zhang, Y.; Tier, B.; Barendse, W.; Reverter, A.; Goddard, M.E. Detection of quantitative trait loci in Bos indicus and Bos taurus cattle using genome-wide association studies. Genet. Sel. Evol. 2013, 45, 43. [Google Scholar] [CrossRef] [Green Version]
- Lee, S.-H.; Kim, S.-C.; Chai, H.-H.; Cho, S.-H.; Kim, H.-C.; Lim, D.; Choi, B.-H.; Dang, C.-G.; Sharma, A.; Gondro, C.; et al. Mutations in calpastatin and µ-calpain are associated with meat tenderness, flavor and juiciness in Hanwoo (Korean cattle): Molecular modeling of the effects of substitutions in the calpastatin/µ-calpain complex. Meat Sci. 2014, 96, 1501–1508. [Google Scholar] [CrossRef]
- Barendse, W. Haplotype analysis improved evidence for candidate genes for intramuscular fat percentage from a genome wide association study of cattle. PLoS ONE 2011, 6, e29601.1–e29601.13. [Google Scholar] [CrossRef] [Green Version]
- Curi, R.A.; Chardulo, L.A.L.; Giusti, J.; Silveira, A.C.; Martins, C.L.; de Oliveira, H.N. Assessment of GH1, CAPN1 and CAST polymorphisms as markers of carcass and meat traits in Bos indicus and Bos taurus-Bos indicus cross beef cattle. Meat Sci. 2010, 86, 915–920. [Google Scholar] [CrossRef] [PubMed]
- Johnston, D.J.; Graser, H.-U. Estimated gene frequencies of GeneSTAR markers and their size of effects on meat tenderness, marbling, and feed efficiency in temperate and tropical beef cattle breeds across a range of production systems. J. Anim. Sci. 2010, 88, 1917–1935. [Google Scholar] [CrossRef] [Green Version]
- King, D.A.; Shackelford, S.D.; McDaneld, T.G.; Kuehn, L.A.; Kemp, C.M.; Smith, T.P.L.; Wheeler, T.L.; Koohmaraie, M. Associations of genetic markers in cattle receiving differing implant protocols. J. Anim. Sci. 2012, 90, 2410–2423. [Google Scholar] [CrossRef] [PubMed]
- Costello, S.; O’Doherty, E.; Troy, D.J.; Ernst, C.W.; Kim, K.S.; Stapleton, P.; Sweeney, T.; Mullen, A.M. Association of polymorphisms in the calpain I, calpain II and growth hormone genes with tenderness in bovine M. longissimus dorsi. Meat Sci. 2007, 75, 551–557. [Google Scholar] [CrossRef] [PubMed]
- White, S.N.; Casas, E.; Wheeler, T.L.; Shackelford, S.D.; Koohmaraie, M.; Riley, D.G.; Chase, C.C., Jr.; Johnson, D.D.; Keele, J.W.; Smith, T.P.L. A new single nucleotide polymorphism in CAPN1 extends the current tenderness marker test to include cattle of Bos indicus, Bos taurus, and crossbred descent. J. Anim. Sci. 2005, 83, 2001–2008. [Google Scholar] [CrossRef] [PubMed]
- Smith, T.; Thomas, M.G.; Bidner, T.D.; Paschal, J.C.; Franke, D.E. Single nucleotide polymorphisms in Brahman steers and their association with carcass and tenderness traits. Genet. Mol. Res. 2009, 8, 39–46. [Google Scholar] [CrossRef] [PubMed]
- Ono, Y.; Sorimachi, H. Calpains—An elaborate proteolytic system. Biochim. Biophys. Acta (BBA)-Proteins Proteom. 2012, 1824, 224–236. [Google Scholar] [CrossRef] [Green Version]
- Spinozzi, S.; Albini, S.; Best, H.; Richard, I. Calpains for dummies: What you need to know about the calpain family. Biochim. Biophys. Acta (BBA)-Proteins Proteom. 2021, 1869, 140616. [Google Scholar] [CrossRef]


| All Breeds (n = 166) | Angus (n = 24) | Bonsmara (n = 35) | Brahman (n = 35) | Charolais (n = 34) | Nguni (n = 35) | # p-Value | ||
|---|---|---|---|---|---|---|---|---|
| BW (kg) | 388 ± 4.26 | 422 ± 9.65 a | 399 ± 4.26 b | 393 ± 7.44 b | 423 ± 5.39 a | 308 ± 3.39 c | 0.0001 | |
| 35dADG (kg/d) | 1.54 ± 0.04 | 1.81 ± 0.08 b | 1.62 ± 0.05 ab | 1.37 ± 0.06 a | 1.88 ± 0.09 c | 1.21 ± 0.07 c | 0.0001 | |
| HCW (kg) | 219 ± 2.46 | 234 ± 5.36 ab | 223 ± 2.87 b | 226 ± 4.67 b | 240 ± 3.44 a | 174 ± 2.07 c | 0.0001 | |
| CCW (kg) | 215 ± 2.42 | 229 ± 5.29 ab | 218 ± 2.82 b | 221 ± 4.67 b | 234 ± 3.34 a | 170 ± 2.09 c | 0.0001 | |
| Dressing% | 56.53 ± 0.15 | 55.62 ± 0.33 b | 55.96 ± 0.33 b | 57.44 ± 0.24 a | 56.64 ± 0.36 ab | 56.44 ± 0.34 ab | 0.0004 | |
| Mass Loss (%) | 2.18 ± 0.03 | 2.16 ± 0.07 | 2.30 ± 0.06 | 2.22 ± 0.08 | 2.25 ± 0.07 | 2.14 ± 0.09 | 0.0564 | |
| EMA (mm2) | 6 084 ± 64 | 5 853 ± 127 cd | 6 364 ± 134 ab | 5 922 ± 121 bc | 6 647 ± 127 a | 5 444 ± 120 d | 0.0001 | |
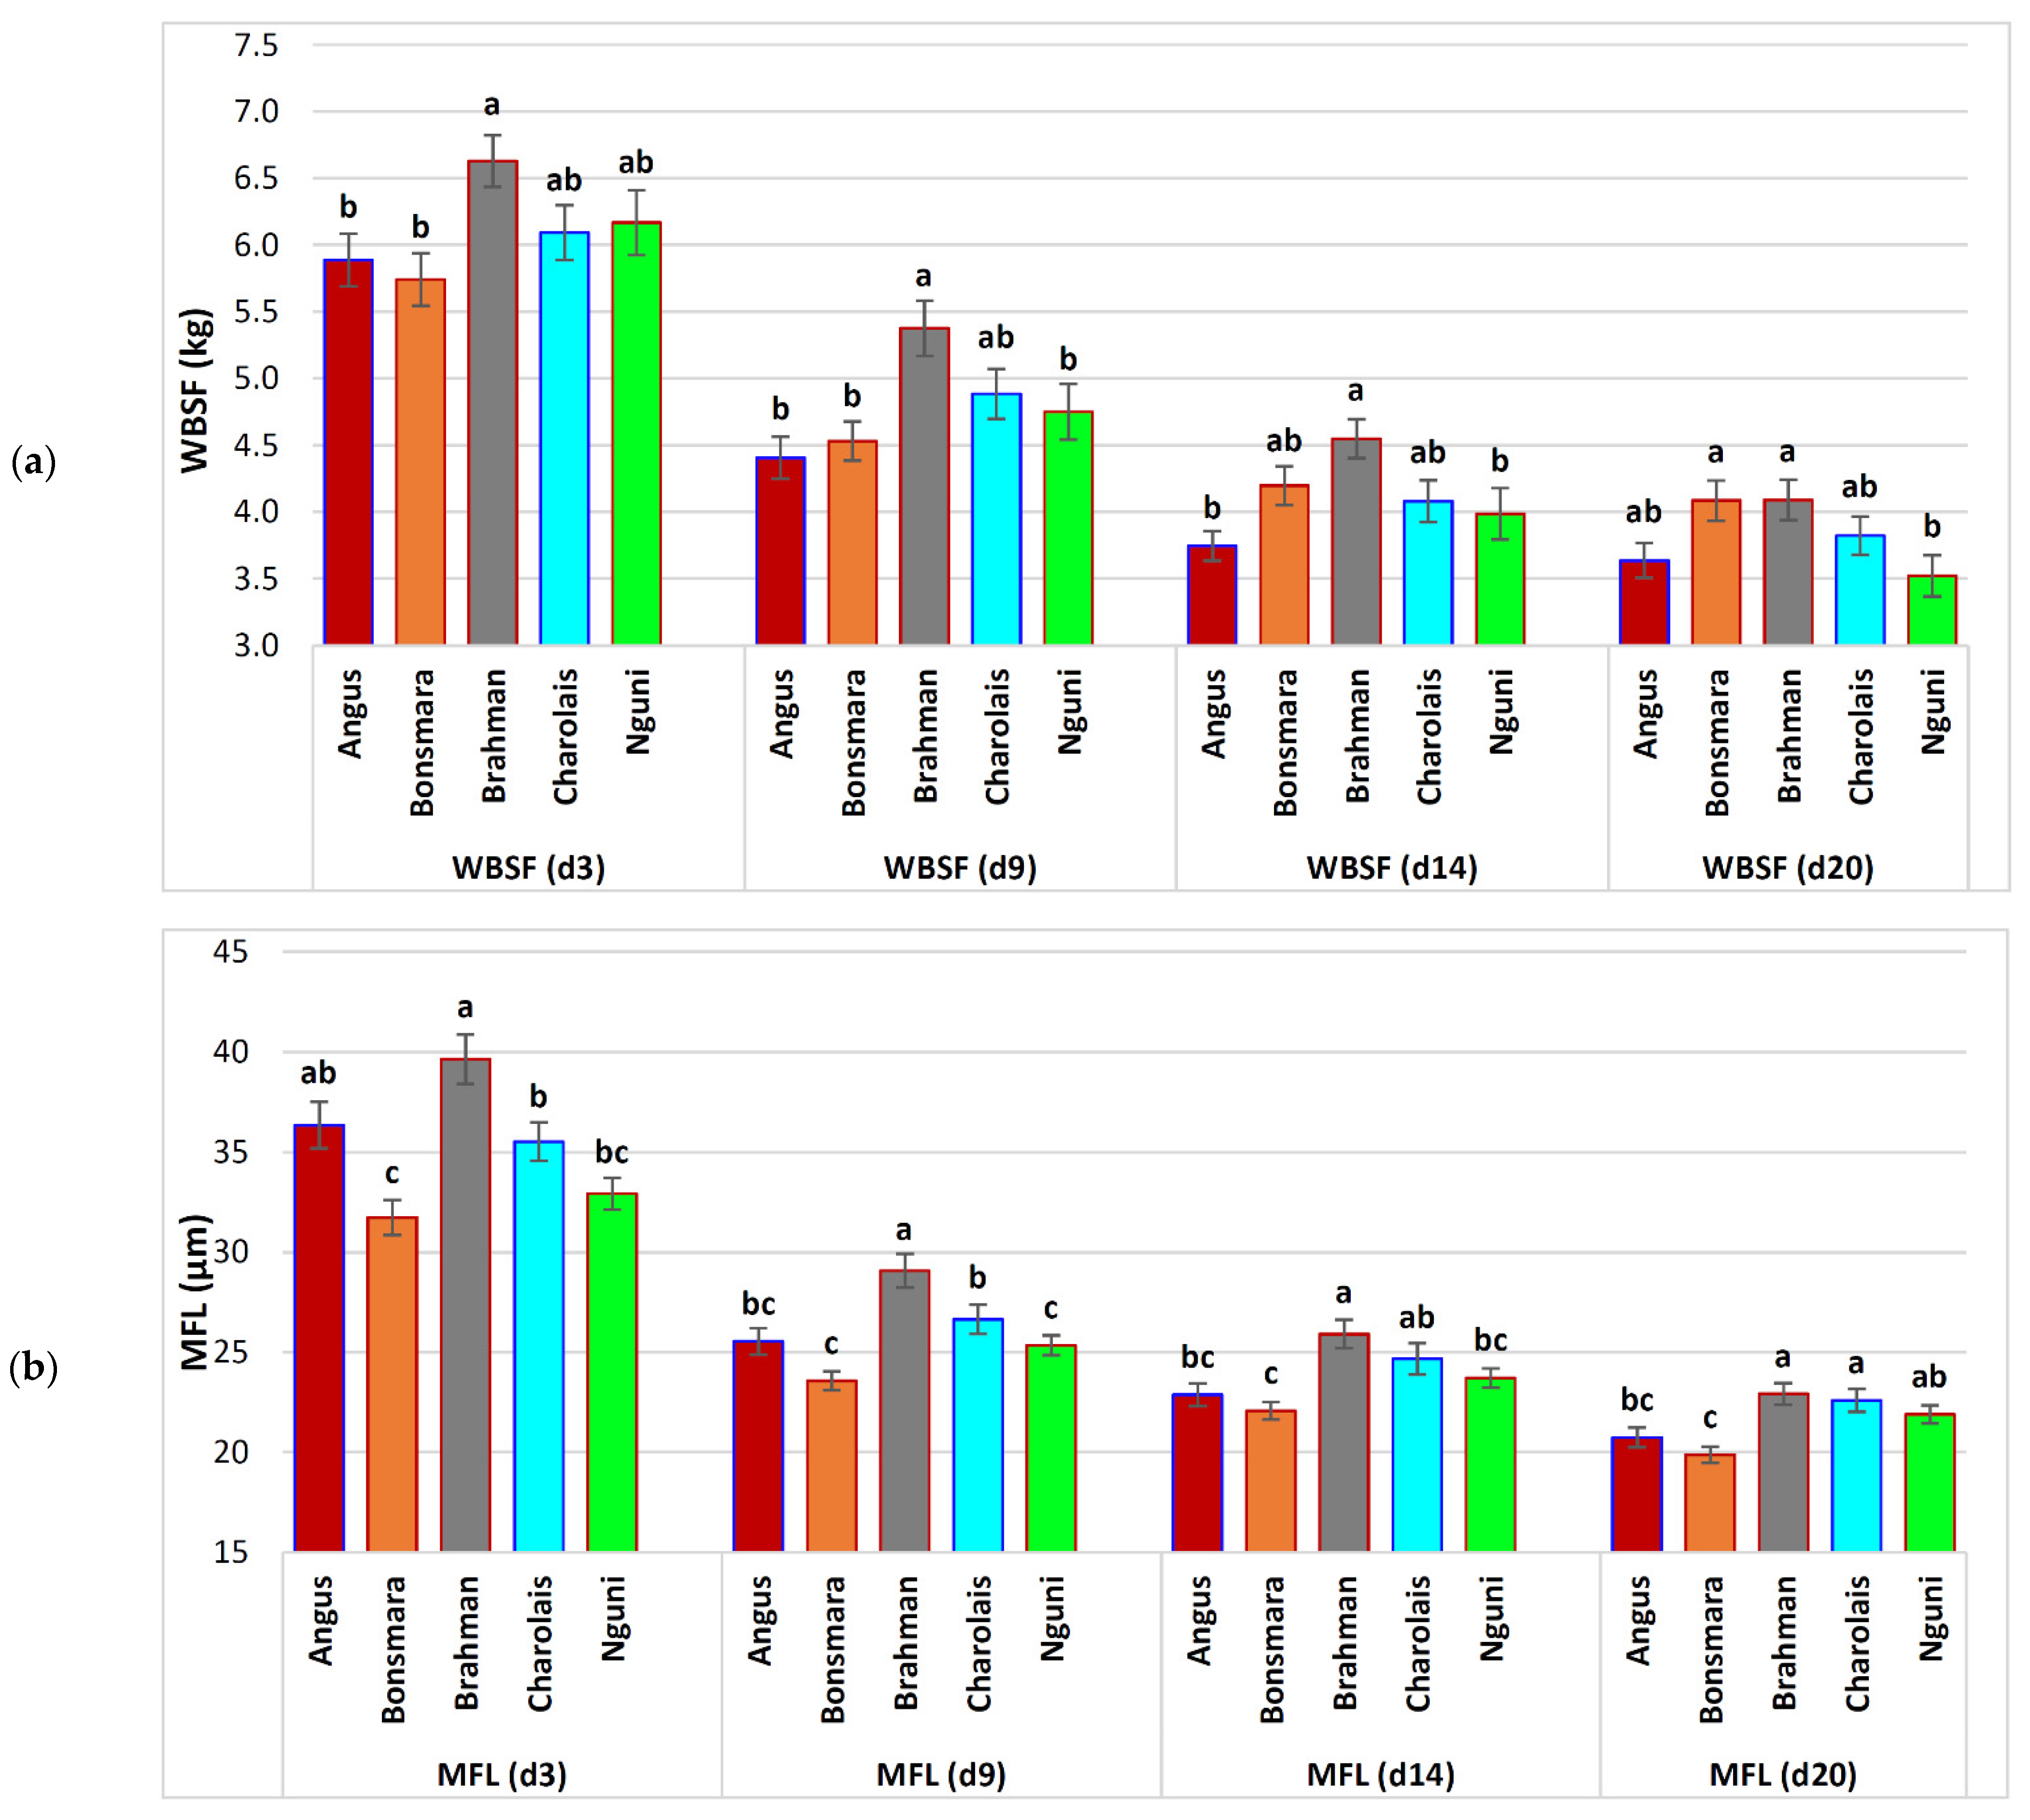
| WBSF (d 3) | 6.15 ± 0.09 | 5.89 ± 0.20 b | 5.74 ± 0.20 b | 6.63 ± 0.19 a | 6.09 ± 0.21 ab | 6.17 ± 0.24 ab | 0.0122 | |
| WBSF (d 9) | 4.83 ± 0.08 | −21.4% 1 | 4.41 ± 0.16 b | 4.53 ± 0.15 b | 5.38 ± 0.21 a | 4.88 ± 0.19 ab | 4.75 ± 0.21 b | 0.0006 |
| WBSF (d 14) | 4.17 ± 0.07 | −32.3% 1 | 3.75 ± 0.11 b | 4.20 ± 0.15 ab | 4.55 ± 0.15 a | 4.08 ± 0.16 ab | 3.99 ± 0.19 b | 0.0028 |
| WBSF (d 20) | 3.87 ± 0.07 | −37.1% 1 | 3.64 ± 0.13 ab | 4.08 ± 0.15 a | 4.09 ± 0.15 a | 3.82 ± 0.14 ab | 3.52 ± 0.15 b | 0.0022 |
| %ΔWBSF 2 | −38.3% | −28.9% | −38.3% | −37.3% | −42.9% | |||
| MFL (d 3) | 35.51 ± 0.48 | 36.35 ± 1.17 ab | 31.74 ± 0.87 c | 39.65 ± 1.23 a | 35.53 ± 0.95 b | 32.93 ± 0.79 bc | 0.0001 | |
| MFL (d 9) | 26.21 ± 0.31 | −26.2% 1 | 25.55 ± 0.66 bc | 23.57 ± 0.47 c | 29.08 ± 0.84 a | 26.65 ± 0.73 b | 25.35 ± 0.49 c | 0.0001 |
| MFL (d 14) | 23.92 ± 0.28 | −32.6% 1 | 22.87 ± 0.57 bc | 22.07 ± 0.44 c | 25.91 ± 0.71 a | 24.67 ± 0.79 ab | 23.72 ± 0.48 bc | 0.0001 |
| MFL (d 20) | 21.66 ± 0.23 | −39.0% 1 | 20.74 ± 0.49 bc | 19.88 ± 0.40 c | 22.93 ± 0.54 a | 22.60 ± 0.57 a | 21.90 ± 0.45 ab | 0.0001 |
| %ΔMFL 2 | −42.9% | −37.4% | −42.2% | −36.4% | −33.5% |
| cast_736 | *GG (n = 19) | GT (n = 54) | TT (n = 93) | p-Value (Simplified) | Genotype Effect |
|---|---|---|---|---|---|
| WBSF (d 3) | 5.90 ± 0.38 b | 6.05 ± 0.17 ab | 6.22 ± 0.12 a | 0.0130 $ | −5.1% |
| WBSF (d 9) | 4.70 ± 0.33 b | 4.77 ± 0.14 ab | 4.92 ± 0.11 a | 0.0111 $ | −4.6% |
| WBSF (d 14) | 3.78 ± 0.28 y | 4.17 ± 0.12 z | 4.21 ± 0.09 z | 0.0950 ! | −10.3% |
| WBSF (d 20) | 3.63 ± 0.27 | 3.89 ± 0.12 | 3.90 ± 0.09 | 0.1343 | − |
| MFL (d 3) | 39.29 ± 1.89 | 34.51 ± 0.81 | 35.64 ± 0.61 | 0.4293 | − |
| MFL (d 9) | 28.20 ± 1.23 z | 25.36 ± 0.53 y | 26.50 ± 0.40 y | 0.0895 | +6.4% |
| MFL (d 14) | 24.42 ± 1.16 a | 23.17 ± 0.50 b | 24.20 ± 0.38 ab | 0.0074 | # −4.2% |
| MFL (d 20) | 20.96 ± 0.94 b | 21.26 ± 0.41 b | 21.97 ± 0.31 a | 0.0448 | −4.6% |
| calpastatin (1 h) | 2.15 ± 0.10 z | 2.03 ± 0.04 y | 2.02 ± 0.03 y | 0.0811 ! | +6.4% |
| calpastatin (20 h) | 1.87 ± 0.12 | 1.66 ± 0.05 | 1.72 ± 0.04 | 0.1819 | − |
| calpain-1 (1 h) | 1.53 ± 0.08 | 1.46 ± 0.04 | 1.40 ± 0.03 | 0.8459 | − |
| calpain-1 (20 h) | 1.17 ± 0.09 | 1.06 ± 0.04 | 1.10 ± 0.03 | 0.3287 | − |
| calpain-2 (1 h) | 1.02 ± 0.04 | 1.00 ± 0.02 | 0.98 ± 0.01 | 0.3944 | − |
| calpain-2 (20 h) | 1.03 ± 0.04 | 1.02 ± 0.02 | 1.01 ± 0.01 | 0.4279 | − |
| calpastatin/calpain-1 (1 h) | 1.40 ± 0.07 b | 1.44 ± 0.03 ab | 1.49 ± 0.02 a | 0.0398 | −5.9% |
| calpastatin/calpain-1 (20 h) | 1.66 ± 0.13 | 1.80 ± 0.06 | 1.68 ± 0.04 | 0.9142 | − |
| calpastatin/calpains(1 h) | 0.84 ± 0.03 a | 0.84 ± 0.01 a | 0.86 ± 0.01 a | 0.0105 | n/a |
| calpastatin/calpains (20 h) | 0.83 ± 0.04 | 0.82 ± 0.02 | 0.81 ± 0.01 | 0.1441 | − |
| cast_763 | *CC (n = 113) | CT (n = 48) | # TT (n = 5) | p-Value (Simplified) | Genotype Effect |
|---|---|---|---|---|---|
| WBSF (d 3) | 5.99 ± 0.11 | 6.40 ± 0.17 | − | 0.5672 | − |
| WBSF (d 9) | 4.69 ± 0.09 | 4.97 ± 0.15 | − | 0.9146 | − |
| WBSF (d 14) | 4.09 ± 0.08 | 4.27 ± 0.13 | − | 0.7815 | − |
| WBSF (d 20) | 3.81 ± 0.08 | 3.93 ± 0.12 | − | 0.9412 | − |
| MFL (d 3) | 34.77 ± 0.52 y | 36.56 ± 0.85 z | − | 0.0902 | −4.9% |
| MFL (d 9) | 25.64 ± 0.35 b | 27.14 ± 0.57 a | − | 0.0289 | −5.5% |
| MFL (d 14) | 23.38 ± 0.33 b | 24.45 ± 0.54 a | − | 0.0005 | −4.4% |
| MFL (d 20) | 21.28 ± 0.27 b | 22.30 ± 0.43 a | − | 0.0081 | −4.6% |
| calpastatin (1 h) | 1.96 ± 0.03 y | 2.07 ± 0.04 z | − | 0.0828 ! | −5.5% |
| calpastatin (20 h) | 1.63 ± 0.03 | 1.76 ± 0.05 | − | 0.1042 | − |
| calpain-1 (1 h) | 1.40 ± 0.02 z | 1.42 ± 0.04 z | − | 0.0848 ! | n/a |
| calpain-1 (20 h) | 1.04 ± 0.03 | 1.09 ± 0.04 | − | 0.3695 | − |
| calpain-2 (1 h) | 0.98 ± 0.01 | 1.00 ± 0.02 | − | 0.4187 | − |
| calpain-2 (20 h) | 1.01 ± 0.01 | 1.03 ± 0.02 | − | 0.5901 | − |
| calpastatin/calpain-1 (1 h) | 1.44 ± 0.02 | 1.50 ± 0.03 | − | 0.9886 | − |
| calpastatin/calpain-1 (20 h) | 1.69 ± 0.04 | 1.77 ± 0.06 | − | 0.4553 | − |
| calpastatin/calpains(1 h) | 0.83 ± 0.01 | 0.87 ± 0.02 | − | 0.5752 | − |
| calpastatin/calpains (20 h) | 0.80 ± 0.01 y | 0.85 ± 0.02 z | − | 0.0876 | −5.6% |
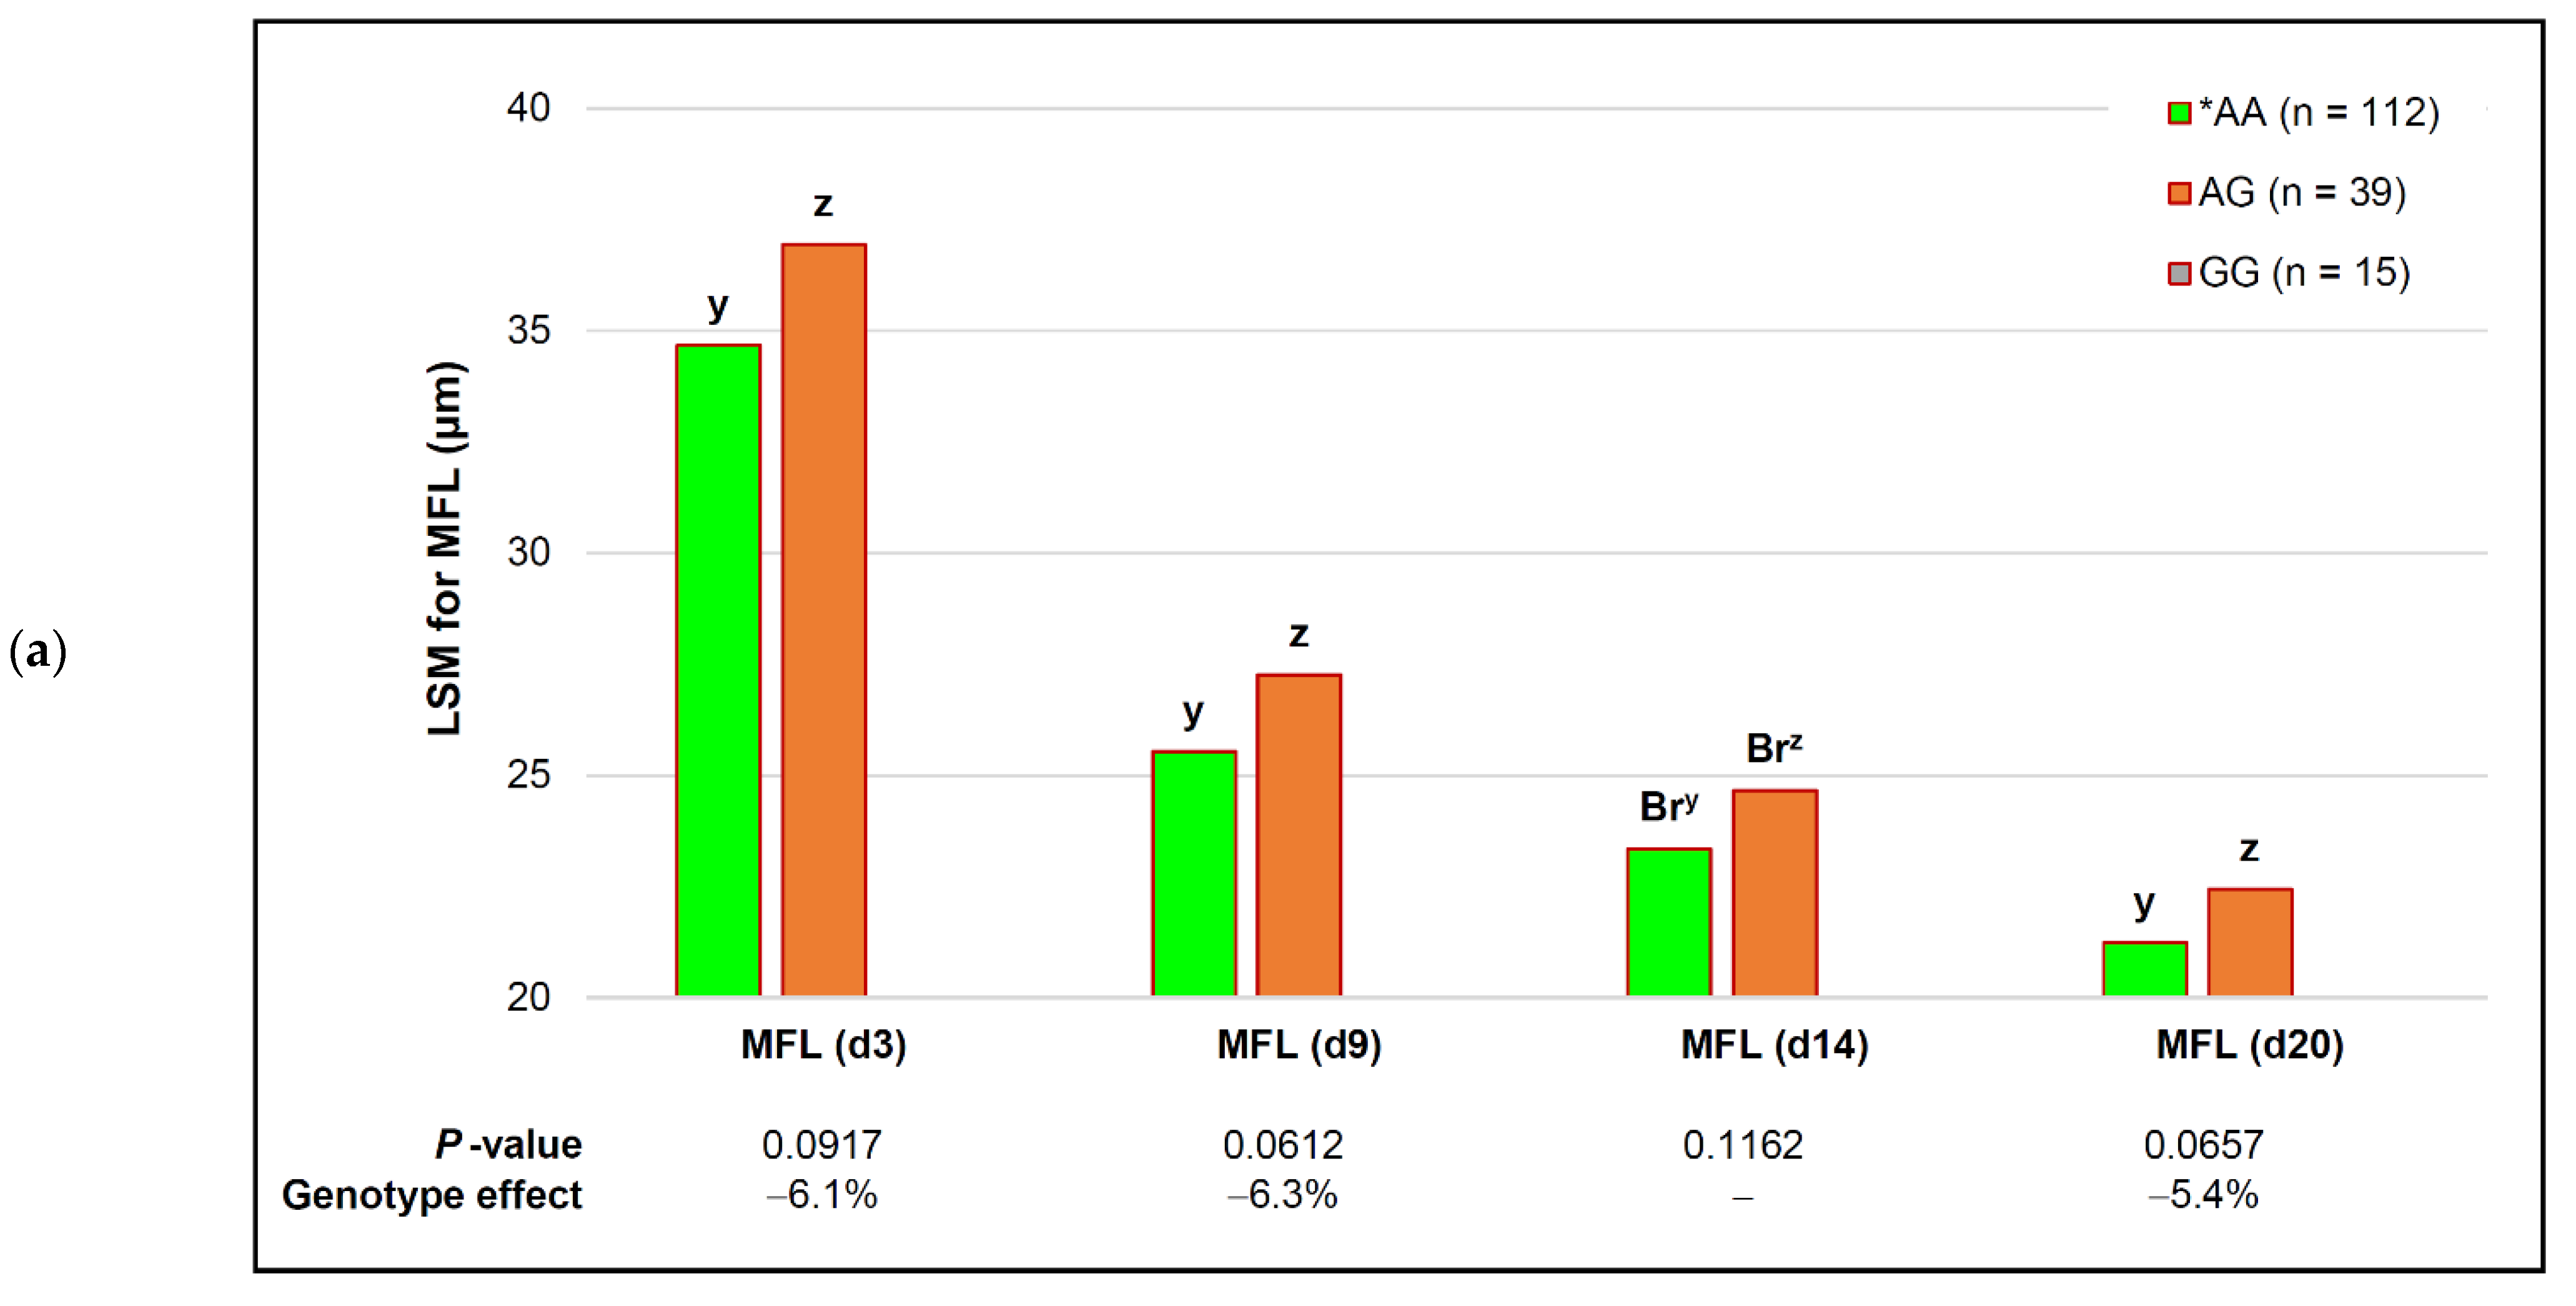
| capn2_780 | *AA (n = 112) | AG (n = 39) | # GG (n = 15) | p-Value (Simplified) | Genotype Effect |
|---|---|---|---|---|---|
| WBSF (d 3) | 6.05 ± 0.11 | 6.54 ± 0.20 | − | 0.3279 | − |
| WBSF (d 9) | 4.77 ± 0.09 | 4.83 ± 0.17 | − | 0.1467 | − |
| WBSF (d 14) | 4.10 ± 0.08 | 4.30 ± 0.15 | − | 0.2274 | − |
| WBSF (d 20) | 3.84 ± 0.08 | 3.93 ± 0.14 | − | 0.3831 | − |
| calpastatin (1 h) | 2.06 ± 0.03 | 1.87 ± 0.05 | − | 0.9969 | − |
| calpastatin (20 h) | 1.75 ± 0.03 | 1.48 ± 0.06 | − | 0.7869 | − |
| calpain-1 (1 h) | 1.45 ± 0.02 | 1.35 ± 0.04 | − | 0.3737 | − |
| calpain-1 (20 h) | 1.10 ± 0.03 | 0.99 ± 0.05 | − | 0.3225 | − |
| calpain-2 (1 h) | 1.00 ± 0.01 | 0.95 ± 0.02 | − | 0.9139 | − |
| calpain-2 (20 h) | 1.03 ± 0.01 | 0.96 ± 0.02 | − | 0.6730 | − |
| calpastatin/calpain-1 (1 h) | 1.47 ± 0.02 | 1.42 ± 0.04 | − | 0.7586 | − |
| calpastatin/calpain-1 (20 h) | 1.74 ± 0.04 | 1.62 ± 0.07 | − | 0.9579 | − |
| calpastatin/calpains(1 h) | 0.85 ± 0.01 | 0.82 ± 0.02 | − | 0.7954 | − |
| calpastatin/calpains (20 h) | 0.83 ± 0.01 | 0.77 ± 0.02 | − | 0.7862 | − |
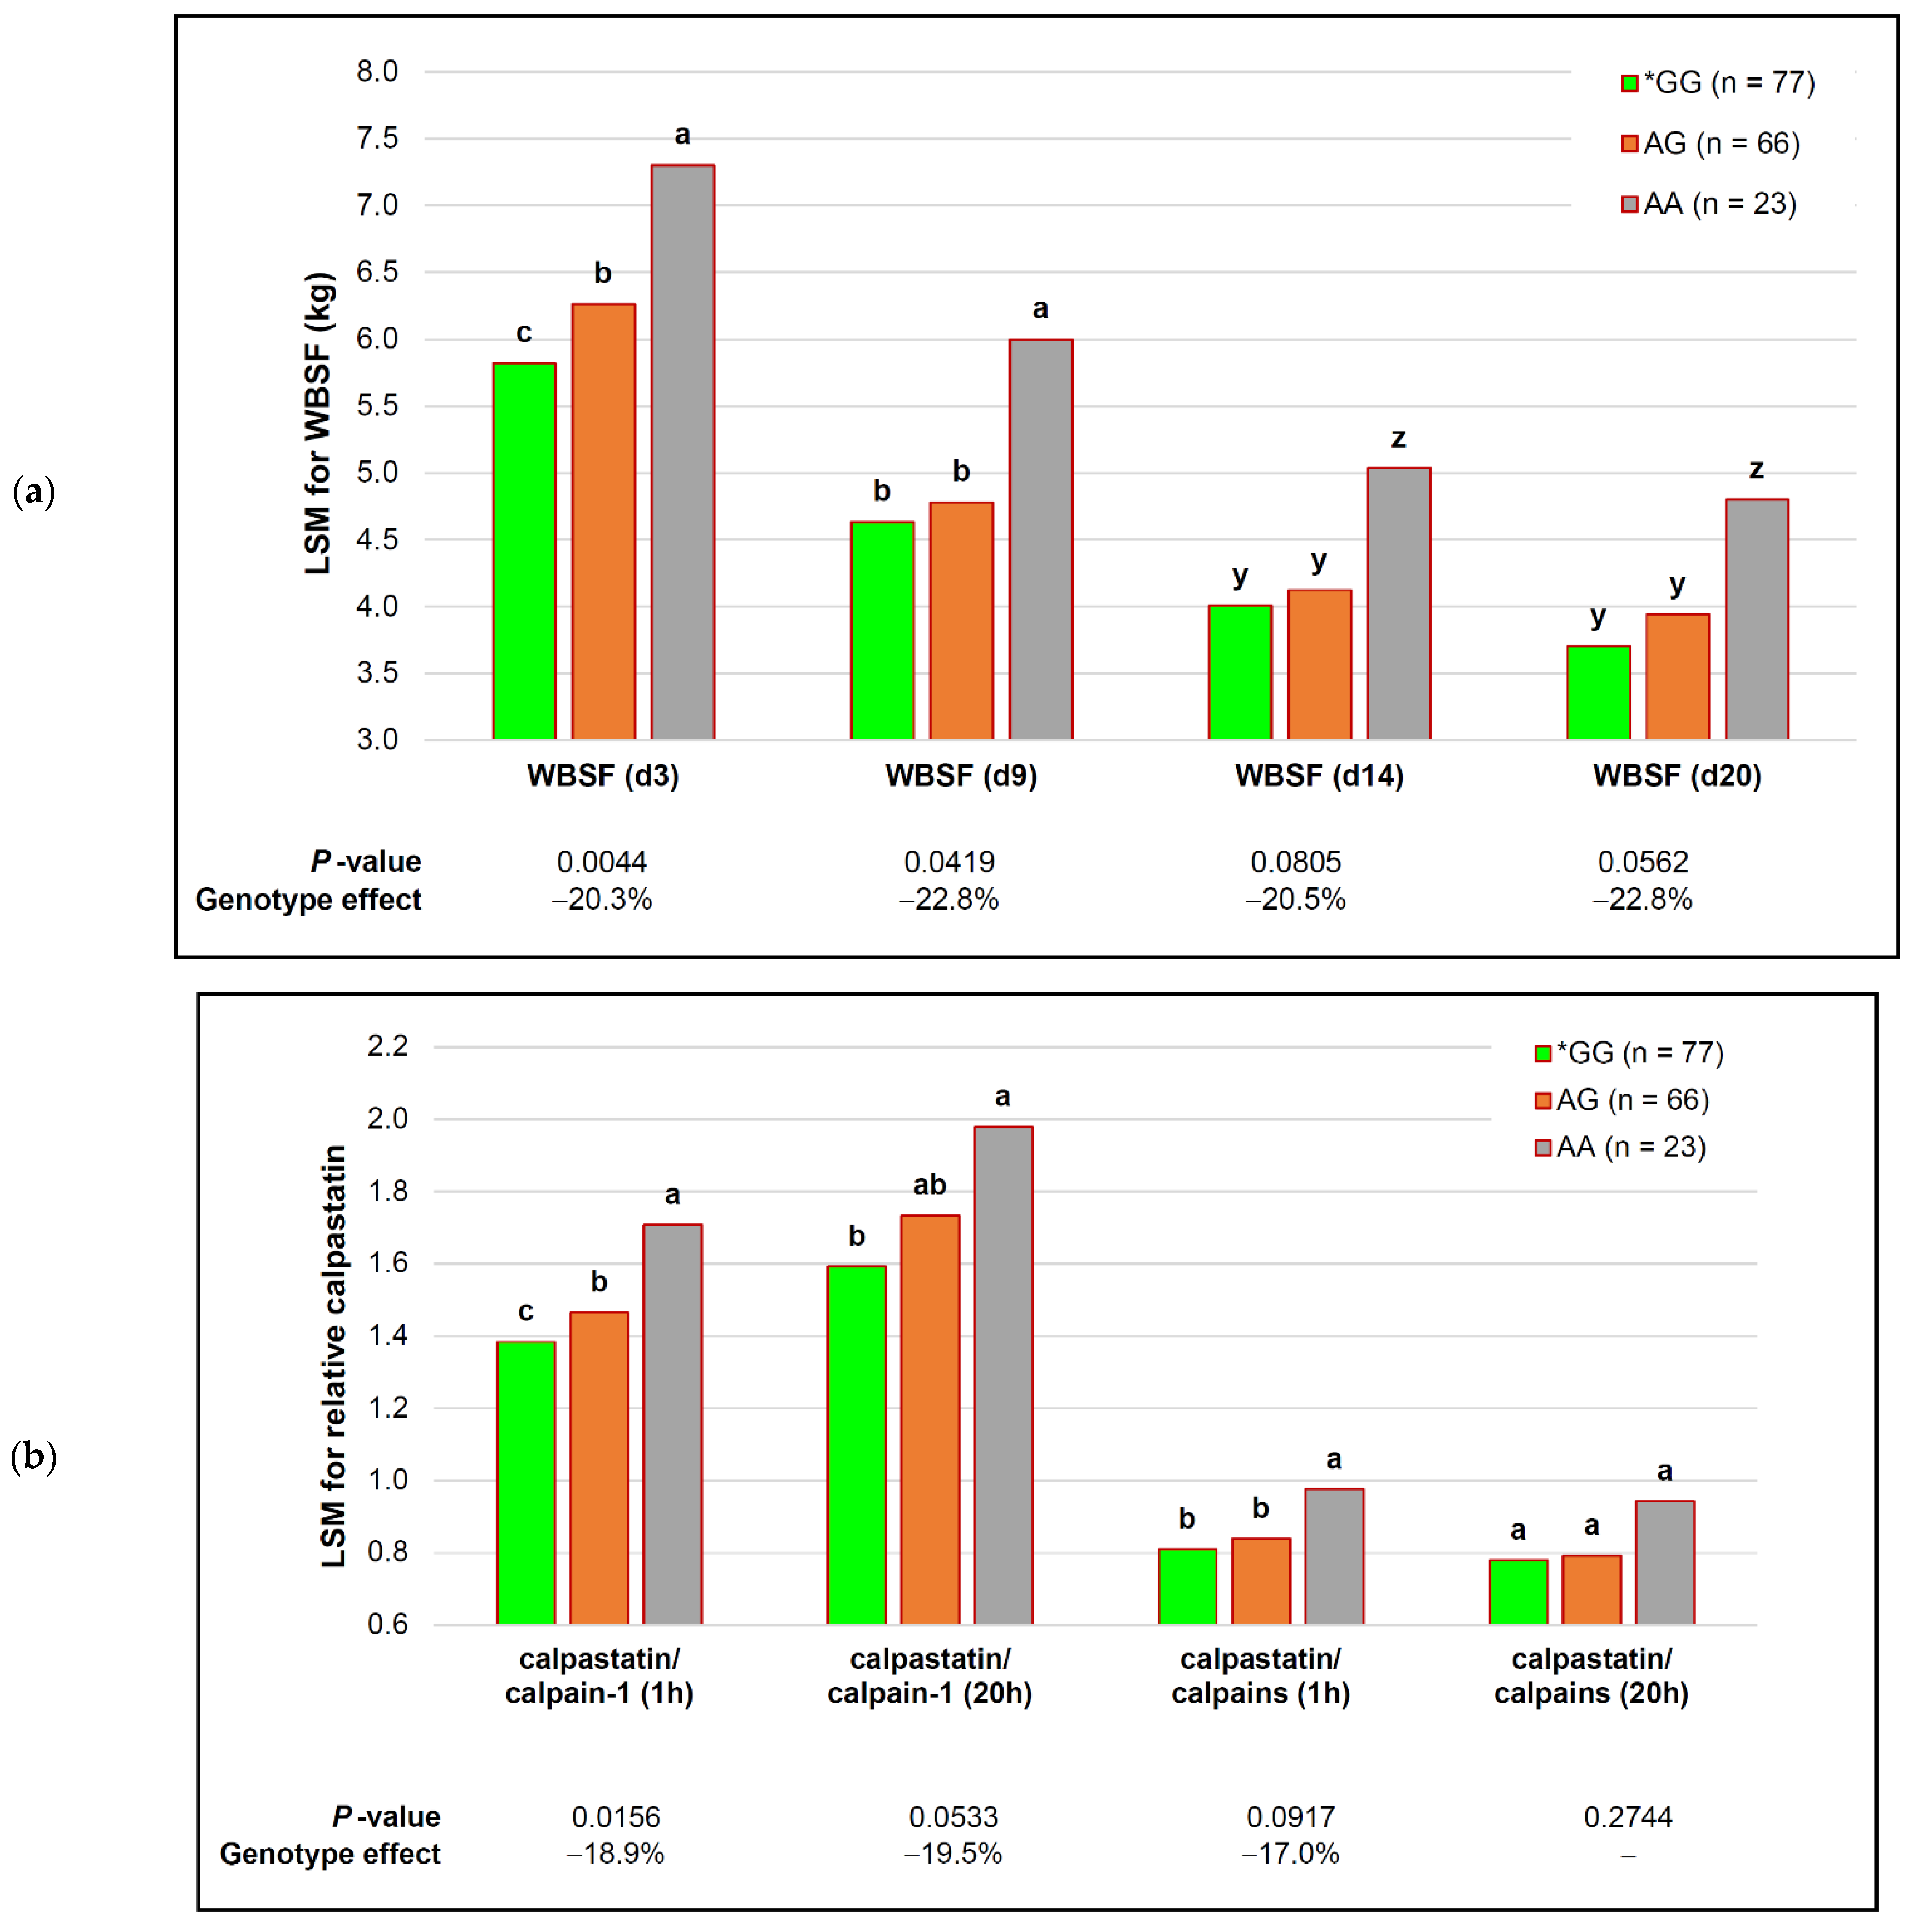
| capn1_184 | *GG (n = 77) | AG (n = 66) | AA (n = 23) | p-Value (Simplified) | Genotype Effect |
|---|---|---|---|---|---|
| MFL (d 3) | 33.47 ± 0.65 | 35.48 ± 0.72 | 41.57 ± 1.74 | 0.1810 | − |
| MFL (d 9) | 24.67 ± 0.42 c | 26.20 ± 0.47 b | 31.98 ± 1.12 a | 0.0242 | −22.9% |
| MFL (d 14) | 22.50 ± 0.38 y | 24.05 ± 0.42 y | 30.54 ± 1.02 z | 0.0771 | −26.3% |
| MFL (d 20) | 20.92 ± 0.31 | 21.54 ± 0.35 | 25.70 ± 0.84 | 0.1557 | − |
| calpastatin (1 h) | 1.99 ± 0.04 | 1.99 ± 0.04 | 2.23 ± 0.09 | 0.4096 | − |
| calpastatin (20 h) | 1.69 ± 0.04 | 1.64 ± 0.05 | 1.81 ± 0.11 | 0.6957 | − |
| calpain-1 (1 h) | 1.47 ± 0.03 | 1.41 ± 0.03 | 1.32 ± 0.08 | 0.2095 | − |
| calpain-1 (20 h) | 1.13 ± 0.03 | 1.05 ± 0.04 | 0.97 ± 0.09 | 0.7597 | − |
| calpain-2 (1 h) | 1.00 ± 0.01 | 1.00 ± 0.01 | 0.98 ± 0.03 | 0.7125 | − |
| calpain-2 (20 h) | 1.04 ± 0.01 | 1.02 ± 0.01 | 0.98 ± 0.04 | 0.5729 | − |
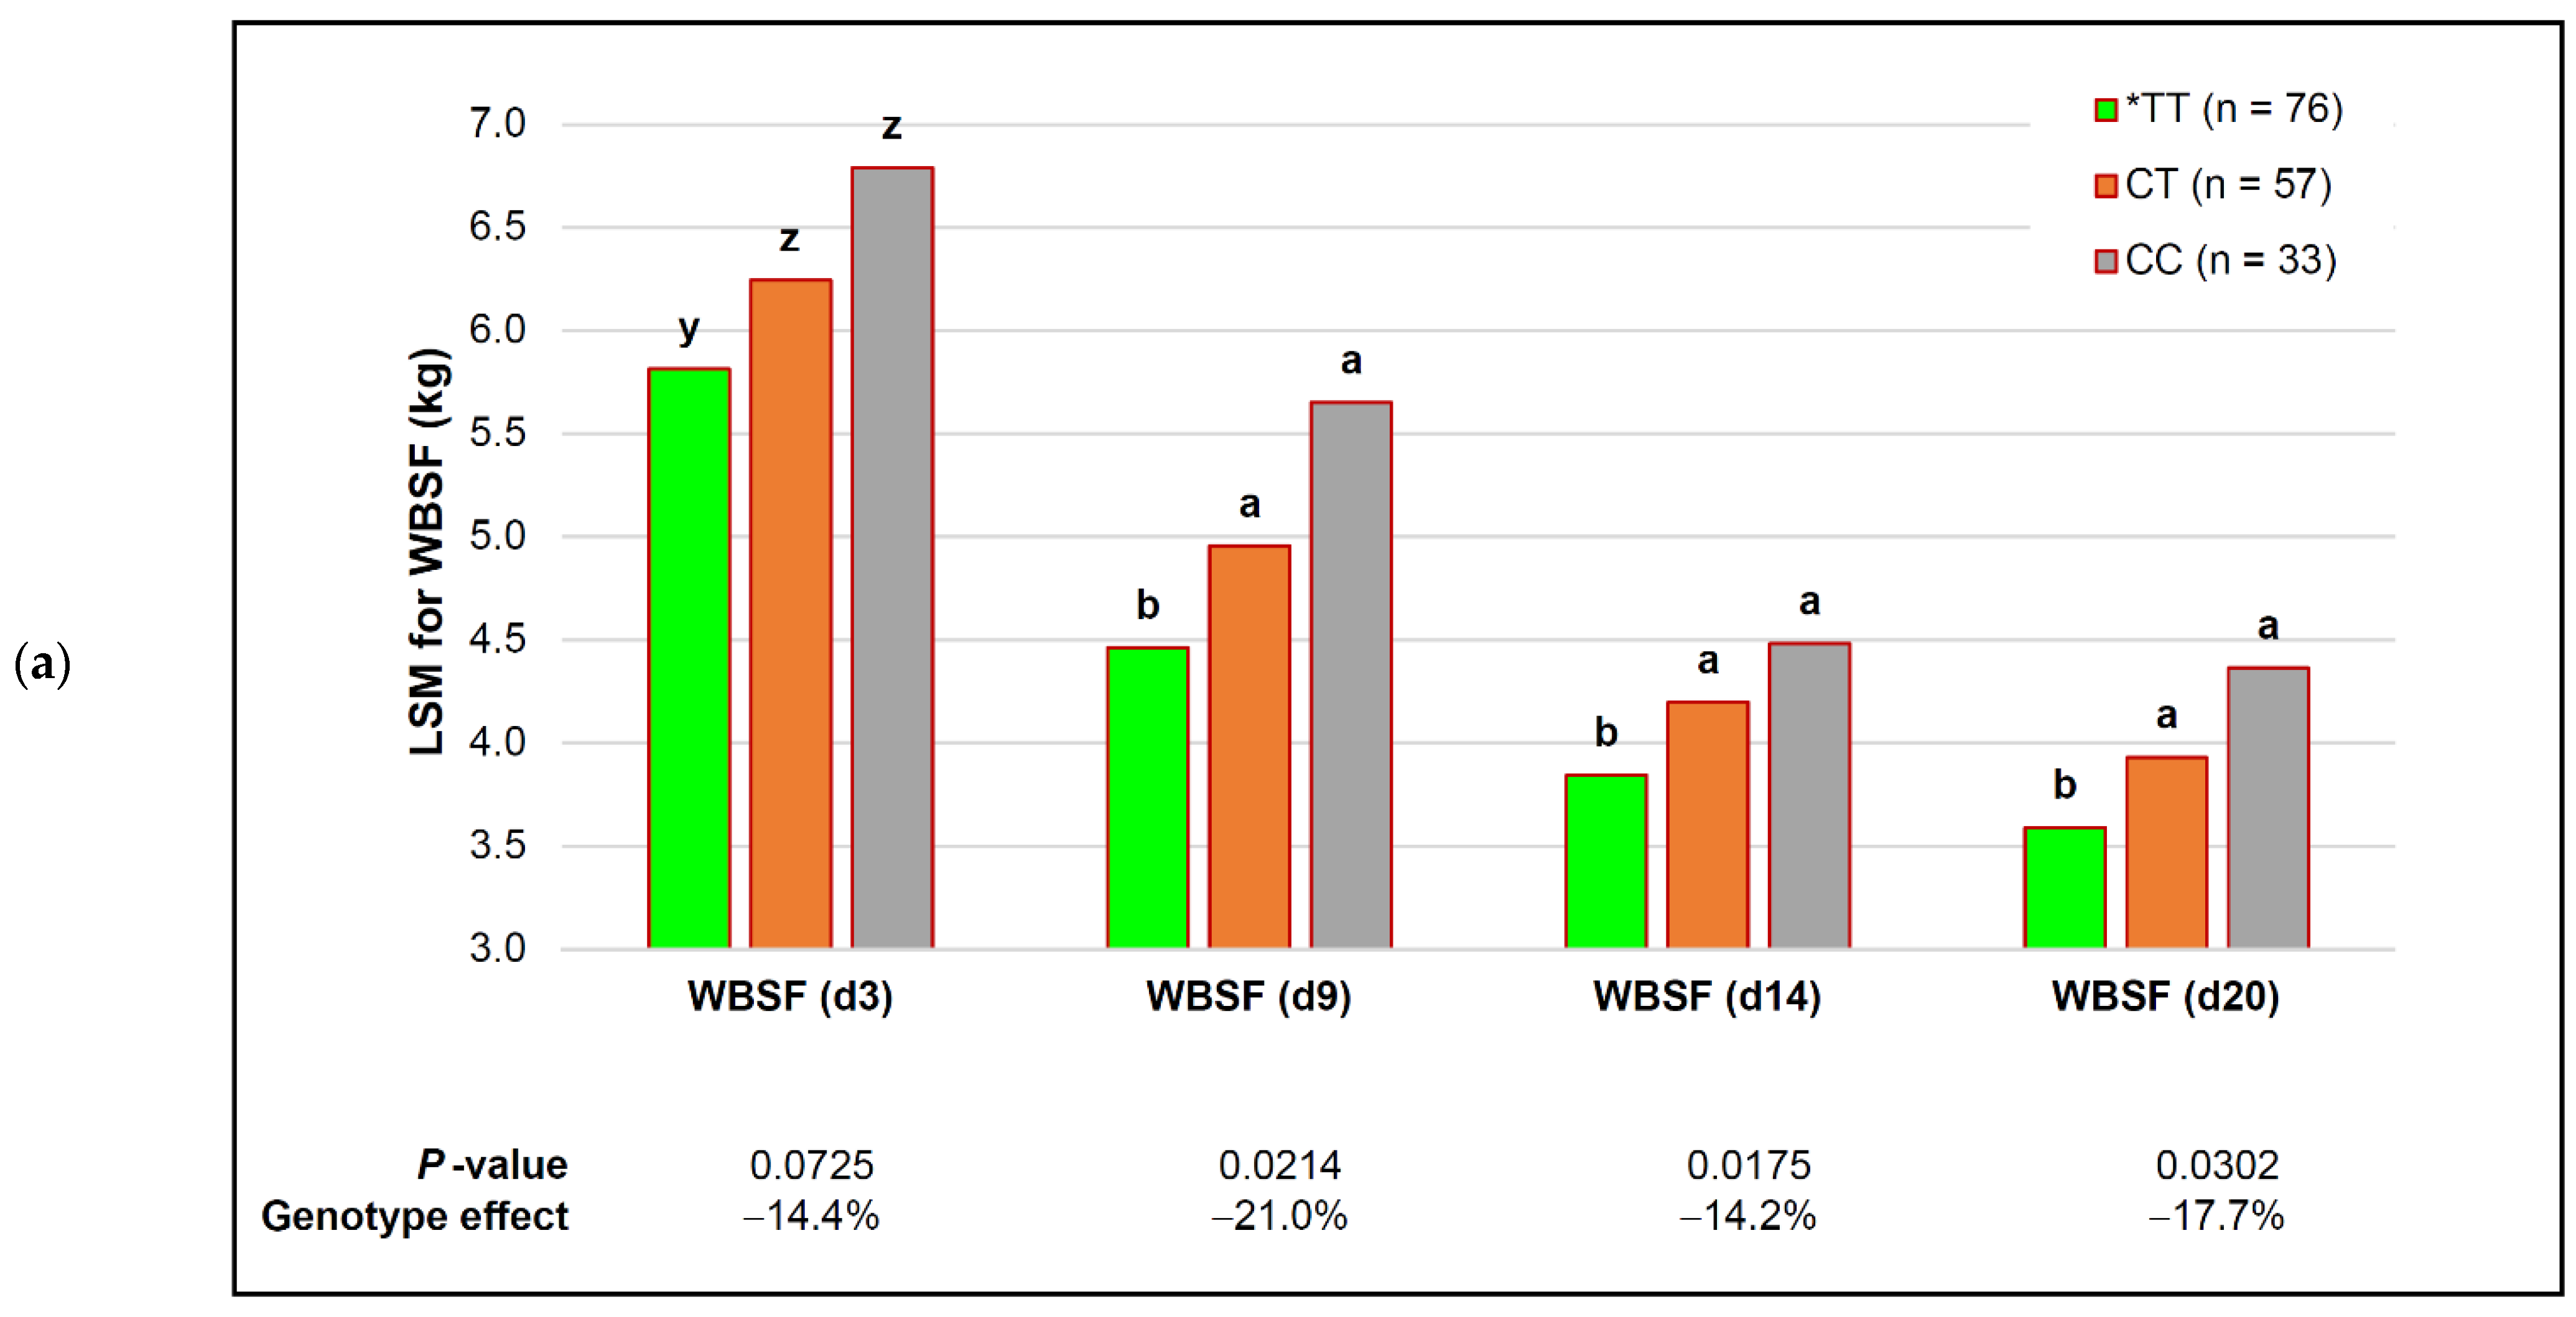
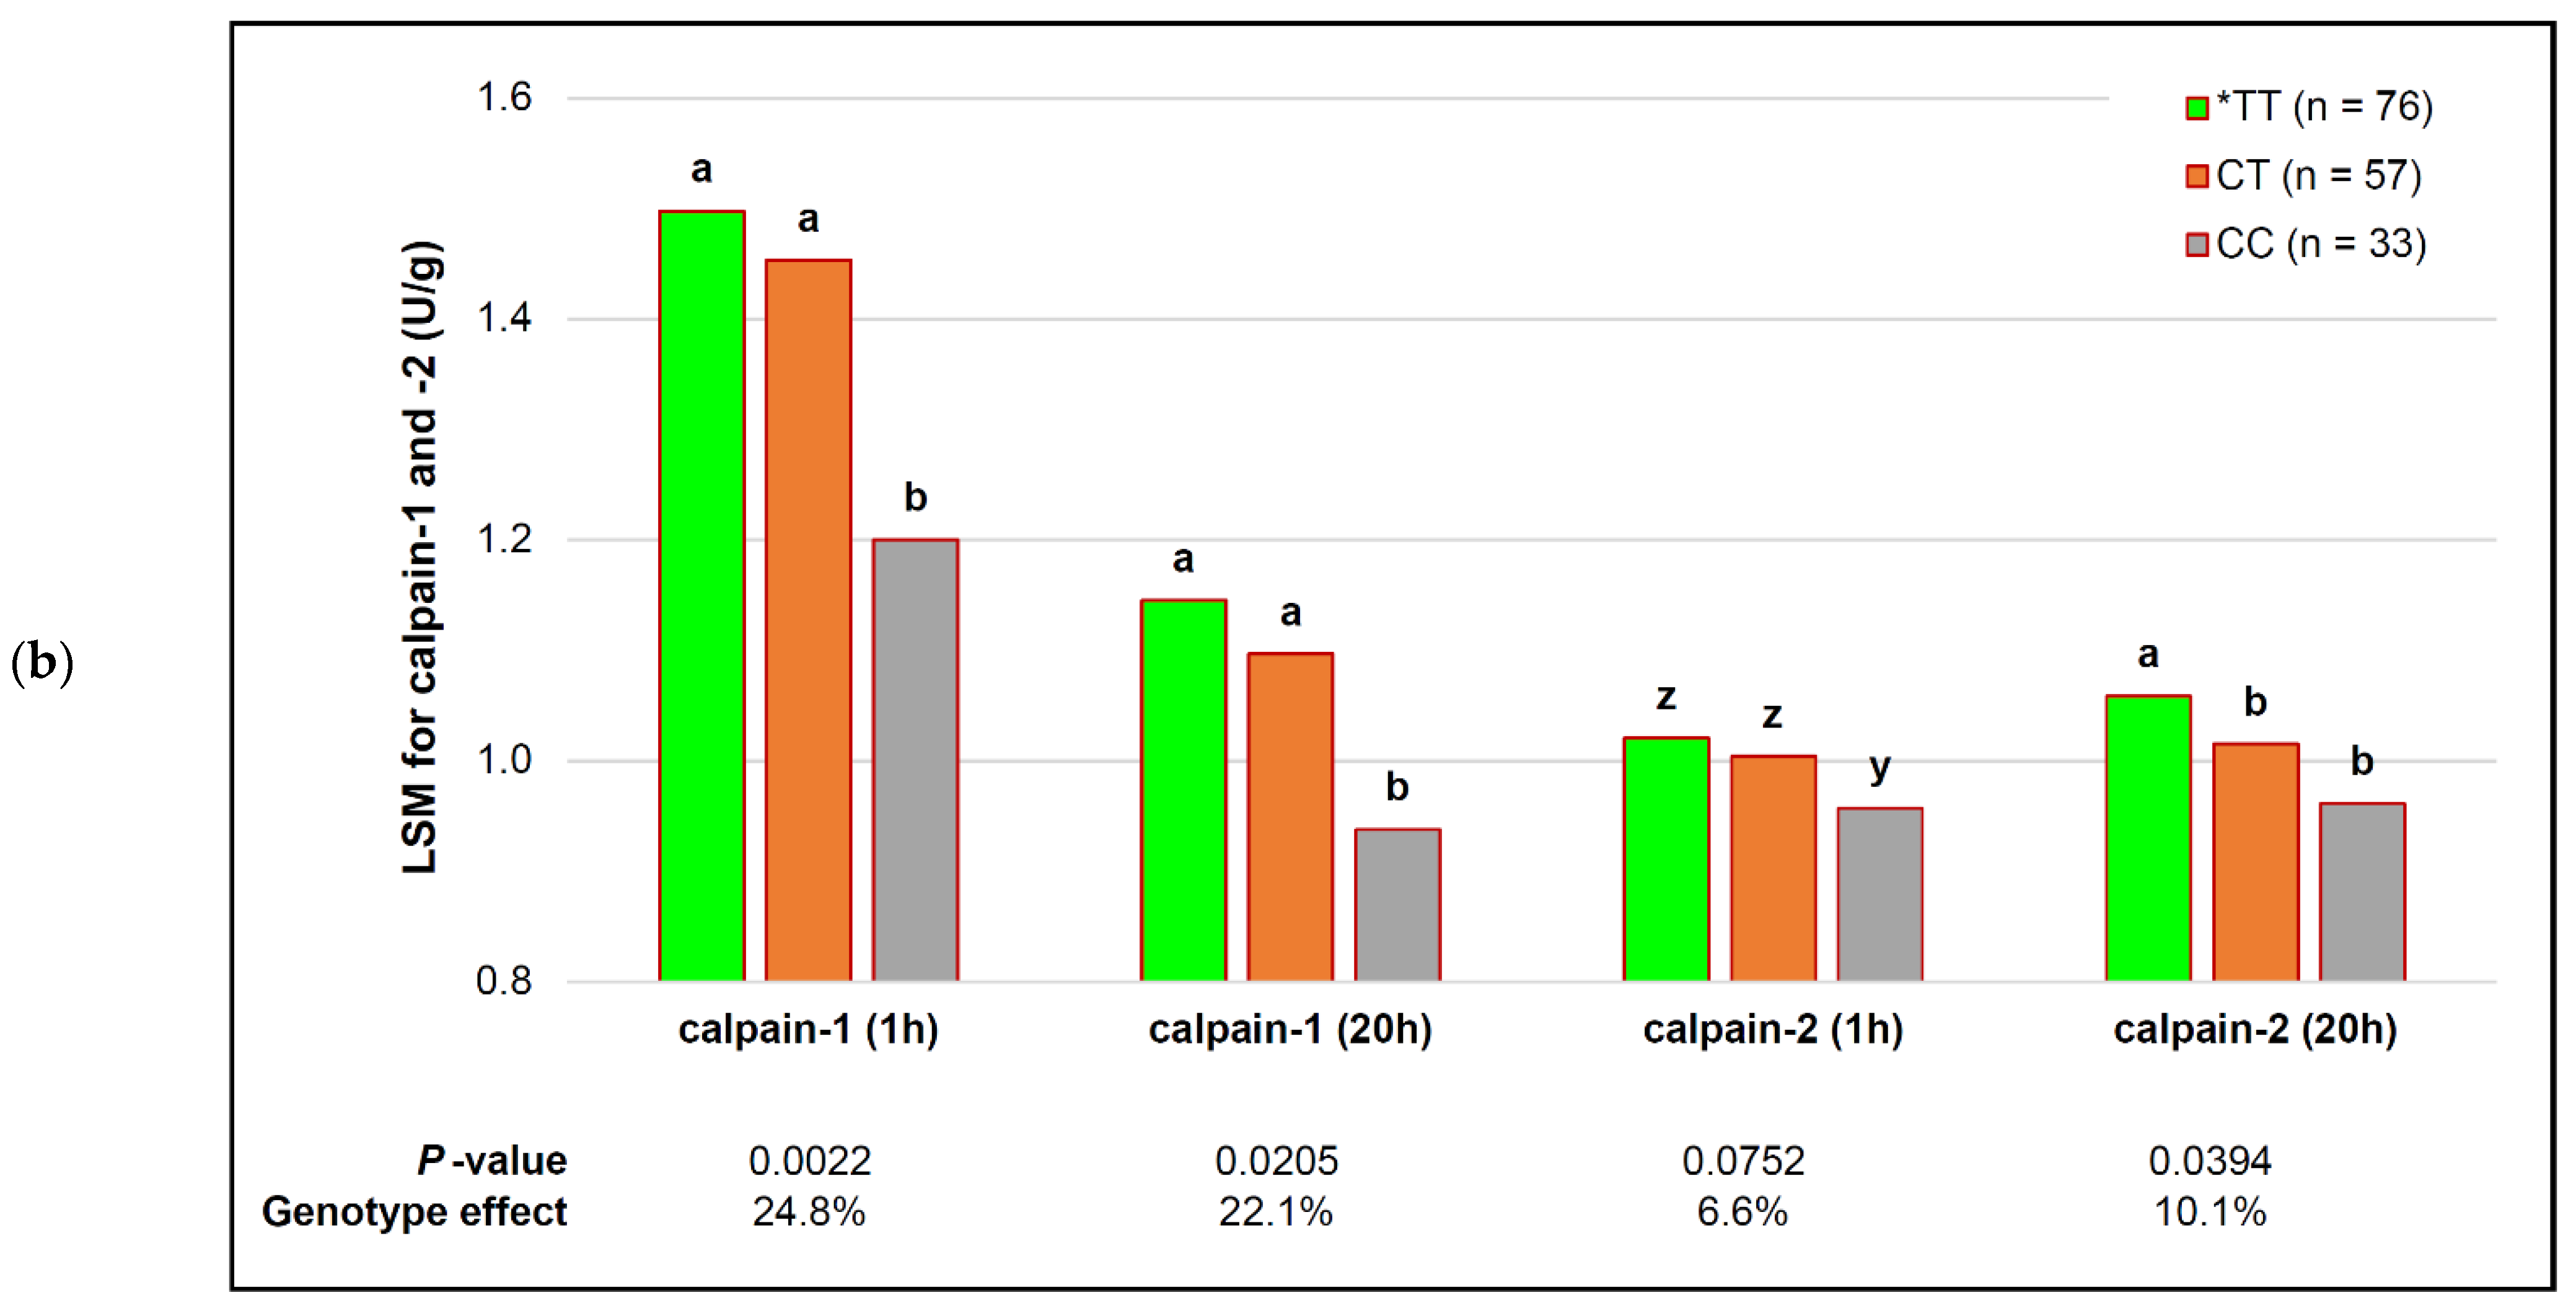
| capn1_187 | *TT (n = 76) | CT (n = 57) | CC (n = 33) | p-Value (Simplified) | Genotype Effect |
|---|---|---|---|---|---|
| MFL (d 3) | 32.54 ± 0.64 c | 35.33 ± 0.76 b | 44.32 ± 2.10 a | 0.0090 | −26.6% |
| MFL (d 9) | 24.30 ± 0.43 c | 26.23 ± 0.51 b | 29.71 ± 1.40 a | 0.0047 | −18.2% |
| MFL (d 14) | 22.25 ± 0.40 | 24.38 ± 0.47 | 26.65 ± 1.30 | 0.1270 | − |
| MFL (d 20) | 20.61 ± 0.32 | 21.80 ± 0.38 | 24.02 ± 1.06 | 0.1885 | − |
| calpastatin (1 h) | 2.00 ± 0.04 | 2.04 ± 0.04 | 1.96 ± 0.12 | 0.2181 | |
| calpastatin (20 h) | 1.73 ± 0.04 z | 1.69 ± 0.05 z | 1.61 ± 0.14 z | 0.0640 ! | # variable |
| calpastatin/calpain-1 (1 h) | 1.38 ± 0.02 z | 1.44 ± 0.03 z | 1.63 ± 0.08 y | 0.0909 | −15.5% |
| calpastatin/calpain-1 (20 h) | 1.63 ± 0.05 | 1.69 ± 0.06 | 1.84 ± 0.16 | 0.1571 | |
| calpastatin/calpains (1 h) | 0.81 ± 0.01 | 0.83 ± 0.01 | 0.90 ± 0.04 | 0.1989 | |
| calpastatin/calpains (20 h) | 0.79 ± 0.01 | 0.80 ± 0.02 | 0.85 ± 0.04 | 0.5493 |
| capn1_4751 | *CC (n = 53) | CT (n = 63) | TT (n = 50) | p-Value (Simplified) | Genotype Effect |
|---|---|---|---|---|---|
| WBSF (d 3) | 5.89 ± 0.16 | 6.17 ± 0.15 | 6.26 ± 0.22 | 0.3758 | − |
| WBSF (d 9) | 4.47 ± 0.14 | 4.94 ± 0.13 | 4.85 ± 0.19 | 0.3035 | − |
| WBSF (d 14) | 3.84 ± 0.12 b | 4.14 ± 0.11 ab | 4.31 ± 0.17 a | 0.0357 | −10.8% |
| WBSF (d 20) | 3.58 ± 0.11 b | 3.88 ± 0.11 ab | 4.07 ± 0.16 a | 0.0226 | −12.0% |
| MFL (d 3) | 32.43 ± 0.79 y | 35.72 ± 0.73 z | 36.17 ± 1.09 z | 0.0790 | −10.4% |
| MFL (d 9) | 24.20 ± 0.52 b | 26.14 ± 0.48 a | 26.69 ± 0.72 a | 0.0474 | −9.3% |
| MFL (d 14) | 22.11 ± 0.49 y | 24.36 ± 0.45 z | 24.07 ± 0.67 z | 0.0762 | −8.1% |
| MFL (d 20) | 20.32 ± 0.40 | 21.90 ± 0.37 | 21.94 ± 0.55 | 0.1056 | − |
| calpastatin (1 h) | 2.02 ± 0.04 | 2.03 ± 0.04 | 2.08 ± 0.06 | 0.1216 | − |
| calpastatin (20 h) | 1.73 ± 0.05 | 1.73 ± 0.05 | 1.74 ± 0.07 | 0.1424 | − |
| calpain-1 (1 h) | 1.54 ± 0.03 a | 1.43 ± 0.03 b | 1.48 ± 0.05 ab | 0.0340 $ | +4.1% |
| calpain-1 (20 h) | 1.14 ± 0.04 | 1.13 ± 0.04 | 1.08 ± 0.05 | 0.1847 | − |
| calpain-2 (1 h) | 1.03 ± 0.01 | 1.00 ± 0.01 | 1.03 ± 0.02 | 0.2252 | − |
| calpain-2 (20 h) | 1.05 ± 0.02 | 1.04 ± 0.01 | 1.03 ± 0.02 | 0.3517 | − |
| calpastatin/calpain-1 (1 h) | 1.35 ± 0.03 | 1.45 ± 0.03 | 1.46 ± 0.04 | 0.3813 | − |
| calpastatin/calpain-1 (20 h) | 1.64 ± 0.06 | 1.69 ± 0.05 | 1.77 ± 0.08 | 0.7056 | − |
| calpastatin/calpains (1 h) | 0.79 ± 0.01 | 0.84 ± 0.01 | 0.84 ± 0.02 | 0.8265 | − |
| calpastatin/calpains (20 h) | 0.79 ± 0.02 | 0.80 ± 0.02 | 0.83 ± 0.02 | 0.3613 | − |
Publisher’s Note: MDPI stays neutral with regard to jurisdictional claims in published maps and institutional affiliations. |
© 2022 by the authors. Licensee MDPI, Basel, Switzerland. This article is an open access article distributed under the terms and conditions of the Creative Commons Attribution (CC BY) license (https://creativecommons.org/licenses/by/4.0/).
Share and Cite
Basson, A.; Strydom, P.E.; van Marle-Köster, E.; Webb, E.C.; Frylinck, L. Sustained Effects of Muscle Calpain System Genotypes on Tenderness Phenotypes of South African Beef Bulls during Ageing up to 20 Days. Animals 2022, 12, 686. https://0-doi-org.brum.beds.ac.uk/10.3390/ani12060686
Basson A, Strydom PE, van Marle-Köster E, Webb EC, Frylinck L. Sustained Effects of Muscle Calpain System Genotypes on Tenderness Phenotypes of South African Beef Bulls during Ageing up to 20 Days. Animals. 2022; 12(6):686. https://0-doi-org.brum.beds.ac.uk/10.3390/ani12060686
Chicago/Turabian StyleBasson, Annie, Phillip E. Strydom, Esté van Marle-Köster, Edward C. Webb, and Lorinda Frylinck. 2022. "Sustained Effects of Muscle Calpain System Genotypes on Tenderness Phenotypes of South African Beef Bulls during Ageing up to 20 Days" Animals 12, no. 6: 686. https://0-doi-org.brum.beds.ac.uk/10.3390/ani12060686