Stochastic Analysis of Tsunami Hazard of the 1945 Makran Subduction Zone Mw 8.1–8.3 Earthquakes


1
Department of Earth Sciences, University of Western Ontario, London, ON N6A 5B7, Canada
2
Department of Statistical & Actuarial Sciences, University of Western Ontario, London ON N6A 5B7, Canada
3
Department of Civil & Environmental Engineering, Brunel University, London UB8 3PH, UK
4
SHARCNET, University of Western Ontario, London, ON N6A 5B7, Canada
*
Author to whom correspondence should be addressed.
Geosciences 2020, 10(11), 452; https://0-doi-org.brum.beds.ac.uk/10.3390/geosciences10110452
Submission received: 9 October 2020
/
Revised: 4 November 2020
/
Accepted: 9 November 2020
/
Published: 11 November 2020
(This article belongs to the Special Issue Interdisciplinary Geosciences Perspectives of Tsunami Volume 3)
Abstract
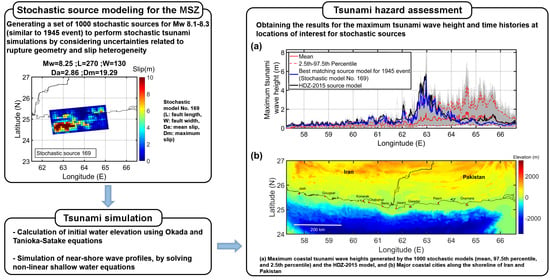
:Historical records of major earthquakes in the northwestern Indian Ocean along the Makran Subduction Zone (MSZ) indicate high potential tsunami hazards for coastal regions of Pakistan, Iran, Oman, and western India. There are fast-growing and populous cities and ports that are economically important, such as Chabahar (Iran), Gwadar (Pakistan), Muscat (Oman), and Mumbai (India). In this study, we assess the tsunami hazard of the 1945 MSZ event (fatalities ≈300 people) using stochastic earthquake rupture models of Mw 8.1–8.3 by considering uncertainties related to rupture geometry and slip heterogeneity. To quantify the uncertainty of earthquake source characteristics in tsunami hazard analysis, 1000 stochastic tsunami scenarios are generated via a stochastic source modeling approach. There are main objectives of this study: (1) developing stochastic earthquake slip models for the MSZ, (2) comparing results of the simulation with the existing observations of the 1945 event, and (3) evaluating the effect of uncertain fault geometry and earthquake slip based on simulated near-shore wave profiles. The 1945 Makran earthquake is focused upon by comparing model predictions with existing observations, consisting of far-field tsunami waveforms recorded on tide gauges in Karachi and Mumbai and coseismic deformation along the Pakistani coast. The results identify the source model that matches the existing observations of the 1945 Makran event best among the stochastic sources. The length, width, mean slip, and maximum slip of the identified source model are 270 km, 130 km, 2.9 m, and 19.3 m, respectively. Moreover, the sensitivity of the maximum tsunami heights along the coastline to the location of a large-slip area is highlighted. The maximum heights of the tsunami and coseismic deformation results at Ormara are in the range of 0.3–7.0 m and −2.7 to 1.1 m, respectively, for the 1000 stochastic source models.
1. Introduction
Great tsunamis are capable of destroying coastal cities and towns. In the last two decades, the 2004 Indian Ocean tsunami and the 2011 Tohoku (Japan) tsunami caused significant damage and death tolls. The 2004 Indian Ocean tsunami claimed more than 220,000 fatalities [1]. The 2011 Tohoku event caused ≈20,000 deaths, and its economic loss was estimated at US$ 211 billion in direct damages [2,3]. Tsunamis have been considered as more extreme than other types of natural hazards [4].
The Makran Subduction Zone (MSZ; Figure 1) of offshore Iran and Pakistan is one of the less-studied tsunamigenic zones in the world, having high potential to generate catastrophic tsunamis. The 950 km long MSZ in the northwestern Indian Ocean is a convergent plate boundary where the Eurasian Plate is overriding the Arabian Plate at the rate of 1.9 cm/year [5]. The historical records of large thrust-type earthquakes and tsunamis along the MSZ are indicative of large tsunami potential in this relatively newly discovered subduction zone. The MSZ produced at least eight large earthquakes of magnitudes greater than 7 since 1483 [6]. The largest recorded earthquake in the region is the Makran earthquake on 27 November 1945 [5]. The magnitude range of 8.1–8.3 for the 1945 Makran event was derived from different seismological analyses [5,7,8]. The 1945 Makran earthquake was followed by a catastrophic tsunami, which caused circa 300 fatalities in the region [9]. The 1945 Makran earthquake was considered as a characteristic earthquake in scenario-based tsunami hazard assessments, because it was the most destructive and the largest recorded earthquake and tsunami in the region [10].
Earthquake and tsunami hazard studies have been conducted for the MSZ and the coastal areas of Pakistan, Iran, Oman, and India. For the 1945 Makran event, several source models have been proposed [10,11,12,13,14,15]. Numerical modeling by Heidarzadeh and Satake [12] revealed that these earthquake source models are different in terms of geometry and slip, and none of them are capable of reproducing results completely consistent with the observations, except for the combined earthquake–landslide source suggested by Heidarzadeh and Satake [13]. The fault parameters in the previously-proposed sources are as follows: fault length of 100–220 km, fault width of 70–100 km, slip value of 6.1–15 m, and dip angle of 5.5–15° (Figure 2). In addition, there are significant differences in terms of locations of the proposed sources. For instance, the source model proposed by Neetu et al. [11] is located close to the shore, whereas the source model proposed by Jaiswal et al. [14] is located offshore in deep water (2000 m). Such large differences motivated Heidarzadeh and Satake [12] to study various source models through numerical modeling and proposed a new source model for the 1945 event by inverting observation waveforms, coseismic deformation data, and coastal tsunami heights. This study is one step forward by considering uncertainties associated with earthquake source parameters. Since the observation data for this important event are limited, an application of stochastic analysis is justified, which provides opportunities to consider various uncertainties associated with source models.
Non-uniform patterns of slip distribution over a fault plane reflect the complexity of the earthquake rupture. The modeling of stochastic sources is useful in creating synthetic realizations of realistic source models [16]. Hence, it has been used for tsunami hazard assessments for different areas around the world [17,18,19,20,21,22]. Scaling relationships play a crucial role in the modeling of stochastic sources. Goda et al. [23] developed new scaling relationships of various earthquake source parameters including the fault width, fault length, fault area, mean slip, maximum slip, Box–Cox power, correlation lengths along-dip and along-strike directions, and Hurst number. The new empirical models are useful for synthesizing stochastic earthquake source models, since they can be used as a multivariate statistical model that considers the variability and dependency of the multiple source parameters [23].
The stochastic tsunami simulation is useful for evaluating the regional tsunami effect in the MSZ related to potential large earthquakes. The non-uniform patterns of slip distribution of the tsunami sources have been ignored in many tsunami studies of the MSZ by adopting simple source models with uniform slip (e.g., Figure 2), apart from the studies conducted by Heidarzadeh and Satake [12] and Rashidi et al. [22]. In [12], a four sub-fault source model was proposed by inverting observed waveforms of the 1945 event in Karachi and Mumbai. Rashidi et al. [22] conducted a probabilistic tsunami hazard assessment for the MSZ using the stochastic slip distribution method. The sensitivity of the maximum tsunami wave height along the shores of Iran, Pakistan, and Oman to the heterogeneity of slip over the rupture area was analyzed in their study. They generated 100 stochastic sources for earthquakes with magnitudes up to Mw 8.7 based on a Gutenberg–Richter earthquake recurrence model.
In this study, we evaluate the tsunami hazard posed by the 1945 Makran event based on stochastic earthquake models by considering various uncertainties. The objectives of this study are threefold. Firstly, stochastic earthquake slip models for the Makran mainshock in 1945 are developed based on the spectral analysis approach [16] and the scaling relationships [22]. Secondly, results of the simulation are compared with the existing observations of the 1945 event, consisting of far-field tsunami waveforms recorded on tide gauges in Karachi and Mumbai and coseismic deformation data along the Pakistani coast. A stochastic source model that matches the existing observations of the 1945 event closely is identified. Thirdly, the effects of earthquake slip and fault geometry on tsunami simulation results are evaluated by investigating the near-shore tsunami heights along the coasts of Pakistan and Iran. The results highlight the sensitivity of the maximum tsunami height to the location of a large-slip area of the source models.
The novelty and significance of the current study are that considering uncertainties related to source geometry and slip heterogeneity, tsunami hazard assessment for earthquakes similar to the 1945 event in the MSZ is performed. The consideration of different sizes of rupture areas for the MSZ based on the empirical scaling relationships is an important improvement with respect to the approach adopted by Rashidi et al. [22], resulting in a more realistic characterization of earthquake source models for megathrust subduction events in the MSZ. Moreover, for the first time, the new geometry for the MSZ proposed by Slab2 [24] is used in the current research.
2. Methodology
2.1. Tsunami Source
Heidarzadeh and Satake [12] proposed a heterogeneous source model for the 1945 event based on observation data, while Rashidi et al. [22] considered hypothetical Mw 7.3–8.7 earthquakes with heterogeneous slips for the Makran region. The proposed source model by Heidarzadeh and Satake [12] for the 1945 Makran earthquake has four segments (Figure 2e). The source model has a total length of 220 km, width of 70 km, top depth of 27 km, and average slip is 6.1 m, resulting in Mw 8.27. The moment magnitude is calculated based on the seismic moment of the source fault (, where is the rock rigidity; ) [12]. In addition, it has a strike angle of 246°, dip angle of 7°, and rake angle of 89° (Figure 2e). The hypothetical source model considered by Rashidi et al. [22] has a non-planar fault geometry and is based on the plate interface from Smith et al. [25]. The total length, width, and top edge depth of the fault plane are 900, 210, and 6 km, respectively. In addition, the fault plane has a variable strike of 251–287°, dip of 2–8°, and constant rake of 90°. The main focus of Rashidi et al. [22] is on modeling potential hypothetical scenarios, not for the 1945 event.
2.1.1. Makran Fault Model
Numerous models have been developed for defining the boundaries of the MSZ region. The boundaries based on the PB2002 [26] consist of the Arabian–Eurasian, Arabian–Indian, and Eurasian–Indian Plates. Recently, Hayes et al. [24] developed the Slab2 model, which improves the geometry and boundaries of the Makran region. The basis for the PB2002 model was the set of digitized boundaries and seafloors based on Müller et al. [27]. The boundaries of the PB2002 model were mainly generated using seafloor ages, whereas regional seismicity was used only in a few cases (e.g., North America–South America boundary and India–Australia boundary). On the other hand, in the Slab2 model the global distribution of earthquake locations, geodetic control points, and active source seismic data were used for creating the 3D MSZ interface [24]. As a result, in terms of plate boundaries, the geometry of the MSZ interface created in the Slab2 is more reliable than the plate boundaries created by PB2002 and is suitable for tsunami hazard analysis. It is worth mentioning that none of the previous global subduction zone models developed a subduction interface for the MSZ [28,29,30]. The Slab2 model provides dip, depth, and strike distributions of the subduction interface as well as the geometry of the subduction zone. Figure 3a shows the geometry of the Slab2 model for the MSZ; for comparison, the PB2002 plate boundaries are also included.
The seismic activity of the western part of the MSZ is significantly lower than the eastern part because there is no adequate information on the occurrence of large earthquakes in the western part of the MSZ. On the other hand, Penney et al. [31] suggested that the western part of the MSZ might be locked based on seismological, geodetic, and geomorphological data in the region. They concluded that although there is only one large event in 1483 reported in the western MSZ, the GPS data are consistent with the western MSZ being locked, accumulating elastic strain, and thus the western MSZ is capable of hosting megathrust earthquakes. It is noteworthy that this conclusion is also consistent with the research conducted by Smith et al. [25]. The plate boundaries provided by Slab2 are consistent with the seismicity data shown in Figure 3a. Figure 3a shows the strike–slip, normal, and thrust events that occurred in the entire region. The events are obtained from [31], and they span from 1945 to 2017 and with Mw > 4.5. The locations of strike–slip events that are plotted using blue color are broadly consistent with the boundaries of the MSZ indicated by Slab2. The strike–slip events around 66° E match with the major North–South trending strike–slip faults, such as Ornach-Nal fault, Ghazaband fault, and Chaman fault. These distributed (parallel) fractures/faults can be attributed to the bend of the subduction structure.
Based on the geometry of the MSZ, a generic fault model for the MSZ is defined in three segments for the stochastic source generation (Figure 3b). The fault model covers the offshore region of the southeastern Iran and southwestern Pakistan. The length and width of the MSZ are 1070 km and 170 km, respectively. The top edge of the fault plane is positioned at a depth of 0 km. This is consistent with Penney et al. [31]; their work places a strong preference to shallower depths at the trench, and 0 km is not inconsistent with the current understanding of the subduction zone. The eastern, central, and western segments of the fault plane have strikes of 264°, 275°, and 290°, respectively, and a constant dip of 8°. For stochastic source modeling, the MSZ is discretized into 10 by 10 km sub-faults, and slip values are generated using the spatial slip distribution parameters. It is worth mentioning that the proposed fault model can be used for larger events in the MSZ up to megathrust Mw 9 earthquakes when the whole rupture is considered.
2.1.2. Earthquake Source Parameters for the Makran Region
The earthquake source parameters need to be determined to generate stochastic source models. In this study, the global scaling relationships developed by Goda et al. [23] are used to determine earthquake source parameters. Numerous finite-fault rupture models of past earthquakes were analyzed statistically to develop the global scaling relationships based on the SRCMOD database (see: http://equake-rc.info/SRCMOD/) [32]. The global scaling relationships evaluate the fault length (), fault width (), mean slip , maximum slip , Box–Cox parameter (), correlation length along strike direction , correlation length along dip direction , and Hurst number () as a function of Mw. These source parameters specify the features of the fault plane in two main categories. The first is the geometry of the fault plane that is characterized by the fault length, width, strike, and dip. The remaining source parameters are related to the spatial slip distribution over the fault plane. The probability distribution of the slip values is specified using the mean slip, maximum slip, and Box–Cox parameter, while the spatial heterogeneity of the slip values is modeled using the correlation lengths and Hurst number. Among the evaluated source parameters, the Hurst number and Box–Cox are the only parameters that are not dependent on Mw [23].
2.2. Bathymetry and Elevation Data
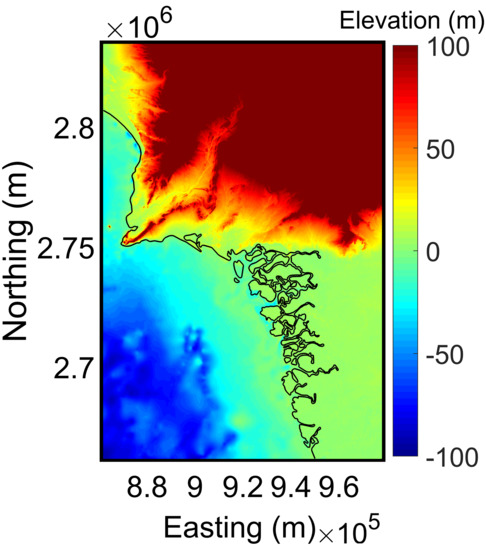
The bathymetry data and digital elevation model (DEM) data for the MSZ are needed to perform a tsunami simulation. For the bathymetry, the General Bathymetric Chart of the Oceans (GEBCO) 2019 dataset is used for deep to shallow water regions with a resolution of 15 arc-sec (about 450 m). The bathymetry encompasses the whole Makran including the Iran–Pakistan nearshore region and the Mumbai region as presented in Figure 4 [33]. For the DEM data, the Shuttle Radar Topography Mission (SRTM) dataset with a resolution of 1 arc-sec (about 30 m) is used for onshore topography [34].
There are three steps in developing the nesting grid system of ocean depth and land elevation datasets. Firstly, the bathymetry and DEM datasets (GEBCO2019 and SRTM) are merged without interpolation. The points in the generated dataset are not distributed homogeneously because the resolutions of the two datasets vary by a factor of 15 (450 m vs. 30 m). Secondly, in on-land areas, the points derived from SRTM alone are used, while neglecting on-land data from GEBCO2019. Thirdly, linear interpolation is performed on the composite dataset of SRTM (onshore) and GEBCO (offshore) to develop 270, 90, and 30 m resolution of bathymetry-elevation nesting grids along the shoreline of the MSZ. The reason that linear interpolation is used for developing the grid system instead of more complicated methods, such as spline interpolation, is that it prevents over-interpolation of the topographical characteristics. The over-interpolation might occur because there are abrupt changes in the spatial density of the data points in areas near the shoreline. It is worth mentioning that one of the possible improvements that can be considered in future studies is using more accurate local bathymetry datasets, especially for nearshore shallow water areas, since it can make a great impact on the reliability and accuracy of the tsunami simulation.
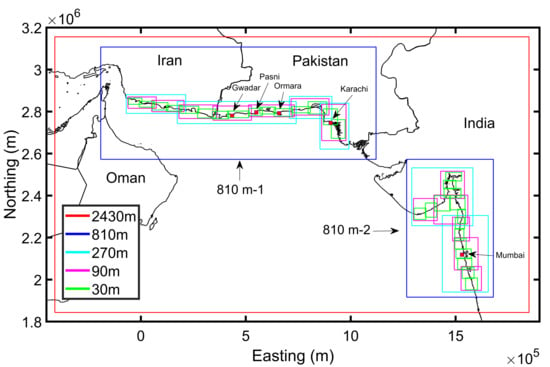
The developed nesting grid system for the MSZ has five levels. The coarsest grid is 2430 m, while the finest grid is 30 m. A factor of 3 is considered to connect grid levels with different resolutions. The crudest 2430 m region covers the entire offshore and onshore areas of the MSZ. There are two 810 m regions shown in Figure 4a. The 810 m-1 region covers the nearshore area of Makran; within the 810 m-1, four 270 m regions, seven 90 m, and fifteen 30 m regions are defined. In addition, the 810 m-2 region covers the offshore area near Mumbai, and within it, two 270 m regions, six 90 m, and fifteen 30 m are defined.
2.3. Tsunami Simulation
The numerical code developed by Goto et al. (1997) is used for tsunami modeling. This code can simulate offshore tsunami propagation from a source region to coastal areas and can simulate onshore inundation and run-up by solving non-linear shallow water equations using a leap-frog staggered-grid finite difference scheme [35].
To perform a tsunami simulation and generate results for the Iran and Pakistan shoreline (nearshore area), the deformation due to fault rupture is computed at the 810 m resolution (Figure 4a) using Okada [36] and Tanioka-Satake [37] equations. To obtain the maximum coastal wave height of a tsunami along the Iran and Pakistan shorelines, the finest grid with a resolution of 270 m and a time step of 1 s is used. The time step for the simulation is determined by satisfying the Courant–Friedrichs–Lewys criterion. To generate time histories of tsunami waves at Karachi, the grid resolution is set to 30 m with the simulation time step of 0.5 s. The duration of each simulation is set to 5 h for the above-mentioned areas. For Pasni, the aforementioned parameters are 30 m and 0.1 s. No tidal variation is considered. On the other hand, to perform a tsunami simulation for Mumbai, the finest grid resolution is set to 90 m with the time step of 2 s. The duration of each simulation is set to 7 h, and no tidal variation is considered. In all cases, the effects of bottom friction on tsunami flows are considered in the simulation using Manning’s formula with a uniform roughness coefficient of 0.025.
2.4. Stochastic Tsunami Simulation
The stochastic tsunami simulation consists of two main parts. The first part is to generate multiple earthquake sources, and the second part is to perform Monte Carlo tsunami simulations. For this purpose, numerous stochastic source models are generated for a specified earthquake scenario. A flowchart of the procedure is shown in Figure 5. The procedure for the MSZ stochastic analysis is briefly described in the following [38].
The first step is to define an earthquake scenario. Initially, an appropriate tsunami source zone is defined (Section 2.1). The source zone model introduced in Figure 3b is used for the MSZ. Then, the moment magnitude of the earthquake is selected. Since the objective of this work is to study the 1945 event, the Mw 8.1–8.3 is considered. Lastly, the asperity zone and its respective slip concentration range within the source zone model are defined (Figure 3b). An asperity zone is an area where a certain percentage of the total slip, determined by a slip concentration range, should occur. In this study, most asperities are considered to occur in the shallow part of the fault plane at depths less than 11 km near the trench line, and the slip concentration range is set to 65–90%. In other words, 65–90% of the generated earthquake slip should be concentrated in the specified asperity region.
Once the earthquake scenario is defined, the source parameters are generated using the global scaling relationships [23] as a second step. The source parameters are as follows: , , , , , , , and . Consistency among the generated values is checked by comparing the simulated seismic moment (; . [12]) with the target seismic moment (defined as a scenario magnitude in the first step). If the target seismic moment and simulated seismic moment are not consistent, the values of , , and are regenerated until the scenario magnitude criterion is met.
The slip distribution on the fault plane is determined in the third step. A random slip field is generated using the spatial slip distribution parameters that are produced in the second step based on the Fourier integral method [16]. After that, the Box–Cox transformation is used to convert the generated random slip field to the slip distribution with realistic positive values. Once the Box–Cox transformation is performed, the slip distribution is modified to avoid very large slip values more than the target maximum slip and to acquire the target mean slip . Lastly, the slip distribution is randomly positioned within the source zone model.
Two checking criteria determine whether a generated source model is acceptable or not. The first criterion is about the asperity area ratio of the synthesized slip distribution. In this study, it is required to fall within the range between 0.15 and 0.35, which corresponds to approximately mean minus/plus two standard deviations of the asperity area ratio [23]. The second criterion is related to the slip concentration range. As mentioned above, the range is set to 65–90%. The consistency of the generated source model with these two criteria means that it is in agreement with the seismological characteristics of the target region [38]. Several generated stochastic cases for the MSZ are shown in Figure 6.
Once the source model is finalized, as the fourth step, the tsunami simulation is performed for the accepted source model. The described stochastic tsunami simulation procedure is conducted repeatedly until the target number of accepted source models is generated. Subsequently, the results for the tsunami wave height, time histories at locations of interest, and inundation are obtained for each source.
2.5. Observations
The tsunami waveforms recorded on the tide gauges in Karachi (Pakistan) and Mumbai (India) from the 1945 event are used in this study to compare with simulated waveforms from the stochastic sources. During the event, these two tide gauges were operated by the Survey of India (SOI). These waveforms were firstly introduced by Neetu et al. [11]. Within the first hour after the occurrence of the 1945 event, no data are available at the Karachi tide gauge, because it was not working. Digitization of the existing water level observations at Karachi and Mumbai is performed at a regular time interval of 1.5 min. Similar to [12], tidal waves are removed from the waveform records using [39].
There are limited data available for the nearshore run-up height for the 1945 event. According to Page et al. [8], there are reports from local inhabitants who indicated the run-up height of 7–10 m at Pasni. On the other hand, according to Ambraseys and Melville [40], run-up heights of the tsunami at Pasni and Karachi were about 4–5 m and 1.5 m, respectively. According to the field investigation conducted by Page et al. [8], Ormara experienced an uplift of 1–3 m due to the 1945 event. They reported that the pre-1945 beaches are now traceable inland, and that there is a tombolo in the north of Ormara; it broadened several hundred meters due to the uplift.
3. Results
In this section, initially, key features of stochastic earthquake slip models for the 1945 Makran earthquake are described. Then, results of the simulations are compared with the existing observations of the 1945 event. In the following, we evaluate the effects of earthquake slip and fault geometry on tsunami simulation results by investigating coastal tsunami heights along Iran and Pakistan. Using these results, a stochastic source model that matches the existing observations of the 1945 event is identified. The results highlight the sensitivity of the maximum coastal tsunami heights along the coastline to the location of a large-slip area of the source models.
3.1. Stochastic Slip Models
The 1945 earthquake is chosen because this is the only major tsunamigenic event in the region that has available recorded data, and its moment magnitude (Mw 8.1–8.3) is large enough to cause significant casualties and economic losses. In addition, there are inverted source models available for the 1945 event. The source model developed by Heidarzadeh and Satake [12] (Figure 2e; hereafter HDZ-2015) is considered in this study because it can produce more consistent results compared to the existing observations of the 1945 event.
To perform stochastic tsunami simulations, a set of 1000 stochastic sources is generated for Mw 8.1–8.3. Five examples of the generated source models are shown in Figure 6a–e. The sources with the model ID 320 and 730 show the extent of variability in magnitudes among generated stochastic sources (Figure 6b,d). In addition, the source models 169, 18, and 348 are the sources that generate the best matching source model for the 1945 Makran event and the 97.5th and 84th percentiles of the maximum tsunami wave height at Pasni, respectively (Figure 6a,c,e). The details will be provided in the next sections. The realistic location of the maximum slips in the source models near the trench line and plausible distribution of the slip values around the maximum slips can be observed in Figure 6. The magnitudes of the generated stochastic sources are in the range of Mw 8.1–8.3, and the magnitude of the overall average slip model for all stochastic sources, shown in Figure 6f, is Mw 8.17. The overall average slip model (Figure 6f) is generated by calculating the average slip of each sub-fault using the 1000 stochastic sources. It is noted that this average magnitude is smaller than that of the HDZ-2015 model (Mw 8.27). As will be discussed below related to Figure 7, the width of the HDZ-2015 model is smaller than most of the generated stochastic models, but its length is similar to the average length for the stochastic sources. In addition, half of the fault rupture area of the HDZ-2015 model experiences a slip greater than 10 m, while relatively few sub-faults of the generated stochastic sources experience large slips close to the maximum slip.
Figure 7 shows how the stochastic source models and HDZ-2015 model [12] compare with the global scaling relationships [23]. The estimated parameters for the stochastic sources are consistent with the scaling relationships. The parameters for most cases fall within the prediction intervals between 16th and 84th percentiles of the scaling equations. On the other hand, the width and mean slip of the HDZ-2015 model are lower and higher than the predicted values, respectively. As a result, the areas and slips of the source models are relatively small and large; this will cause the concentrated tsunami waves.
3.2. Comparison with Observations
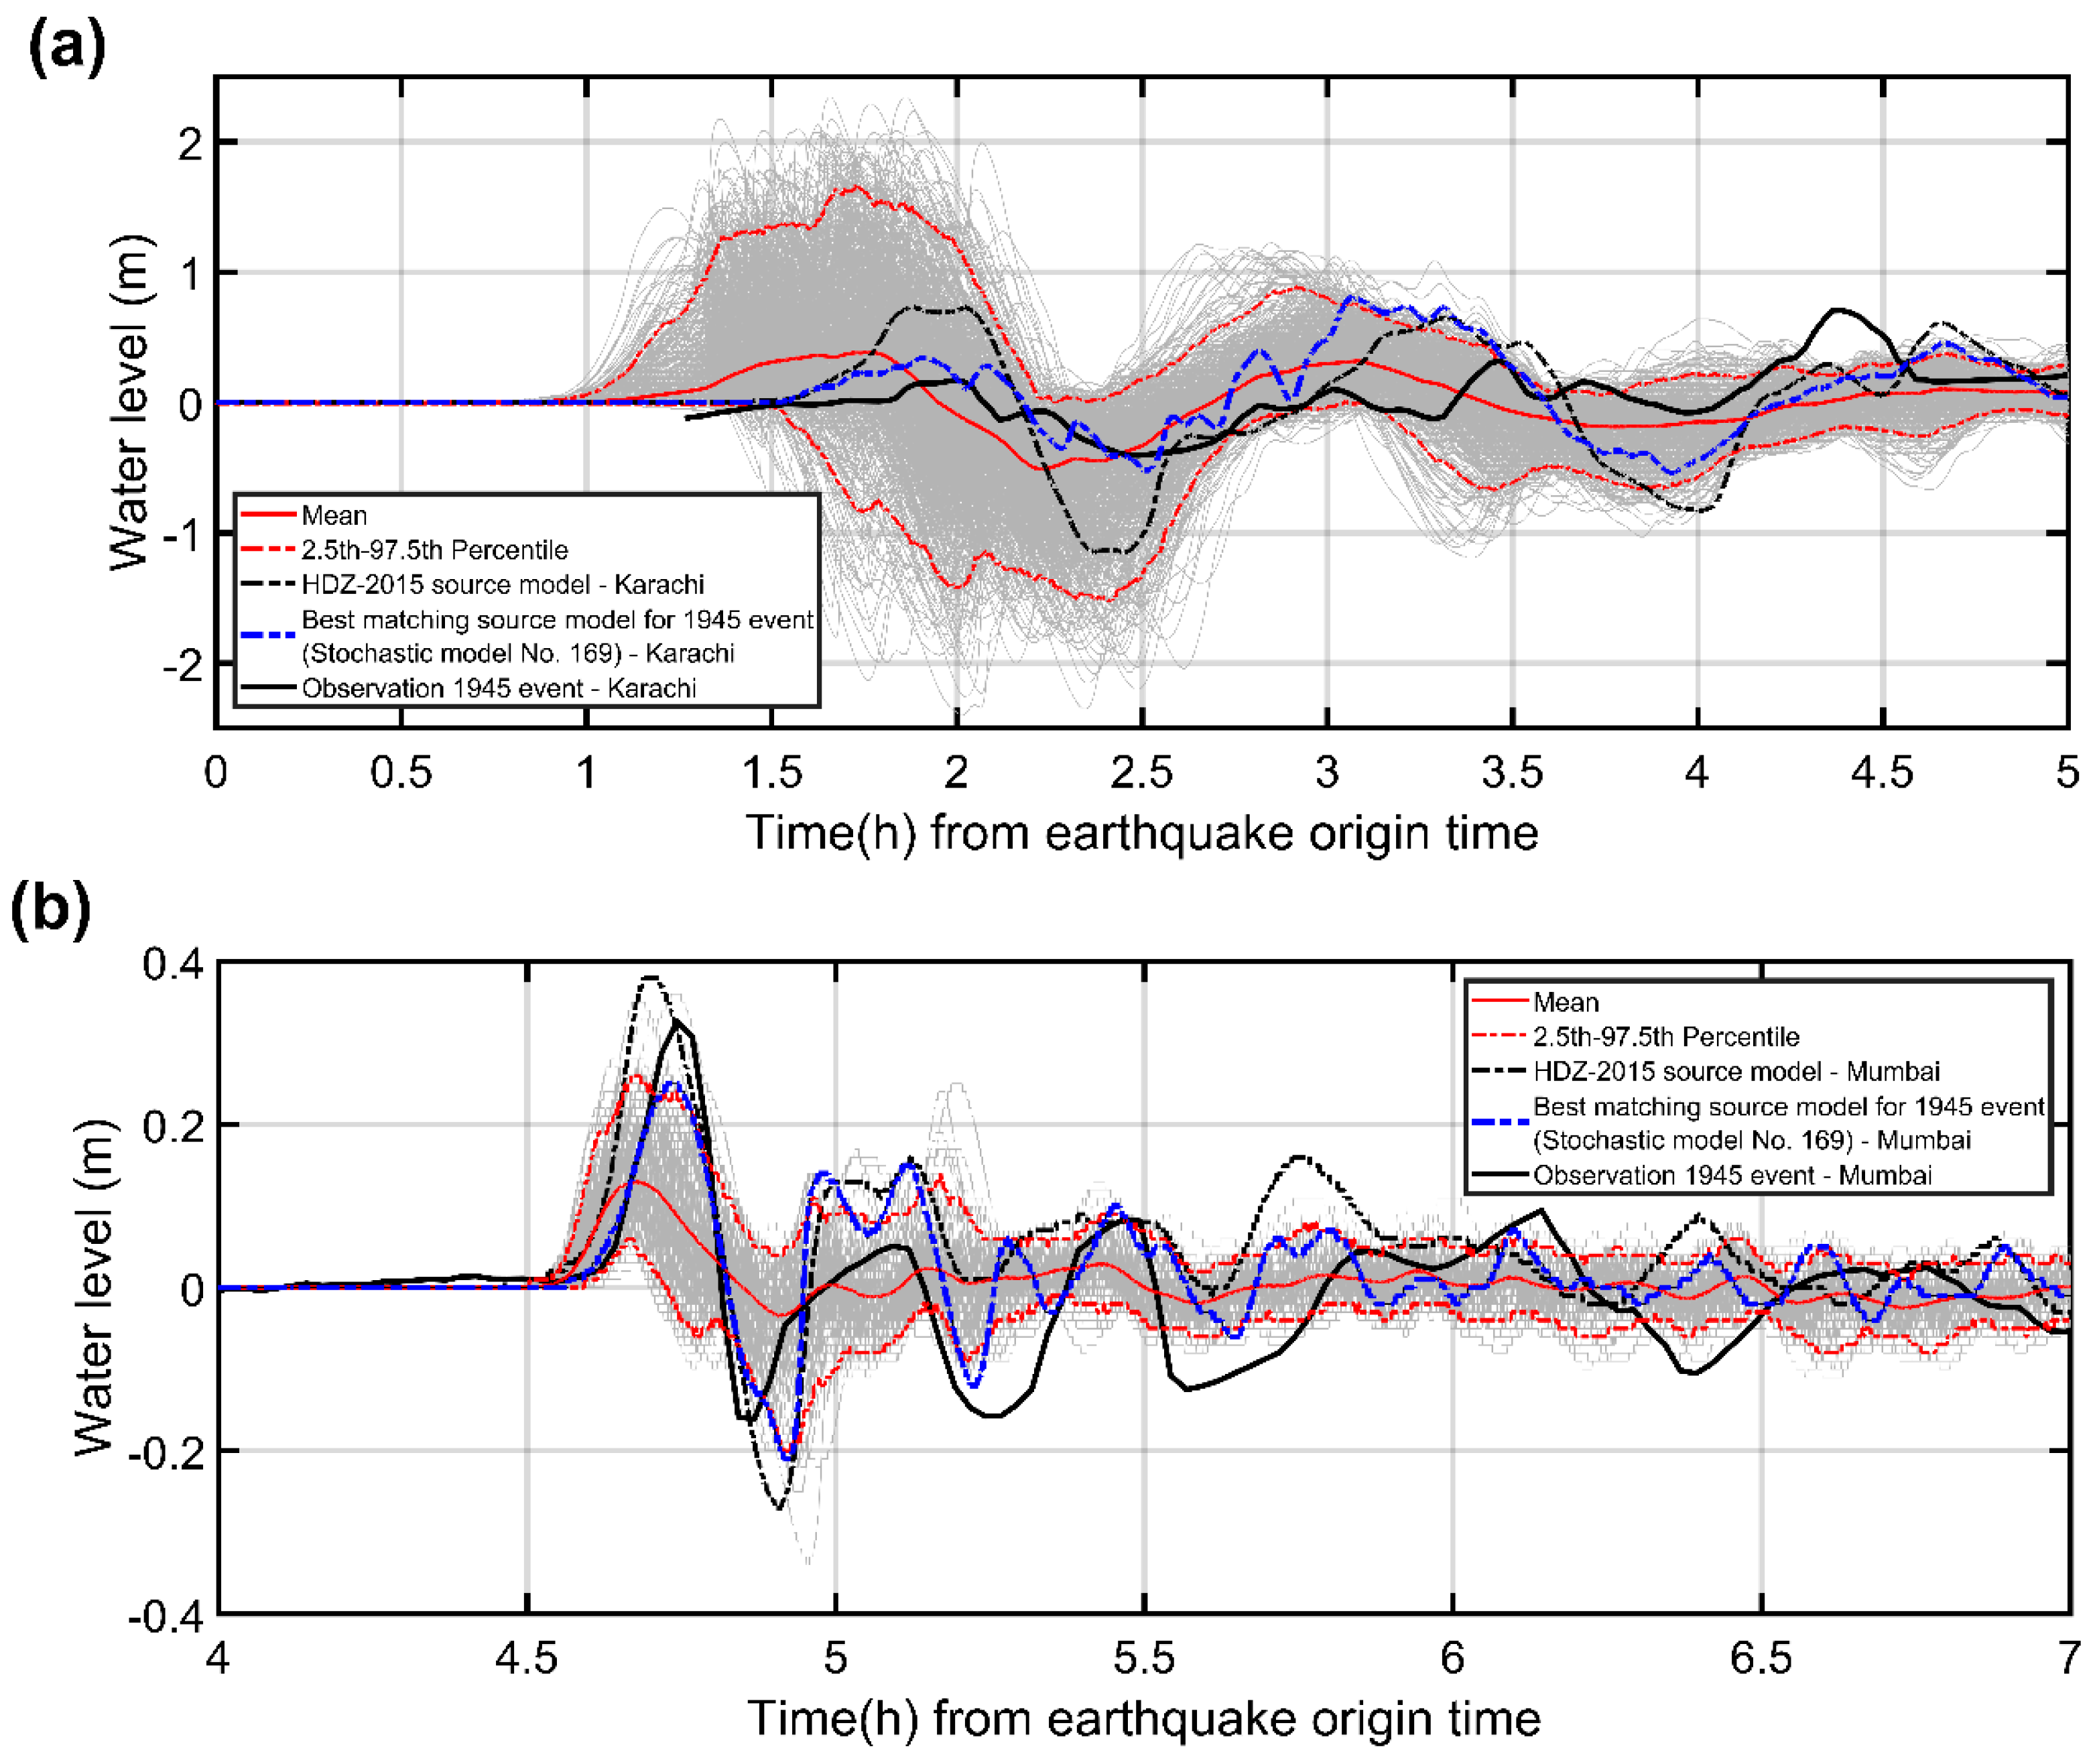
Time histories of tsunami waves (temporal profiles) at Karachi and Mumbai are generated using the 1000 stochastic source models for the 1945 event (Figure 8). The Karachi recording station is located at 67.0014° E and 24.7767° N at a water depth of 5 m, whereas the Mumbai recording station is located at 72.8177° E and 18.8727° N at a water depth of 6 m. Figure 8 shows the mean, 97.5th percentile, and 2.5th percentile for the stochastic source models. In addition, generated results using the HDZ-2015 model and tide gauge observations of Karachi and Mumbai for the 1945 event are shown in Figure 8. The results for the Karachi recording station (Figure 8a) show that the first wave amplitude of the mean results based on the stochastic models is similar to the HDZ-2015 model, whereas both of them are greater than the first wave amplitude of the existing observation. According to Figure 8b, the first wave amplitude of the 97.5th percentile of the results for the stochastic sources is in good agreement with the first wave amplitude of the existing observation. In addition, the first waves generated by the stochastic sources and the HDZ-2015 model occur approximately at the same time, which is also consistent with the existing observation at Mumbai. According to Figure 8, the observations can be enclosed by the stochastic methods, but the corresponding percentiles for the best matching case by inspection (among the percentiles) are different, depending on the recording stations. This motivates us to investigate not just percentile curves but also simulated waves from specific source models being close to the observations simultaneously.
Field investigations by Page et al. [8] showed Ormara experienced a coseismic uplift of 1–3 m. Figure 9 shows a histogram of the simulated deformations at Ormara. The results indicate that most of the deformation results due to the stochastic slips at Ormara are around 0 m. The deformation at Ormara due to the HDZ-2015 model is around 0.85 m uplift.
To identify the best matching source for the 1945 event among the stochastic slips, the sum of squared errors between the simulated and observed time series over the duration of the first wave is calculated: . Moreover, for the deformation results at Ormara, squared errors between the simulated deformation results and the observation are calculated: . The existing observations of the 1945 event are limited to two far-field time series and one coseismic deformation, which was based on local inhabitants’ accounts gathered circa 30 years after the event. The simulation results and existing observations for Mumbai are more consistent than the counterparts for Karachi and Ormara. As a result, the calculated errors between observations and simulation results for Mumbai are considerably lower than the calculated errors between observations and simulation results for Karachi and Ormara. In other words, there are more stochastic source models that can produce results similar to the observations for Mumbai compared to Karachi and Ormara. Subsequently, the observation at Mumbai is taken as the primary target, and thus, it is weighted greater. The time history of tsunami waves at Mumbai is selected as the main indicator for identifying the best matching source model for the 1945 event. Given this priority for Mumbai, essentially, the best matching source models are identified in two stages. In the first stage, the top 20 stochastic sources that generated a close match for Mumbai are selected and ranked based on their calculated error metrics. Then, for each of these stochastic sources, simulation results for the tsunami coastal wave heights at Karachi and deformation at Ormara are investigated by analyzing its respective ranking for Karachi and Ormara (Table 1). Ultimately, the source model 169 is chosen as the best matching source model for the 1945 event. This source model is shown in Figure 6a. According to Figure 8, it generates similar first waves at Mumbai in terms of arrival time and amplitude. In addition, the source model 169 generates the first wave at Karachi that has a similar arrival time and amplitude as the observation. Comparing with the HDZ-2015 model, the best matching source based on the 1000 stochastic models generates a more similar time series of tsunami waves at Mumbai and Karachi to the observations. Regarding the deformation at Ormara, the source model 169 produces an uplift of around 0.7 m, while the HDZ-2015 model generates an uplift of around 0.85 m. Our results are at the lower end of the reported coseismic deformation at Ormara (1–3 m). It is worth mentioning that the local inhabitants’ reports, which were gathered 33 years after the event, may be subjected to significant uncertainty.
3.3. Effect of Earthquake Slip and Fault Geometry on Tsunami Simulation Results
The maximum coastal tsunami wave heights along the shoreline of Iran and Pakistan generated by the 1000 stochastic models and the HDZ-2015 source model for the 1945 event are shown in Figure 10a. These maximum wave heights are calculated at 906 locations along the shoreline (Figure 10b) with circa 10 m water depth and 1 km interval. The mean, 97.5th percentile, and 2.5th percentile of the results from the stochastic sources are shown in Figure 10a alongside the results for the HDZ-2015 model, which are shown with a blue solid line. The maximum tsunami heights for the eastern part of the shoreline (longitudes > 62° E) are higher than the western part due to the large slip areas in the eastern part (Figure 6f), which are determined according to the asperity zone (Figure 3b). Although there are significant differences between the mean results for the stochastic sources and the results due to the HDZ-2015 model, the 97.5th percentile of results for the stochastic sources are in good agreement for longitudes < 63.5° E. This is because the magnitude of the HDZ-2015 model (Mw 8.27) and the upper bound of the range of stochastic sources magnitudes (Mw 8.1–8.3) are relatively close. It is noteworthy that the peaks at 63° E and 64.5° E due to the mean, 97.5th, and 2.5th percentiles originate from different sources. The maximum wave height generated by the best matching source model 169 for the 1945 event has a peak at 63° E. It is due to the location of the large-slip area of the source model 169 near 63° E (Figure 6a). The maximum wave height generated by the source model 169 is similar to the maximum wave height produced by the HDZ-2015 model in terms of peak amplitude and location.
Figure 11 shows the maximum surface elevation height due to the stochastic models and the HDZ-2015 source model for the 1945 event in the area that encompasses Gwadar. The maximum wave heights due to the best matching stochastic source model 169 (Figure 11a) are similar to the maximum wave heights generated by the HDZ-2015 model (Figure 11b). The amplitudes of the 97.5th percentile of the maximum tsunami heights (Figure 11c) are similar to the amplitudes generated by the HDZ-2015 model. The 97.5th percentile source model for Gwadar is the stochastic source 730 (Figure 6b). This is because of the considerable difference between the magnitudes of the stochastic sources (Mw 8.1–8.3) and the HDZ-2015 model (Mw 8.27). Generating results in multiple levels is an advantage of the stochastic method that we are presenting in this study, and we believe this is the first time that such comprehensive results are presented for the MSZ. It is noteworthy that multiple levels of results would be useful for tsunami risk management.
Three main factors affect the wave amplitudes in coastal areas. The first factor is source characteristics, such as the location of large-slip areas and the amount of slip values. Secondly, the wave amplitudes are influenced by large-scale bathymetry features of the coastal area. These features cause wave shoaling and focusing. The third factor is the shape of the bay, which enables the convergence of the energy. The HDZ-2015 source model and stochastic source model 169 are located near Gwadar, and this accounts for the relatively high offshore tsunami amplitudes in Figure 11a,b. The effect of wave shoaling in the area can be analyzed using the parameter h−1/4, where h is the water depth. These are approximate and are provided just to help the discussion be clearer. Figure 11d shows the spatial distribution of h−1/4 in the area. The value of h−1/4 generally increases from offshore to onshore due to the decreasing water depth, except for the areas in the western and eastern shores of Gwadar. The eastern and western shores of Gwadar have the maximum water depths of around 150 m and 175 m, respectively, which are relatively deep. These water depths alongside the shapes of the bays account for the lower amplitudes of maximum tsunami heights in the east and west of Gwadar.
Finally, Figure 12 shows the inundation and run-up maps near Pasni due to the best matching stochastic source 169, HDZ-2015 model, and the stochastic source 18 (Figure 6c), whereas Figure 12d shows the spatial distribution of h−1/4 in the area. The analysis of inundation and run-up has been conducted using the 30 m resolution grids. The stochastic source 18 generates the 97.5th percentile of the maximum tsunami wave height at Pasni (Figure 10). The results indicate that the maximum run-up height due to the stochastic source 169, HDZ-2015 model, and the stochastic source 18 are around 4.4, 4.5, and 5.8 m, respectively. According to the run-up heights at Pasni reported by Page et al. [8] (7–10 m) and Ambraseys and Melville [40] (4–5 m) and considering the fact that they might be overestimated due to the eyewitness accounts, the maximum run-up heights based on the source models 169, 18, and HDZ-2015 are in good agreement with the existing reports.
4. Conclusions
The stochastic tsunami simulations for Mw 8.1–8.3 scenarios were carried out for the Makran Subduction Zone (MSZ). The uncertainties related to rupture geometry and slip heterogeneity were considered in this study. The consideration of different sizes of rupture areas for the MSZ based on empirical scaling relationships was an important improvement with respect to the approach adopted by previous studies for the region, resulting in a more realistic characterization of earthquake source models for megathrust subduction events. Moreover, for the first time, the new geometry for the MSZ proposed by Slab2 was used. To develop nesting grid systems, the GEBCO 2019 dataset with a resolution of 15 arc-sec (about 450 m) and the SRTM dataset with a resolution of 1 arc-sec (about 30 m) were used as bathymetry and DEM data, respectively.
The tsunami simulation results generated by the stochastic slip sources were compared with the results based on the Heidarzadeh and Satake [12] source model and existing observations of the 1945 event. The generated results indicated high sensitivity to the source model characteristics, such as locations of large slip areas. The results were generally consistent with the existing observations of the 1945 event. The best matching source model of the 1945 event was identified among the 1000 generated stochastic models. This source model matched the observed time series of tsunami waves at Karachi and Mumbai and coseismic deformation at Ormara closely.
In future studies, probabilistic tsunami hazard analysis for the MSZ can be performed by extending the presented work and considering multiple cases for larger magnitudes due to the full rupture area of the MSZ and occurrence probability as well as slip patterns [41]. In addition, using more accurate local bathymetry datasets for the nearshore shallow water areas and assessing tsunami damage to coastal structures along the shoreline can be considered as topics for future research.
Author Contributions
P.M. and K.G. carried out the analyses and prepared the draft. M.H. provided the tsunami waveform data for the 1945 Makran event and edited the draft. J.Q. set up the tsunami simulations on SHARCNET. All authors have read and agreed to the published version of the manuscript.
Funding
The work was supported by the Canada Research Chair program (950-232015) and the NSERC Discovery Grant (RGPIN-2019-05898). This research was also supported by the SHARCNET Dedicated Programming Competition Round XVI and the computation was carried out using SHARCNET. MH was supported by the Royal Society (UK) grant CHL\R1\180173. The APC was funded by the Canada Research Chair program (950-232015) and the NSERC Discovery Grant (RGPIN-2019-05898).
Conflicts of Interest
The authors declare no conflict of interest.
References
- Tomotsuka, T.; Kazumasa, K.; Fumihiko, I.; Yoshiaki, K.; Susumu, M.; Shigeo, T. Tsunami: To Survive from Tsunami; World Scientific: Singapore, 2018; Volume 46, ISBN 9813239409. [Google Scholar]
- Kajitani, Y.; Chang, S.E.; Tatano, H. Economic Impacts of the 2011 Tohoku-Oki Earthquake and Tsunami. Earthq. Spectra 2013, 29, 457–478. [Google Scholar] [CrossRef]
- Fraser, S.A.; Raby, A.C.; Pomonis, A.; Goda, K.; Chian, S.C.; Macabuag, J.; Offord, M.; Saito, K.; Sammonds, P. Tsunami damage to coastal defences and buildings in the March 11th 2011 M w 9.0 Great East Japan earthquake and tsunami. Bull. Earthq. Eng. 2012, 11, 205–239. [Google Scholar] [CrossRef]
- Synolakis, C.E.; Bernard, E.N. Tsunami science before and beyond Boxing Day 2004. Philos. Trans. R. Soc. A: Math. Phys. Eng. Sci. 2006, 364, 2231–2265. [Google Scholar] [CrossRef]
- Byrne, D.E.; Sykes, L.R.; Davis, D.M. Great thrust earthquakes and aseismic slip along the plate boundary of the Makran Subduction Zone. J. Geophys. Res. Space Phys. 1992, 97, 449–478. [Google Scholar] [CrossRef]
- ArrayExpress—A Database of Functional Genomics Experiments. Available online: http://www.ebi.ac.uk/arrayexpress/ (accessed on 12 November 2012).
- Duda, S.J. Secular seismic energy release in the circum-Pacific belt. Tectonophysics 1965, 2, 409–452. [Google Scholar] [CrossRef]
- Page, W.D.; Alt, J.N.; Cluff, L.S.; Plafker, G. Evidence for the recurrence of large-magnitude earthquakes along the Makran coast of Iran and Pakistan. Tectonophysics 1979, 52, 533–547. [Google Scholar] [CrossRef]
- Heck, N.H. List of seismic sea waves. Bull. Seismol. Soc. Am. 1947, 37, 269–286. [Google Scholar]
- Heidarzadeh, M.; Pirooz, M.D.; Zaker, N.H.; Yalciner, A.C. Preliminary estimation of the tsunami hazards associated with the Makran subduction zone at the northwestern Indian Ocean. Nat. Hazards 2008, 48, 229–243. [Google Scholar] [CrossRef]
- Neetu, S.; Suresh, I.; Shankar, R.; Nagarajan, B.; Sharma, R.; Shenoi, S.S.C.; Unnikrishnan, A.S.; Sundar, D. Trapped waves of the 27 November 1945 Makran tsunami: Observations and numerical modeling. Nat. Hazards 2011, 59, 1609–1618. [Google Scholar] [CrossRef]
- Heidarzadeh, M.; Satake, K. New Insights into the Source of the Makran Tsunami of 27 November 1945 from Tsunami Waveforms and Coastal Deformation Data. Pure Appl. Geophys. 2014, 172, 621–640. [Google Scholar] [CrossRef]
- Heidarzadeh, M.; Satake, K. A Combined Earthquake–Landslide Source Model for the Tsunami from the 27 November 1945 M w 8.1 Makran Earthquake. Bull. Seismol. Soc. Am. 2017, 107, 1033–1040. [Google Scholar] [CrossRef] [Green Version]
- Jaiswal, R.K.; Singh, A.P.; Rastogi, B.K. Simulation of the Arabian Sea Tsunami propagation generated due to 1945 Makran Earthquake and its effect on western parts of Gujarat (India). Nat. Hazards 2008, 48, 245–258. [Google Scholar] [CrossRef]
- Heidarzadeh, M.; Pirooz, M.D.; Zaker, N.H.; Synolakis, C.E. Evaluating Tsunami Hazard in the Northwestern Indian Ocean. Pure Appl. Geophys. 2008, 165, 2045–2058. [Google Scholar] [CrossRef]
- Mai, P.M.; Beroza, G.C. A spatial random field model to characterize complexity in earthquake slip. J. Geophys. Res. Space Phys. 2002, 107, ESE 10-1–ESE 10-21. [Google Scholar] [CrossRef]
- Fukutani, Y.; Suppasri, A.; Imamura, F. Stochastic analysis and uncertainty assessment of tsunami wave height using a random source parameter model that targets a Tohoku-type earthquake fault. Stoch. Environ. Res. Risk Assess. 2014, 29, 1763–1779. [Google Scholar] [CrossRef] [Green Version]
- Woessner, J.; Farahani, R.J. Tsunami inundation hazard across Japan. Int. J. Disaster Risk Reduct. 2020, 49, 101654. [Google Scholar] [CrossRef]
- Mori, N.; Muhammad, A.; Goda, K.; Yasuda, T.; Ruiz-Angulo, A. Probabilistic Tsunami Hazard Analysis of the Pacific Coast of Mexico: Case Study Based on the 1995 Colima Earthquake Tsunami. Front. Built Environ. 2017, 3, 34. [Google Scholar] [CrossRef]
- Muhammad, A.; Goda, K.; Alexander, N.A. Tsunami Hazard Analysis of Future Megathrust Sumatra Earthquakes in Padang, Indonesia Using Stochastic Tsunami Simulation. Front. Built Environ. 2016, 2, 33. [Google Scholar] [CrossRef] [Green Version]
- González, J.; González, G.; Aránguiz, R.; Melgar, D.; Zamora, N.; Shrivastava, M.N.; Das, R.; Catalán, P.A.; Cienfuegos, R. A hybrid deterministic and stochastic approach for tsunami hazard assessment in Iquique, Chile. Nat. Hazards 2019, 100, 231–254. [Google Scholar] [CrossRef]
- Rashidi, A.; Shomali, Z.H.; Dutykh, D.; Farajkhah, N.K. Tsunami hazard assessment in the Makran subduction zone. Nat. Hazards 2020, 100, 861–875. [Google Scholar] [CrossRef] [Green Version]
- Goda, K.; Yasuda, T.; Mori, N.; Maruyama, T. New Scaling Relationships of Earthquake Source Parameters for Stochastic Tsunami Simulation. Coast. Eng. J. 2016, 58, 1650010. [Google Scholar] [CrossRef] [Green Version]
- Hayes, G.P.; Moore, G.L.; Portner, D.E.; Hearne, M.; Flamme, H.; Furtney, M.; Smoczyk, G.M. Slab2, a comprehensive subduction zone geometry model. Science 2018, 362, 58–61. [Google Scholar] [CrossRef] [PubMed]
- Smith, G.L.; McNeill, L.C.; Wang, K.; He, J.; Henstock, T.J. Thermal structure and megathrust seismogenic potential of the Makran subduction zone. Geophys. Res. Lett. 2013, 40, 1528–1533. [Google Scholar] [CrossRef] [Green Version]
- Bird, P. An updated digital model of plate boundaries. Geochem. Geophys. Geosystems 2003, 4, 4. [Google Scholar] [CrossRef]
- Müller, R.D.; Roest, W.R.; Royer, J.-Y.; Gahagan, L.M.; Sclater, J.G. Digital isochrons of the world’s ocean floor. J. Geophys. Res. Space Phys. 1997, 102, 3211–3214. [Google Scholar] [CrossRef]
- Gudmundsson, Ó.; Sambridge, M. A regionalized upper mantle (RUM) seismic model. J. Geophys. Res. Space Phys. 1998, 103, 7121–7136. [Google Scholar] [CrossRef]
- Syracuse, E.M.; Abers, G.A. Global compilation of variations in slab depth beneath arc volcanoes and implications. Geochem. Geophys. Geosystems 2006, 7, 7. [Google Scholar] [CrossRef]
- Hayes, G.P.; Wald, D.J.; Johnson, R.L. Slab1.0: A three-dimensional model of global subduction zone geometries. J. Geophys. Res. Space Phys. 2012, 117, 117. [Google Scholar] [CrossRef]
- Penney, C.; Tavakoli, F.; Saadat, A.; Nankali, H.R.; Sedighi, M.; Khorrami, F.; Sobouti, F.; Rafi, Z.; Copley, A.; Jackson, J.; et al. Megathrust and accretionary wedge properties and behaviour in the Makran subduction zone. Geophys. J. Int. 2017, 209, 1800–1830. [Google Scholar] [CrossRef]
- Mai, P.M.; Thingbaijam, K.K.S. SRCMOD: An Online Database of Finite-Fault Rupture Models. Seism. Res. Lett. 2014, 85, 1348–1357. [Google Scholar] [CrossRef]
- GEBCO. The GEBCO_2019 Grid: A Continuous Terrain Model of the Global Oceans and Land. Available online: https://www.gebco.net/data_and_products/gridded_bathymetry_data/gebco_2019/gebco_2019_info.html (accessed on 9 October 2020).
- USGS. Shuttle Radar Topography Mission (SRTM) 1 Arc-Second Global; U.S. Geological Survey: Reston, VA, USA, 2015.
- Goto, C.; Ogawa, Y.; Shuto, N.; Imamura, F. Numerical Method of Tsunami Simulation with the Leap-Frog Scheme; Intergovernmental Oceanographic Commission of UNESCO: Paris, France, 1997; Volume 35, p. 126. [Google Scholar]
- Okada, Y. Surface deformation due to shear and tensile faults in a half-space. Bull. Seismol. Soc. Am. 1985, 75, 1135–1154. [Google Scholar]
- Tanioka, Y.; Satake, K. Tsunami generation by horizontal displacement of ocean bottom. Geophys. Res. Lett. 1996, 23, 861–864. [Google Scholar] [CrossRef] [Green Version]
- Goda, K.; Song, J. Uncertainty modeling and visualization for tsunami hazard and risk mapping: A case study for the 2011 Tohoku earthquake. Stoch. Environ. Res. Risk Assess. 2015, 30, 2271–2285. [Google Scholar] [CrossRef] [Green Version]
- Bell, C.; Vassie, J.M.; Woodworth, P.L. POL/PSMSL Tidal Analysis Software Kit 2000 (TASK-2000); Permanent Service for Mean Sea Level, CCMS Proudman Oceanographic Laboratory, Bidston Observatory: Birkenhead, UK, 1999; Volume 20, pp. 32–46. [Google Scholar]
- Ambraseys, N.; Melville, C.P. A History of Persian Earthquakes; Cambridge University Press: New York, NY, USA, 1982. [Google Scholar]
- De Risi, R.; Goda, K. Simulation-Based Probabilistic Tsunami Hazard Analysis: Empirical and Robust Hazard Predictions. Pure Appl. Geophys. 2017, 174, 3083–3106. [Google Scholar] [CrossRef] [Green Version]
Figure 1.
The Makran Subduction Zone in the northwestern Indian Ocean showing major coastal cities and tectonic setting.
Figure 1.
The Makran Subduction Zone in the northwestern Indian Ocean showing major coastal cities and tectonic setting.

Figure 2.
Different tsunami source models for the 1945 Makran event. (a) Heidarzadeh et al. (2008), (b) Jaiswal et al. (2009), (c) Heidarzadeh et al. (2009), (d) Neetu et al. (2011), and (e) Heidarzadeh and Satake (2015).
Figure 2.
Different tsunami source models for the 1945 Makran event. (a) Heidarzadeh et al. (2008), (b) Jaiswal et al. (2009), (c) Heidarzadeh et al. (2009), (d) Neetu et al. (2011), and (e) Heidarzadeh and Satake (2015).

Figure 3.
(a) Makran fault plane geometry based on Slab2 in comparison with the PB2002 geometry and (b) tsunami source zone model (i.e., new Makran fault plane model).
Figure 3.
(a) Makran fault plane geometry based on Slab2 in comparison with the PB2002 geometry and (b) tsunami source zone model (i.e., new Makran fault plane model).

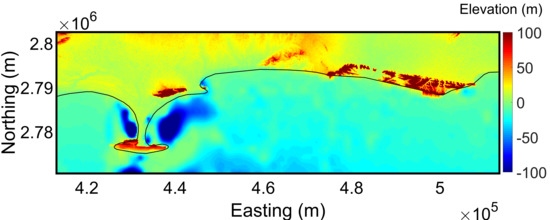
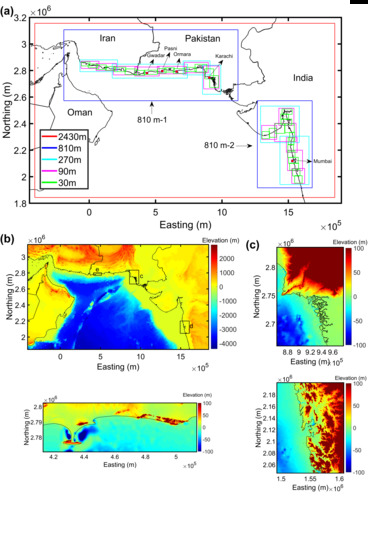
Figure 4.
(a) Tsunami computational domain (grids with resolutions of 2430, 810, 270, 90, and 30 m). Bathymetry and digital elevation model data for: (b) 2430 m region, (c) 90 m region around Karachi, (d) 30 m region around Gwadar, and (e) 90 m region around Mumbai.
Figure 4.
(a) Tsunami computational domain (grids with resolutions of 2430, 810, 270, 90, and 30 m). Bathymetry and digital elevation model data for: (b) 2430 m region, (c) 90 m region around Karachi, (d) 30 m region around Gwadar, and (e) 90 m region around Mumbai.

Figure 5.
Flowchart of stochastic tsunami simulation applied in this study.

Figure 6.
(a–e) Five stochastic source models (Mw 8.1–8.3), and (f) overall average slip model based on the 1000 stochastic sources (Mw 8.1–8.3) (L: fault length, W: fault width, Da: mean slip, Dm: maximum slip).
Figure 6.
(a–e) Five stochastic source models (Mw 8.1–8.3), and (f) overall average slip model based on the 1000 stochastic sources (Mw 8.1–8.3) (L: fault length, W: fault width, Da: mean slip, Dm: maximum slip).

Figure 7.
Comparison of 1000 stochastic source parameters (green dots) and parameters of the HDZ-2015 model with the corresponding scaling relationships for (a) fault length L, (b) fault width W, (c) mean slip Da, and (d) maximum slip Dm.
Figure 7.
Comparison of 1000 stochastic source parameters (green dots) and parameters of the HDZ-2015 model with the corresponding scaling relationships for (a) fault length L, (b) fault width W, (c) mean slip Da, and (d) maximum slip Dm.

Figure 8.
Comparison of time histories of tsunami wave for the 1000 stochastic models (mean, 97.5th percentile, and 2.5th percentile) and the HDZ-2015 model with the observations at the Karachi (a) and Mumbai (b) stations.
Figure 8.
Comparison of time histories of tsunami wave for the 1000 stochastic models (mean, 97.5th percentile, and 2.5th percentile) and the HDZ-2015 model with the observations at the Karachi (a) and Mumbai (b) stations.

Figure 9.
Histogram of the simulated deformations at Ormara.

Figure 10.
(a) Maximum coastal tsunami wave heights generated by the 1000 stochastic models (mean, 97.5th percentile, and 2.5th percentile) and the HDZ-2015 model, and (b) major coastal cities along the shoreline of Iran and Pakistan.
Figure 10.
(a) Maximum coastal tsunami wave heights generated by the 1000 stochastic models (mean, 97.5th percentile, and 2.5th percentile) and the HDZ-2015 model, and (b) major coastal cities along the shoreline of Iran and Pakistan.

Figure 11.
Maximum wave height near Gwadar based on: (a) the best matching stochastic model 169 for the 1945 event, (b) the HDZ-2015 model, and (c) 97.5th-percentile stochastic model 730. (d) Spatial distribution of h−1/4.
Figure 11.
Maximum wave height near Gwadar based on: (a) the best matching stochastic model 169 for the 1945 event, (b) the HDZ-2015 model, and (c) 97.5th-percentile stochastic model 730. (d) Spatial distribution of h−1/4.

Figure 12.
Maximum wave height near Pasni based on: (a) the best matching stochastic model 169 for the 1945 event, (b) the HDZ-2015 model, and (c) 97.5th-percentile stochastic model 18. (d) Spatial distribution of h−1/4.
Figure 12.
Maximum wave height near Pasni based on: (a) the best matching stochastic model 169 for the 1945 event, (b) the HDZ-2015 model, and (c) 97.5th-percentile stochastic model 18. (d) Spatial distribution of h−1/4.


Table 1.
Top 20 best matching sources for Mumbai and their ranking values for Karachi and Ormara.
| Top 20 Sources for Mumbai | Ranking of the Selected Sources | ||
|---|---|---|---|
| Ranking | Source No. | For Karachi | For Ormara |
| 1 | 659 | 73 | 241 |
| 2 | 937 | 787 | 331 |
| 3 | 84 | 847 | 356 |
| 4 | 169 | 92 | 10 |
| 5 | 730 | 177 | 533 |
| 6 | 883 | 848 | 274 |
| 7 | 418 | 815 | 324 |
| 8 | 479 | 203 | 844 |
| 9 | 230 | 94 | 528 |
| 10 | 363 | 882 | 341 |
| 11 | 930 | 976 | 333 |
| 12 | 910 | 801 | 785 |
| 13 | 792 | 494 | 901 |
| 14 | 403 | 35 | 244 |
| 15 | 349 | 908 | 970 |
| 16 | 698 | 164 | 743 |
| 17 | 842 | 303 | 890 |
| 18 | 941 | 972 | 301 |
| 19 | 610 | 940 | 245 |
| 20 | 375 | 563 | 261 |
Publisher’s Note: MDPI stays neutral with regard to jurisdictional claims in published maps and institutional affiliations. |
© 2020 by the authors. Licensee MDPI, Basel, Switzerland. This article is an open access article distributed under the terms and conditions of the Creative Commons Attribution (CC BY) license (http://creativecommons.org/licenses/by/4.0/).
Share and Cite
MDPI and ACS Style
Momeni, P.; Goda, K.; Heidarzadeh, M.; Qin, J. Stochastic Analysis of Tsunami Hazard of the 1945 Makran Subduction Zone Mw 8.1–8.3 Earthquakes. Geosciences 2020, 10, 452. https://0-doi-org.brum.beds.ac.uk/10.3390/geosciences10110452
AMA Style
Momeni P, Goda K, Heidarzadeh M, Qin J. Stochastic Analysis of Tsunami Hazard of the 1945 Makran Subduction Zone Mw 8.1–8.3 Earthquakes. Geosciences. 2020; 10(11):452. https://0-doi-org.brum.beds.ac.uk/10.3390/geosciences10110452
Chicago/Turabian StyleMomeni, Payam, Katsuichiro Goda, Mohammad Heidarzadeh, and Jinhui Qin. 2020. "Stochastic Analysis of Tsunami Hazard of the 1945 Makran Subduction Zone Mw 8.1–8.3 Earthquakes" Geosciences 10, no. 11: 452. https://0-doi-org.brum.beds.ac.uk/10.3390/geosciences10110452
Note that from the first issue of 2016, this journal uses article numbers instead of page numbers. See further details here.