Detrital Zircon Provenance and Lithofacies Associations of Montmorillonitic Sands in the Maastrichtian Ripley Formation: Implications for Mississippi Embayment Paleodrainage Patterns and Paleogeography

 , and
, and
Abstract
:1. Introduction
2. Background and Geologic Setting
2.1. Mississippi Embayment Sedimentation
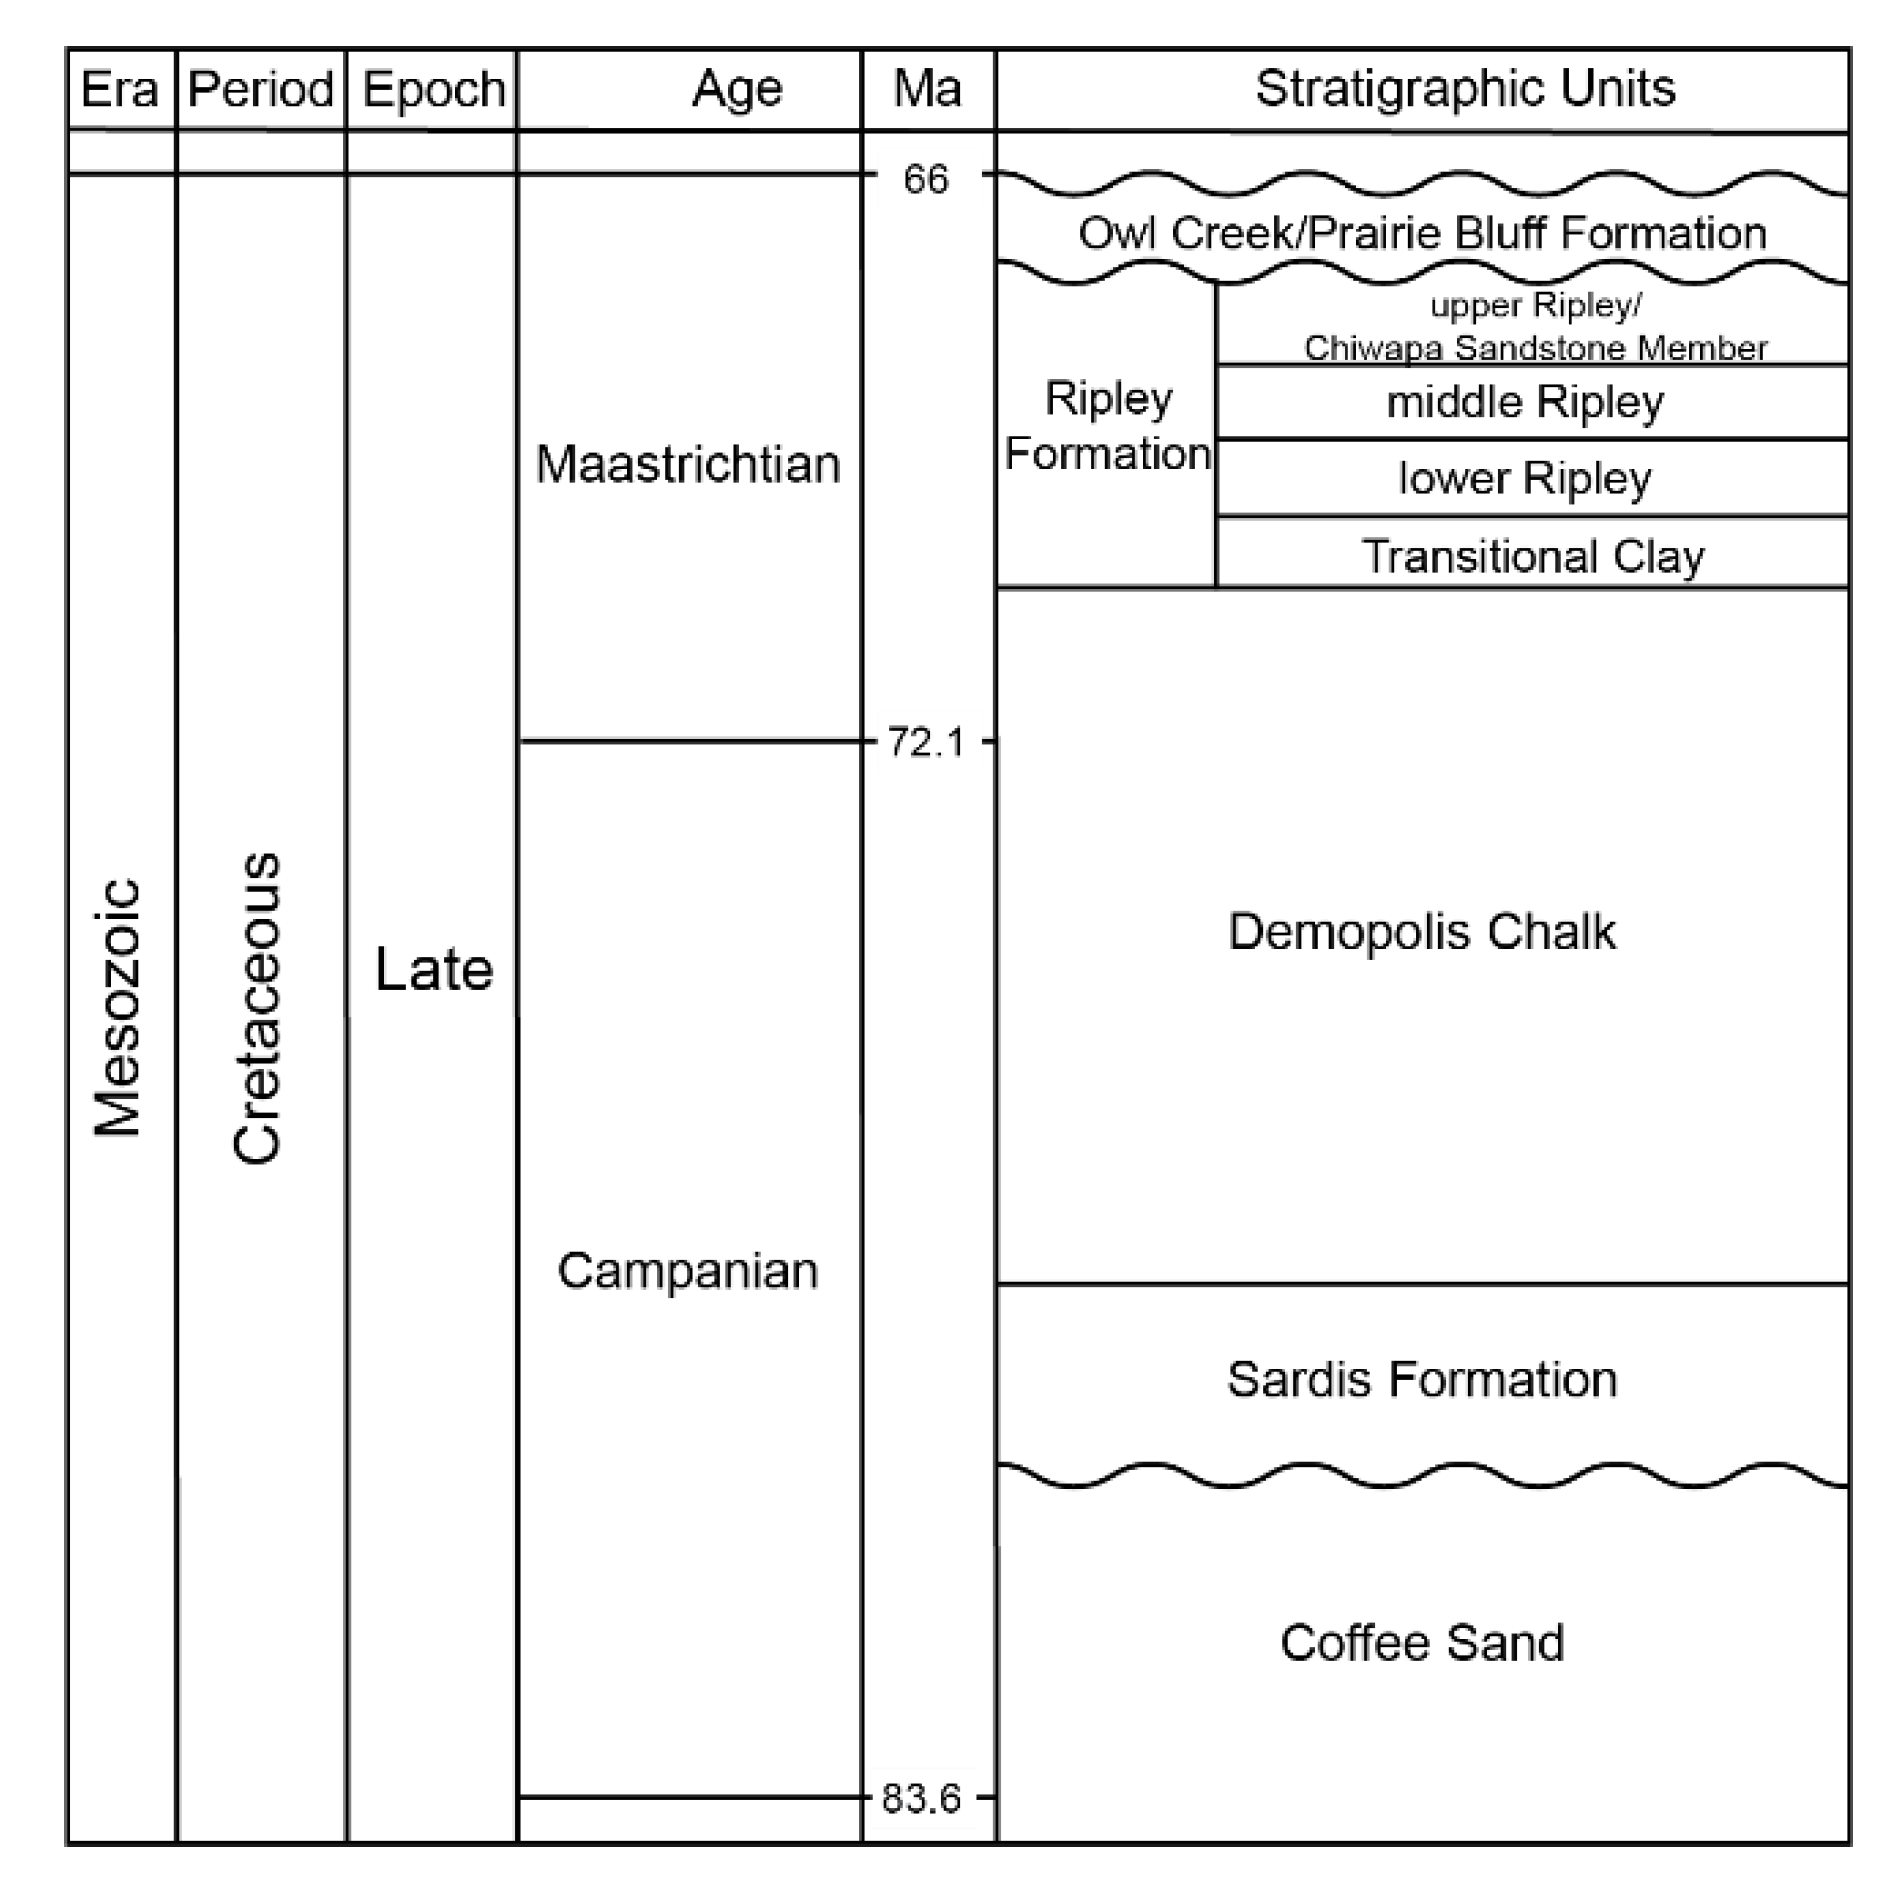
2.2. Ripley Formation Stratigraphy
3. Methods
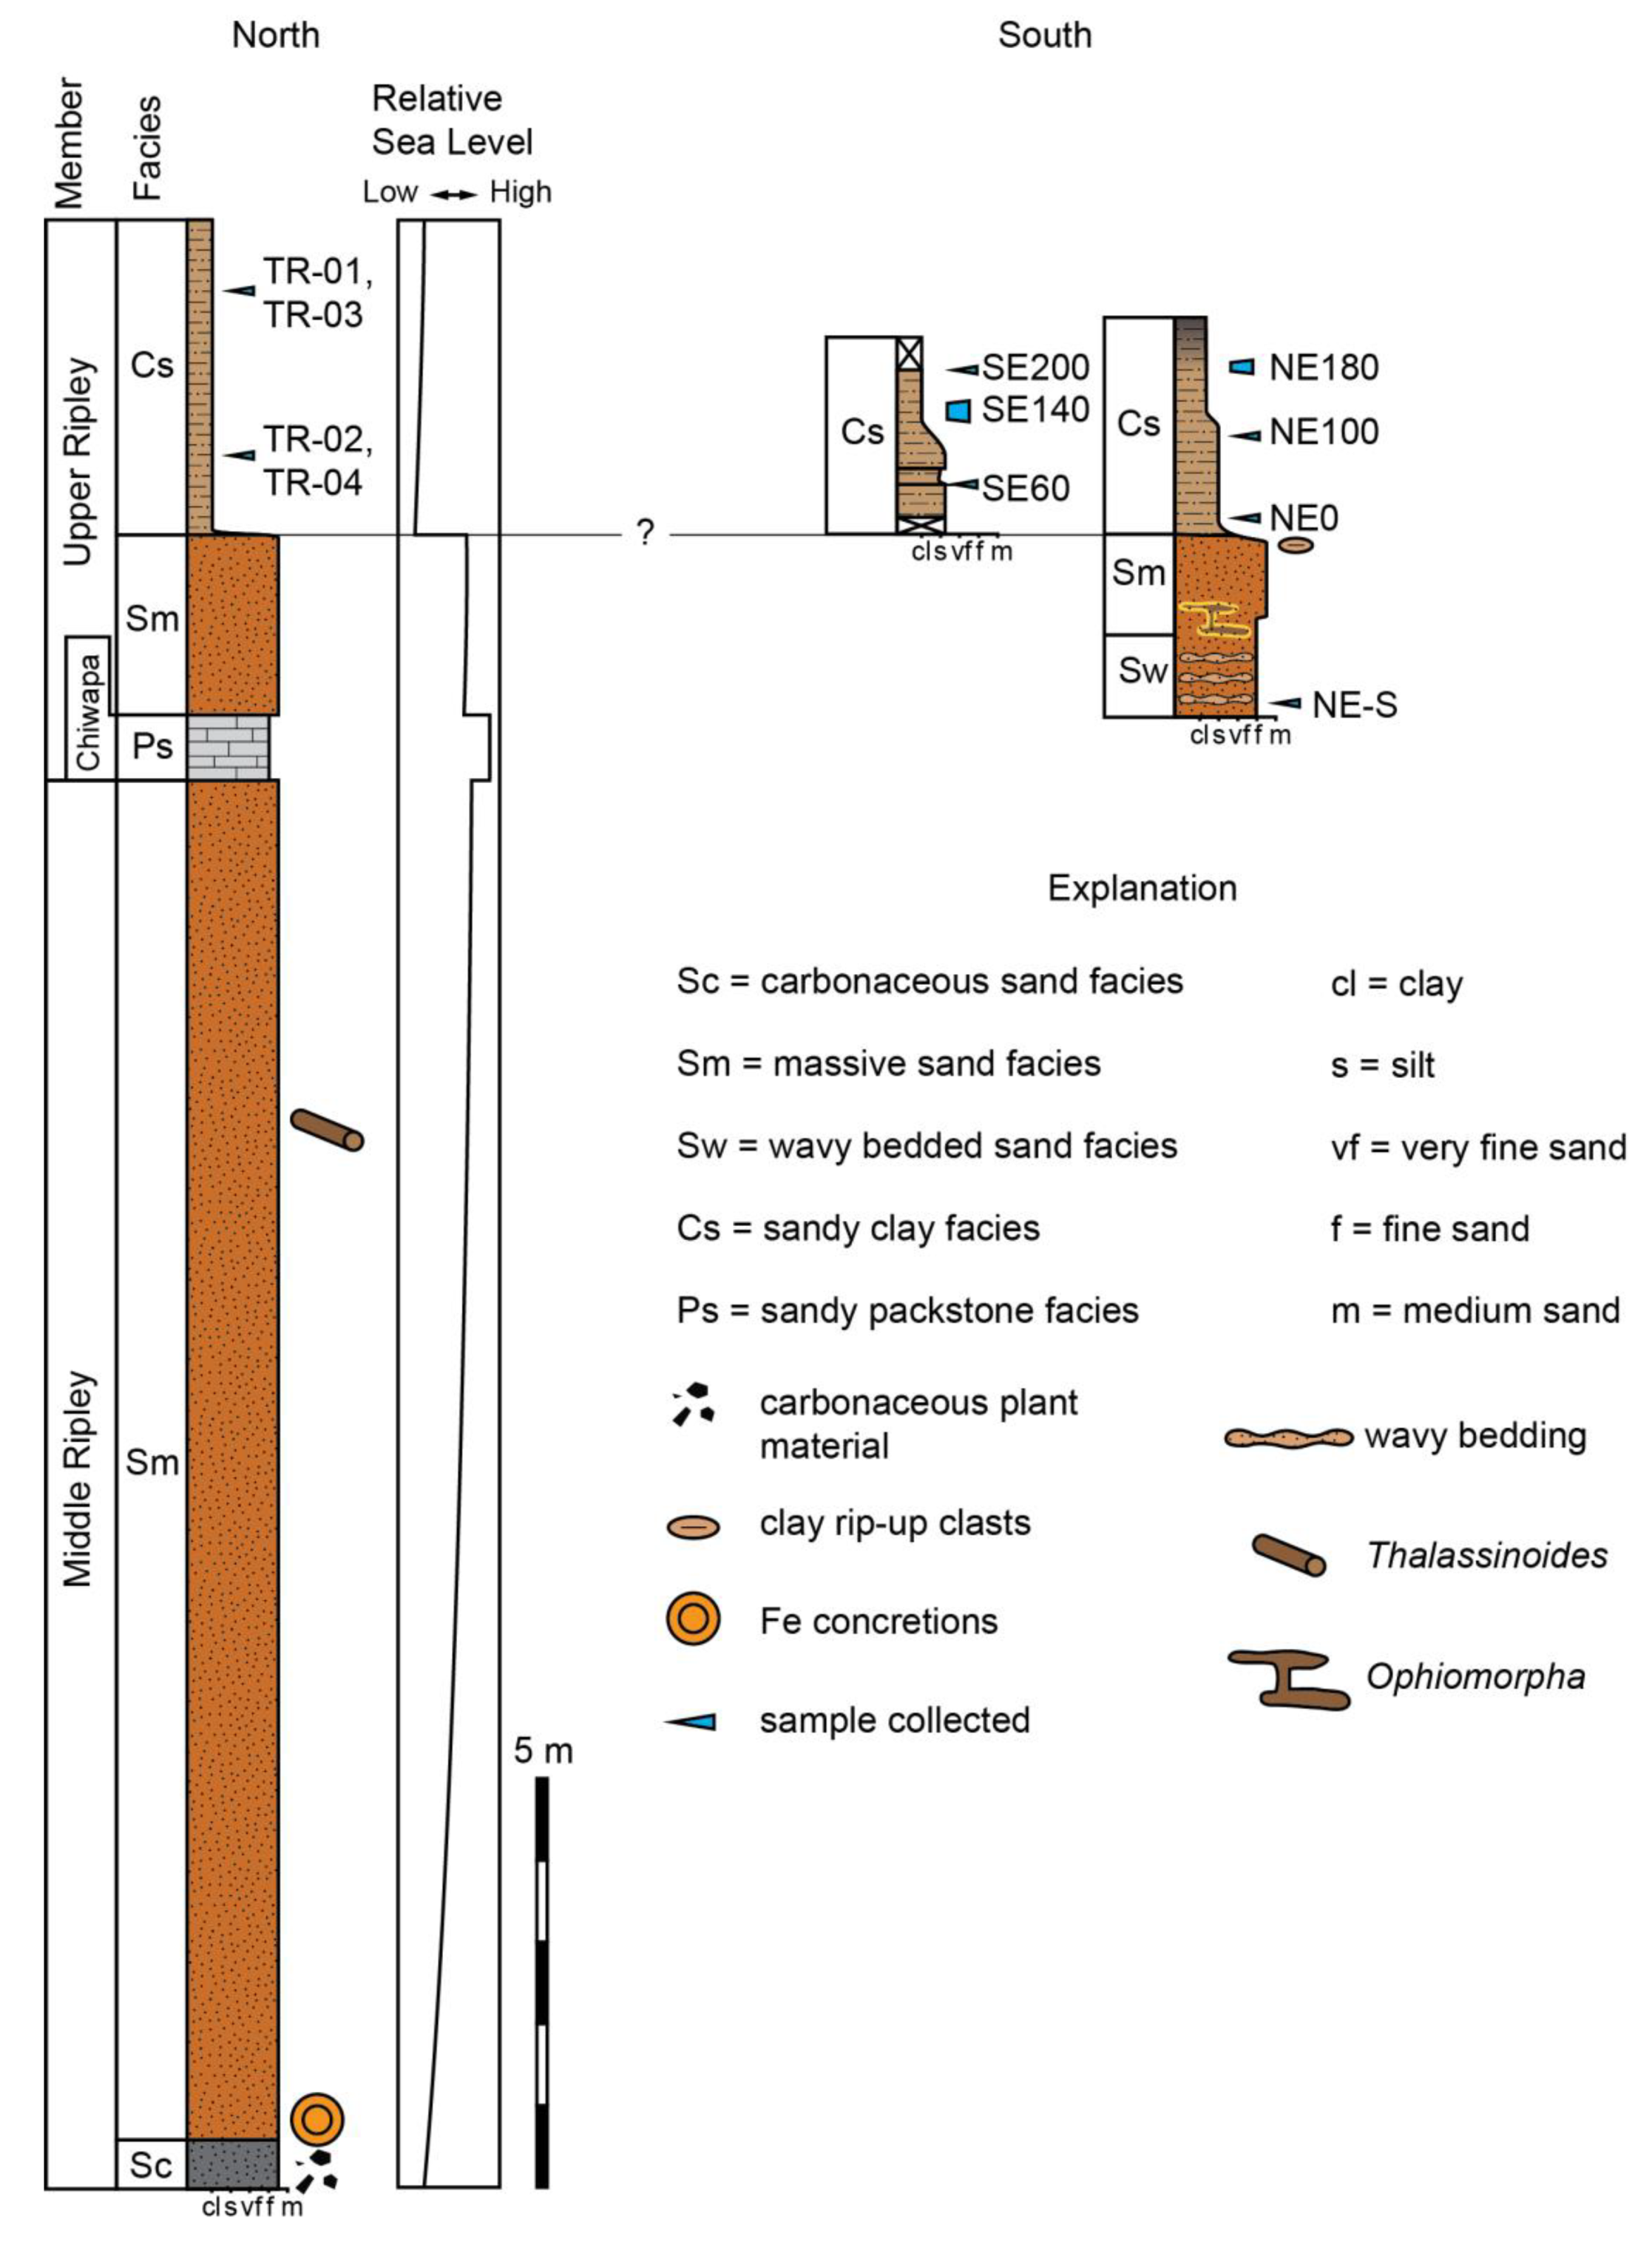
3.1. Sample Collection and Preparation
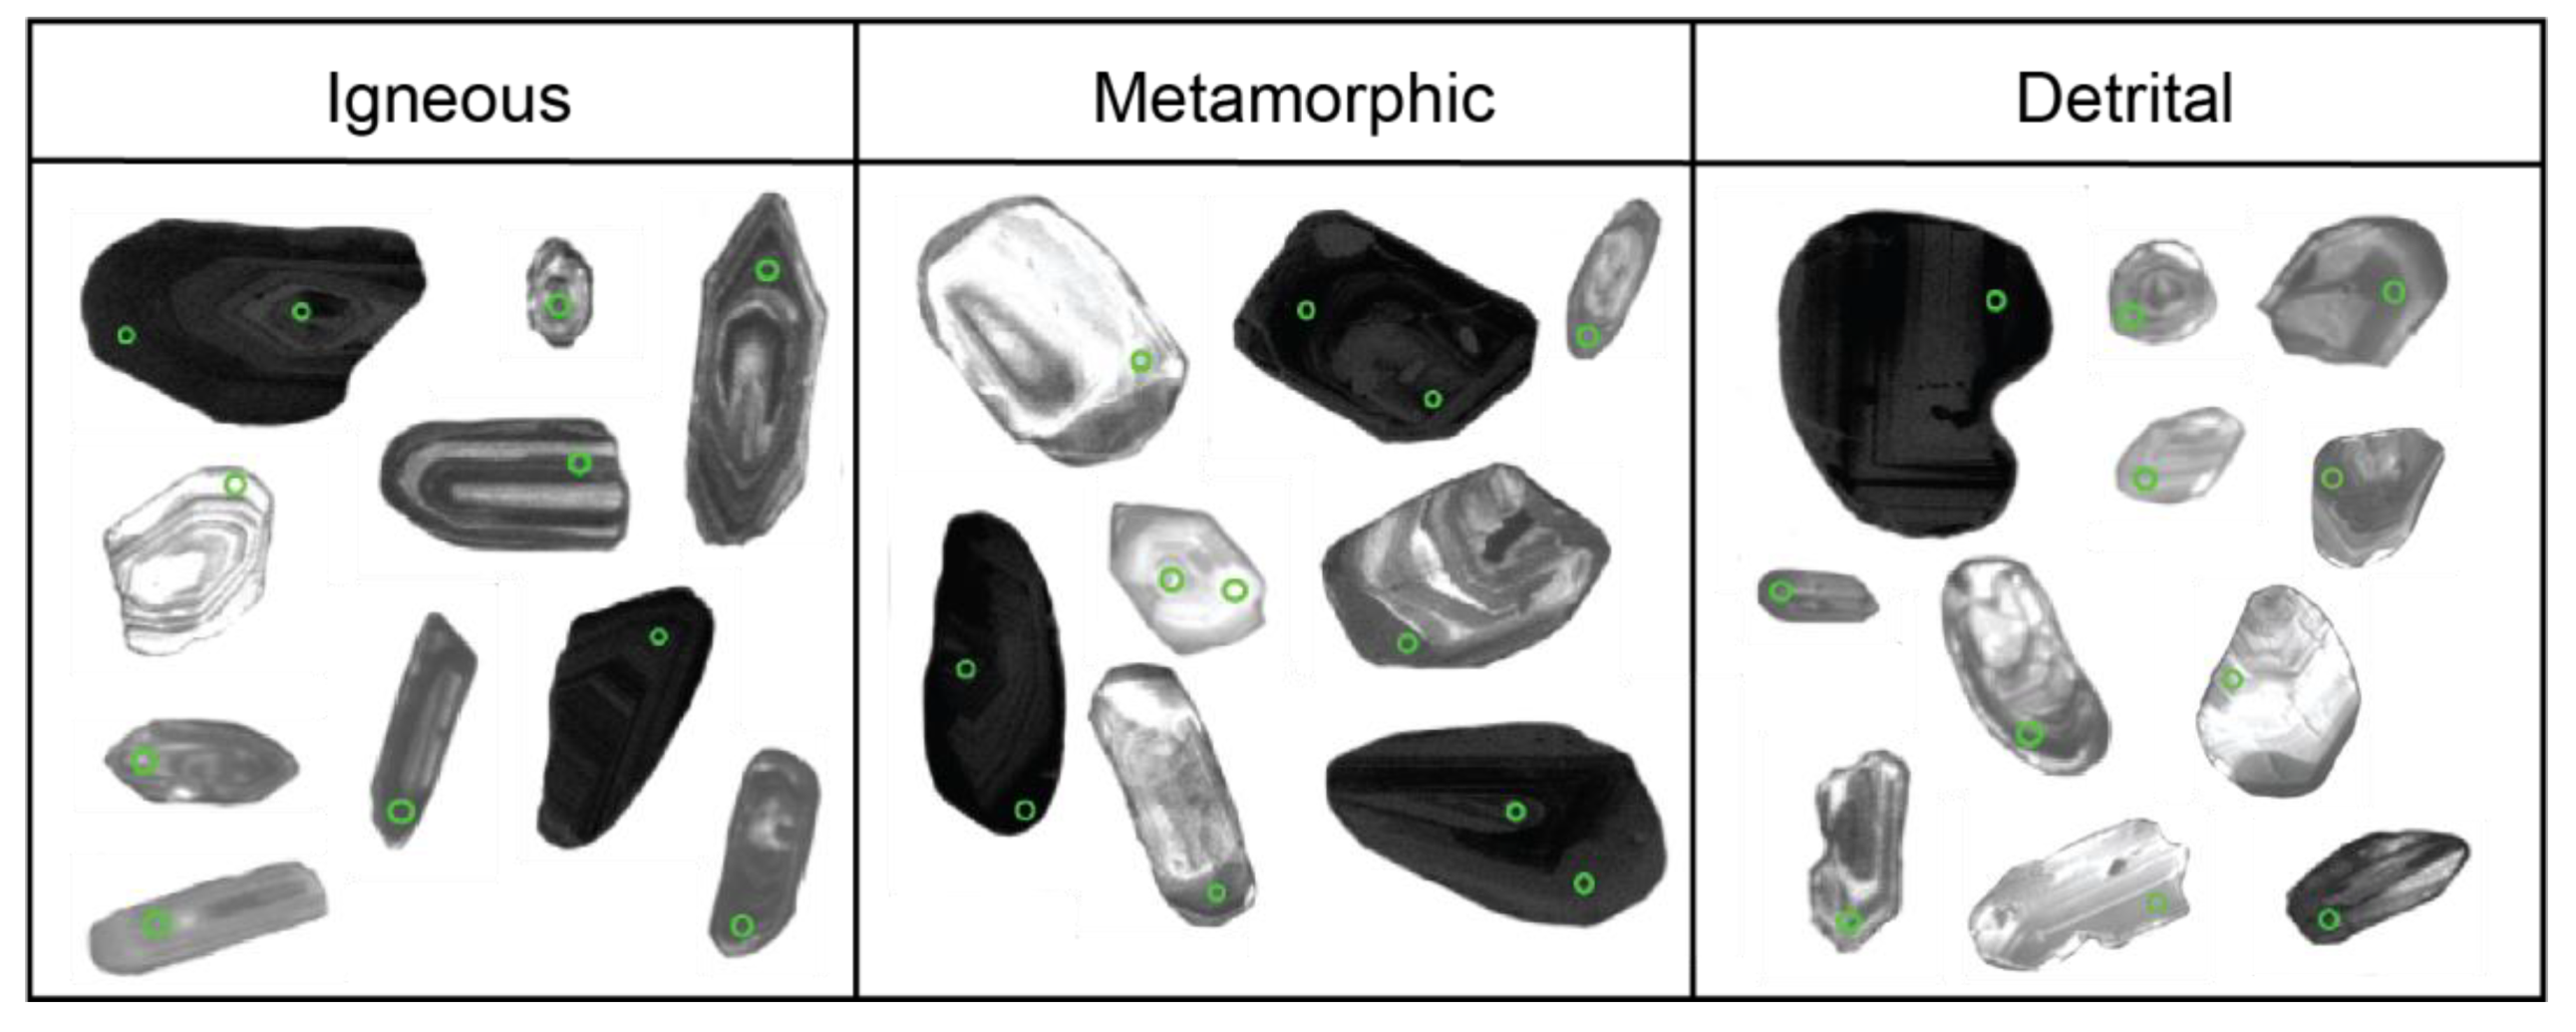
3.2. Scanning Electron Microscope Imaging
3.3. Uranium–Lead (U–Pb) Zircon Isotopic Analysis
3.4. Statistical Analysis
3.5. X-ray Diffraction (XRD) Analysis
4. Results
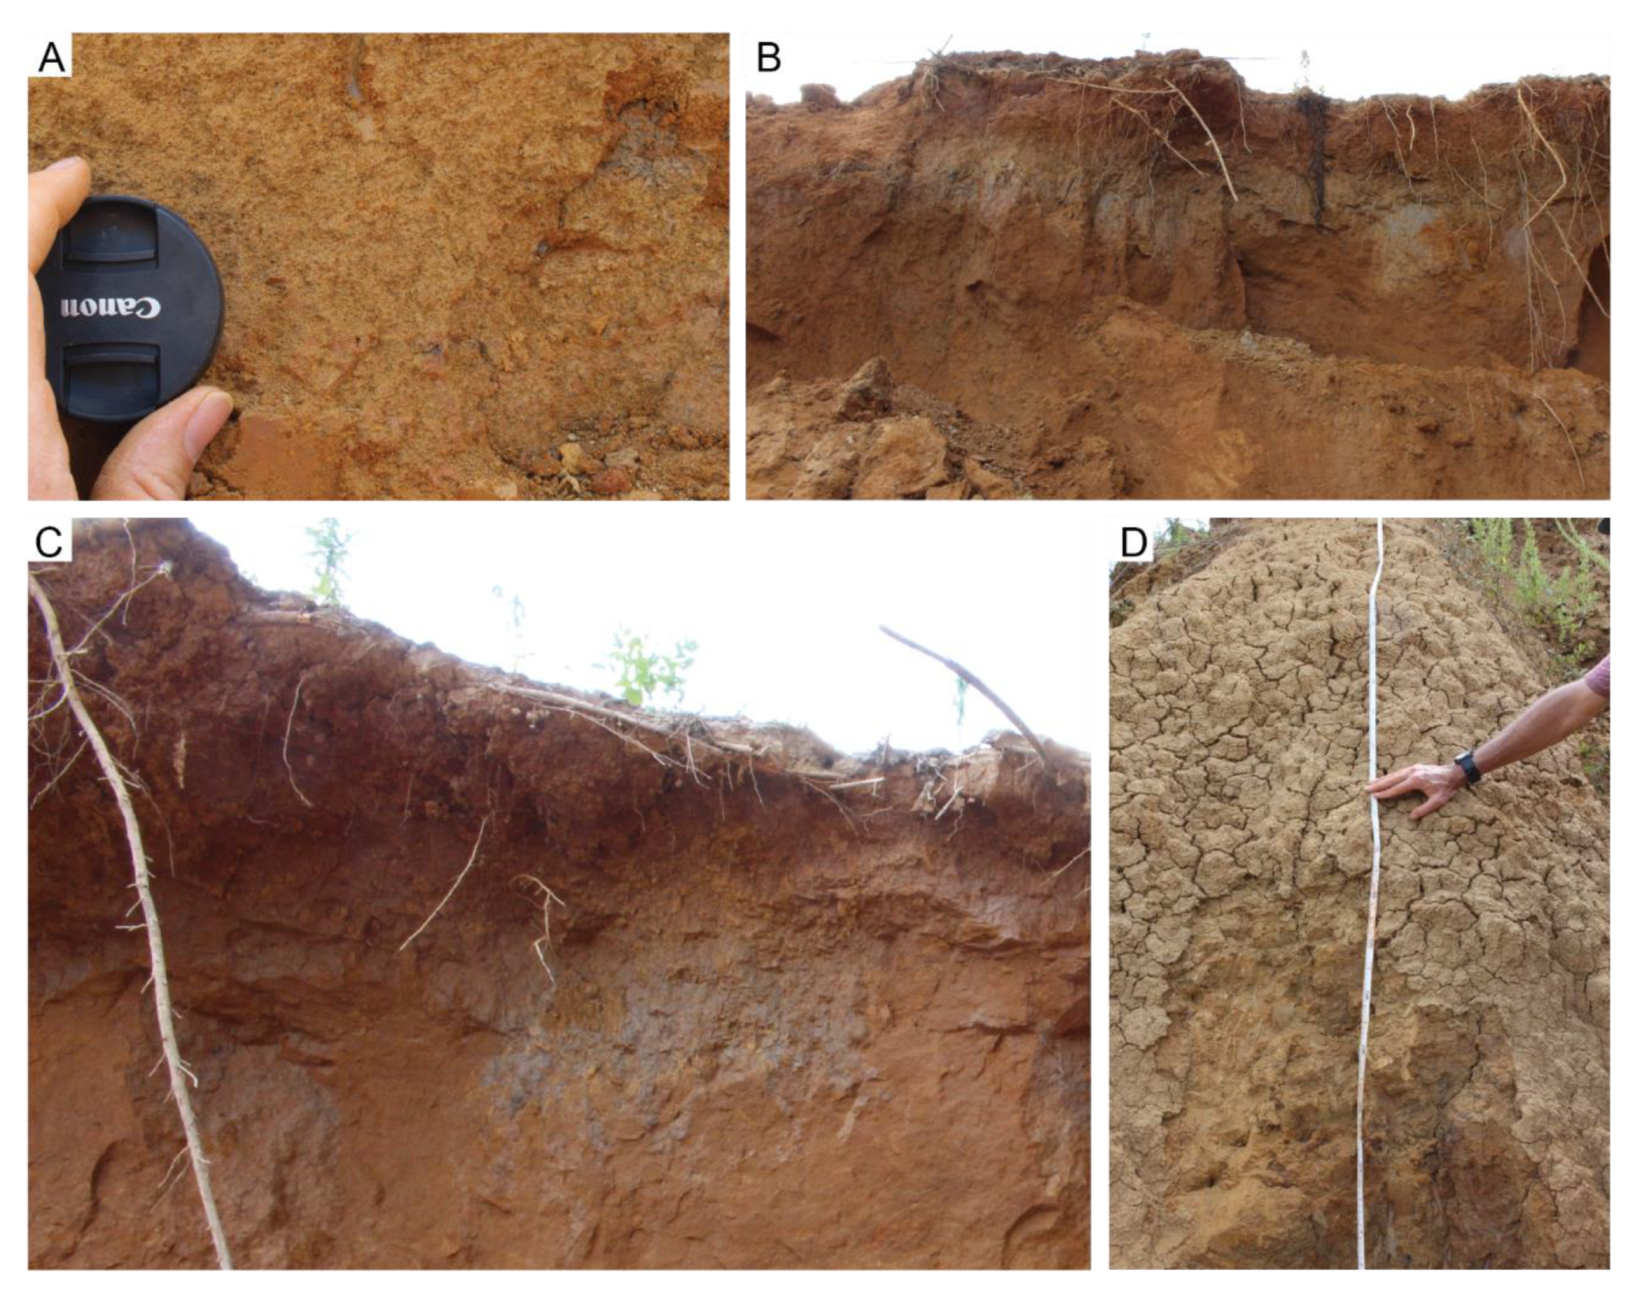
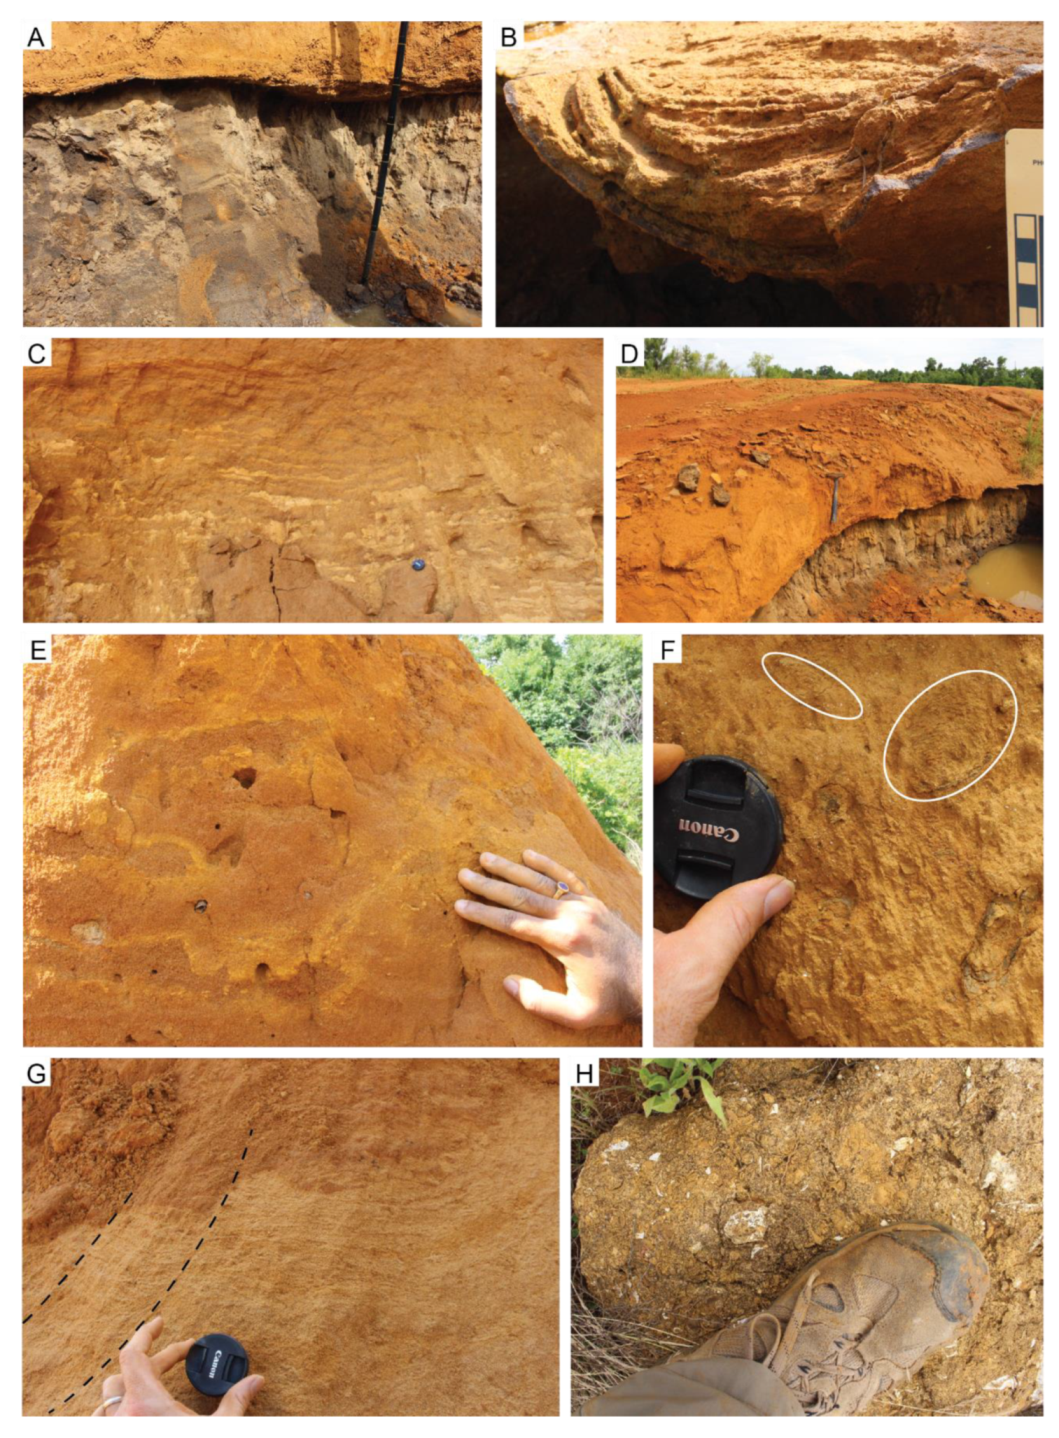
4.1. Lithofacies
4.1.1. Sandy Clay Lithofacies
4.1.2. Carbonaceous Sand Lithofacies
4.1.3. Wavy-Bedded Sand Lithofacies
4.1.4. Massive Sand Lithofacies
4.1.5. Ripple-Laminated Sand Lithofacies
4.1.6. Sandy Packstone Lithofacies
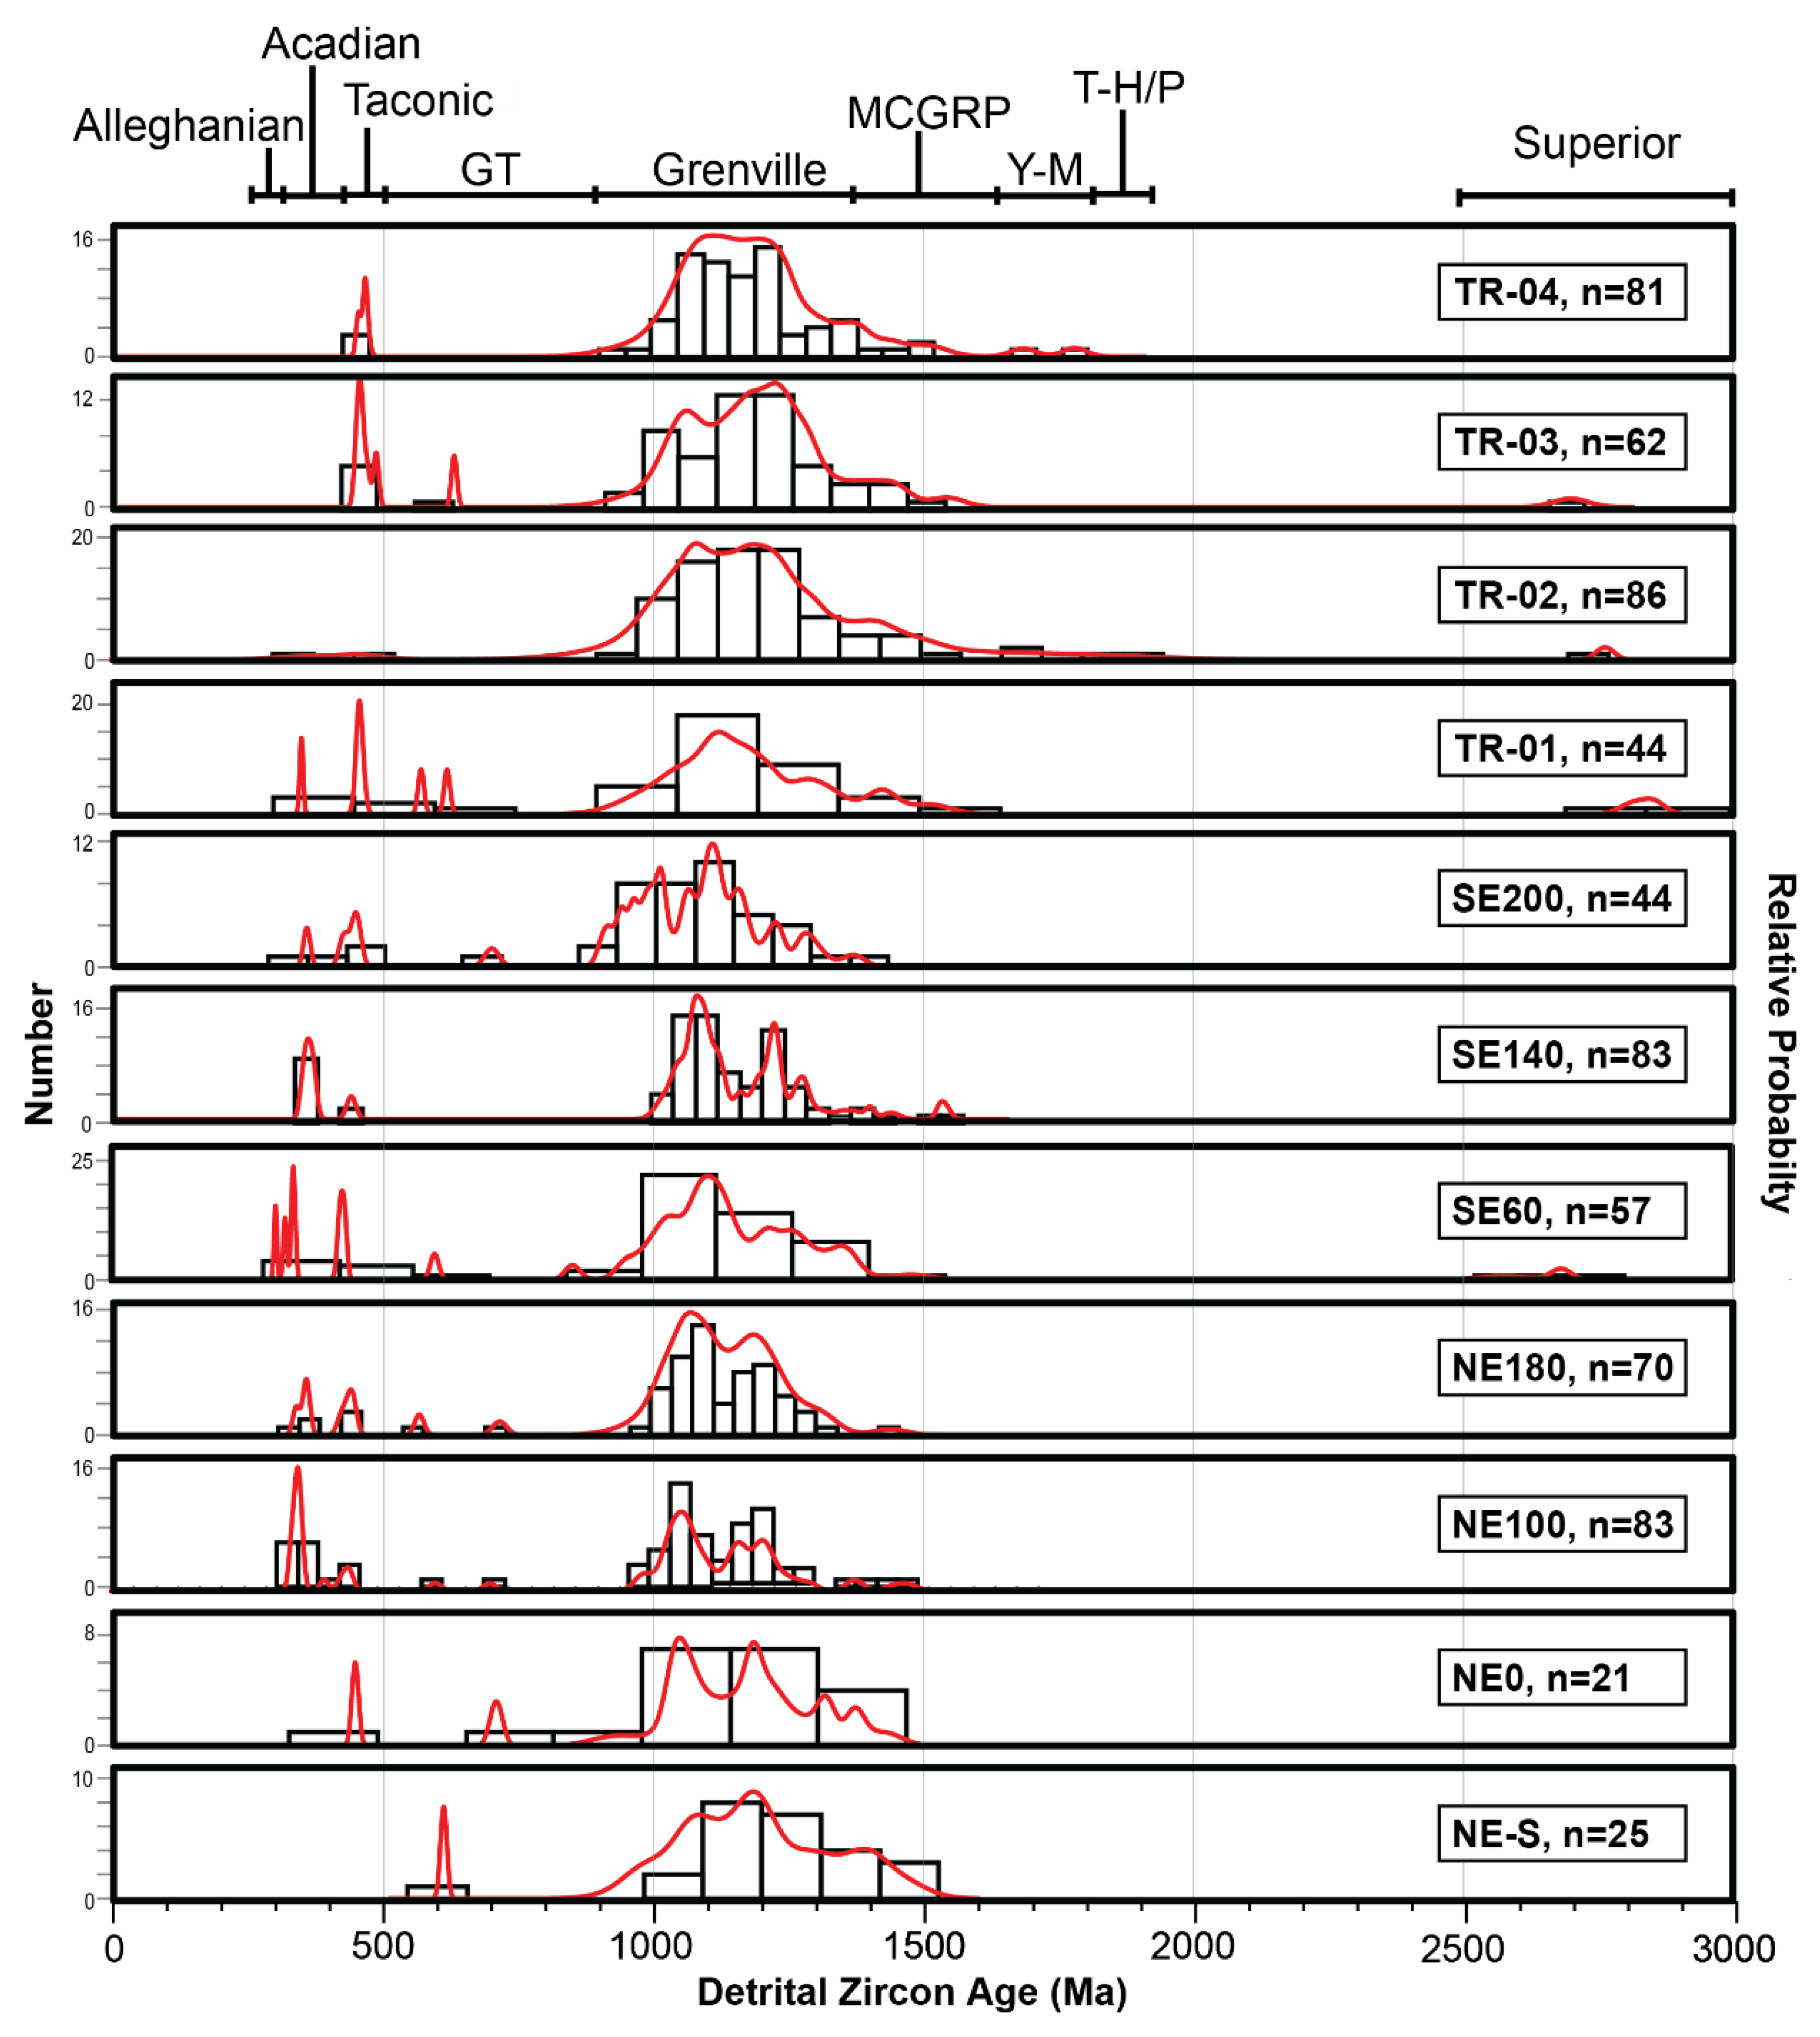
4.2. Zircon Geochronology
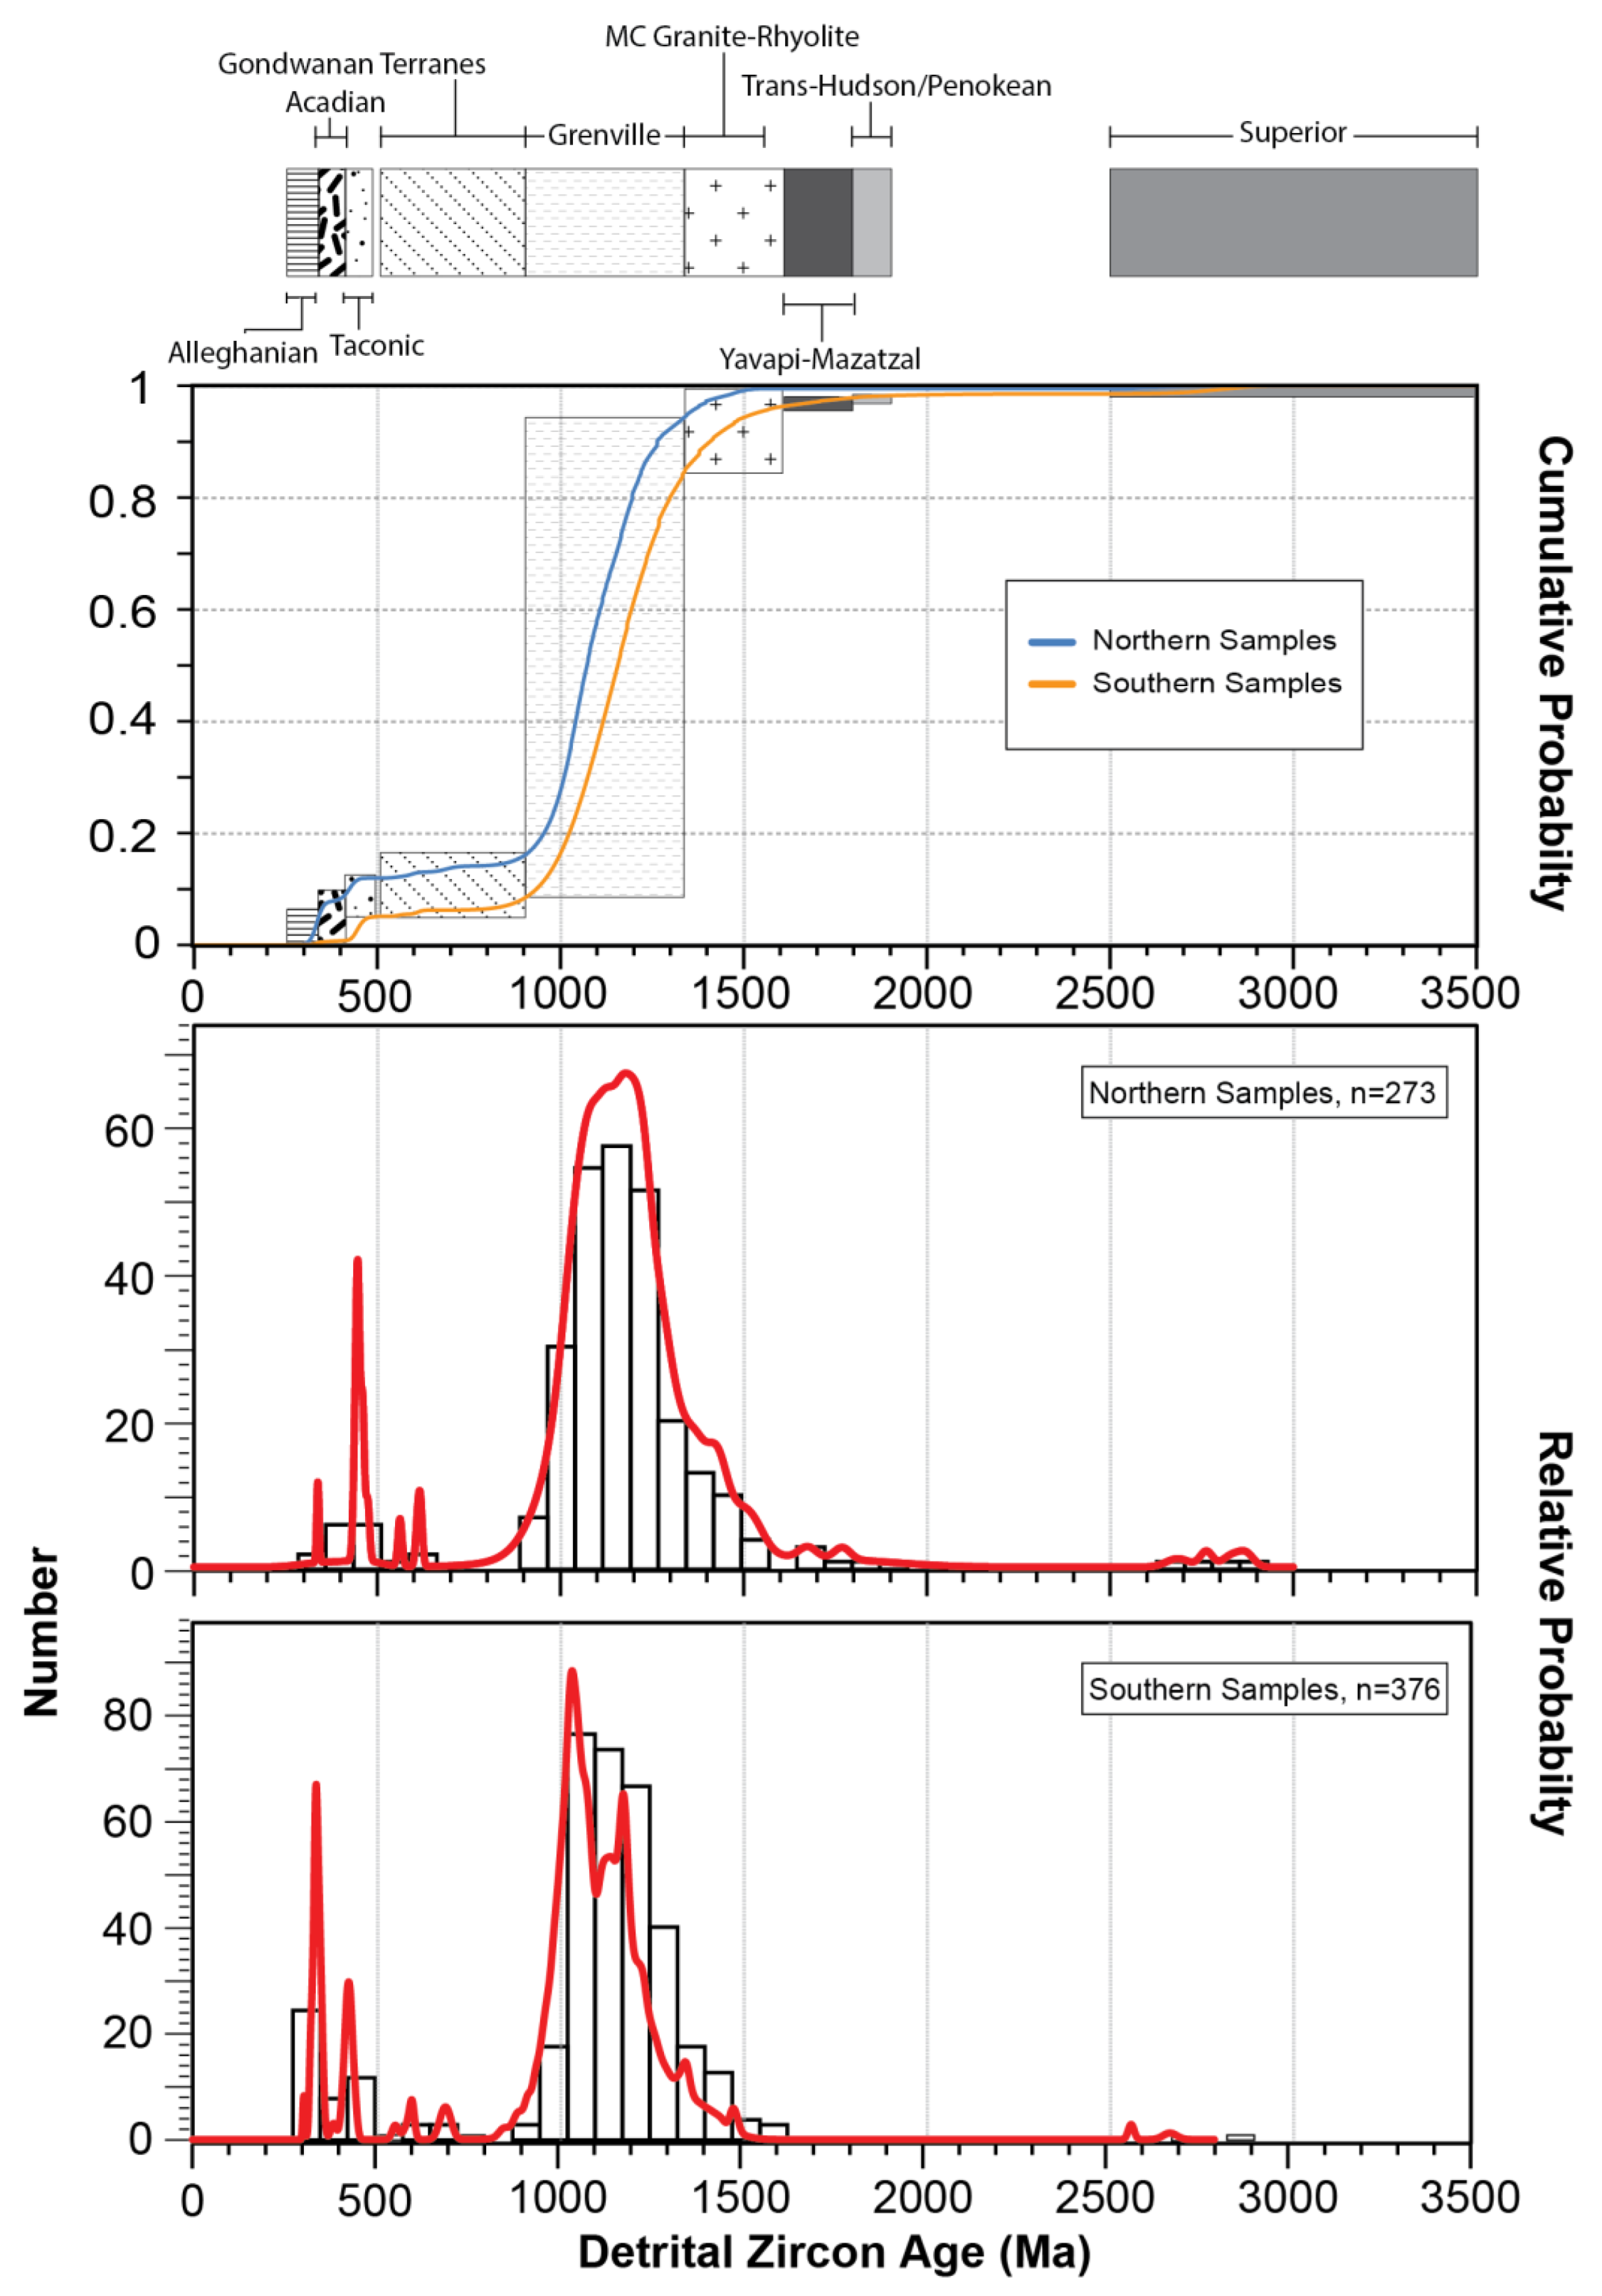
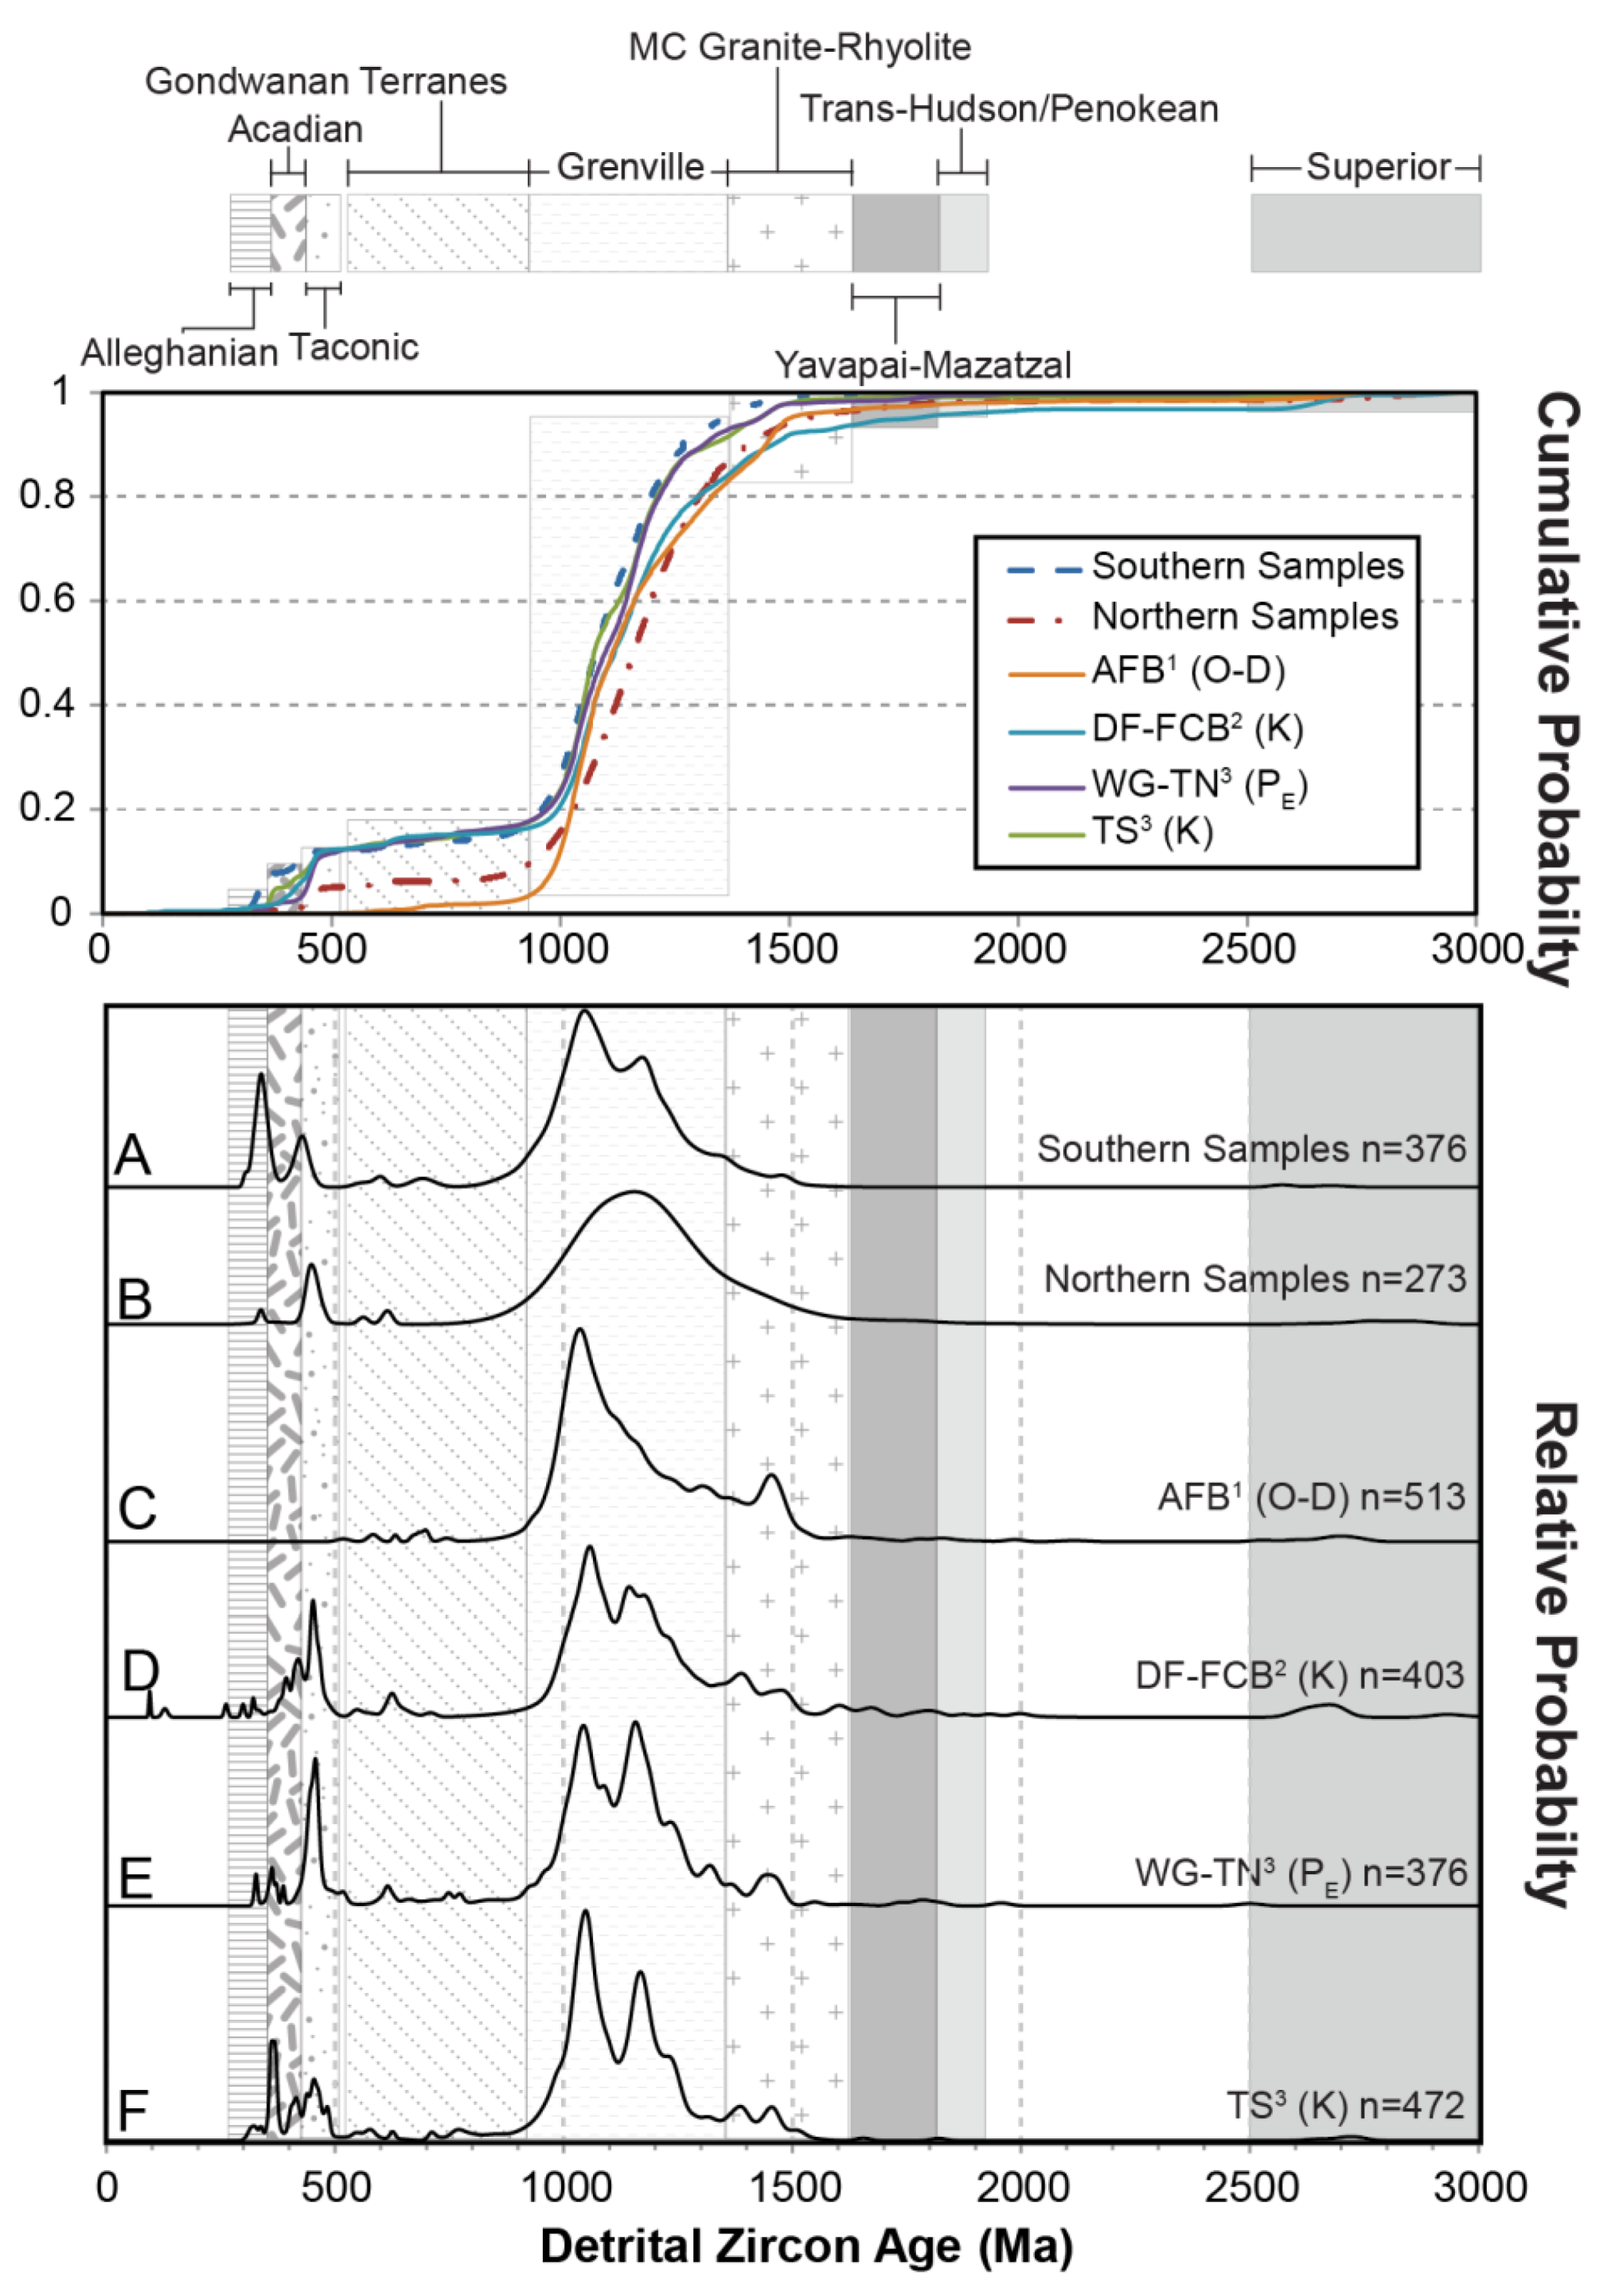
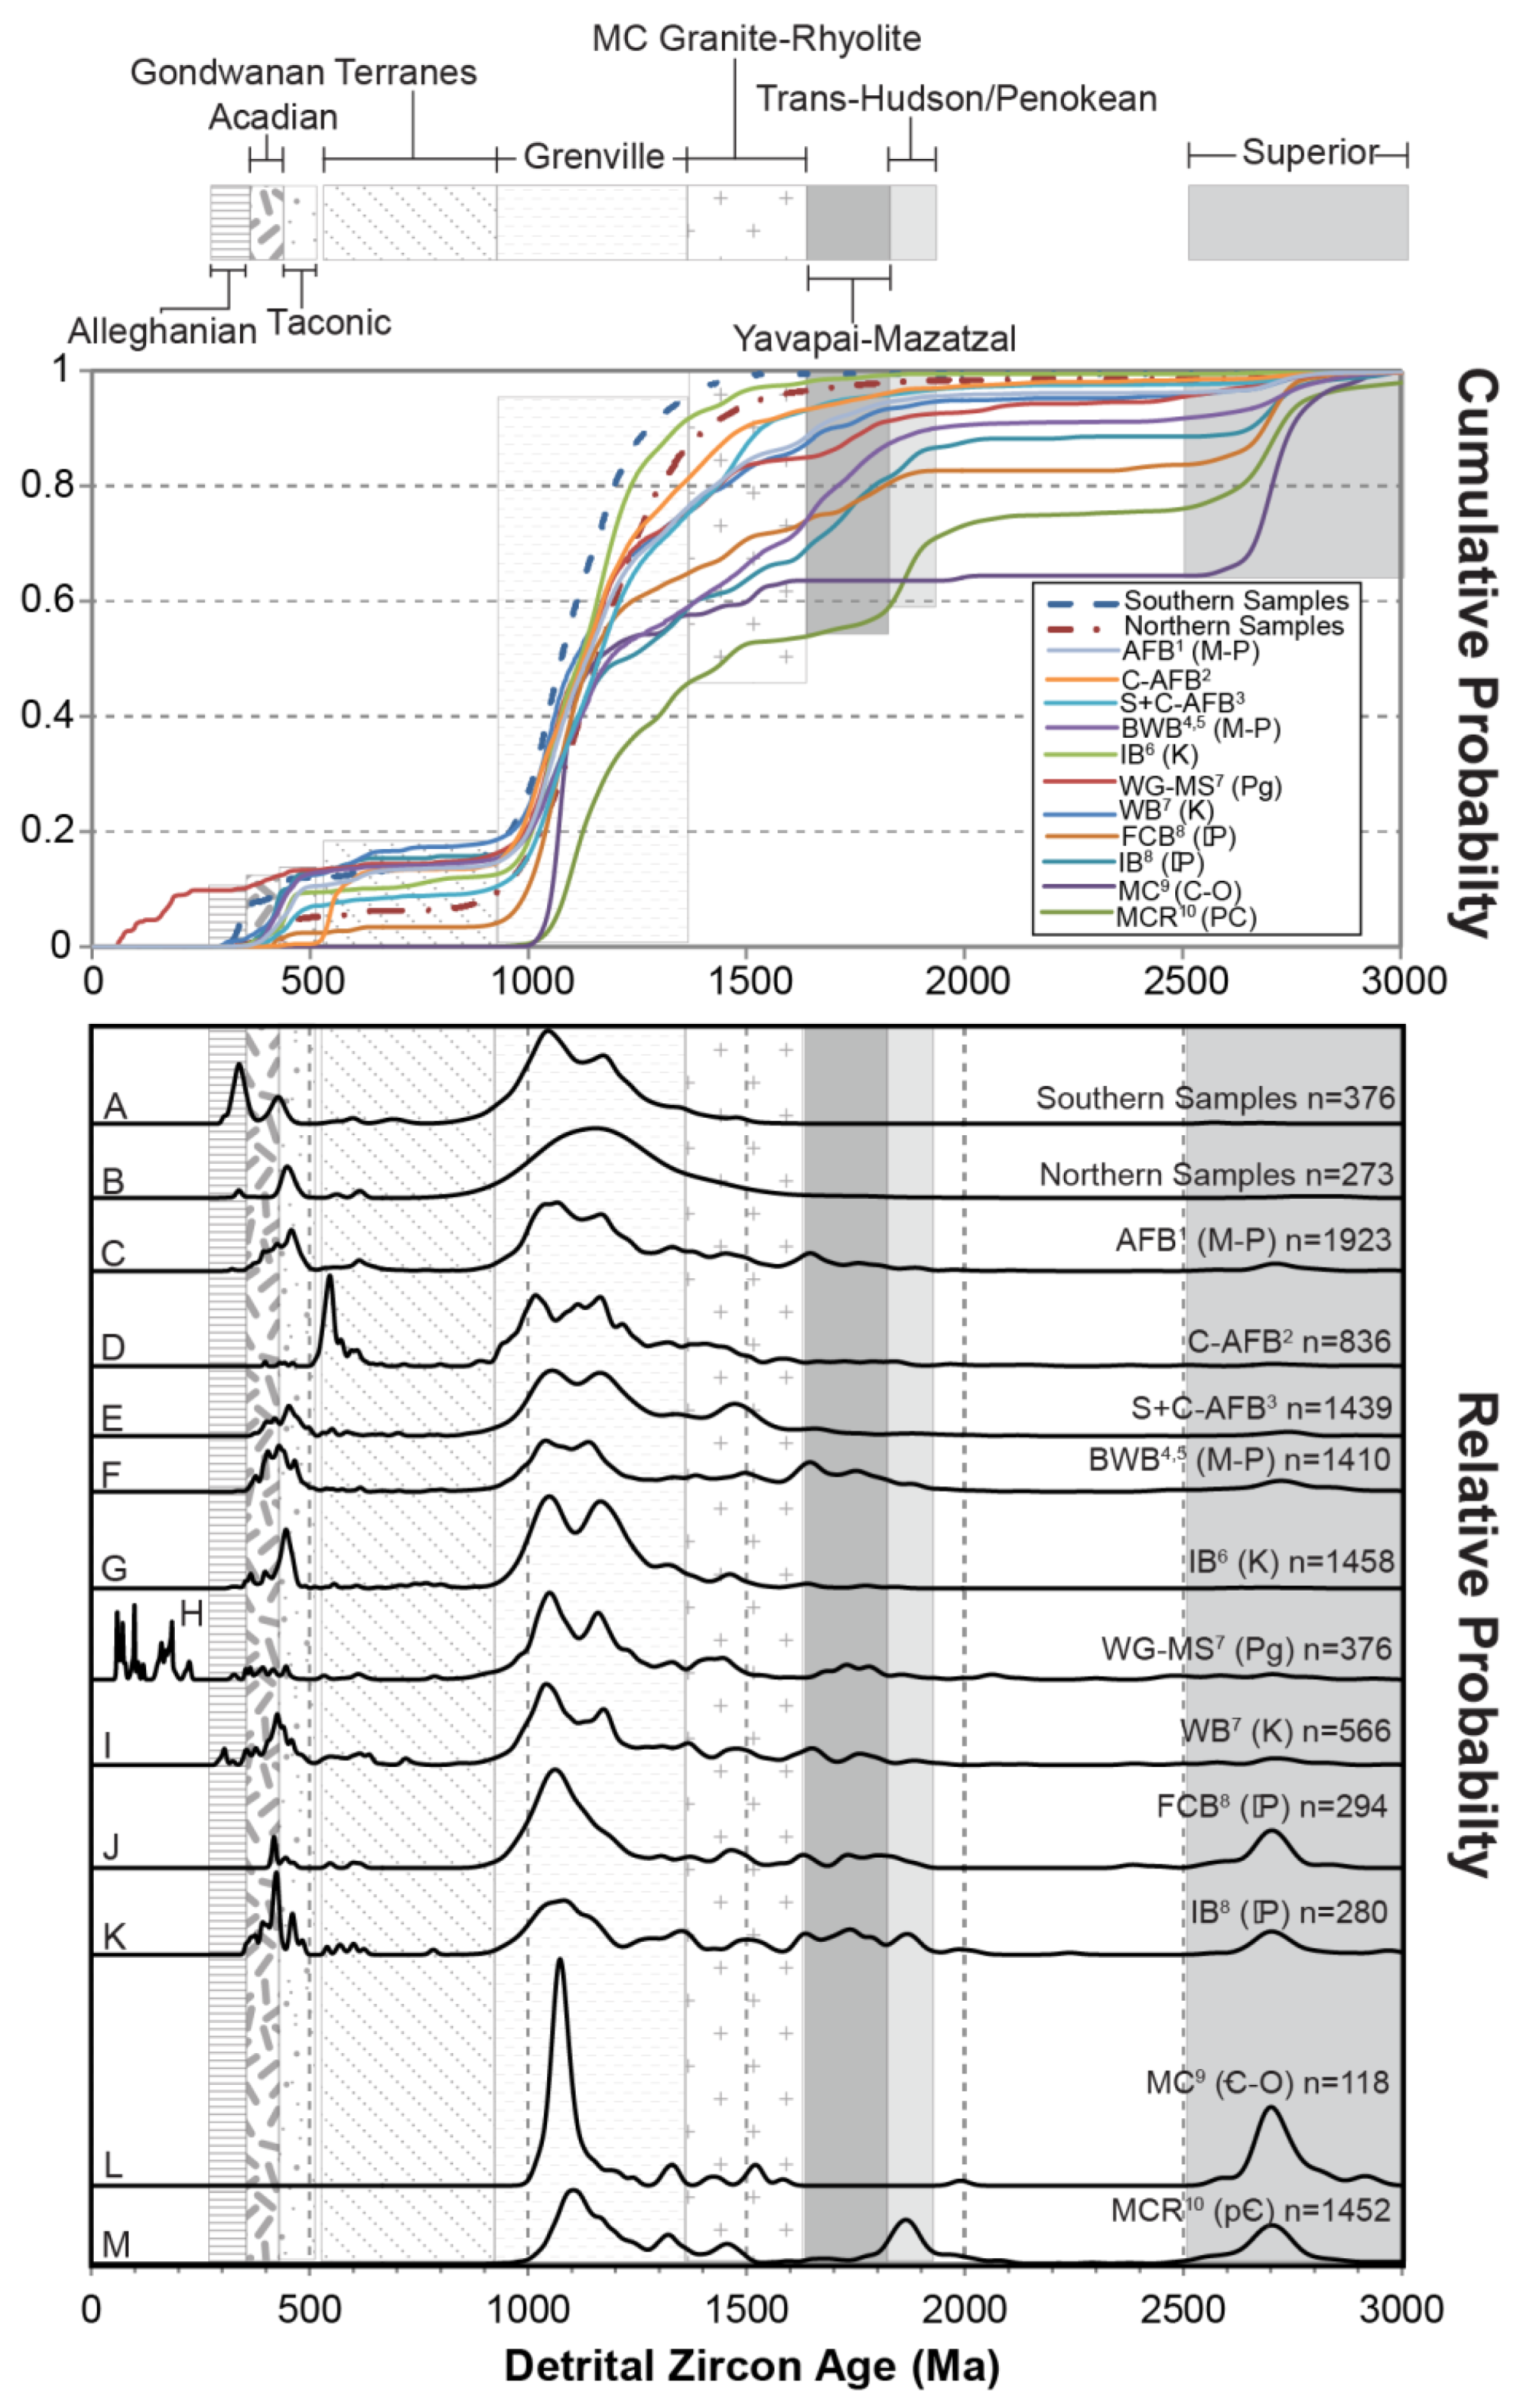
4.2.1. U–Pb Geochronology of Southern Samples
4.2.2. U–Pb Geochronology of Northern Samples
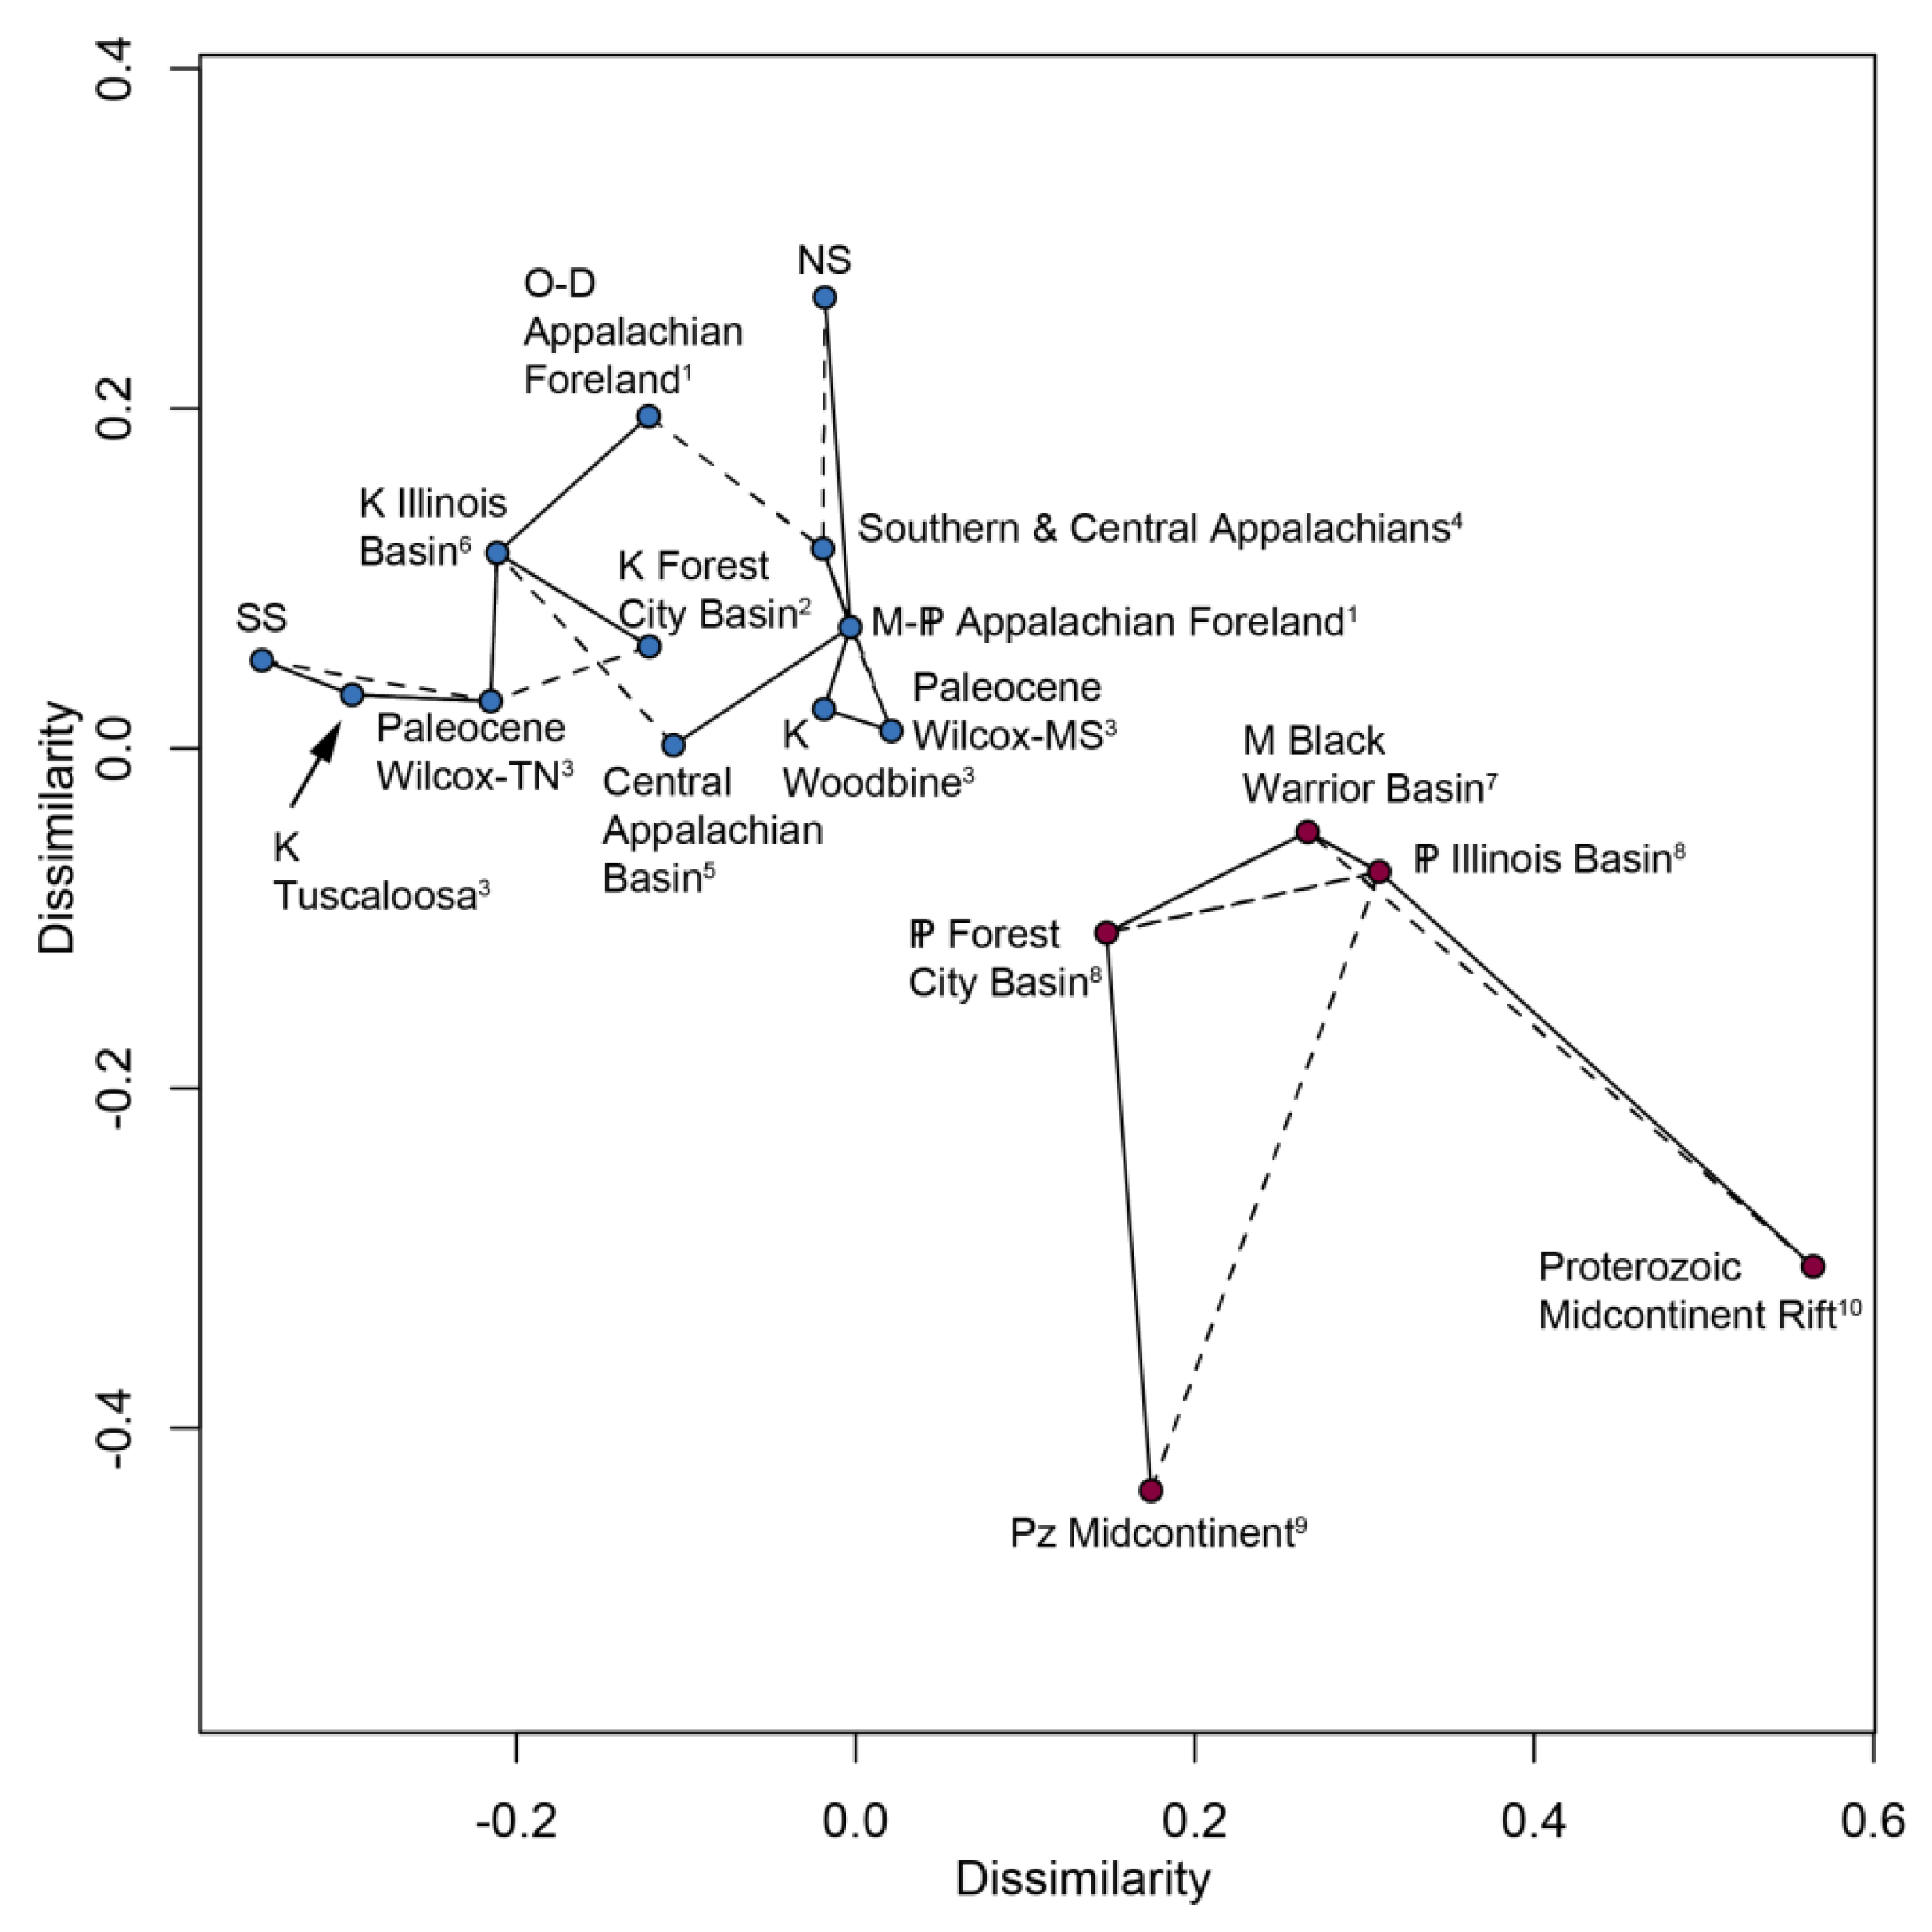
4.3. Statistical Results
4.4. XRD Results
5. Discussion
5.1. Lithofacies Interpretations
5.1.1. Sandy Clay Lithofacies
5.1.2. Carbonaceous Sand Lithofacies
5.1.3. Wavy-Bedded Sand Lithofacies
5.1.4. Massive Sand Lithofacies
5.1.5. Ripple-Laminated Sand Lithofacies
5.1.6. Sandy Packstone Lithofacies
5.2. Detrital Zircon Age Distributions and Provenance
6. Conclusions
Supplementary Materials
Author Contributions
Funding
Acknowledgments
Conflicts of Interest
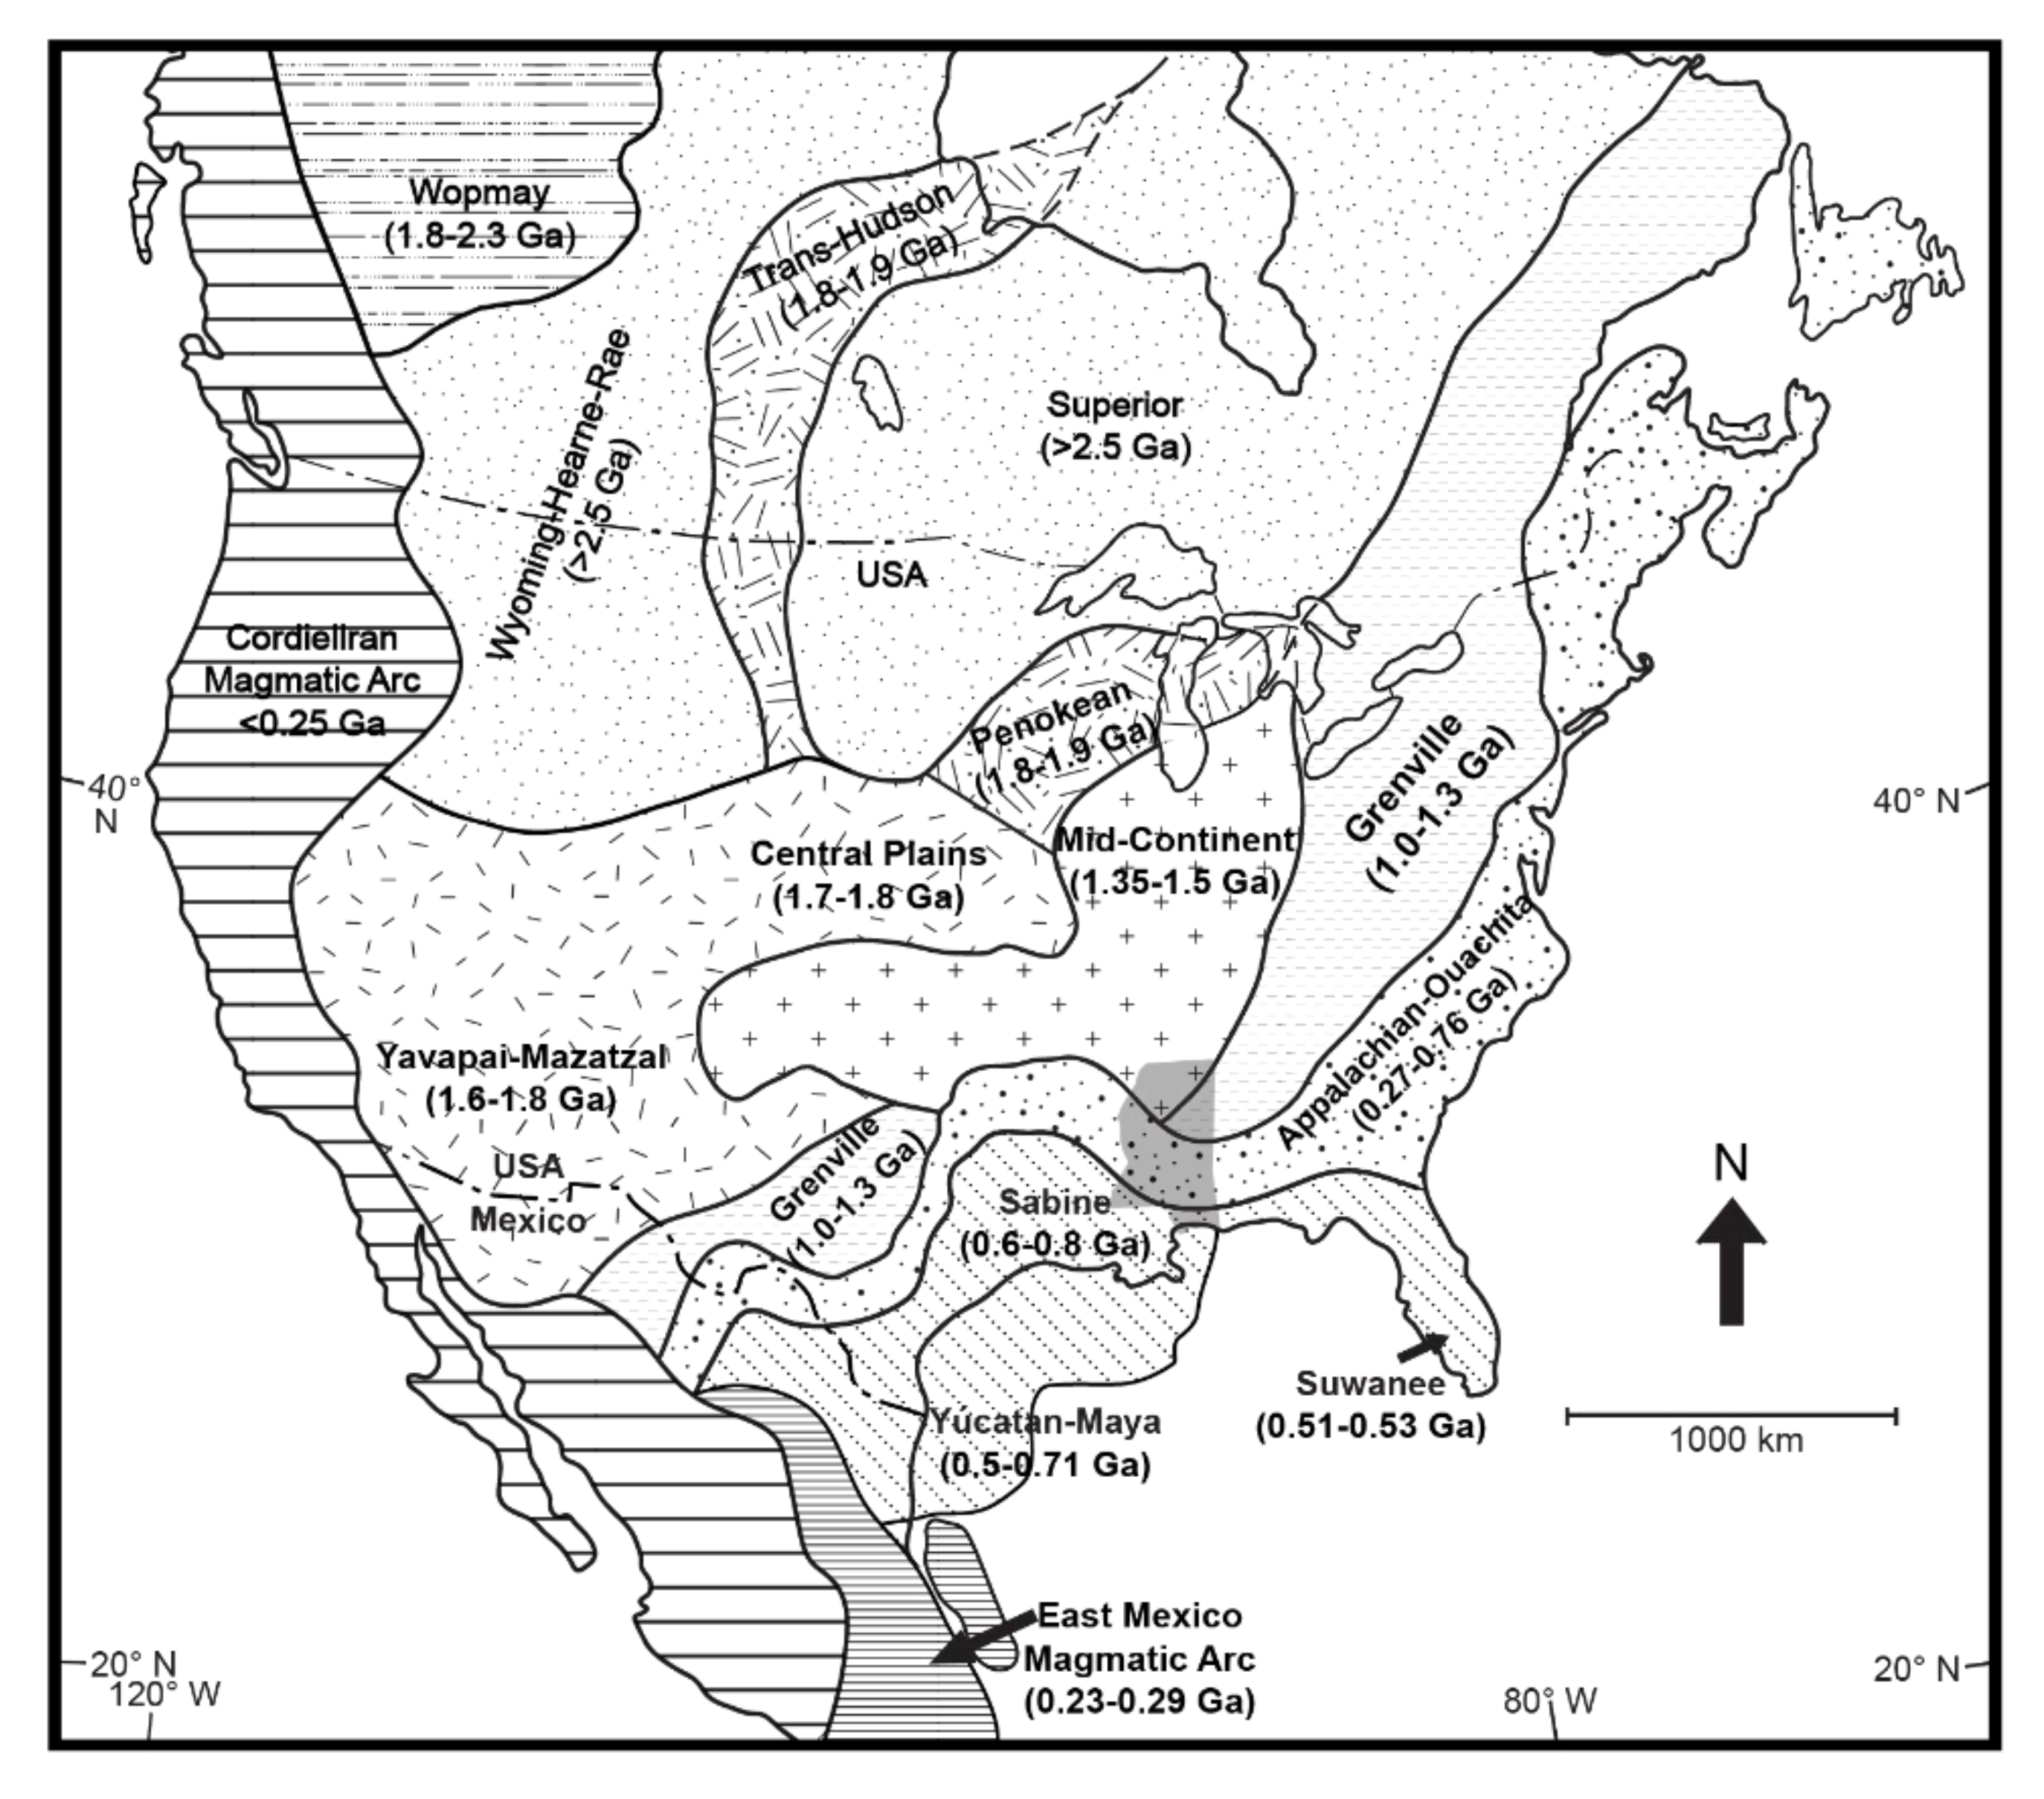
Appendix A. North American Provenance Terranes
Appendix A.1. Superior (> 2500 Ma)
Appendix A.2. Trans-Hudson/Penokean (~1900–1800 Ma)
Appendix A.3. Yavapai–Mazatzal (~1800–1600 Ma)
Appendix A.4. Mid-Continent Granite–Rhyolite (~1500–1350 Ma)
Appendix A.5. Grenville (~1200–980 Ma)
Appendix A.6. Gondwanan Terranes (~900–540 Ma)
Appendix A.7. Taconic (~490–440 Ma)
Appendix A.8. Acadian (~420–350 Ma)
Appendix A.9. Alleghenian (~330–265 Ma)
References
- Blum, M.; Pecha, M. Mid-cretaceous to paleocene North American drainage reorganization from detrital zircons. Geology 2014, 42, 607–610. [Google Scholar] [CrossRef] [Green Version]
- Blum, M.D.; Milliken, K.T.; Pecha, M.A.; Snedden, J.W.; Frederick, B.C.; Galloway, W.E. Detrital-zircon records of Cenomanian, Paleocene, and Oligocene Gulf of Mexico drainage integration and sediment routing: Implications for scales of basin-floor fans. Geosphere 2017, 13, 2169–2205. [Google Scholar] [CrossRef] [Green Version]
- Potter-McIntyre, S.L.; Breeden, J.R.; Malone, D.H. A Maastrichtian birth of the Ancestral Mississippi River system: Evidence from the U-Pb detrital zircon geochronology of the McNairy Sandstone, Illinois, USA. Cretac. Res. 2018, 91, 71–79. [Google Scholar] [CrossRef]
- Cushing, E.M.; Boswell, E.H.; Hosman, R.L. General geology of the Mississippi embayment. U. S. Geol. Surv. Prof. Pap. 1964, 448-B, 448. [Google Scholar]
- Dockery, D.T.; Thompson, D.E. The Geology of Mississippi; University of Mississippi Press: Oxford, MS, USA, 2017. [Google Scholar]
- Swann, C.T.; Mississippi Mineral Resources Institute, University, MS, USA. Personal communication, 2017.
- Reed, J.C.; Wheeler, J.O.; Tucholke, B.E. Decade of North American Geology Geologic Map of North America—Perspectives and Explanation; The Geological Society of America: Boulder, CO, USA, 2005; pp. 1–28. [Google Scholar]
- Ervin, C.P.; McGinnis, L.D. Reelfoot rift: Reactivated precursor to the Mississippi embayment. Bull. Geol. Soc. Am. 1975, 86, 1287–1295. [Google Scholar] [CrossRef]
- Cox, R.T. Evidence of late Cenozoic activity along the Bolivar-Mansfield tectonic zone, midcontinent, USA. Compass 1988, 65, 207–214. [Google Scholar]
- Csontos, R.; Van Arsdale, R.; Cox, R.; Waldron, B. Reelfoot rift and its impact on Quaternary deformation in the central Mississippi River valley. Geosphere 2008, 4, 145–158. [Google Scholar] [CrossRef] [Green Version]
- Cox, R.T.; Van Arsdale, R.B.; Harris, J.B.; Larsen, D. Neotectonics of the southeastern Reelfoot rift zone margin, central United States, and implications for regional strain accommodation. Geology 2001, 29, 419–422. [Google Scholar] [CrossRef]
- Chiu, S.C.C.; Chiu, J.M.; Johnston, A.C. Seismicity of the southeastern margin of Reelfoot rift, central United States. Seismol. Res. Lett. 1997, 68, 785–794. [Google Scholar] [CrossRef]
- Dart, R.L.; Swolfs, H.S. Contour mapping of relic structures in the Precambrian basement of the Reelfoot rift, North American midcontinent. Tectonics 1998, 17, 235–249. [Google Scholar] [CrossRef]
- Howe, J.R.; Thompson, T.L. Tectonics, sedimentation, and hydrocarbon potential of the Reelfoot Rift. Oil Gas J. 1984, 82, 179–190. [Google Scholar]
- Howe, J.R. Tectonics, Sedimentation, and Hydrocarbon Potential of the Reelfoot Aulacogen. Master’s Thesis, University of Oklahoma, Norman, OK, USA, 1985. [Google Scholar]
- Cox, R.T.; Van Arsdale, R.B. The Mississippi Embayment, North America: a first order continental structure generated by the Cretaceous superplume mantle event. J. Geodyn. 2002, 34, 163–176. [Google Scholar] [CrossRef]
- Finzel, E.S. Detrital zircons from Cretaceous midcontinent strata reveal an Appalachian Mountains-Cordilleran foreland basin connection. Lithosphere 2014, 6, 378–382. [Google Scholar] [CrossRef]
- Cox, R.T.; Van Arsdale, R.B. Hotspot origin of the Mississippi embayment and its possible impact on contemporary seismicity. Eng. Geol. 1997, 46, 201–216. [Google Scholar] [CrossRef]
- Malone, D.H.; Craddock, J.P.; Howell, B.A. Detrital zircon U/Pb provenance of the Lower Cretaceous Cloverly Formation, Big Horn and Powder River Basins, Wyoming. Geol. Soc. Am. Abstr. Programs 2013, 45, 584. [Google Scholar]
- Sloss, L.L. Forty years of sequence stratigraphy. Spec. Pap. Geol. Soc. Am. 1988, 253, 51–55. [Google Scholar] [CrossRef]
- Priddy, R.R. Pontotoc County Mineral Resources. Mississippi State Geol. Surv. Bull. 1943, 54, 139. [Google Scholar]
- Mellen, F.F. Cretaceous Shelf Sediments of Mississippi. Mississippi State Geol. Surv. Bull. 1958, 112. [Google Scholar]
- Swann, C.T.; Dew, J.J. Geology of the Troy, Miss. 7.5 Minute Topographic Quadrangle Chickasaw and Pontotoc Counties Mississippi. Mississippi Miner. Resour. Inst. Open File Rep. 09-2S 2009, 4–11. [Google Scholar]
- Walker, J.D.; Geissman, J.W.; Bowring, S.A.; Babcock, L.E. Geologic Time Scale v. 5.0. 2018.
- Dockery, D.T. Mesozoic stratigraphic units in Mississippi. Mississippi Geol. 2008, 17, 1–8. [Google Scholar]
- Paces, J.B.; Miller, J.D. Precise U-Pb ages of Duluth Complex and related mafic intrusions, northeastern Minnesota: geochronological insights to physical, petrogenetic, paleomagnetic, and tectonomagmatic processes associated with the 1.1 Ga Midcontinent Rift system. J. Geophys. Res. 1993, 98. [Google Scholar] [CrossRef]
- Black, L.P.; Kamo, S.L.; Williams, I.S.; Mundil, R.; Davis, D.W.; Korsch, R.J.; Foudoulis, C. The application of SHRIMP to Phanerozoic geochronology; a critical appraisal of four zircon standards. Chem. Geol. 2003, 200, 171–188. [Google Scholar] [CrossRef]
- Shaulis, B.; Lapen, T.J.; Toms, A. Signal linearity of an extended range pulse counting detector: Applications to accurate and precise U-Pb dating of zircon by laser ablation quadrupole ICP-MS. Geochem. Geophys. Geosyst. 2010, 11, 1–12. [Google Scholar] [CrossRef]
- Sláma, J.; Košler, J.; Condon, D.J.; Crowley, J.L.; Gerdes, A.; Hanchar, J.M.; Horstwood, M.S.A.; Morris, G.A.; Nasdala, L.; Norberg, N.; et al. Plešovice zircon—A new natural reference material for U-Pb and Hf isotopic microanalysis. Chem. Geol. 2008, 249, 1–35. [Google Scholar] [CrossRef]
- Ludwig, K.R. Isoplot 3.75 2012. Available online: http://www.bgc.org/isoplot_etc/isoplot.html (accessed on 17 January 2020).
- Gehrels, G.; Way, I. Cumulative Age Probability Plots. Available online: https://drive.google.com/file/d/0B9ezu34P5h8eQk04SWEwYTA2eWM/view (accessed on 17 January 2020).
- Gehrels, G. K-S Test. Available online: https://drive.google.com/file/d/0B9ezu34P5h8eLWpNYldGMWp3dEU/view (accessed on 17 January 2020).
- Guynn, J.; Gehrels, G. Comparison of Detrital Zircon Age Distributions Using the K-S Test. Available online: https://docs.google.com/document/d/1MYwm8GcdYFOsfNV62B6PULb_-g2r1AS3vmm4gHMOFxg/preview (accessed on 17 January 2020).
- Vermeesch, P. Dissimilarity measures in detrital geochronology. Earth Sci. Rev. 2018, 178, 310–321. [Google Scholar] [CrossRef]
- Sircombe, K.N.; Hazelton, M.L. Comparison of detrital zircon age distributions by kernel functional estimation. Sediment. Geol. 2004, 171, 91–111. [Google Scholar] [CrossRef]
- Vermeesch, P. Multi-sample comparison of detrital age distributions. Chem. Geol. 2013, 341, 140–146. [Google Scholar] [CrossRef]
- Vermeesch, P.; Resentini, A.; Garzanti, E. An R package for statistical provenance analysis. Sediment. Geol. 2016, 336, 14–25. [Google Scholar] [CrossRef]
- Spencer, C.J.; Kirkland, C.L. Visualizing the sedimentary response through the orogenic cycle: A multidimensional scaling approach. Lithosphere 2016, 8, 29–37. [Google Scholar] [CrossRef] [Green Version]
- Vermeesch, P.; Garzanti, E. Making geological sense of “Big Data” in sedimentary provenance analysis. Chem. Geol. 2015, 409, 20–27. [Google Scholar] [CrossRef]
- Arboit, F.; Collins, A.S.; Morley, C.K.; King, R.; Amrouch, K. Detrital zircon analysis of the southwest Indochina terrane, central Thailand: Unravelling the Indosinian orogeny. Bull. Geol. Soc. Am. 2016, 128, 1024–1043. [Google Scholar] [CrossRef]
- Saylor, J.E.; Jordan, J.C.; Sundell, K.E.; Wang, X.; Wang, S.; Deng, T. Topographic growth of the Jishi Shan and its impact on basin and hydrology evolution, NE Tibetan Plateau. Basin Res. 2018, 30, 544–563. [Google Scholar] [CrossRef]
- Xu, J.; Snedden, J.W.; Stockli, D.F.; Fulthorpe, C.S.; Galloway, W.E. Early miocene continental-scale sediment supply to the gulf of Mexico basin based on detrital zircon analysis. Bull. Geol. Soc. Am. 2017, 129, 3–22. [Google Scholar] [CrossRef]
- Craddock, J.P.; Konstantinou, A.; Vervoort, J.D.; Wirth, K.R.; Davidson, C.; Finley-Blasi, L.; Juda, N.A.; Walker, E. Detrital zircon provenance of the Mesoproterozoic Midcontinent Rift, Lake Superior region, USA. J. Geol. 2013, 121, 57–73. [Google Scholar] [CrossRef]
- Konstantinou, A.; Wirth, K.R.; Vervoort, J.D.; Malone, D.H.; Davidson, C.; Craddock, J.P. Provenance of quartz arenites of the early Paleozoic midcontinent region, USA. J. Geol. 2014, 122, 201–216. [Google Scholar] [CrossRef]
- Kissock, J.K.; Finzel, E.S.; Malone, D.H.; Craddock, J.P. Lower-Middle Pennsylvanian strata in the North American midcontinent record the interplay between erosional unroofing of the Appalachians and eustatic sea-level rise. Geosphere 2018, 14, 141–161. [Google Scholar] [CrossRef] [Green Version]
- Xie, X.; O’Connor, P.M.; Alsleben, H. Carboniferous sediment dispersal in the Appalachian–Ouachita juncture: Provenance of selected late Mississippian sandstones in the Black Warrior Basin, Mississippi, United States. Sediment. Geol. 2016, 342, 191–201. [Google Scholar] [CrossRef]
- Gifford, J.N.; Platt, B.F.; Yarbrough, L.; O’Reilly, A.; Al Harthy, M.H.M. Integrating petrography, x-ray fluorescence, and U-Pb detrital zircon geochronology to interpret provenance of the Mississippian Hartselle Sandstone, USA. J. Geol. (under review).
- Park, H.; Barbeau, D.L.; Rickenbaker, A.; Bachmann-Krug, D.; Gehrels, G. Application of foreland basin detrital-zircon geochronology to the reconstruction of the southern and central Appalachian orogen. J. Geol. 2010, 118, 23–44. [Google Scholar] [CrossRef] [Green Version]
- Eriksson, K.A.; Campbell, I.H.; Palin, J.M.; Allen, C.M.; Bock, B. Evidence for multiple recycling in Neoproterozoic through Pennsylvanian sedimentary rocks of the central Appalachian basin. J. Geol. 2004, 112, 261–276. [Google Scholar] [CrossRef]
- Thomas, W.A.; Gehrels, G.E.; Greb, S.F.; Nadon, G.C.; Satkoski, A.M.; Romero, M.C. Detrital zircons and sediment dispersal in the Appalachian foreland. Geosphere 2017, 13, 2206–2230. [Google Scholar] [CrossRef]
- Huff, W.D. K-bentonites: A review. Am. Mineral. 2016, 101, 43–70. [Google Scholar] [CrossRef]
- Whitmeyer, S.J.; Karlstrom, K.E. Tectonic model for the Proterozoic growth of North America. Geosphere 2007, 3, 220–259. [Google Scholar] [CrossRef]
- Dickinson, W.R.; Gehrels, G.E. U-Pb ages of detrital zircons in Jurassic eolian and associated sandstones of the Colorado Plateau: Evidence for transcontinental dispersal and intraregional recycling of sediment. Geol. Soc. Am. Bull. 2009, 121, 408–433. [Google Scholar] [CrossRef] [Green Version]
- Alsalem, O.B.; Fan, M.; Zamora, J.; Xie, X.; Griffin, W.R. Erratum: Paleozoic sediment dispersal before and during the collision between Laurentia and Gondwana in the Fort Worth Basin, USA. Geosphere 2018, 14, 1988–1989. [Google Scholar] [CrossRef] [Green Version]
- Pryor, W.; Vanwie, W.A. The “Sawdust Sand”; an Eocene sediment of floccule origin. J. Sediment. Res. 1971, 41, 763–769. [Google Scholar] [CrossRef]
- Finkelstein, K.; Ferland, M.A. Back-barrier response to sea-level rise, eastern shore of Virginia. In Sea-Level Fluctuation and Coastal Evolution, SEPM Special Publication 41; Nummendal, D., Pilkey, O.H., Howard, J.D., Eds.; SEPM: Tulsa, Ok, USA, 1987; pp. 145–155. [Google Scholar]
- Hahn, H.H.; Stumm, W. The role of coagulation in natural waters. Am. J. Sci. 1970, 268, 354–368. [Google Scholar] [CrossRef]
- Howard, J.D.; Reineck, H.E. Depositional facies of high-energy beach-to-offshore sequence: Comparison with low-energy sequence. Am. Assoc. Pet. Geol. Bull. 1981, 65, 807–830. [Google Scholar] [CrossRef]
- Buatois, L.A.; Mángano, M.G. Ichnology: Organism-Substrate Interactions in Space and Time; Cambridge University Press: Cambridge, UK, 2011; ISBN 9780521855556. [Google Scholar]
- Frey, R.W.; Howard, J.D.; Pryor, W.A. Ophiomorpha: its morphologic, taxonomic, and environmental significance. Palaeogeogr. Palaeoclimatol. Palaeoecol. 1978, 23, 199–229. [Google Scholar] [CrossRef]
- Pollard, J.E.; Goldring, R.; Buck, S.G. Ichnofabrics containing Ophiomorpha: significance in shallow-water facies interpretation. J. Geol. Soc. London. 1993, 150, 149–164. [Google Scholar] [CrossRef]
- Bromley, R.G.; Ekdale, A.A. Ophiomorpha irregulaire (trace fossil): Redescription from the Cretaceous of the Book Cliffs and Wasatch Plateau, Utah. J. Paleontol. 1998, 72, 773–778. [Google Scholar] [CrossRef]
- Goldring, R. The sedimentological significance of concentrically laminated burrows from Lower Cretaceous Ca-bentonites, Oxfordshire. J. Geol. Soc. Lond. 1996, 153, 255–263. [Google Scholar] [CrossRef]
- Pemberton, S.G.; MacEachern, J.A.; Dashtgard, S.E.; Bann, K.L.; Gingras, M.K.; Zonneveld, J.P. Shorefaces. In Trace Fossils as Indicators of Sedimentary Environments; Knaust, D., Bromley, R.G., Eds.; Elsevier: Amsterdam, The Netherlands, 2012; pp. 563–603. [Google Scholar]
- Evans, G. Intertidal Flat Deposits of the Wash, Western Margin of the North Sea. In Tidal Deposits; Ginsburg, R.N., Ed.; Springer: Berlin/Heidelberg, Germany, 1975; pp. 13–20. [Google Scholar]
- Skotnicki, M.C.; King, D.T. Depositional facies and eustatic effects in Upper Cretaceous (Maastrichtian) Ripley Formation, central and eastern Alabama. Trans. Gulf Coast Assoc. Geol. Soc. 1989, 39. [Google Scholar] [CrossRef]
- Rivers, T. Lithotectonic elements of the Grenville Province: Review and tectonic implications. Precambrian Res. 1997, 86, 117–154. [Google Scholar] [CrossRef]
- Tollo, R.P.; Corriveau, L.; McLelland, J.; Bartholomew, M.J. Proterozoic tectonic evolution of the Grenville orogeny in North America: an introduction. In Proterozoic Tectonic Evolution of the Grenville Orogen in North America, GSA Memoir 197; Tollo, R.P., McLelland, J., Corriveau, L., Bartholomew, M.J., Eds.; Geological Society of America: Boulder, CO, USA, 2004; pp. 1–18. [Google Scholar]
- Drake, A.A.; Sinha, A.K.; Laird, J.; Guy, R.E. The Taconic orogen. In The Appalachian–Ouachita Orogen in the United States; Hatcher, R.D., Thomas, W.A., Viele, G.W., Eds.; Geological Society of America: Boulder, CO, USA, 1989; pp. 101–177. [Google Scholar]
- Miller, C.F.; Hatcher, R.D.; Ayers, J.C.; Coath, C.D.; Harrison, T.M. Age and zircon inheritance of eastern blue ridge plutons, southwestern North Carolina and northeastern Georgia, with implications for magma history and evolution of the southern appalachian orogen. Am. J. Sci. 2000, 300, 142–172. [Google Scholar] [CrossRef]
- Sinha, A.K.; Hanan, B.B.; Wayne, D.M. Igneous and metamorphic U-Pb zircon ages from the Baltimore mafic complex, Maryland Piedmont. In The Nature of Magmatism in the Appalachian Orogen, Geological Society of America Memoir 191; Sinha, A.K., Whalen, J.B., Hogan, J.P., Eds.; Geological Society of America: Boulder, CO, USA, 1997; pp. 275–286. [Google Scholar]
- Bickford, M.E.; Van Schmus, W.R.; Karlstrom, K.E.; Mueller, P.A.; Kamenov, G.D. Mesoproterozoic-trans-Laurentian magmatism: A synthesis of continent-wide age distributions, new SIMS U-Pb ages, zircon saturation temperatures, and Hf and Nd isotopic compositions. Precambrian Res. 2015, 265, 286–312. [Google Scholar] [CrossRef]
- Van Schmus, W.R.; Bickford, M.E.; Turek, A. Proterozoic geology of the east-central Midcontinent basement. In Basement and basins of eastern North America; van der Pluijm, B.A., Catacosinos, P.A., Eds.; Geological Society of America: Boulder, CO, USA, 1996; pp. 7–32. [Google Scholar]
- Sevigny, J.H.; Hanson, G.N. Orogenic evolution of the New England Appalachians of southwestern Connecticut. Geol. Soc. Am. Bull. 1993, 105, 1591–1605. [Google Scholar] [CrossRef]
- Gower, C.F.; Krogh, T.E. A U–Pb geochronological review of the Proterozoic history of the eastern Grenville Province. Can. J. Earth Sci. 2002, 39, 795–829. [Google Scholar] [CrossRef]
- Moecher, D.P.; Samson, S.D. Differential zircon fertility of source terranes and natural bias in the detrital zircon record: Implications for sedimentary provenance analysis. Earth Planet. Sci. Lett. 2006, 247, 252–266. [Google Scholar] [CrossRef]
- Osberg, P.H.; Tull, J.F.; Robinson, P.; Hon, R.; Butler, J.R. The Acadian orogen. In The Appalachian–Ouachita Orogen in the United States; Hatcher, R.D., Jr., Thomas, W.A., Viele, G.W., Eds.; Geological Society of America: Boulder, CO, USA, 1989; pp. 179–232. [Google Scholar]
- Becker, T.P.; Thomas, W.A.; Samson, S.D.; Gehrels, G.E. Detrital zircon evidence of Laurentian crustal dominance in the lower Pennsylvanian deposits of the Alleghanian clastic wedge in eastern North America. Sediment. Geol. 2005, 182, 59–86. [Google Scholar] [CrossRef]
- Coleman, J.L.; Cahan, S.M. Preliminary Catalog of the Sedimentary Basins of the United States, USGS Open-File Report 2012-111; U. S. Geological Survey: Reston, VA, USA, 2012.
- Gleason, J.D.; Finney, S.C.; Gehrels, G.E. Paleotectonic implications of a Mid- to Late-Ordovician provenance shift, as recorded in sedimentary strata of the Ouachita and southern Appalachian Mountains. J. Geol. 2002, 110, 291–304. [Google Scholar] [CrossRef]
- Milliman, J.D.; Syvitski, J.P.M. Geomorphic/tectonic control of sediment discharge to the ocean: The importance of small mountainous rivers. J. Geol. 1992, 100, 525–544. [Google Scholar] [CrossRef]
- Chang, Z.; Vervoort, J.D.; McClelland, W.C.; Knaack, C. U-Pb dating of zircon by LA-ICP-MS. Geochem. Geophys. Geosystems 2006, 7. [Google Scholar] [CrossRef]
- Gehrels, G.; Valencia, V.; Pullen, A. Detrital Zircon Geochronology by Laser-Ablation Multicollector ICPMS at the Arizona LaserChron Center. Paleontol. Soc. Pap. 2006, 12, 67–76. [Google Scholar] [CrossRef]
- Gehrels, G.E.; Valencia, V.A.; Ruiz, J. Enhanced precision, accuracy, efficiency, and spatial resolution of U-Pb ages by laser ablation-multicollector-inductively coupled plasma-mass spectrometry. Geochem. Geophys. Geosyst. 2008, 9, 1–13. [Google Scholar] [CrossRef]
- Corfu, F.; Davis, D.W. A U-Pb geochronological framework for the western Superior Province. In Geology of Ontario; Thurston, P.C., Williams, H.R., Sutcliffe, R.H., Stott, G.M., Eds.; Ontario Geological Survey: Toronto, ON, Canada, 1992; pp. 1335–1346. [Google Scholar]
- Böhm, C.O.; Heaman, L.M.; Creaser, R.A.; Corkery, M.T. Discovery of pre-3.5 Ga exotic crust at the northwestern Superior Province margin, Manitoba. Geology 2000, 28, 75–78. [Google Scholar] [CrossRef]
- David, J.; Parent, M.; Stevenson, R.; Nadeau, P.; Godin, L. The Porpoise Cove supracrustal sequence, Inukjuak area: A unique example of Paleoarchean crust (ca. 3.8 Ga) in the Superior Province. Geol. Assoc. Canada Progr. Abstr. 2003, 28, 355. [Google Scholar]
- Percival, J.A.; Helmstaedt, H. Insights on Archean continent—Ocean assembly, western Superior Province, from new structural, geochemical and geochronological observations: Introduction and summary. Precambrian Res. 2004, 132, 209–212. [Google Scholar] [CrossRef]
- Bickford, M.E.; Wooden, J.L.; Bauer, R.L. SHRIMP study of zircons from Early Archean rocks in the Minnesota River Valley: Implications for the tectonic history of the Superior Province. Bull. Geol. Soc. Am. 2006, 118, 94–108. [Google Scholar] [CrossRef]
- Langford, F.F.; Morin, J.A. The development of the Superior province of northwestern Ontario by merging island arcs. Am. J. Sci. 1976, 276, 1023–1034. [Google Scholar] [CrossRef]
- Calvert, A.J.; Ludden, J.N. Archean continental assembly in the southeastern Superior Province of Canada. Tectonics 1999, 18, 412–429. [Google Scholar] [CrossRef]
- Sims, P.K. Early Proterozoic Penokean orogen. In Archean and Proterozoic Geology of the Lake Superior Region, USA: 1993; USGS Professional Paper 1556; Sims, P.K., Carter, L.M.H., Eds.; United States Government Printing Office: Washington, DC, USA, 1996; pp. 28–30. [Google Scholar]
- Holm, D.K. A geodynamic model for Paleoproterozoic post-tectonic magma genesis in the southern Trans-Hudson (Black Hills, South Dakota) and Penokean (southern Lake Superior) orogens. Rocky Mt. Geol. 1999, 34, 183–194. [Google Scholar] [CrossRef]
- Chandler, V.W.; Boerboom, T.J.; Jirsa, M.A. Penokean tectonics along a promontory-embayment margin in east-central Minnesota. Precambrian Res. 2007, 157, 26–49. [Google Scholar] [CrossRef]
- Craddock, J.P.; Malone, D.H.; Schmitz, M.D.; Gifford, J.N. Strain variations across the Proterozoic Penokean Orogen, USA and Canada. Precambrian Res. 2018, 318, 25–69. [Google Scholar] [CrossRef]
- Van Schmus, W.R.; Bickford, M.E.; Zietz, I. Early and middle Proterozoic provinces in the central United States. In Proterozoic Lithosphere Evolution; Kroner, A., Ed.; American Geophysical Union: Washington, DC, USA, 1987; p. 273. [Google Scholar]
- Bennett, V.C.; DePaolo, D.J. Proterozoic crustal history of the western United States as determined by neodymium isotopic mapping. Bull. Geol. Soc. Am. 1987, 99, 674–685. [Google Scholar] [CrossRef]
- Condie, K.C. Proterozoic terranes and continental accretion in southwestern North America. In Proterozoic Crustal Evolution; Condie, K.C., Ed.; Elsevier: Amsterdam, The Netherlands, 1992; pp. 447–480. [Google Scholar]
- Rämö, O.T.; McLemore, V.T.; Hamilton, M.A.; Kosunen, P.J.; Heizler, M.; Haapala, I. Intermittent 1630-1220 Ma magmatism in central Mazatzal province: New geochronologic piercing points and some tectonic implications. Geology 2003, 31, 335–338. [Google Scholar] [CrossRef]
- Freiburg, J.T.; McBride, J.H.; Malone, D.H.; Leetaru, H.E. Petrology, geochronology, and geophysical characterization of Mesoproterozoic rocks in central Illinois, USA. Geosci. Front. 2019. [Google Scholar] [CrossRef]
- Xie, X.; Buratowski, G.; Manager, W.L.; Zachry, D. U-Pb Detrital-zircon Geochronology of the Middle Bloyd Sandstone (morrowan) of Northern Arkansas (USA.): Implications For Early Pennsylvanian Sediment Dispersal in the Laurentian Foreland. J. Sediment. Res. 2018, 88, 795–810. [Google Scholar] [CrossRef]
- Dennis, A.J.; Wright, J.E. The Carolina terrane in northwestern South Carolina, USA: Late Precambrian-Cambrian deformation and metamorphism in a peri-Gondwanan oceanic arc. Tectonics 1997, 16, 460–473. [Google Scholar] [CrossRef]
- Barnett, R.S. Basement Structure of Florida and its Tectonic Implications. GCAGS Trans. 1975, 25, 122–142. [Google Scholar] [CrossRef]
- Chowns, T.; Williams, C. Pre-Cretaceous rocks beneath the Georgia coastal plain—regional implications. In Studies Related to the Charleston, South Carolina Earthquake of 1886—Tectonics and Seismicity, USGS Professional Paper 1313; Gohn, G., Ed.; United States Government Printing Office: Washington, DC, USA, 1983; pp. L1–L42. [Google Scholar]
- Duncan, J. Geologic History of an Accreted Terrane: Paleozoic Stratigraphy of the North Florida Basin, Suwannee Terrane. Ph.D. Thesis, Florida State University, Tallahassee, FL, USA, 1998. [Google Scholar]
- Mueller, P.A.; Heatherington, A.L.; Foster, D.A.; Thomas, W.A.; Wooden, J.L. The Suwannee suture: Significance for Gondwana-Laurentia terrane transfer and formation of Pangaea. Gondwana Res. 2014, 26, 365–373. [Google Scholar] [CrossRef]
- Cramer, F.H. Middle and upper silurian chitinozoan succession in Florida subsurface. J. Paleontol. 1973, 47, 279–288. [Google Scholar]
- Pojeta, J. Silurian-Devonian Pelecypods and Paleozoic Stratigraphy of Subsurface Rocks in Florida and Georgia and Related Silurian Pelecypods From Bolivia and Turkey, USGS Professional Paper 879; United States Government Printing Office: Washington, DC, USA, 1976.
- Opdyke, N.D.; Jones, D.S.; Macfadden, B.J.; Smith, D.L.; Mueller, P.A.; Shuster, R.D. Florida as an exotic terrane: Paleomagnetic and geochronologic investigation of lower Paleozoic rocks from the subsurface of Florida (USA). Geology 1987, 15, 900–903. [Google Scholar] [CrossRef]
- Mueller, P.A.; Heatherington, A.L.; Wooden, J.L.; Shuster, R.D.; Nutman, A.P.; Williams, I.S. Precambrian zircons from the Florida basement: A Gondwanan connection. Geology 1994, 22, 119–122. [Google Scholar] [CrossRef]
- Clift, P.D.; Heinrich, P.; Dunn, D.; Jacobus, A.; Blusztajn, J. The Sabine block, Gulf of Mexico: Promontory on the North American margin? Geology 2018, 46, 15–18. [Google Scholar] [CrossRef]
- Sinha, A.K. Lead isotope mapping of crustal reservoirs within the Grenville superterrane. Geol. Soc. Am. Abstr. Programs 1997, 29, 69. [Google Scholar]
- Chidester, A.H. Evolution of the ultramafic complexes of northwestern New England. In Studies of Appalachian Geology: Northern and Maritime; Zen, E., White, W.S., Hadley, J.B., Thompson, J.B., Eds.; Wiley Interscience: New York, NY, USA, 1968; pp. 343–354. [Google Scholar]
- Naylor, R.S. A Field and Geochronologic Study of Mantled Gneiss Domes in General New England. Ph.D. Thesis, California Institute of Technology, Pasadena, CA, USA, 1967. [Google Scholar]
- Leo, G.W.; Zartman, R.E.; Brookins, D.G. Glastonbury Gneiss and Mantling Rocks (a Modified Oliverian Dome) in South-Central Massachusetts and North-Central Connecticut: Geochemistry, Petrogenesis, and Isotopic Age. Geol. Surv. Prof. Pap. 1984, 1295, 1–45. [Google Scholar]
- Billings, M.P. The Geology of New Hampshire Part II-Bedrock geology; The New Hampshire State Planning and Development Commission: Concord, NH, USA, 1956; p. 204. [Google Scholar]
- Rankin, D.W. Volcanism related to tectonism in the Piscataquis Volcanic belt, an island arc of early Devonian age in north-central Maine. In Studies of Appalachian Geology: Northern and Maritime; Zen, E., White, W.S., Hadley, J.B., Thompson, J.B.J., Eds.; Interscience Publishers: New York, NY, USA, 1968; pp. 355–370. [Google Scholar]
- Bradley, D.C. Tectonics of the Acadian Orogeny in New England and adjacent Canada (USA). J. Geol. 1983, 91, 381–400. [Google Scholar] [CrossRef]
- Hon, R.; Fitzgerald, J.P.; Sargent, S.L.; Schwartz, W.D.; Dostal, J.; Keppie, J.D. Silurian-early Devonian mafic rocks of the Piscataquis volcanic belt in northern Maine. Atl. Geol. 1992, 28, 163–170. [Google Scholar] [CrossRef] [Green Version]
- Berry, W.B.N.; Boucot, A.J. Correlation of the North American Silurian Rocks; Geological Society of America Special Papers; Geological Society of America: Boulder, CO, USA, 1970; Volume 102, p. 289. ISBN 0-8137-2102-4. [Google Scholar]
- Shride, A.F. Stratigraphy and Correlation of the Newbury Volcanic Complex, Northeastern Massachusetts. In Contributions to the Stratigraphy of New England: Geological Society of America Memoir 148; Page, L.R., Ed.; Geological Society of America: Boulder, CO, USA, 1976; pp. 147–178. [Google Scholar]
- Gates, O. Geologic Map and cross Sections of the Eastport quadrangle, Maine. Available online: https://digitalmaine.com/mgs_maps/292/ (accessed on 17 January 2020).
- Hatcher, R.D. The Appalachian orogen: A brief summary. In From Rodinia to Pangea: The Lithotectonic Record of the Appalachian Region, GSA Memoir 206; Tollo, R., Bartholomew, M., Hibbard, J., Karabinos, P., Eds.; Geological Society of America: Boulder, CO, USA, 2010; pp. 1–20. [Google Scholar]
- Hatcher, R.D. Tectonic map of the southern and central Appalachians: A tale of three orogens and a complete Wilson cycle. In 4-D Framework of Continental Crust, GSA Memoir 200; Hatcher, R.D.J., Carlson, M.P., McBride, J.H., Martínez Catalán, J.R., Eds.; Geological Society of America: Boulder, CO, USA, 2007; pp. 595–632. [Google Scholar]
- Hatcher, R.D.J.; Thomas, W.A.; Geiser, P.A.; Snoke, A.W.; Mosher, S.; Wiltschko, D.V. Alleghanian orogen. In The Appalachian–Ouachita Orogen in the United States; Hatcher, R.D.J., Thomas, W.A., Viele, G.W., Eds.; Geological Society of America: Boulder, CO, USA, 1989; pp. 233–318. [Google Scholar]


| North American Age Provinces | Northern Samples | Southern Samples | Combined |
|---|---|---|---|
| n = 273 | n = 376 | n = 649 | |
| Alleghanian (330–265 Ma) | 0.0% | 1.1% | 0.6% |
| Acadian (450–320 Ma) | 1.8% | 10.6% | 6.9% |
| Taconic (490–440 Ma) | 3.3% | 0.3% | 1.5% |
| Gondwanan Terranes (900–500 Ma) | 1.1% | 2.9% | 2.2% |
| Grenville (1350–900 Ma) | 80.2% | 80.1% | 80.1% |
| MC-Granite–Rhyolite (1600–1350 Ma) | 9.9% | 4.5% | 6.8% |
| Yavapai–Mazatzal (1800–1600 Ma) | 1.5% | 0.0% | 0.6% |
| Trans-Hudson/Penokean (1900–1800 Ma) | 0.7% | 0.0% | 0.3% |
| Superior Province (> 2500 Ma) | 1.5% | 0.5% | 0.9% |
| Northern Location XRD Analysis | |||
| TR-01 | TR-04 | ||
| Constituent | Weight % | Constituent | Weight % |
| Quartz | 49.8 | Quartz | 56.9 |
| Kaolinite | 21.9 | Kaolinite | 17.2 |
| Muscovite | 13.9 | Illite | 10 |
| Illite | 10.8 | Muscovite | 9.7 |
| Montmorillonite (Ca, Na rich) | 3.6 | Montmorillonite (Ca, Na rich) | 6.2 |
| Southern Location XRD Analysis | |||
| Pontotoc-1 | Pontotoc-2 | ||
| Constituent | Weight % | Constituent | Weight % |
| Quartz | 39.9 | Quartz | 46 |
| Montmorillonite (Na rich) | 15.5 | Muscovite | 16.5 |
| Muscovite | 14.1 | Kaolinite | 16.4 |
| Illite | 12.3 | Illite | 10.4 |
| Kaolinite | 9 | Montmorillonite (Ca, Na rich) | 7.8 |
| Montmorillonite (Ca, Na rich) | 4.9 | Birnessite | 2.9 |
| Birnessite | 4.1 | ||
© 2020 by the authors. Licensee MDPI, Basel, Switzerland. This article is an open access article distributed under the terms and conditions of the Creative Commons Attribution (CC BY) license (http://creativecommons.org/licenses/by/4.0/).
Share and Cite
Gifford, J.N.; Vitale, E.J.; Platt, B.F.; Malone, D.H.; Widanagamage, I.H. Detrital Zircon Provenance and Lithofacies Associations of Montmorillonitic Sands in the Maastrichtian Ripley Formation: Implications for Mississippi Embayment Paleodrainage Patterns and Paleogeography. Geosciences 2020, 10, 80. https://0-doi-org.brum.beds.ac.uk/10.3390/geosciences10020080
Gifford JN, Vitale EJ, Platt BF, Malone DH, Widanagamage IH. Detrital Zircon Provenance and Lithofacies Associations of Montmorillonitic Sands in the Maastrichtian Ripley Formation: Implications for Mississippi Embayment Paleodrainage Patterns and Paleogeography. Geosciences. 2020; 10(2):80. https://0-doi-org.brum.beds.ac.uk/10.3390/geosciences10020080
Chicago/Turabian StyleGifford, Jennifer N., Elizabeth J. Vitale, Brian F. Platt, David H. Malone, and Inoka H. Widanagamage. 2020. "Detrital Zircon Provenance and Lithofacies Associations of Montmorillonitic Sands in the Maastrichtian Ripley Formation: Implications for Mississippi Embayment Paleodrainage Patterns and Paleogeography" Geosciences 10, no. 2: 80. https://0-doi-org.brum.beds.ac.uk/10.3390/geosciences10020080