Near-Real-Time Loss Estimates for Future Italian Earthquakes Based on the M6.9 Irpinia Example


International Centre for Earth Simulation Foundation, 1223 Cologny, Switzerland
*
Author to whom correspondence should be addressed.
Geosciences 2020, 10(5), 165; https://0-doi-org.brum.beds.ac.uk/10.3390/geosciences10050165
Submission received: 17 March 2020
/
Revised: 15 April 2020
/
Accepted: 30 April 2020
/
Published: 3 May 2020
(This article belongs to the Special Issue The November 23rd, 1980 Irpinia-Lucania, Southern Italy Earthquake: Insights and Reviews 40 Years Later)
Abstract
:The number of fatalities and injured was calculated, using the computer code QLARM and its data set and assuming information about the Irpinia 1980 earthquake became available in near-real-time. The casualties calculated for a point source, an approximate line source and a well-defined line source would have become available about 30 min, 60 min and years after the main shock, respectively. The first estimate would have been satisfactory, indicating the seriousness of the disaster. The subsequent loss estimate after 60 min would have defined the human losses accurately, and the ultimate estimate was most accurate. In 2009, QLARM issued a correct estimate of the number of fatalities within 22 min of the M6.3 L’Aquila main shock. These two results show that the number of casualties and injuries in large and major earthquakes in Italy can be estimated correctly within less than an hour by using QLARM.
1. Introduction
At the time of the M6.9 Irpinia earthquake of 1980, near-real-time loss estimates for earthquakes did not exist. Today however, two teams distribute these estimates for major earthquakes worldwide. The PAGER (USGS) and the QLARM (Quake Loss Assessment for Response and Mitigation) teams distribute loss alerts within 25 min and 29 min of potential earthquake disasters, respectively [1].
The question we ask in this article is how reliable are theoretical fast loss assessments in cases of major and large earthquakes in Italy? The M6.9 Irpinia earthquake is used as an example. Calculations are presented of what the estimates of fatalities and injured would have been immediately after the Irpinia earthquake. The results are an indication of the quality of loss estimates by QLARM within less than an hour of the next large earthquake neighboring the Irpinia or L’Aquila areas and, by implication, in all of Italy.
The routine by which QLARM alerts are issued in near-real-time is described by Wyss [1]. The details of the program and data sets in QLARM are given by Trendafiloski et al. [2]. Different aspects and uses of QLARM have been discussed in several articles [3,4,5,6]. Here, we do not repeat these explanations; rather, we focus on the Irpinia earthquake and the quality of near-real-time earthquake loss assessments in Italy.
Our aim in loss calculations is to estimate the total sum of fatalities that are likely as a measure of the extent of earthquake disasters. The unknown parameters within minutes after an earthquake are numerous, as all initial earthquake parameters are afflicted by significant uncertainties [7]. The direction of rupture and consequential focusing of radiated energy becomes known only later, if ever. The local wave attenuation was not known, so we used an average. Soil conditions that might amplify accelerations are not known for any specific location. Building resistance to shaking was only known approximately in an average sense, so we used an approximate model for the building types. Finally, the occupancy rate was also largely unknown, so we used 99% occupancy at night and 26% during the day.
All these unknowns mean that we cannot attempt to calculate what happens to a specific building. Instead, we rely on an average. We only have confidence in the overall sum of casualties, not even in those within one settlement, and much less those within a building. It is this overall average estimate of fatalities that we distribute minutes after earthquakes, and it is this value that would have been calculated by QLARM after the Irpinia earthquake that we are testing here.
2. Building Stock Used
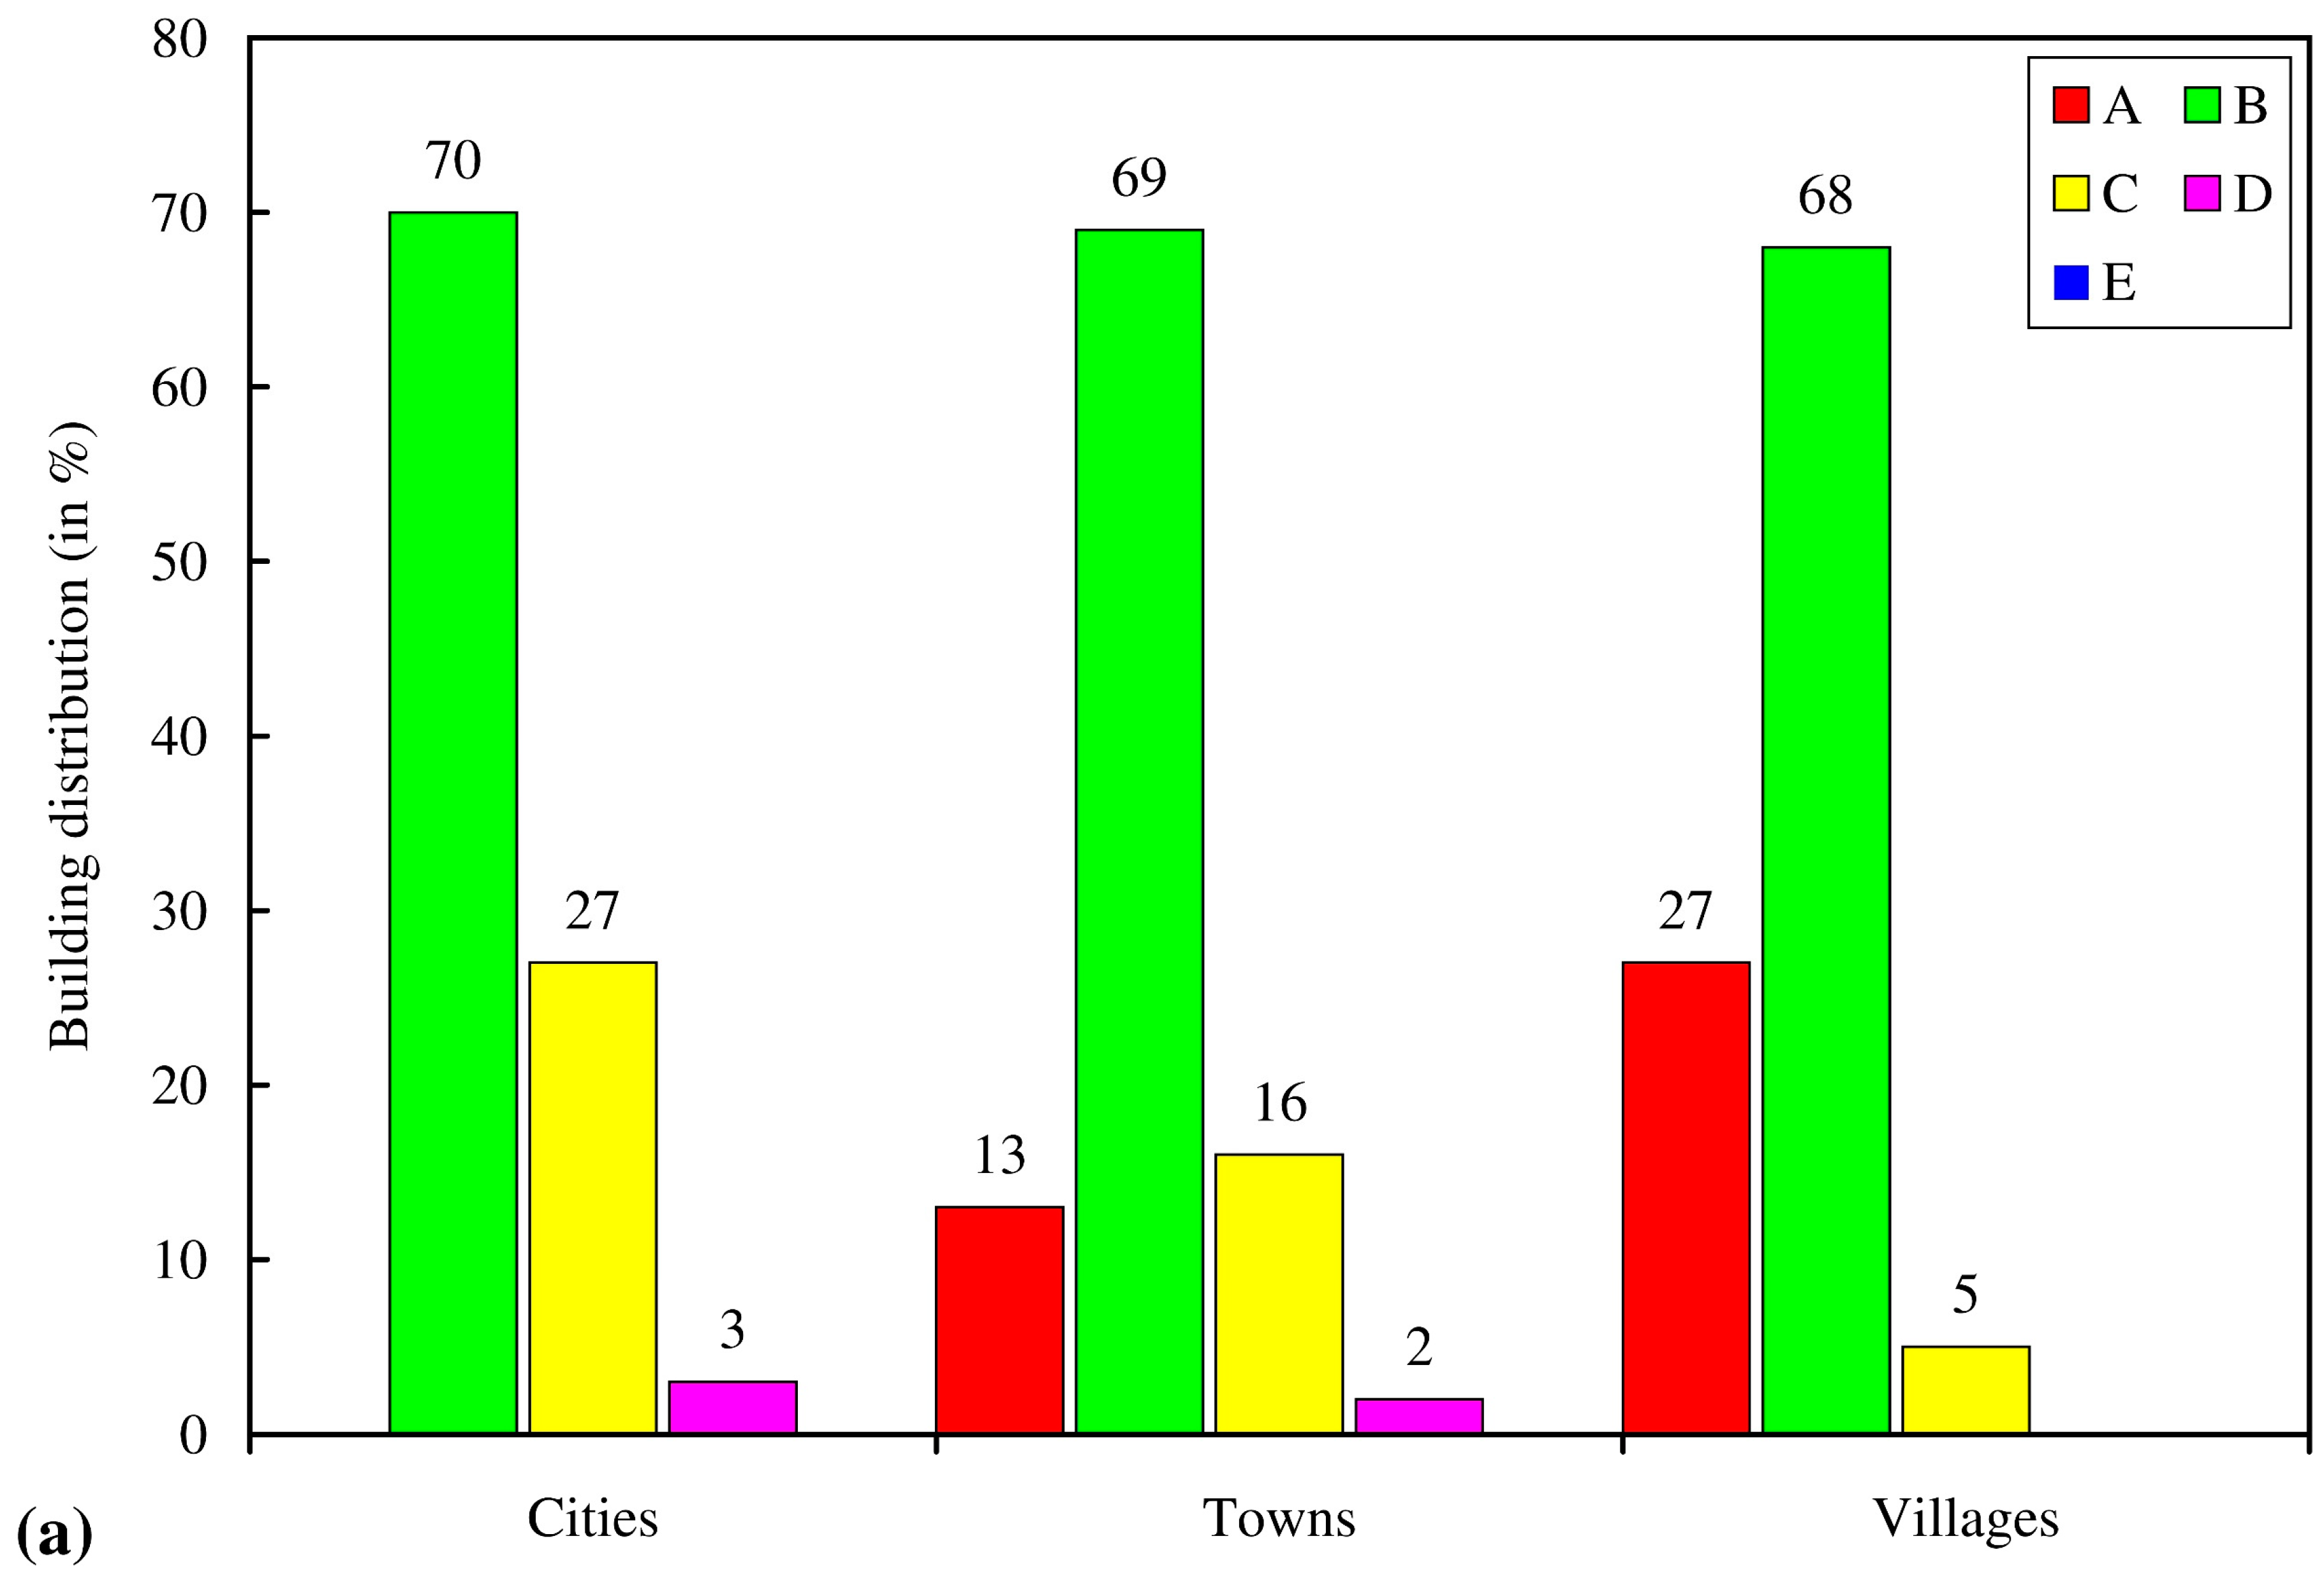
An aspect of QLARM application to Italy that has not previously been explained is the distribution of buildings into vulnerability classes and their occupants. As QLARM is a tool operated pro-bono for worldwide application, we did not have the information or the resources necessary to construct detailed information on the specific buildings in each settlement. This information can be developed by special projects [8,9], but, on a worldwide basis, it was available to us only for Greece. The Greek 2001 population and building census includes information about the construction material, age and number of floors for each building (Hellenic Statistical Authority). This information allowed the classification of all building types in each settlement according to the European Macroseismic Scale 1998 (EMS98) [9] for Greece only. For other regions, like southern Europe, we used averages with three size categories. The population limits for building models we used for Italy were pop1 < 2000 ≤ pop2 < 20,000 ≤ pop3 (Table 1).
The building distribution used for Italy and people in them are listed in Table 1 and shown in Figure 1. We are not advocating these approximations to the built environment as the best option for a specific local environment, we simply needed models for all countries of the word that would yield correct results. For several countries, we verified the appropriateness of the models for building stock by determining if the theoretical estimates of the total numbers of fatalities agreed with the reported numbers in large earthquakes [5,6,10].
3. The M6.3 L’Aquila Earthquake
In the case of the L’Aquila earthquake, the QLARM alert was correct (Table 2). This type of estimate can serve as a guide for first responders at a time when no information is available from the devastated area.
4. Loss Estimates for the M6.9 Irpinia Earthquake
The loss estimates for the Irpinia event presented here were calculated as if the earthquake’s parameters became available in near-real-time by SMS and no other information existed, as in the aforementioned L’Aquila earthquake. The hypocenters and magnitudes of significant earthquakes worldwide are received by users, such as QLARM, from the GFZ (GeoForschungsZentrum) and the USGS (United States Geological Survey) within 7 and 18 min, respectively. After receiving this message, shaking intensities, damage to buildings and the impact on occupants are immediately calculated. At first, only the hypocenter is known, not the extent and direction of the rupture. Also, initial hypocenter and magnitude values tend to be inaccurate. In the case of the Irpinia earthquake, it is not known by what errors the first parameter estimates were afflicted, so those parameters currently listed by the USGS (M6.9, 1980-11-23 18:34:53 (UTC) 40.914° N 15.366° E) must be used.
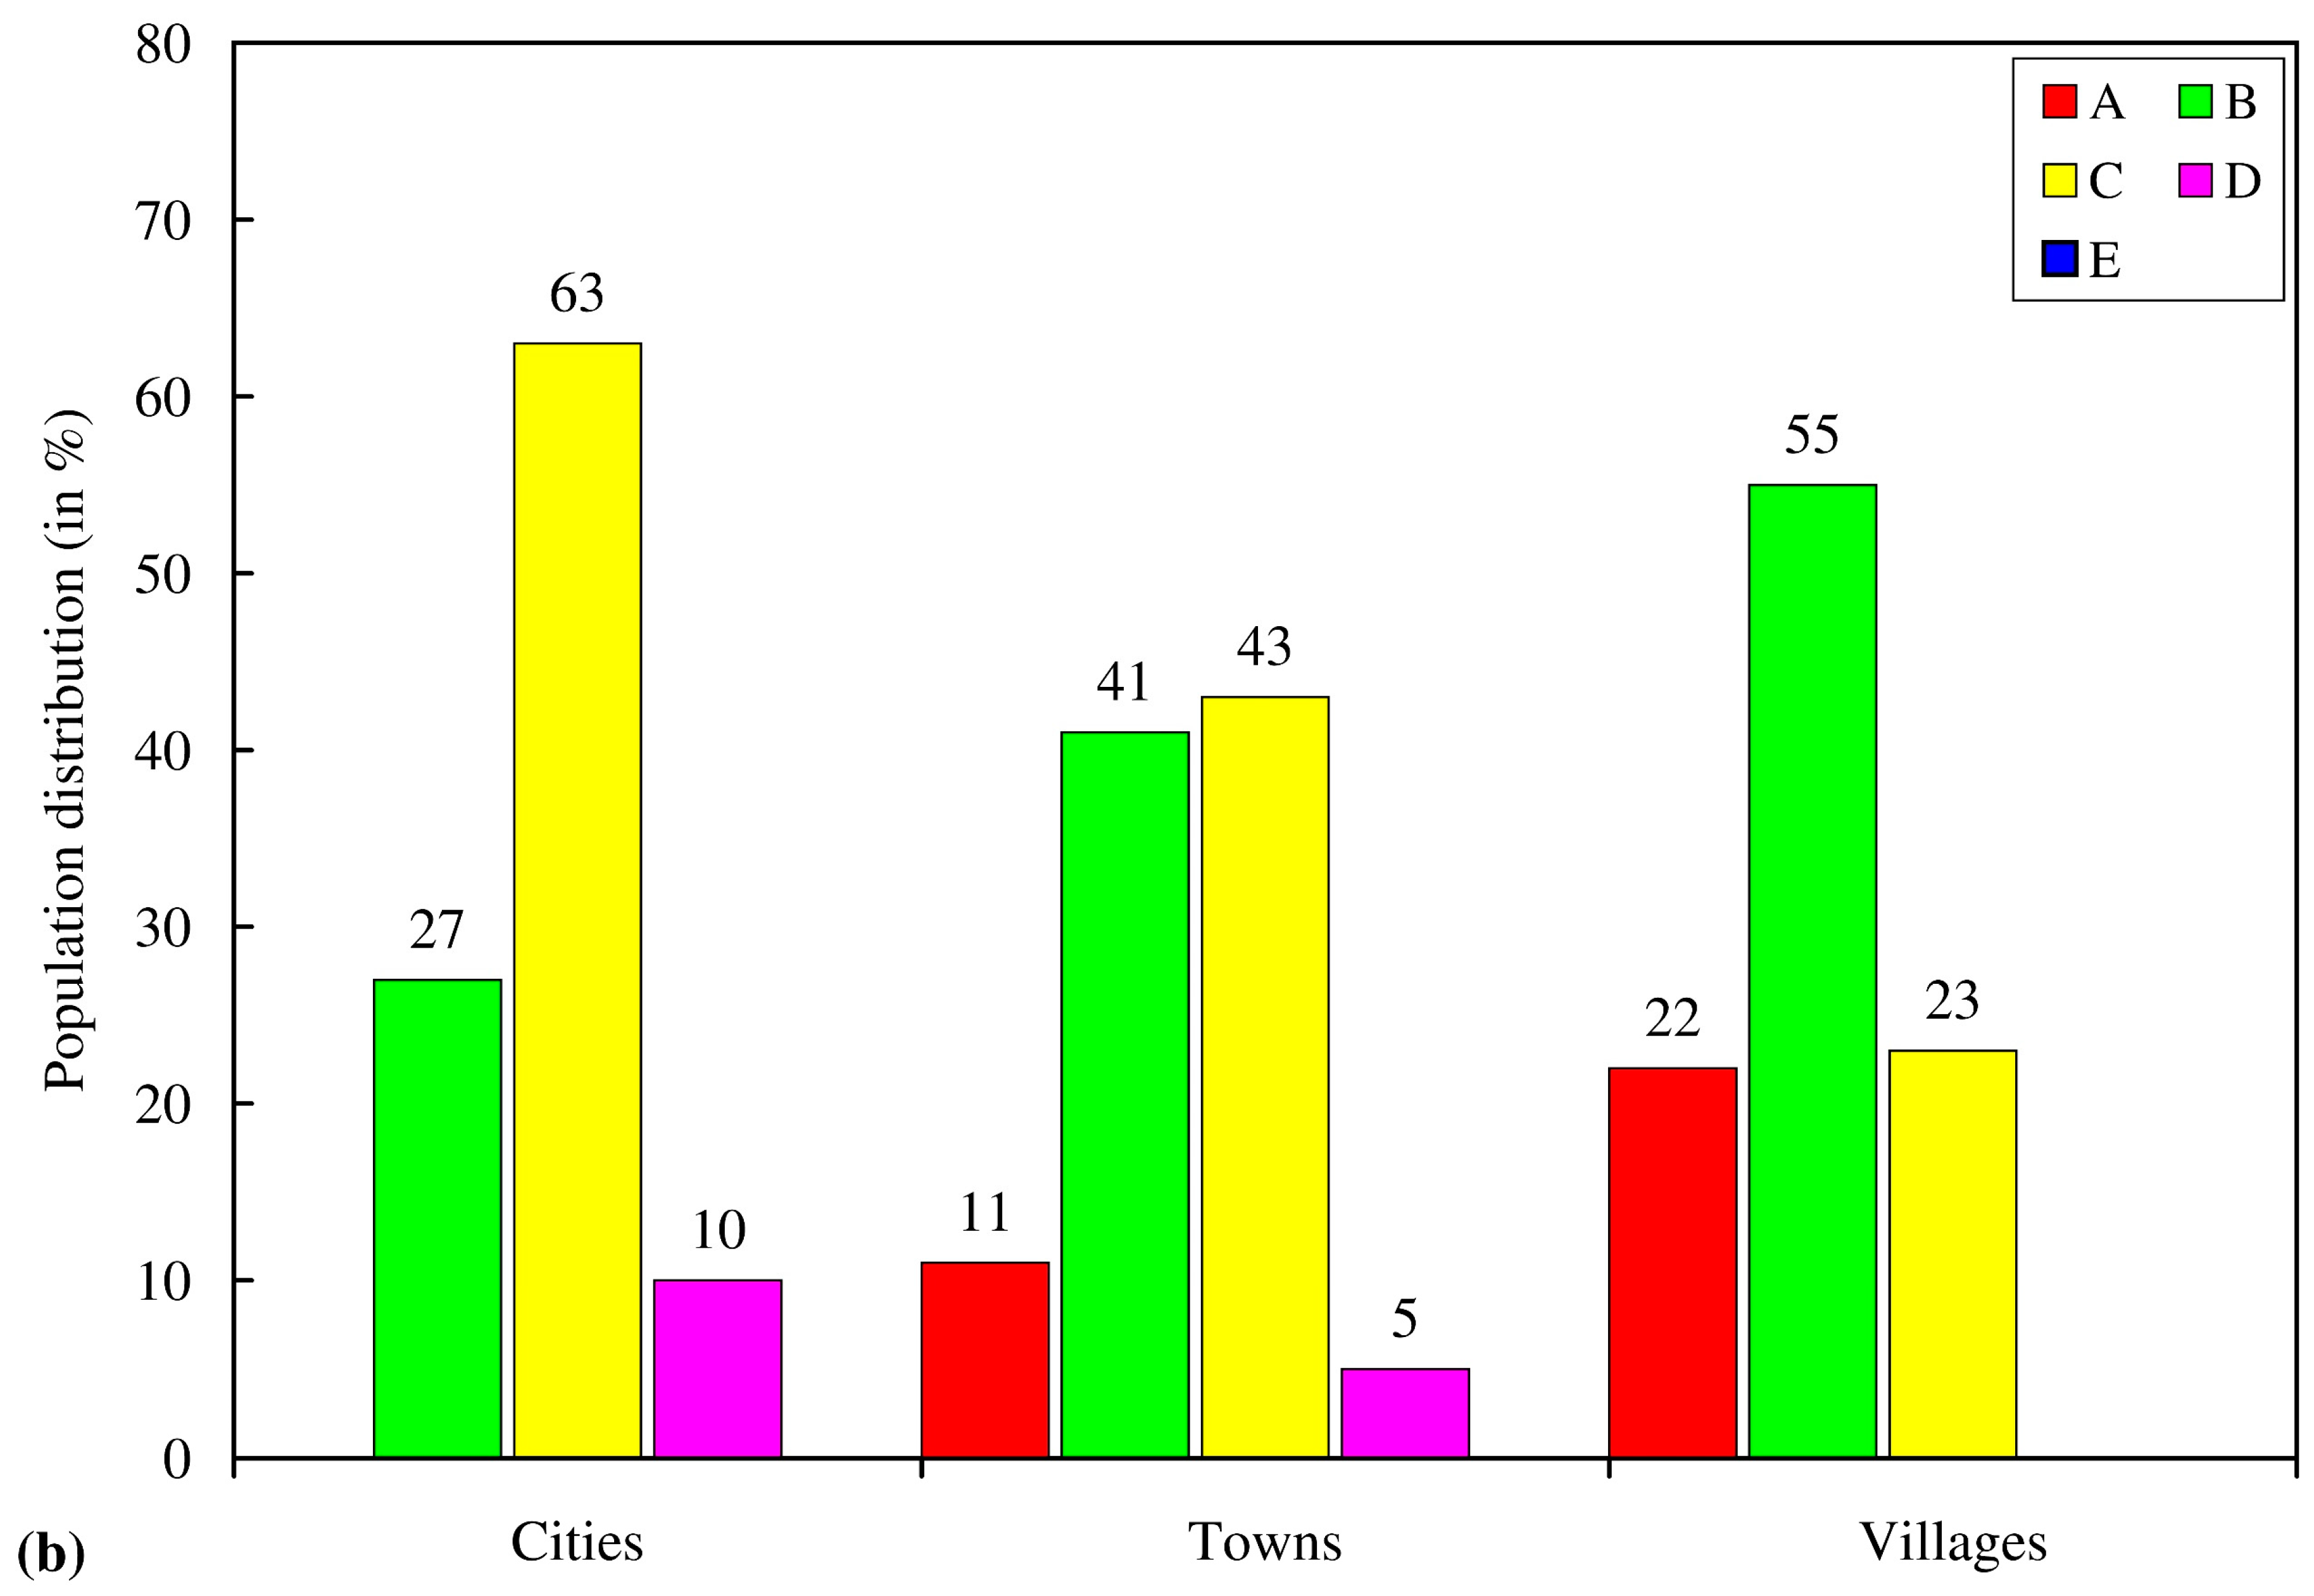
The map showing settlements with color-coded damage due to an M6.9 earthquake at the Irpinia epicenter modeled as a point source is shown in Figure 2. The mean damage is given on a scale from 0 to 5. The calculated pattern is circular because the direction of rupture would not have been known. This map and the casualties (both fatalities and injured) given in the first row of Table 3 would have been distributed by the QLARM team about 30 min after the rupture.
The location of an aftershock can provide hints about the direction and length of the rupture. In November 1980, the USGS calculated the aftershock hypocenters given in Table 4 during the first 32 min after the initiation of the rupture. Since QLARM distributes loss estimates about 30 min after a given earthquake, estimates of losses based on a line source (defined by the aftershocks), would have been distributed within about one hour of the main shock.
The three aftershocks listed in Table 4 define an approximate direction of the rupture NW to SE. Therefore, in real time, the QLARM operator would have made the usual assumption that the aftershocks most distant from the initiation of the rupture give an approximate indication of the rupture length and direction. In this case, aftershocks 1 and 2 (origin times 18:52 and 19:04) were separated by 61 km. This length agrees with an M6.9 rupture [11,12]. That means it supports the hypothesis that after 30 min the full length of the rupture was approximately defined as 61 km. Assuming that this was the case, a second estimate of the casualties, as given in the second row of Table 3, would have been distributed by QLARM within about an hour of the earthquake.
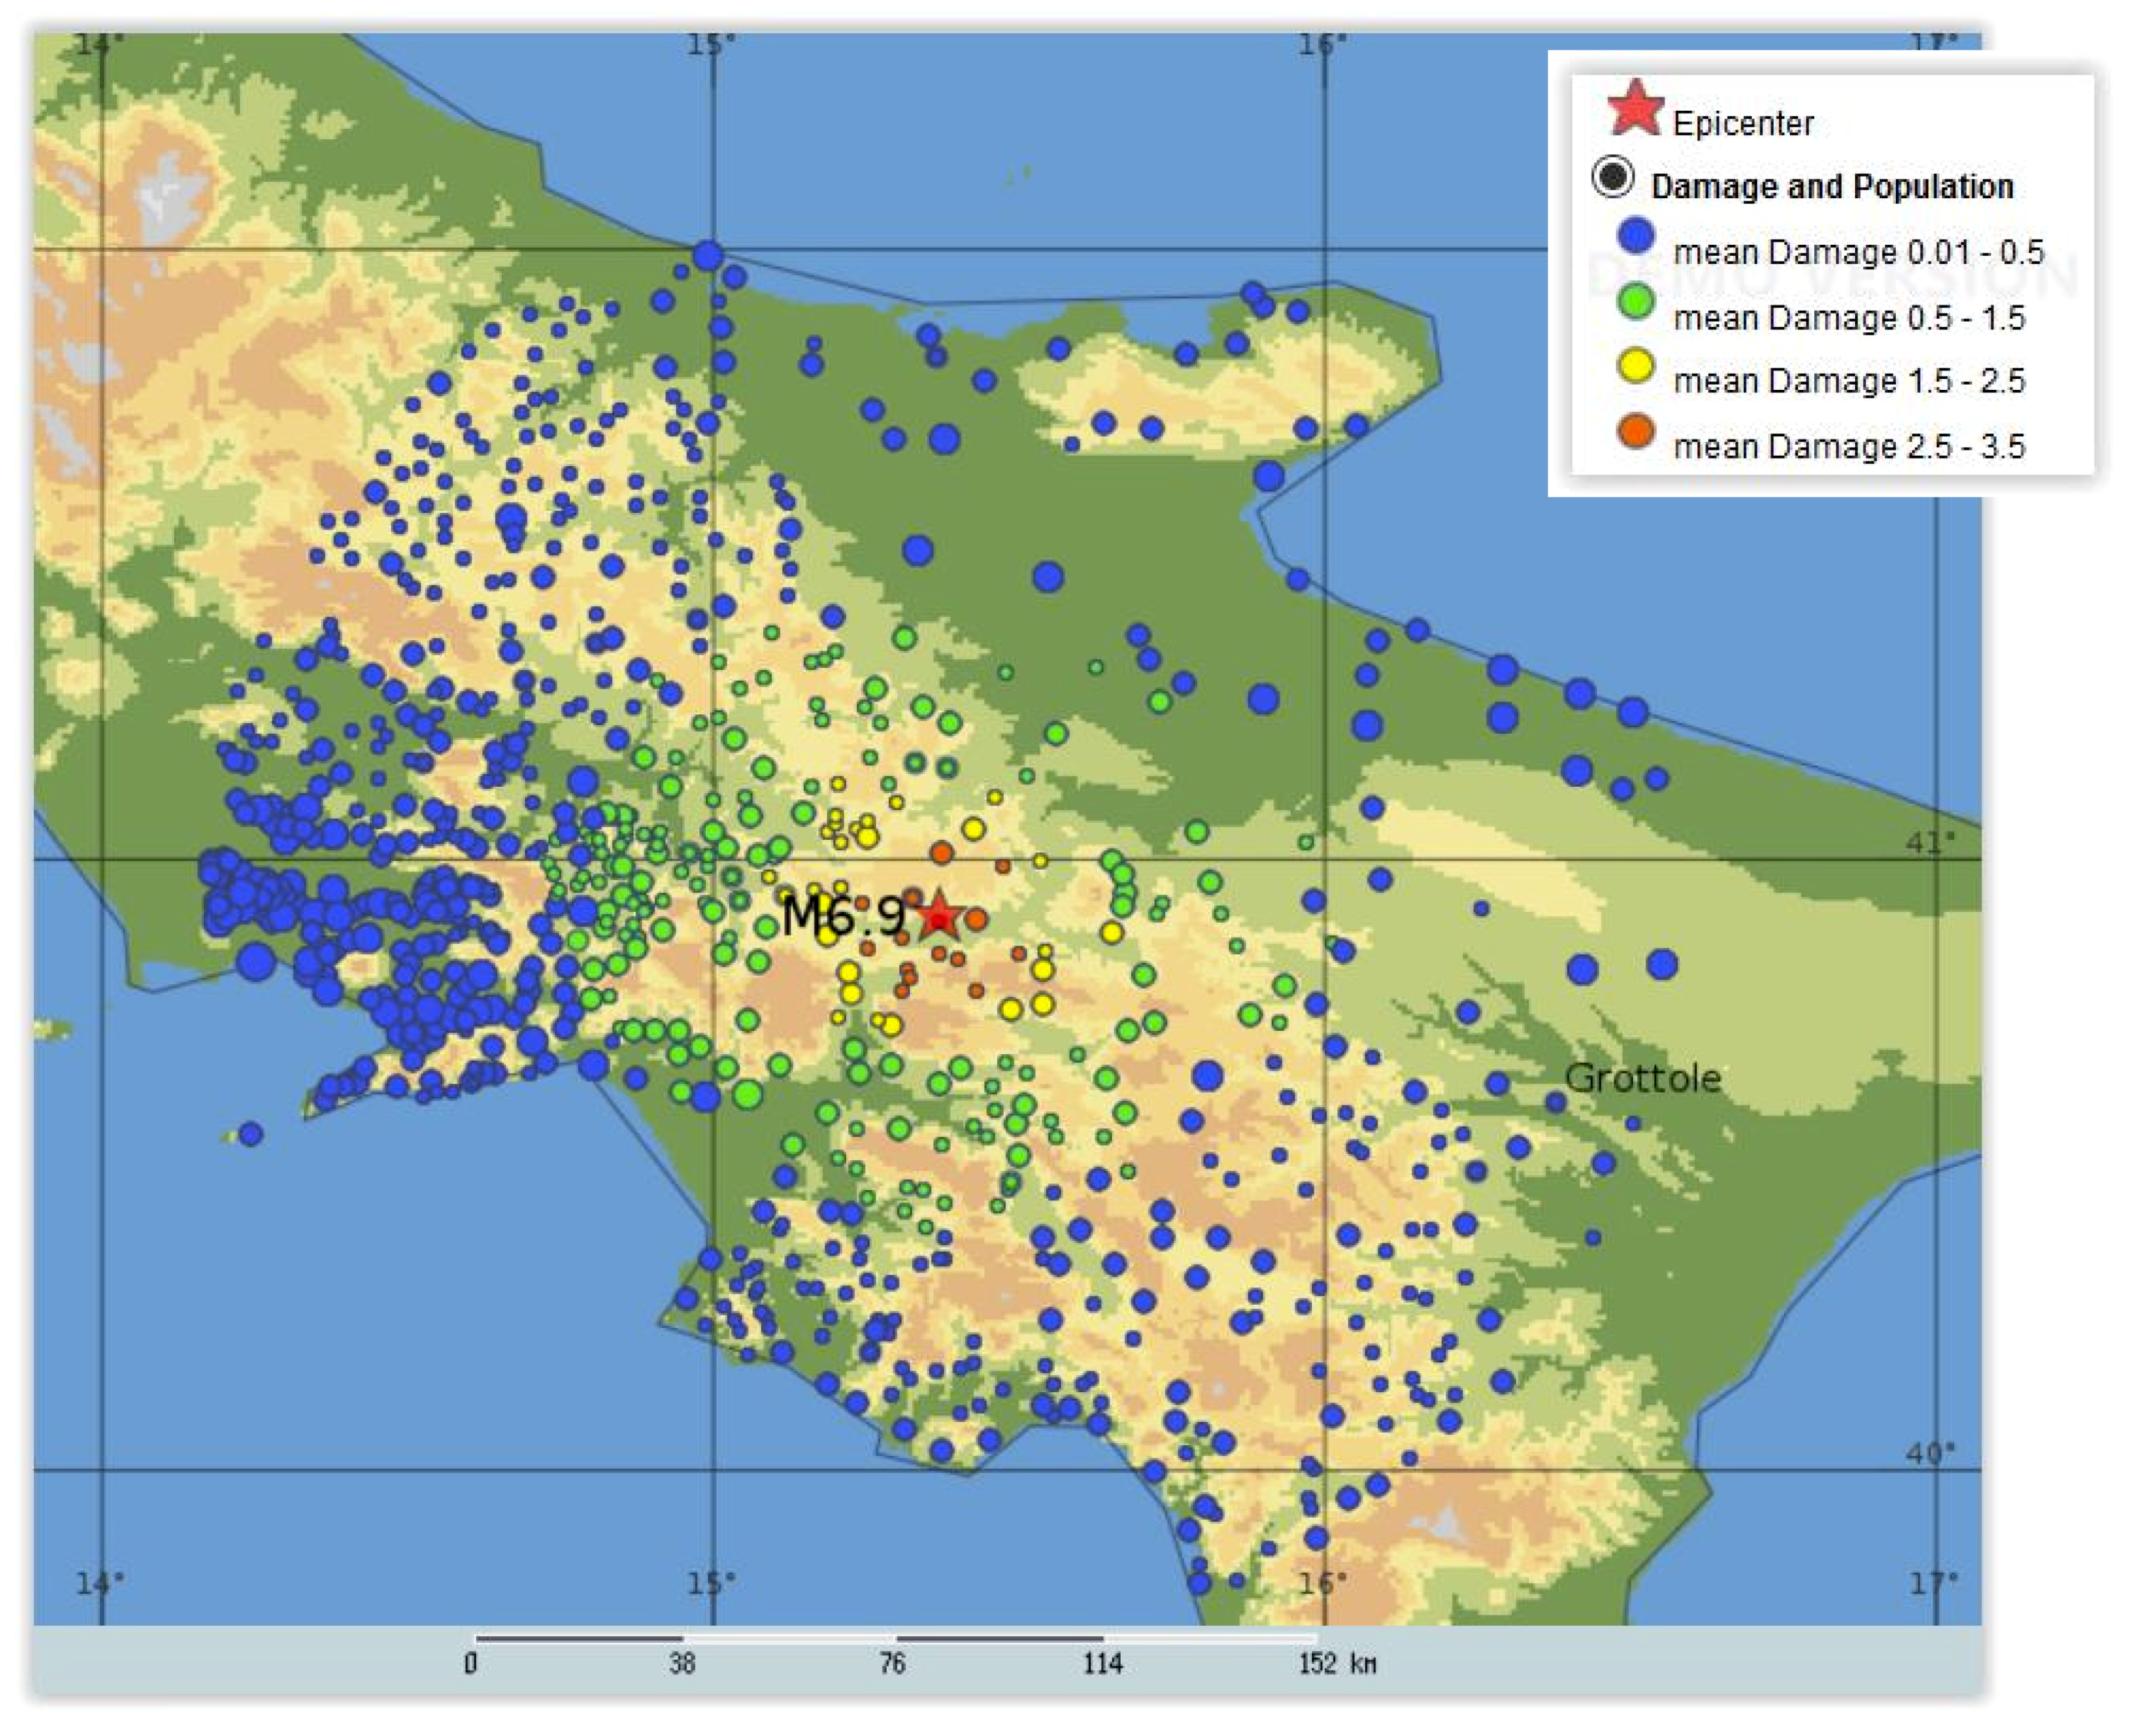
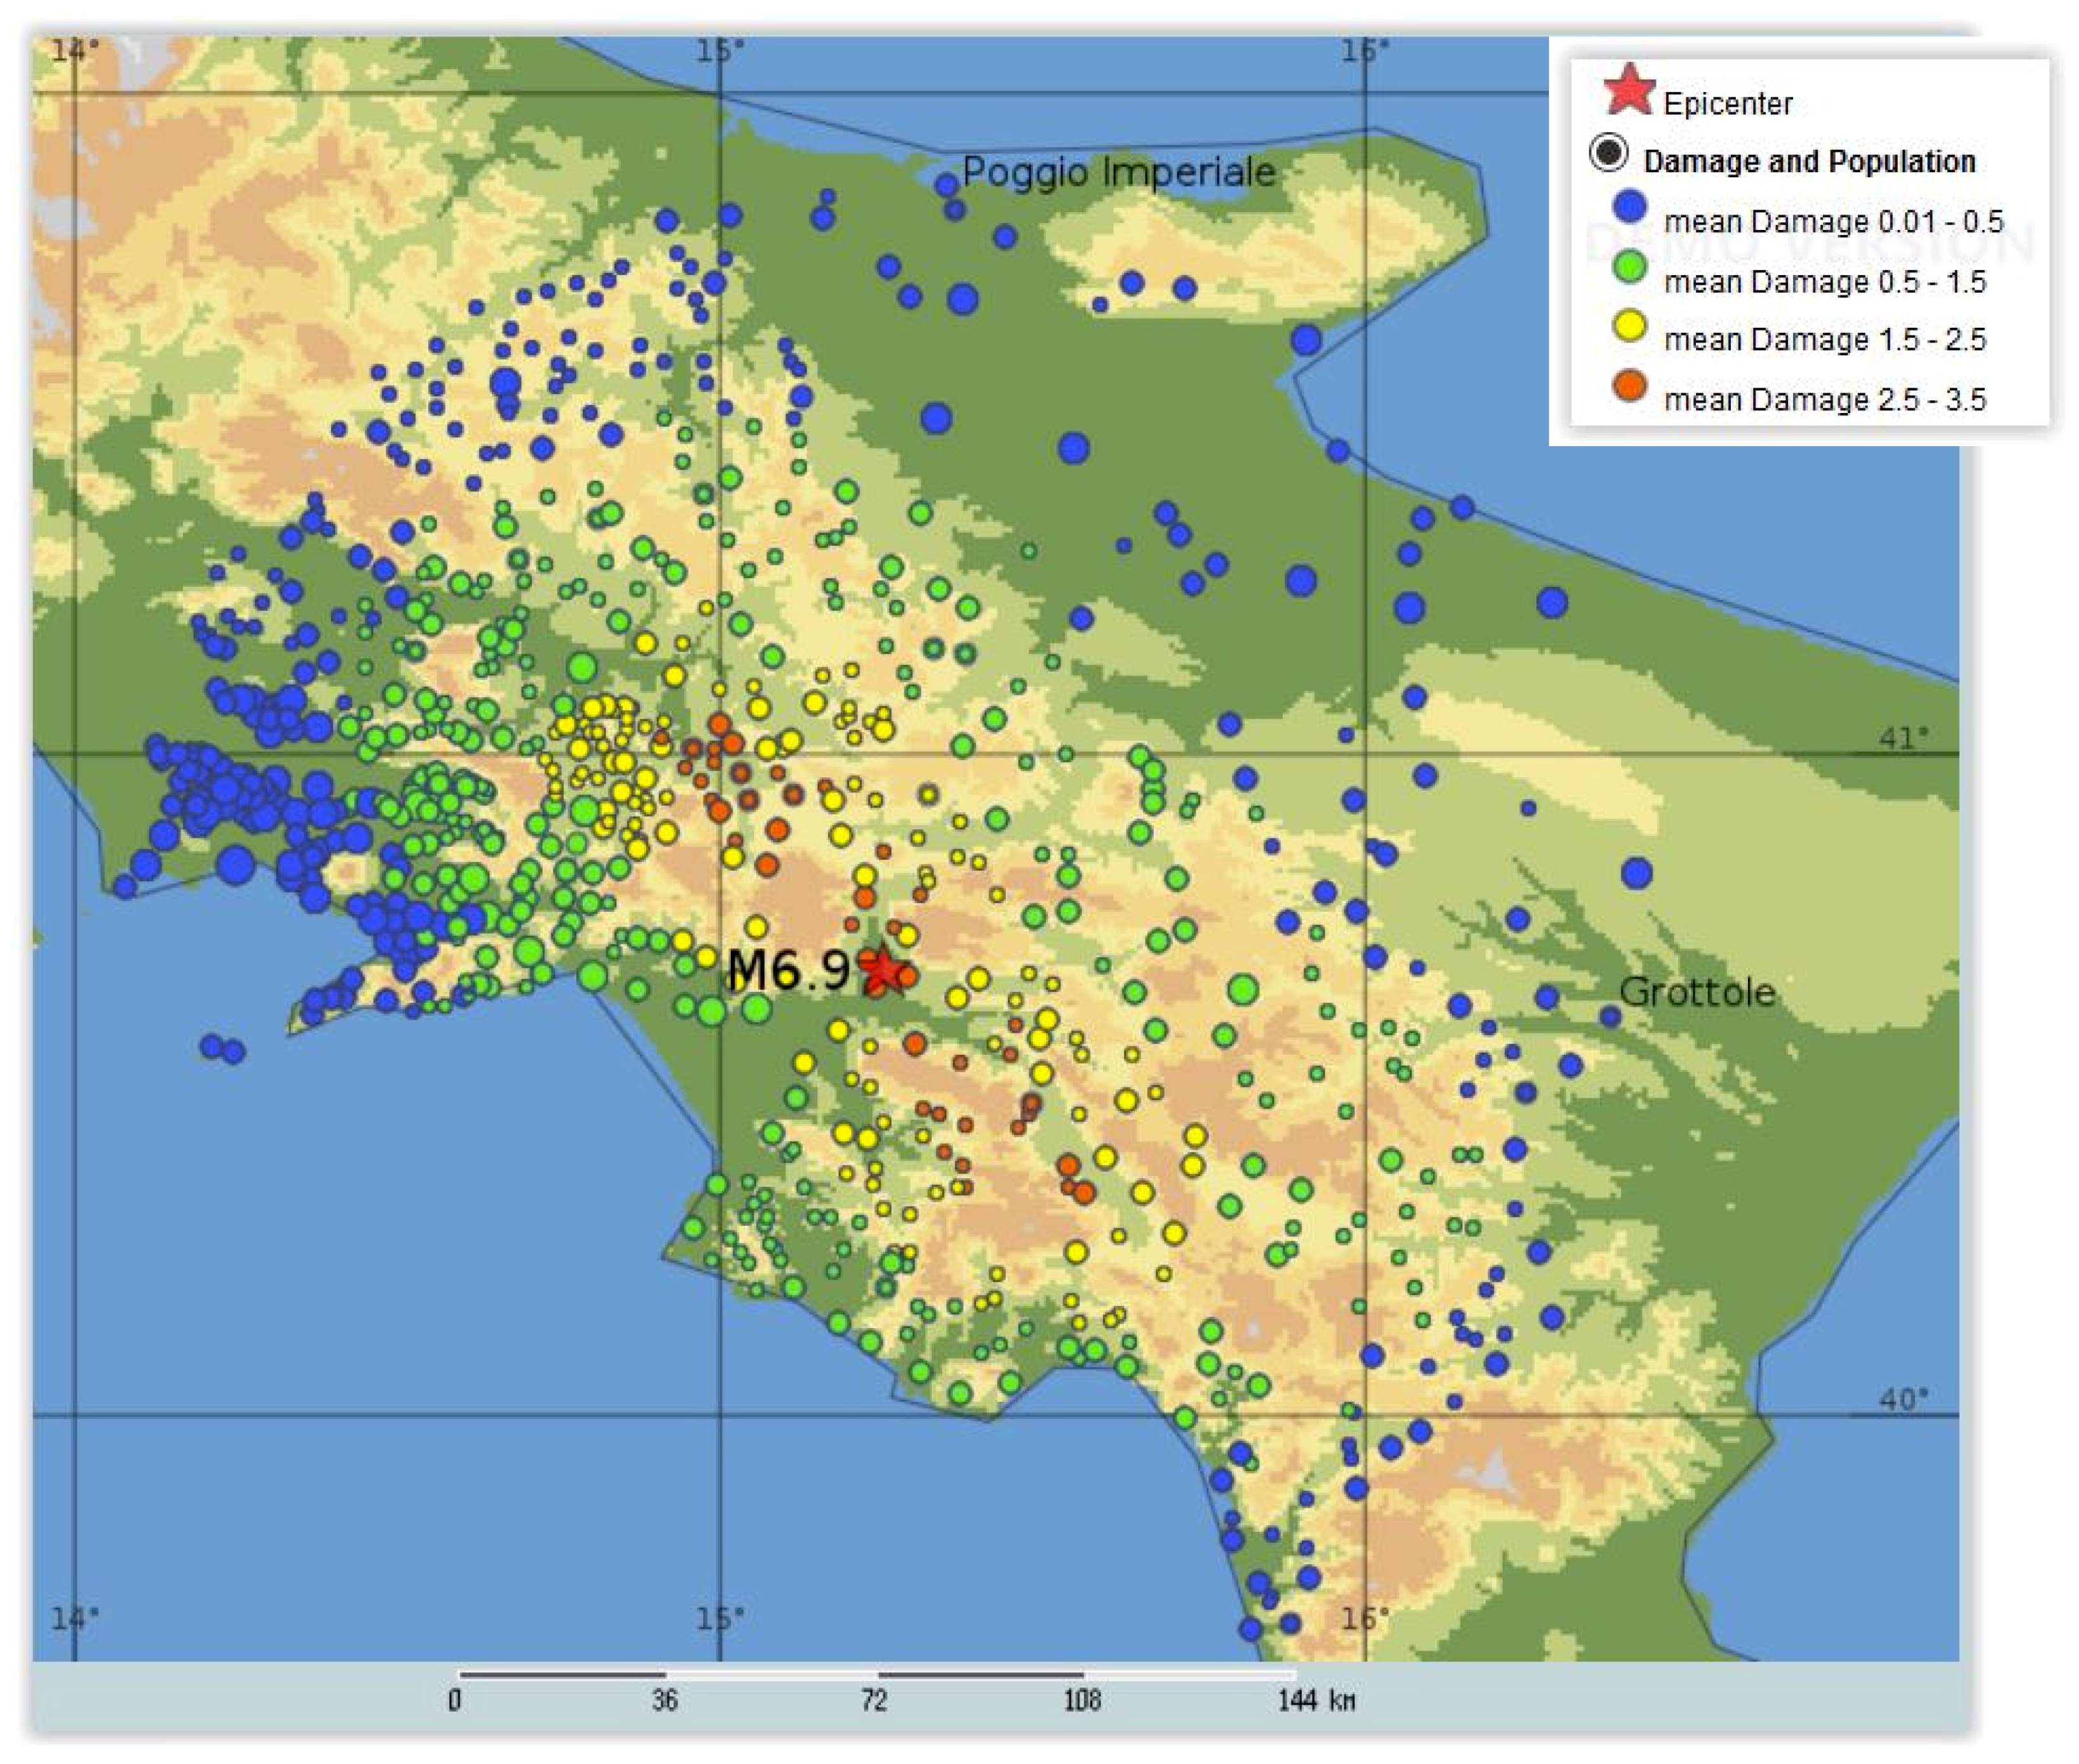
The final estimate of casualties (Figure 3) is based on a line source connecting the endpoints of the surface rupture (row three of Table 3) and the aftershock distribution as published years after the event [13,14,15]. This estimate would not have been available in real time but is given here as the best estimate of the reliability of QLARM alerts for losses in Italian earthquakes.
QLARM also estimates numbers of affected people. We defined strongly affected people as those living in the area of intensity VIII+ because serious damage occurs in this area. The number of people in the area of intensity VI + VII were considered moderately affected because some damage occurs, and some casualties may result. The total number of affected people was defined as the sum of these two categories, that is, all in the area of intensities VI+ (Table 5).
5. Discussion
The loss estimates we have distributed over the last 17 years and presented here are not intended to be highly accurate and applicable to single settlements. They are intended to be order of magnitude assessments of the extent of disasters. Unknowns, such as local soil conditions, tend to average out when many settlements receive strong shaking. Therefore, loss estimates for large earthquakes are more stable than for small ones. Loss estimates for small earthquakes with relatively few fatalities are less reliable because the collapse of a single apartment building or school can kill 100 people, possibly doubling the number of fatalities. For example, on 31 October, 2002, a school collapsed in an M5.9 earthquake in Molise, Italy, killing 27 out of 28 reported fatalities.
The number of fatalities is taken as the best measure of the extent of an earthquake disaster, especially soon after the event. It is a number that is relatively accurate for most earthquakes after months once all the information has been gathered. The number of injured is more uncertain and often not given. Even more nebulous are economic losses.
Comparison of the reported numbers of fatalities with the theoretical ones in Table 3 is a measure of the quality of QLARM performance. It shows the estimates of the number of fatalities at 30 min, 60 min and after a year compared with final reported numbers. The result of the initial point source calculation (distribution with 30 min delay) is already acceptable, given that the maximum fatality estimate is 74% of the ultimate count (row 1 in Table 3). Based on the aftershock locations that would have become known within an additional 30 min, the approximate line source model for the rupture yields a range of numbers of fatalities that encompasses the observed number (row 2 in Table 3). This good agreement is achieved, even though rapidly calculated epicenters can be wrong by about 10 km [4], which means that the preliminary estimate of the rupture line is poorly defined.
The final and best source model of a line is defined by the aftershock distribution and surface ruptures published years later [13,14,15]. This final model gives the best agreement between calculated and observed fatalities, but it does not become available within an hour after the shock. It is, however, a measure of QLARM performance for Italy with final earthquake source parameters known. The three agreements in Table 3 are most encouraging because they indicate that the program QLARM yields correct estimates of fatalities in Italian earthquakes.
The hypothetically calculated number of injured matches the reported numbers surprisingly well (Table 3). In all models (three rows in Table 3), the minimum and maximum estimates of injuries encompass the reported number.
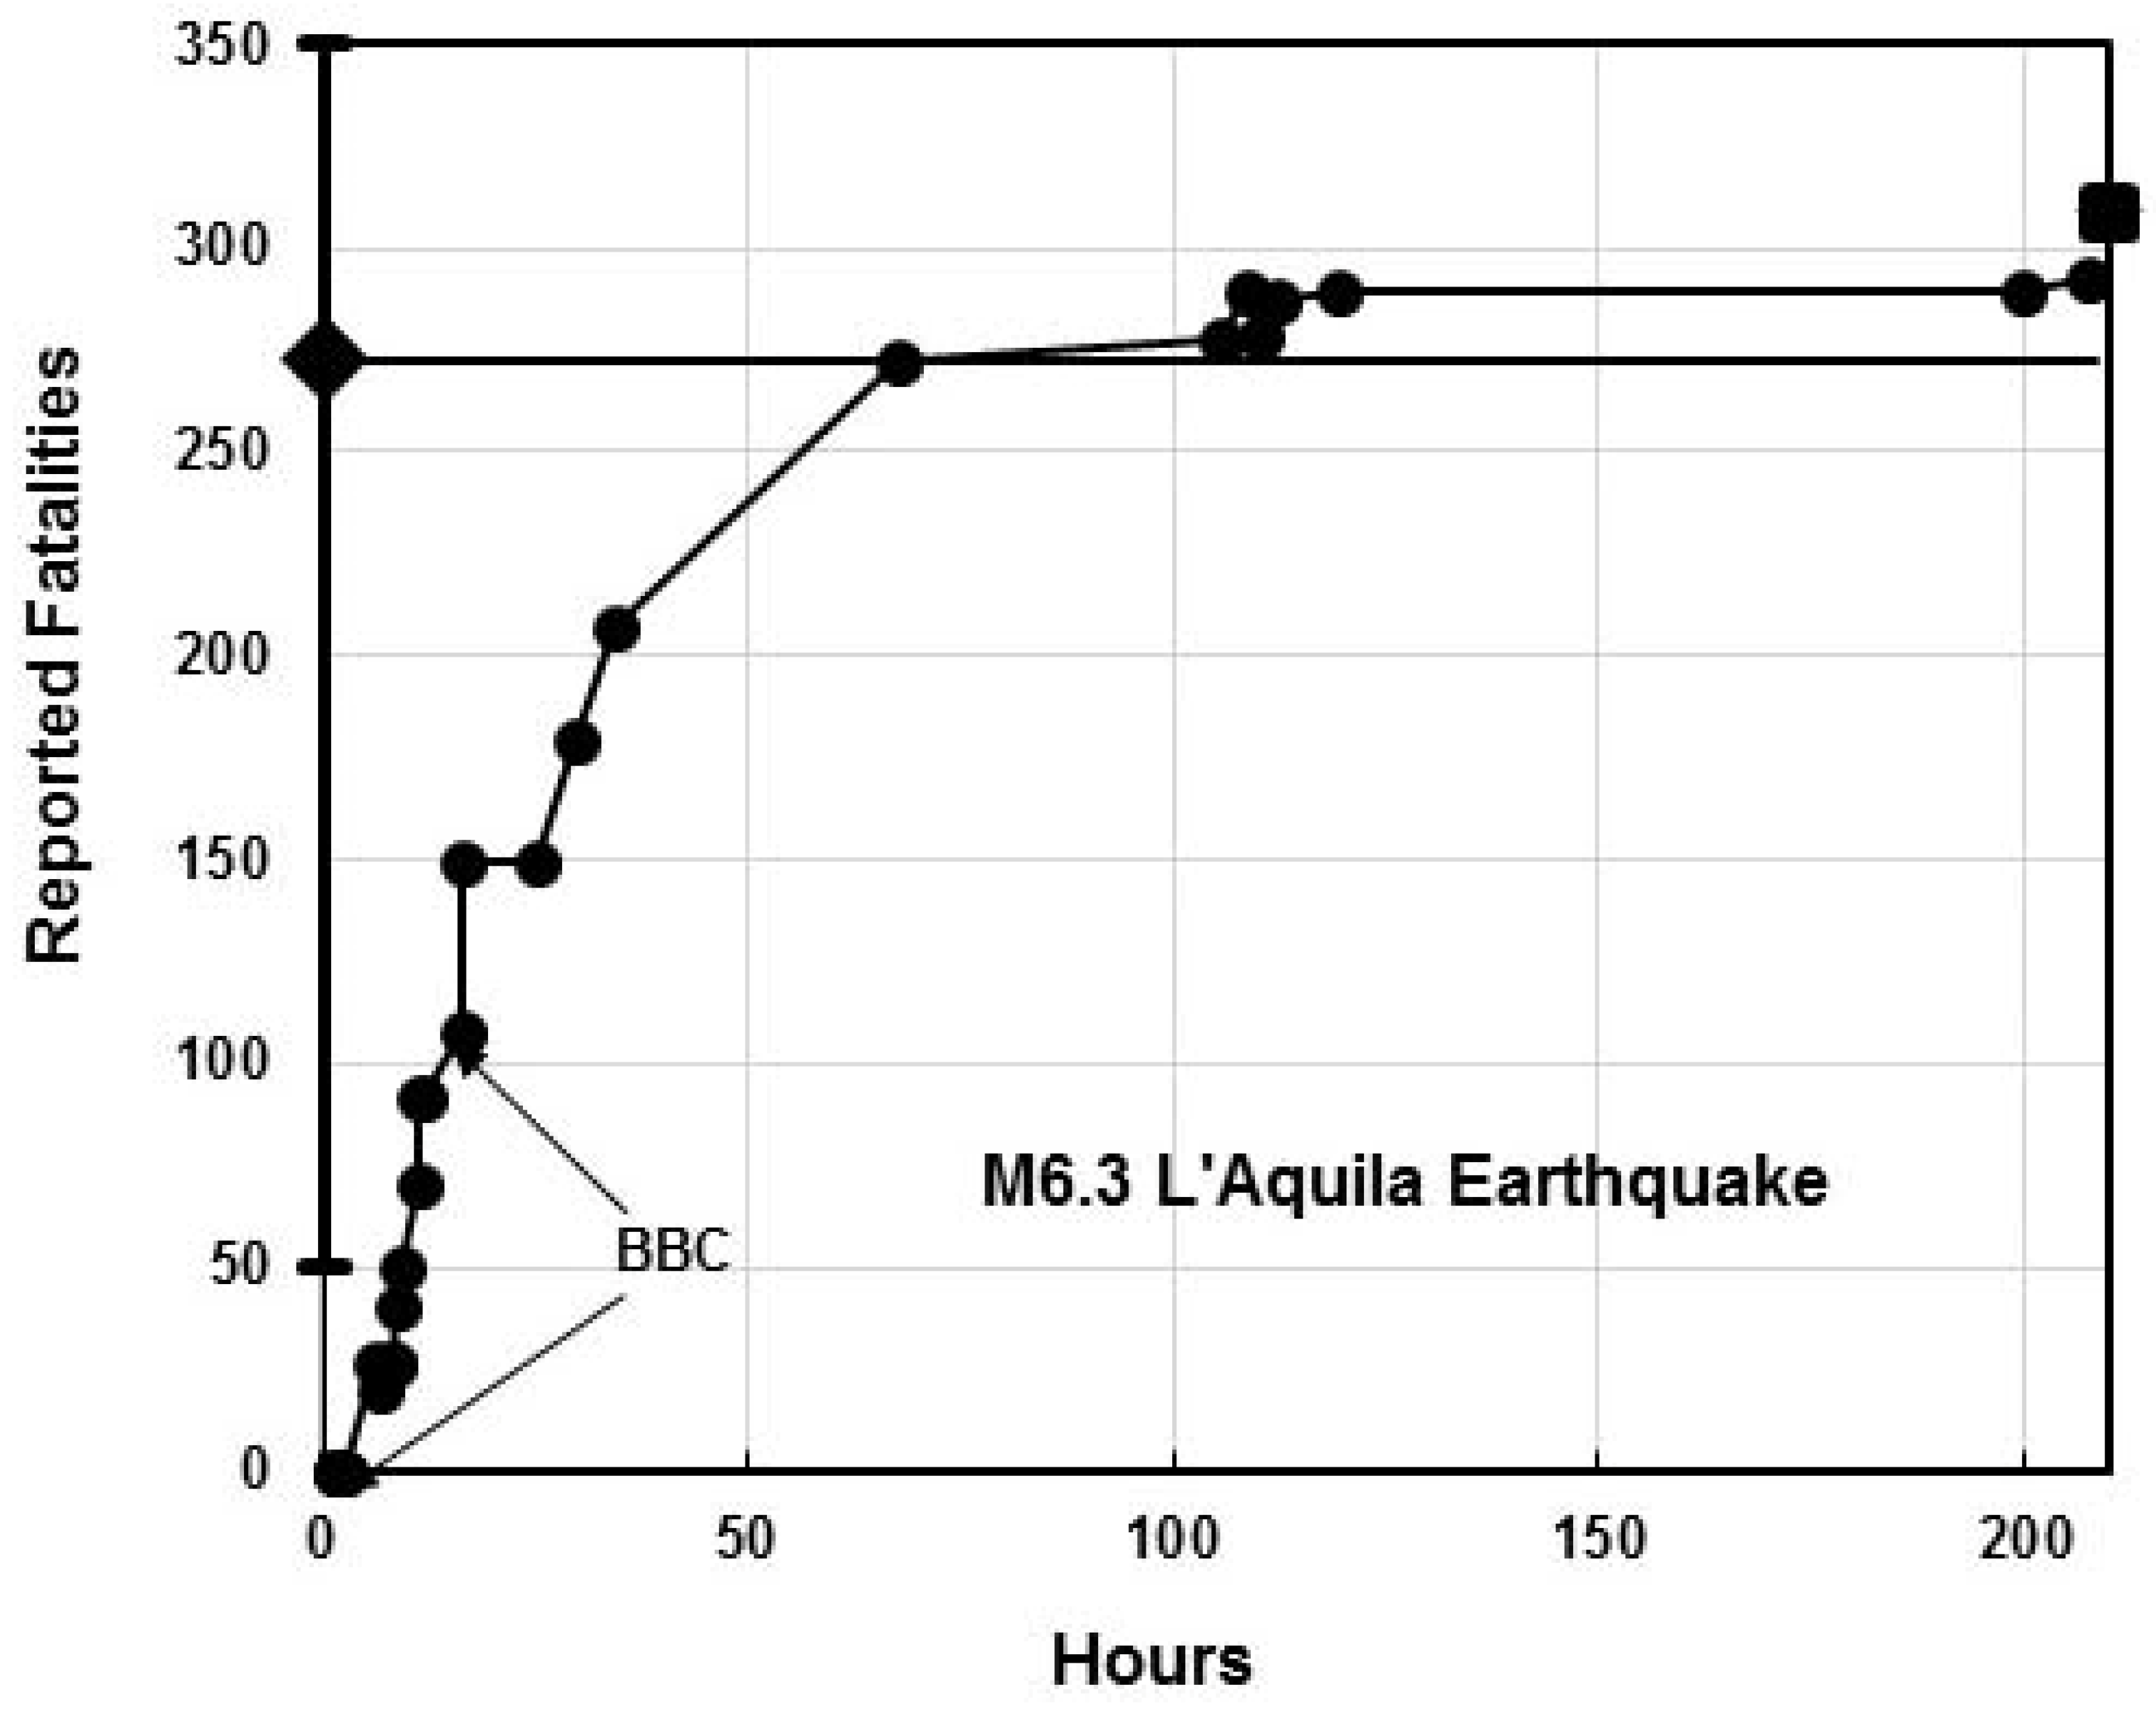
The history of casualty underestimates by news media is not known to us in the case of the 1980 Irpinia earthquake, but we assume it was similar to the cases documented [16]. Figure 4 shows the delay of assessing the size of the disaster in the case of the L’Aquila M6.3 earthquake on 6 April, 2009, compared to the mean value estimates by QLARM 22 min after the earthquake. The slow reporting of correct fatality numbers by media is not surprising because no information is flowing from regions of earthquake disasters for hours or even days. Even in the case of a small earthquake like in L’Aquila, it takes some time for the extent of the losses to become clear (Figure 4). This is more pronounced in larger disasters [16] as in the Wenchuan M8 and Kashmir M7.6 earthquakes that killed more than 87,000 people. In these instances, more than a week passed before the extent of the disaster became apparent. Given that the Irpinia earthquake’s magnitude was intermediary between that of L’Aquila, Wenchuan and Kashmir, one has to assume that in a future Italian earthquake of M7±, there will be several days of fatality underestimates by the news media. The reports by PAGER and QLARM could correct this misunderstanding by highlighting the need of major rescue efforts.
Initial epicenter errors can map into large errors in fatality estimates when the population present is concentrated in one spot [7]. However, in the center of Italy, this is a less severe problem because the population is distributed. The results by three models for the Irpinia source with increasing precision do not yield vastly different fatality estimates (Table 3). Nevertheless, in Italy, loss estimators must pay attention to the possibility of one of the larger metropolitan areas being affected.
Back projections of the rupture line source [17] and estimates of early warning [18] may become available in near-real-time. This will replace the need to rely on aftershocks to estimate the rupture direction and length. After the Irpinia earthquake, relevant aftershocks were recorded within about half an hour, but this is not always the case. Therefore, near-real-time back projections and early warnings will become important to increase the accuracy of fast loss estimates after earthquakes.
The Irpinia source was a complex multiple rupture. It is known that large and great earthquakes tend to be multiple ruptures since this was established for the M9.2 Alaskan earthquake of 1964 [19]. One might therefore ask how strong ground motion should be modelled for multiple ruptures. One answer comes from the strong motion record at right angles and at 43 km distance from the M7.2 Kalapana rupture in 1975. The aftershock area in 1975 was 50 km long and six separate sub-earthquakes were identified [20]. In Harvey, D. 1986 [20], Figure 2 demonstrates that pulses of seismic energy were emitted for more than 60 seconds with intervals as long as 10 seconds of no energy being released. The amplitudes of these pulses were not much larger than those of the M5.9 foreshock (Figure 2 of [20]), which means that, for engineering purposes, the Kalapana seismic radiation consisted of a sequence of pulses corresponding to earthquakes in the range of 6.0 < M < 6.5. The overall rupture, as measured by long period surface waves, however, indicated an M7.2 earthquake.
The complexity of the Irpinia earthquake must have similarly modified the local radiation of high frequency seismic waves. Nevertheless, the sum of the damage and the human losses is estimated correctly using a ground motion prediction equation for an M6.9 earthquake.
Admittedly, the size of the error bars for estimating casualties (minima and maxima in Table 3) are large. This is because minutes after an earthquake there are many poorly known parameters including location, depth, M, direction of rupture, length of rupture, energy propagation effects, local soil conditions, condition of the built environment and occupation rate of buildings. In spite of these numerous uncertainties, casualties and injured in the Irpinia M6.9 and L’Aquila M6.3 earthquakes are estimated correctly.
Satellite images could provide the strongest refinements of estimates of rupture location and extent. An example of this has been shown for the Bam earthquake [21]. In this case, interferometry could have shown that the rupture went straight through the city of Bam, while early estimates placed the epicenter 5 to 10 km west of the city. The difference in fatality estimates in this case was nearly two orders of magnitude. In Italy, the difference would not be that large because the population is more evenly distributed than in the area of Bam, Iran. Nevertheless, rapidly constructed interferograms that would define the crustal deformation due to an earthquake could help greatly in improving rapid loss assessments. For this to be possible, the necessary satellite passes have to become available without delay.
6. Conclusions
Rupture dimensions of disastrous earthquakes in Italy are not very long, only in the range of 20 to 80 km. Therefore, point source estimates of shaking, damage and casualties are reasonably reliable. Definitions of the direction and length of ruptures improve the loss estimates to a level that can be called excellent in the case of the M6.9 Irpinia earthquake. The correct estimates of casualties presented in this paper for Irpinia calculated in 2020 have also been achieved in near-real-time by QLARM for the M6.3 L’Aquila earthquake. This means that QLARM can be expected to correctly estimate casualties after Italian earthquakes within less than an hour. Since two groups, QLARM and PAGER, issue earthquake loss alerts that are similar and reliable, media, government and the general population should base their response to earthquake disasters on these estimates, which become available within less than an hour, instead of relying on the notorious underestimates by media that can last for weeks.
Author Contributions
M.W. has developed the concept and has performed the calculations. P.R. has researched and implemented the data used and made Figure 3. All authors have read and agreed to the published version of the manuscript.
Funding
This research received no external funding
Acknowledgments
Dataset for population and buildings in QLARM for Italia was jointly developed with colleagues Sandra Hurter and Goran Trendafiloski. We thank S. Tolis for information on buildings in Greece and the reviewers for helpful comments, especially reviewer 1.
Conflicts of Interest
The authors declare there exists no conflict of interest.
References
- Wyss, M. Ten years of real-time earthquake loss alerts. In Earthquake Hazard, Risk, and Disasters; Wyss, M., Ed.; Elsevier: Waltham, MA, USA, 2014; pp. 143–165. [Google Scholar]
- Trendafiloski, G.; Wyss, M.; Rosset, P. Loss estimation module in the second generation software QLARM. In Human Casualties in Earthquakes: Progress in Modeling and Mitigation; Spence, R., So, E., Scawthorn, C., Eds.; Springer: Dordrecht, The Netherland, 2011; pp. 381–391. [Google Scholar]
- Rosset, P.; Bonjour, C.; Wyss, M. QLARM, un outil d’aide à la gestion du risque sismique à échelle variable. In Plans communaux de sauvegarde et outils de gestion de crise. In Collection «Géorisques»; Leone, F., Vinet, F., Eds.; Presses Universitaires de la Méditerranée: Montpellier, France, 2015; pp. 91–98. [Google Scholar]
- Rosset, P.; Wyss, M. Seismic Loss Assessment in Algeria Using the Tool QLARM. Civ. Eng. Res. J. 2017, 2, 1–3. [Google Scholar] [CrossRef]
- Wyss, M.; Wu, Z.L. How Many Lives Were Saved by the Evacuation Before the M7.3 Haicheng Earthquake of 1975? Seismol. Res. Lett. 2014, 85, 126–129. [Google Scholar] [CrossRef] [Green Version]
- Wyss, M.; Gupta, S.; Rosset, P. Casualty estimates in repeat Himalayan earthquakes in India. Bull. Seismol. Soc. Am. 2018, 108, 2877–2893. [Google Scholar] [CrossRef]
- Wyss, M.; Elashvili, M.; Jorjiashvili, N.; Javakhishvili, Z. Uncertainties in teleseismic epicenter estimates: Implications for real-time loss estimates. Bull. Seismol. Soc. Am. 2011, 101, 1152–1161. [Google Scholar] [CrossRef]
- Rosset, P.; Tolis, S.; Speiser, M.; Wyss, M. QLARM, un outil au service de la gestion du risque sismique et des crises; Étude de cas au Kirghizstan. Georisque 2020. In Review. [Google Scholar]
- Gruenthal, G. European Macroseismic Scale 1998; Conseil de l’Europe: Luxembourg, 1998. [Google Scholar]
- Wyss, M.; Chamlagain, D. Estimated Casualties in Possible Future Earthquakes South and West of the M7.8 Gorkha earthquake of 2015. Acta Geophys. 2019, 67, 423–429. [Google Scholar] [CrossRef]
- Wells, D.L.; Coppersmith, K.J. New empirical relationships among magnitude, rupture length, rupture width, rupture area and surface displacement. Bull. Seismol. Soc. Am. 1994, 84, 974–1002. [Google Scholar]
- Wyss, M. Estimating expectable maximum magnitude of earthquakes from fault dimensions. Geology 1979, 7, 336–340. [Google Scholar] [CrossRef]
- Deschamps, A.; King, G.C.P. Aftershocks of the Campania-Lucania (Italy) earthquake of 23 November 1980. Bull. Seismol. Soc. Am. 1984, 74, 2483–2517. [Google Scholar]
- Bernard, P.; Zollo, A. The Irpinia (Italy) 1980 earthquake: Detailed analysis of a complex normal faulting. J. Geophys. Res. 1989, 94, 1631–1647. [Google Scholar] [CrossRef]
- Pantosti, D.; Schwartz, D.P.; Valensise, G. Paleoseismology along the 1980 surface rupture of the Irpinia Fault: Implications for Earthquake recurrence in the Southern Apennines, Italy. J. Geophys. Res. 1993, 98, 6561–6577. [Google Scholar] [CrossRef]
- Wyss, M. Report estimated quake death tolls to save lives. Nature 2017, 545, 151–153. [Google Scholar] [CrossRef] [PubMed] [Green Version]
- Wang, D.; Kawakatsu, H.; Zhuang, J.; Mori, J.; Maeda, T.; Tsuruoka, H.; Zhao, X. Automated determination of magnitude and source length of large earthquakes using backprojection and P wave amplitudes. Geophys. Res. Lett. 2017, 44, 5447–5456. [Google Scholar] [CrossRef]
- Li, J.; Böse, M.; Wyss, M.; Wald, D.J.; Hutchison, A.; Clinton, J.F.; Wu, Z.; Jiang, C.; Zhou, S. Estimating rupture dimensions of three major earthquakes in Sichuan, China, for early warning and rapid loss estimates. Bull. Seismol. Soc. Am. 2020, 110, 920–936. [Google Scholar] [CrossRef]
- Wyss, M.; Brune, J.N. The Alaska earthquake of 28 March 1964: A complex multiple rupture. Bull. Seismol. Soc. Am. 1967, 57, 1017–1023. [Google Scholar]
- Harvey, D.; Wyss, M. Comparison of a complex rupture model with the precursor asperities of the 1975 Hawaii Ms = 7.2 earthquake. Pure Appl. Geophys. 1986, 124, 957–973. [Google Scholar] [CrossRef]
- Wyss, M.; Wang, R.; Zschau, J.; Xia, Y. Earthquake loss estimates in near real-time. EOS Trans. Am. Geophys. Union 2006, 87, 477–479. [Google Scholar] [CrossRef]
Figure 1.
Percentage of building types (a) and percentage of the population in them (b) in the three class sizes of settlements used by QLARM for Italy.
Figure 1.
Percentage of building types (a) and percentage of the population in them (b) in the three class sizes of settlements used by QLARM for Italy.


Figure 2.
Map of estimated mean damage in the 1980 Irpinia epicenter area, calculated for a point source with M6.9 located at 40.914° N 15.366° E and occurring at 19:35 local time. Each dot is a settlement with size proportional to population.
Figure 2.
Map of estimated mean damage in the 1980 Irpinia epicenter area, calculated for a point source with M6.9 located at 40.914° N 15.366° E and occurring at 19:35 local time. Each dot is a settlement with size proportional to population.

Figure 3.
Map of estimated mean damage in the 1980 Irpinia epicenter area, calculated for a line source with M6.9, end points at 41° N/15° E and 40.355° N/15.515° E with occurrence at 19:35 local time. Each dot marks a settlement. The distribution of strong damage is seen better when the rupture is modelled as a line rather than a point (Figure 2).

Figure 4.
Reports of fatalities as a function of time after the L’Aquila M6.3 earthquake. The average estimate by QLARM was correct and given after 22 min.
Figure 4.
Reports of fatalities as a function of time after the L’Aquila M6.3 earthquake. The average estimate by QLARM was correct and given after 22 min.


Table 1.
Percentage of building types and percentage of the population in buildings in the three class sizes of settlements used by QLARM for Italy.
Table 1.
Percentage of building types and percentage of the population in buildings in the three class sizes of settlements used by QLARM for Italy.
| Cities Above 20,000 Inhabitants | Towns | Villages Below 2000 Inhabitants | ||||||
|---|---|---|---|---|---|---|---|---|
| Type | Buildings (%) | People (%) | Type | Buildings (%) | People (%) | Type | Buildings (%) | People (%) |
| A | 0 | 0 | A | 13 | 11 | A | 27 | 22 |
| B | 70 | 27 | B | 69 | 41 | B | 68 | 55 |
| C | 27 | 63 | C | 16 | 43 | C | 5 | 23 |
| D | 3 | 10 | D | 2 | 5 | D | 0 | 0 |
| E | 0 | 0 | E | 0 | 0 | E | 0 | 0 |
Table 2.
Copy of the estimate of fatalities and injuries distributed by email 22 min after the M6.3 earthquake of L’Aquila in 2009 to interested parties.
Table 2.
Copy of the estimate of fatalities and injuries distributed by email 22 min after the M6.3 earthquake of L’Aquila in 2009 to interested parties.
| From | [email protected] |
| To | [email protected] |
| Date | Monday, April 06, 2009 03:54 am |
| Subject | Earthquake in Italy |
| The Following Earthquake has been Reported: Date: 2009/04/04 01:31:57.6 Region: Italy Magnitude: M 6.3 Latitude: 42.42 N Longitude: 13.39 E Depth (km): 5.0 Source: GHZ Injured Exp. min/max: 100/1300 Fatalities Exp. min/max: 50/500 L’Aquila is the nearest town at 5 km distance |
Table 3.
Casualties calculated for a hypothetical repeat of the M6.9 Irpinia earthquake. The results are presented for three source models that would have become available with increasing accuracy as a function of time and would have been distributed with the delays given in the first column. The calculated casualties are good estimates of the reported ones and become better with the assumed increase of information.
| Delay (Minute) | Longitude (Degree) | Latitude (Degree) | Source Model | Depth (km) | Magnitude | Fatalities (Calculated) | Fatalities (Reported) | Injured (Calculated) | Injured (Reported) | ||
|---|---|---|---|---|---|---|---|---|---|---|---|
| Min. | Max. | Min. | Max. | ||||||||
| 30 | 15.37 | 40.91 | Point | 10 | 6.9 | 300 | 1840 | 2483 | 1480 | 9’064 | 7700 |
| 60 | 15.28 | 41.11 | Line end N | 15 | 6.9 | 410 | 3120 | 2483 | 2110 | 14’790 | 7700 |
| 15.61 | 40.67 | Line end S | |||||||||
| Ultimate | 15.00 | 41.00 | Line end N | 15 | 6.9 | 780 | 5840 | 2483 | 3860 | 26’660 | 7700 |
| 15.515 | 40.355 | Line end S | |||||||||
Table 4.
Parameters listed by the USGS for the Irpinia main shock and the first three aftershocks that occurred within 32 min of the main shock (delay in third to last column). The distance of each aftershock from the initial rupture point (second to last column) allows an early estimate of the rupture length (last column) as the separation of the most distant aftershocks from each other.
| Year | Month | Day | Hour | Minute | Second. | Latitude | Longitude | Depth | Magnitude | Time Difference | Distance | Length Estimate |
|---|---|---|---|---|---|---|---|---|---|---|---|---|
| 1980 | 11 | 23 | 18 | 34 | 53 | 40.91 | 15.37 | 10 | 6.9 | (Min.) | (km) | (km) |
| 1980 | 11 | 23 | 18 | 52 | 6.3 | 41.11 | 15.28 | 10 | 4.6 | 17 | 24 | |
| 1980 | 11 | 23 | 19 | 4 | 2.7 | 40.67 | 15.61 | 10 | 4.5 | 29 | 37 | 61 |
| 1980 | 11 | 23 | 19 | 6 | 45 | 40.72 | 15.59 | 10 | 4.4 | 32 | 32 |
Table 5.
Estimates of numbers of affected people for the three types of earthquake source models of Table 3, and in three categories of shaking (intensities VI + VII, VIII + IX, and VI+).
Table 5.
Estimates of numbers of affected people for the three types of earthquake source models of Table 3, and in three categories of shaking (intensities VI + VII, VIII + IX, and VI+).
| Delay | Source Model | Magnitude | Intensities VI + VII | Intensities VIII + IX | Total Affected VI+ |
|---|---|---|---|---|---|
| Min. | Million | Million | Million | ||
| 30 | Point | 7 | 2.2 | 0.1 | 2.3 |
| 60 | Approximate line | 7 | 2.4 | 0.3 | 2.7 |
| Ultimate | Final line | 7 | 5.4 | 0.6 | 6.0 |
© 2020 by the authors. Licensee MDPI, Basel, Switzerland. This article is an open access article distributed under the terms and conditions of the Creative Commons Attribution (CC BY) license (http://creativecommons.org/licenses/by/4.0/).
Share and Cite
MDPI and ACS Style
Wyss, M.; Rosset, P. Near-Real-Time Loss Estimates for Future Italian Earthquakes Based on the M6.9 Irpinia Example. Geosciences 2020, 10, 165. https://0-doi-org.brum.beds.ac.uk/10.3390/geosciences10050165
AMA Style
Wyss M, Rosset P. Near-Real-Time Loss Estimates for Future Italian Earthquakes Based on the M6.9 Irpinia Example. Geosciences. 2020; 10(5):165. https://0-doi-org.brum.beds.ac.uk/10.3390/geosciences10050165
Chicago/Turabian StyleWyss, Max, and Philippe Rosset. 2020. "Near-Real-Time Loss Estimates for Future Italian Earthquakes Based on the M6.9 Irpinia Example" Geosciences 10, no. 5: 165. https://0-doi-org.brum.beds.ac.uk/10.3390/geosciences10050165
Note that from the first issue of 2016, this journal uses article numbers instead of page numbers. See further details here.