Glacier–Permafrost Interaction at a Thrust Moraine Complex in the Glacier Forefield Muragl, Swiss Alps

Institute for Geography and Geology, University of Wuerzburg, 97074 Wuerzburg, Germany
*
Author to whom correspondence should be addressed.
Geosciences 2020, 10(6), 205; https://0-doi-org.brum.beds.ac.uk/10.3390/geosciences10060205
Submission received: 15 April 2020
/
Revised: 15 May 2020
/
Accepted: 20 May 2020
/
Published: 27 May 2020
(This article belongs to the Special Issue Permafrost and Glaciers: Perspectives for the Earth and Planetary Sciences)
Abstract
:The internal structures of a moraine complex mostly provide information about the manner in which they develop and thus they can transmit details about several processes long after they have taken place. While the occurrence of glacier–permafrost interactions during the formation of large thrust moraine complexes at polar and subpolar glaciers as well as at marginal positions of former ice sheets has been well understood, their role in the formation of moraines on comparatively small alpine glaciers is still very poorly investigated. Therefore, the question arises as to whether evidence of former glacier–permafrost interactions can still be found in glacier forefields of small alpine glaciers and to what extent these differ from the processes in finer materials at larger polar or subpolar glaciers. To investigate this, electrical resistivity tomography (ERT) and ground-penetrating radar (GPR) surveys were carried out in the area of a presumed alpine thrust moraine complex in order to investigate internal moraine structures. The ERT data confirmed the presence of a massive ice core within the central and proximal parts of the moraine complex. Using GPR, linear internal structures were detected, which were interpreted as internal shear planes due to their extent and orientation. These shear planes lead to the assumption that the moraine complex is of glaciotectonic origin. Based on the detected internal structures and the high electrical resistivity values, it must also be assumed that the massive ice core is of sedimentary or polygenetic origin. The combined approach of the two methods enabled the authors of this study to detect different internal structures and to deduce a conceptual model of the thrust moraine formation.
1. Introduction
Glacier–permafrost relationships were initially studied on polar and subpolar glaciers more than 50 years ago. Mathews and Mackay [1] investigated the deformation of proglacial unconsolidated sediments in periglacial environments. In the context of thrust moraine evolution at polar and subpolar glaciers, Kälin [2] provided evidence on glacier–permafrost interaction for the first time. Further important studies in this context dealt with the deformation of frozen sediments [3] or the interaction between frozen proglacial sediments and the subglacial hydraulic system [4,5]. Hambrey and Huddart [6] and Bennett [7] presented multi-processual models of moraine genesis through glacier–permafrost interaction. In these studies, the properties of the glacial stress field, glacial flow patterns, the sub- and proglacial hydrological system as well as the properties of the proglacial sediments were also considered.
Thrust moraines, also known as push moraines, are geomorphological features, which are result of the interaction between advancing cold or polythermal glaciers and proglacial and subglacial permafrost. Permafrost in ice-marginal sediments leads to a transmission of glacial stress, which can result in a glaciotectonic deformation of proglacial sediments. Glaciotectonic shear processes enable a (large-scale) thrusting of the proglacial area and lead to the formation of multi-ridge thrust moraine complexes. A review of glacier–permafrost interactions also highlighting the important and dominant factors on thrust moraine formation was given by Waller et al. [8].
The investigation of glacier–permafrost interactions in alpine environments started much later than in polar regions. For the first time, Haeberli [9] expressed the assumption of the occurrence of polythermal glaciers in the European Alps and questioned the previous opinion that only temperate alpine glaciers were present. Although initial geophysical studies were subsequently carried out to investigate interactions and relationships between glaciers and permafrost [10], alpine permafrost research was focused more on the study of rock glaciers at that time [11,12,13]. The investigation of the distribution and development of permafrost in recently deglaciated glacier forefields in the European Alps started from the end of the last millennium [14,15,16,17,18,19]. For most of the studies mentioned above, geophysical measurements were performed. The use of geophysical methods to investigate the actual state of ground conditions is common in the field of permafrost research because of the contrasts between frozen and unfrozen sediments in several geophysical parameters. In particular, the use of one-dimensional geoelectrical methods in high alpine permafrost environments was established to investigate permafrost distribution in the European Alps more than 20 years ago [20]. Since the turn of the millennium, the two-dimensional approach—electrical resistivity tomography (ERT) or electrical resistivity imaging (ERI)—has been predominantly performed. This innovation enabled a faster and more detailed investigation of larger areas, which was important progress in the often heterogeneous alpine periglacial environments. In recent years, three-dimensional measurements have also been performed within the field of mountain permafrost research [21,22,23], but they are currently not very common because of the large effort required in comparison to the small spatial coverage. Nevertheless, the gain in knowledge using three-dimensional measurements is significant.
The use of ground-penetrating radar (GPR) in permafrost research also has a long tradition. The first tests of the applicability of GPR in the periglacial environments of high mountain regions were done by King et al. [24], but the method established itself solidly much later [25,26,27]. Due to its advantages in the detection of sedimentological interfaces, the method finally prevailed and is now mainly used in periglacial environments to study internal structures of moraines and rock glaciers [28,29,30].
The investigation of permafrost and its development in the glacier forefield Muragl has a tradition of more than 20 years. In 1999, Kneisel [15] had already detected the coexistence of different types of ground ice and inferred different phases of permafrost evolution within the glacier forefield. These assumptions were based on geophysical differences and different thermal regimes and were supported by geomorphological evidence of a former polythermal regime of the Muragl glacier. These studies also suggested the presence of a massive ice core within the moraine complex. Based on the electrical resistivity value, it must be assumed that this massive ice core consists of sedimentary ice, according to the definition of Shumskii [31]. Whether this massive ice core could be indicative of a glacier–permafrost interaction could not be proven beyond reasonable doubt, because sedimentological boundaries or internal shear planes were not detectable by resistivity surveys alone [15,16]. Hence, the objective of this study was to investigate the internal structures of the moraine complex with special emphasis on ice content and origin as well as sedimentological boundaries and internal shear planes in order to deduce process dynamics during moraine formation. In contrast to glacier forefields of large polar or subpolar glaciers, the sediments in small alpine glacier forefields, such as the glacier forefield Muragl, are dominated by coarse-grained materials like stones and boulders because of the short transport routes in alpine cirques. The processes during moraine formation in such coarse-grained material may differ from that in fine-grained sediments of larger forefields. Therefore, new findings from further geophysical investigations are presented. In addition to the ERT data already published in the past, further ERT profiles as well as GPR profiles were performed in the area of the thrust moraine complex. The use of GPR should enable a more detailed investigation of sedimentological boundaries and internal shear planes [28,32]. These findings offered better knowledge of the thrust moraine formation, which allowed us to generate a conceptual model of the moraine genesis in the glacier forefield Muragl.
2. Study Site
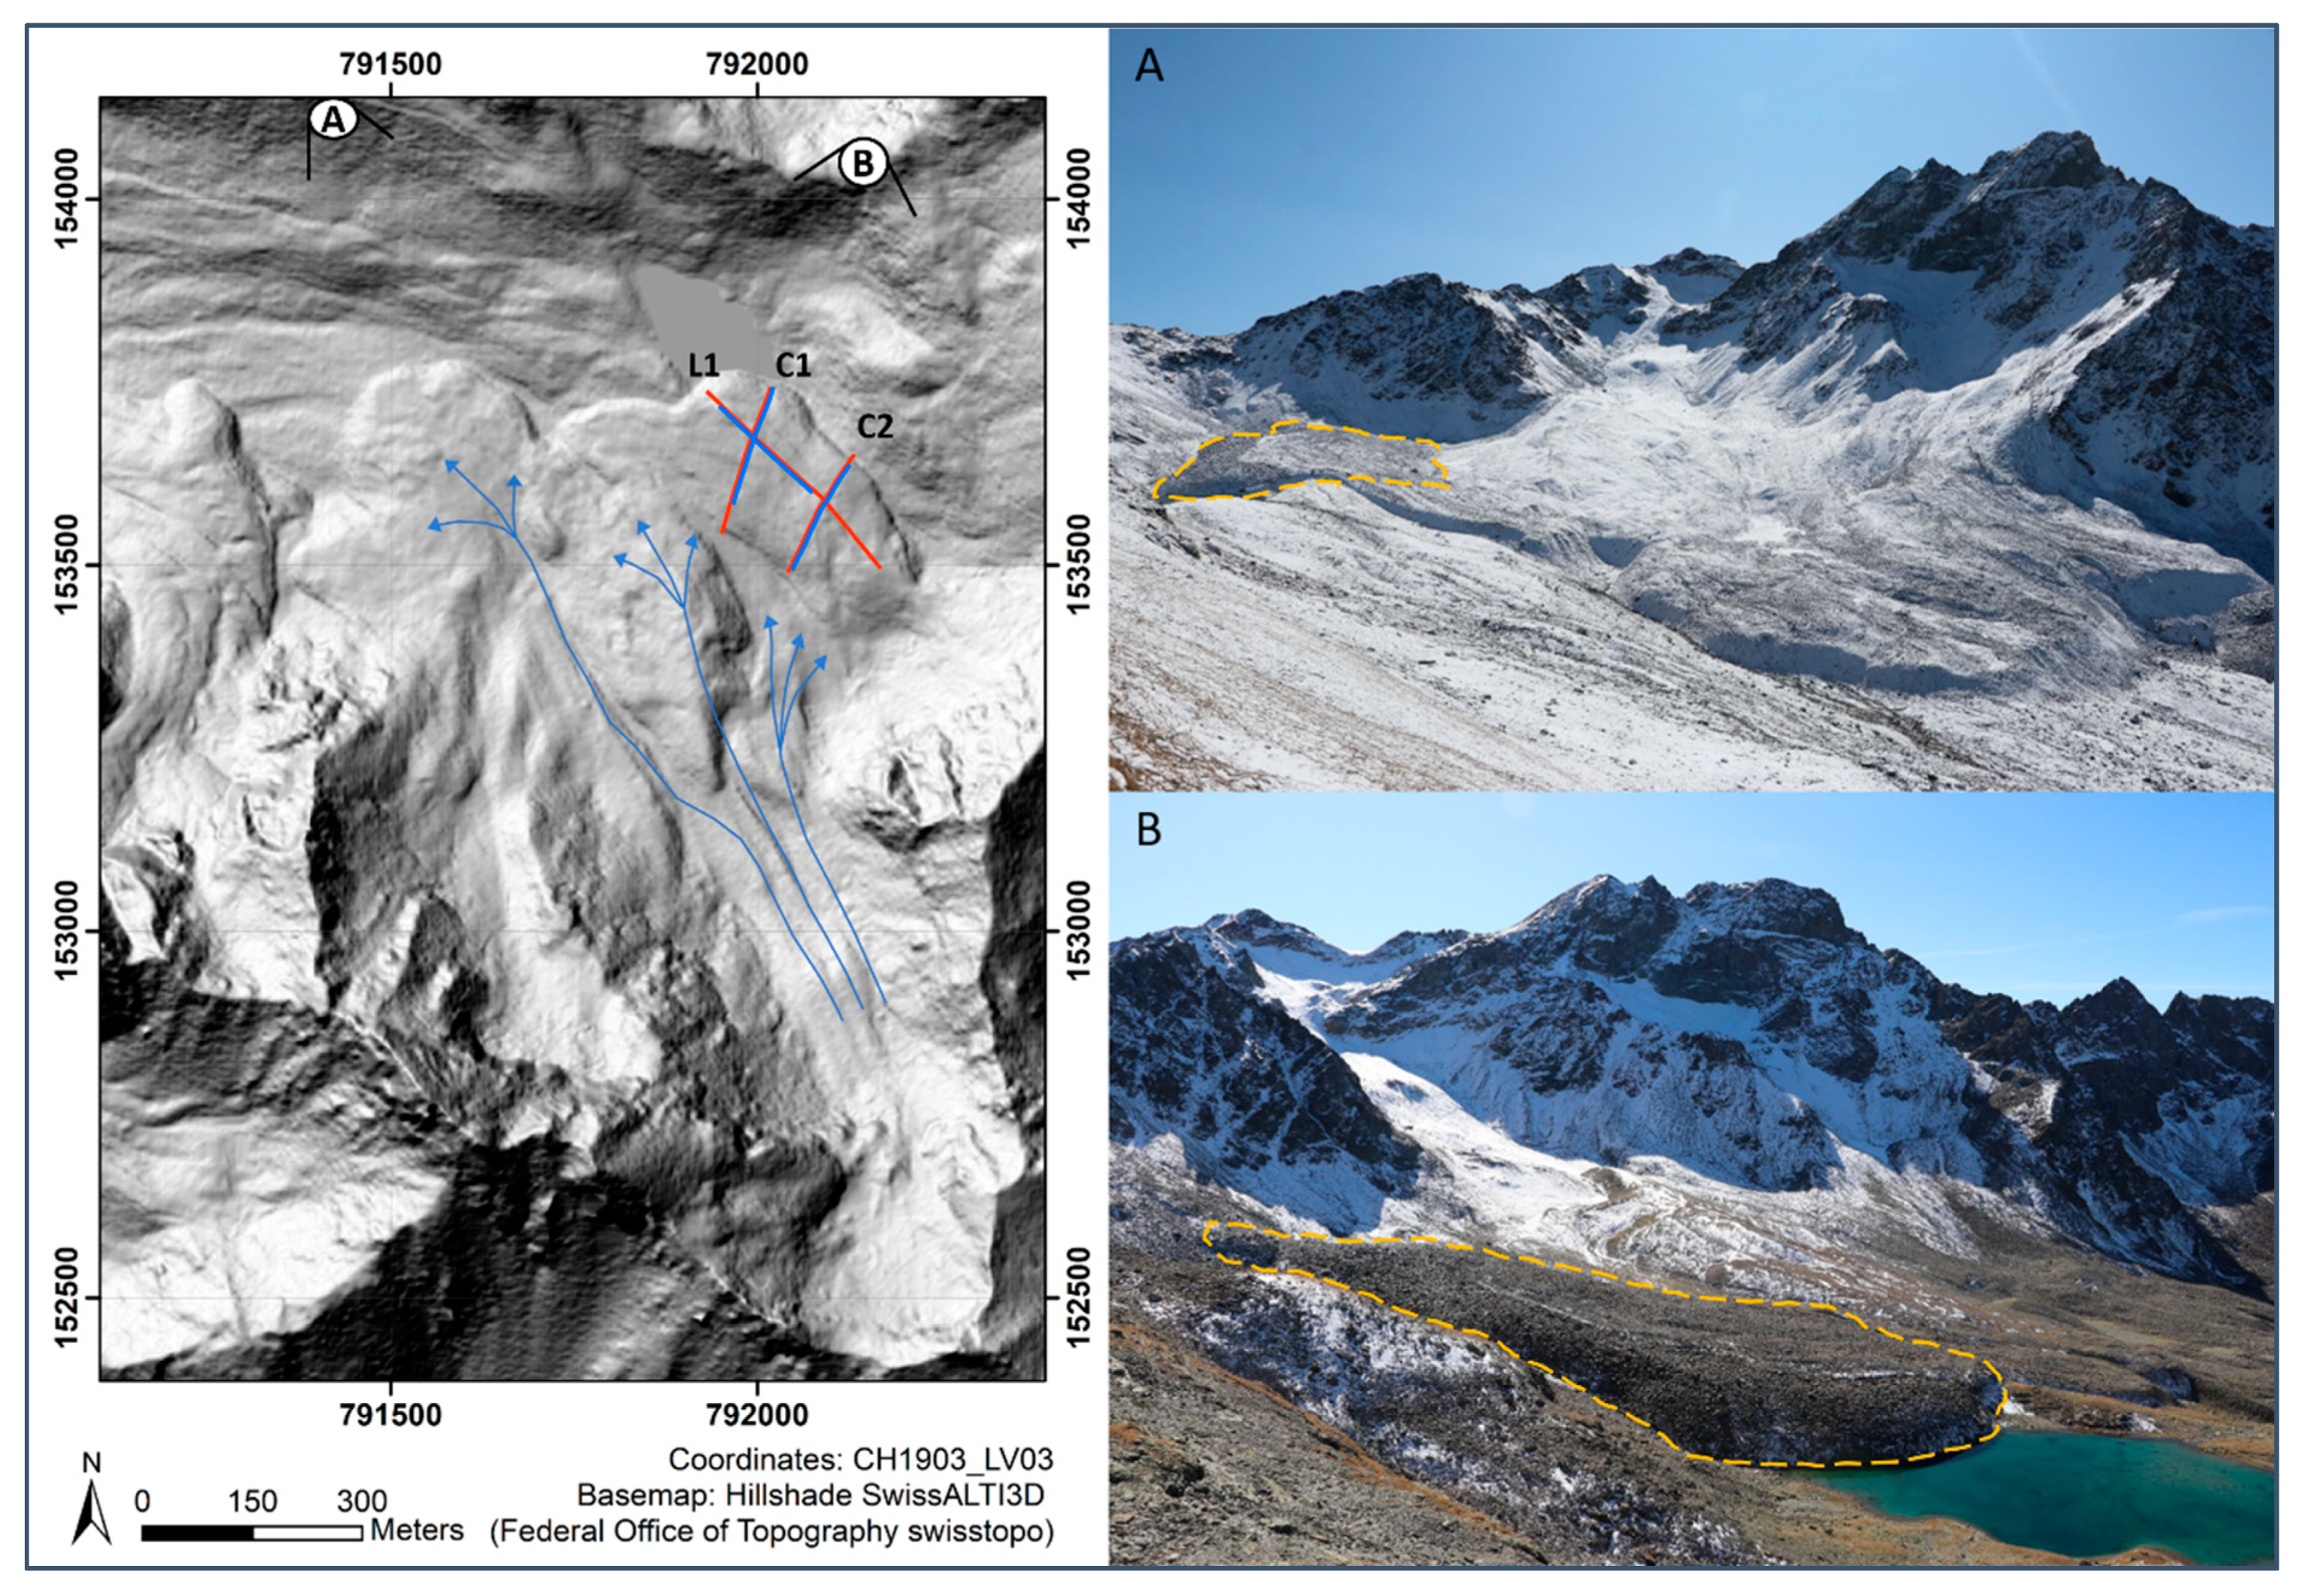
The glacier forefield Muragl (46°30′15″ N, 9°56′20″ E) (Figure 1) is located between 2650 m and 2980 m a.s.l. in the north slope of Piz Muragl (Upper Engadine, Swiss Alps). The remnant of the former Muragl glacier extends currently between 2980 m and 3080 m a.s.l. and covers an area of only approximately 0.038 km2 with a maximum ice thickness of 16 m as deduced by GPR soundings [33].
The climate at this site is characterized by mean annual air temperatures between −2 and −4 °C and low precipitation (1000–1200 mm/y), which can be inferred from two nearby climate stations (Piz Corvatsch, 3302 m a.s.l., −5.4 °C, 1295 mm and Samedan 1709 m a.s.l., 2.0 °C, 713 mm) [34,35].
The geomorphology of the glacier forefield (Figure 2) is dominated by the raised sediment bed (thickness of several meters to decameters) of the former Muragl glacier in the central and northwestern part and the well-developed thrust moraine complex in the northeastern part (highlighted in Figure 1).
The elevated sediment bed and the thrust moraine complex roughly mark the outer limits of the Muragl glacier at the Little Ice Age (LIA) maximum, whereby it must be noted that the moraine and the sediment bed are subject to a permafrost-induced creep process after deglaciation, which continued to current times in some parts of the glacier forefield [36]. In contrast to the thrust moraine in the northeastern part, which signals a glacier–permafrost interaction, glacial flutes in the central part of the forefield suggest a warm-based glacier and thus a polythermal regime of the former Muragl glacier. While several settlement features in the northwestern part suggest a melt out of buried ice or permafrost-related ground ice, the postglacial evolution of three protalus ramparts in the northwest exposed scree slopes adjacent to the thrust moraine complex implies a permafrost aggradation or at least stable permafrost conditions. Also prominent is a dome-like or ridge-like structure in the central part of the glacier forefield, which has a steep flank, especially in the direction of the thrust moraine.
3. Materials and Methods
For the detection of permafrost-related ground ice, indirect geophysical measurements were used. Since the methods used are well-established technics [37], only the most important methodological basics and information about data acquisition and processing are summarized.
3.1. Electrical Resistivity Tomography (ERT)
ERT is a common method in permafrost research due to its suitability for distinguishing between frozen and unfrozen loose sediments. This is mainly based on the contrast of the electrical conductivity at the phase change between water and ice. Whereas water has a high conductivity and therefore low resistivity values, ice is characterized by a low electrical conductivity and high resistivity values. To investigate the moraine complex in the glacier forefield Muragl, a Wenner–Schlumberger array with 36 electrodes and 5 m electrode spacing was used. The device used was a SYSCAL Junior Switch (IRIS Instruments, Orléans, CN, France). The processing of the measured data was done using RES2DinvX64 software (ver. 4.05.41, Geotomo Software, Gelugor, PNG, Malaysia). All data sets were quality checked manually by deleting bad datum points using a 5% threshold of the standard deviation of each stacked quadrupole. Additionally, the removal of bad datum points after a trial inversion was done using a root-mean-square error (RMSE) threshold of 100%. Table 1 shows detailed information of each profile including the number of used datum points. The topography of the profiles was measured using a RTK-GNSS system. To invert the data, we used the robust inversion (L1-Norm), which aims to minimize the spatial changes in the resistivity values of the model. Therefore, it tends to produce homogenous areas and sharp boundaries and is more suitable for the delineation of frozen (ice-rich) and unfrozen areas.
3.2. Ground-Penetrating Radar
Ground-penetrating radar (GPR) is based on the reflection of electromagnetic waves at boundaries between materials with different dielectric characteristics. This enables a detection of boundaries between different materials in the subsurface based on the change in physical parameters such as the density of the material or the water content.
The two-dimensional GPR profiles (common offset) in this case study were performed using a PulsEKKO Pro (Sensors & Software Inc., Mississauga, ON, Canada) with 50 MHz antennas (unshielded). For a better ground coupling in the rough terrain, a stepwise movement with a step size of 50 cm was chosen. The antenna separation was set at 2 m and a perpendicular broadside antenna orientation was used. To estimate the propagation velocity in the different materials of the moraine complex, common midpoint measurements (CMPs) were performed. The resulting average propagation velocities in the local materials corresponded to the propagation velocities listed in the literature for unfrozen (0.10 to 0.13 m/ns) and frozen (partially ice-rich) (0.11 to 0.15 m/ns) unconsolidated moraine deposits [37,38,39,40]. Therefore, an average propagation velocity of 0.13 m/ns was used for the time-to-depth conversion. The GPR processing software used was EKKO-Project (V4) from Sensors and Software Inc. To improve data analysis, a background removal and a dewow filter were applied, the topography data measured with the RTK-GNSS system were incorporated, and a topographic migration was performed. To compensate for growing attenuation with depth, a spherical and exponential compensation (SEC-gain) was used to keep relative signal intensities.
4. Results and Interpretation
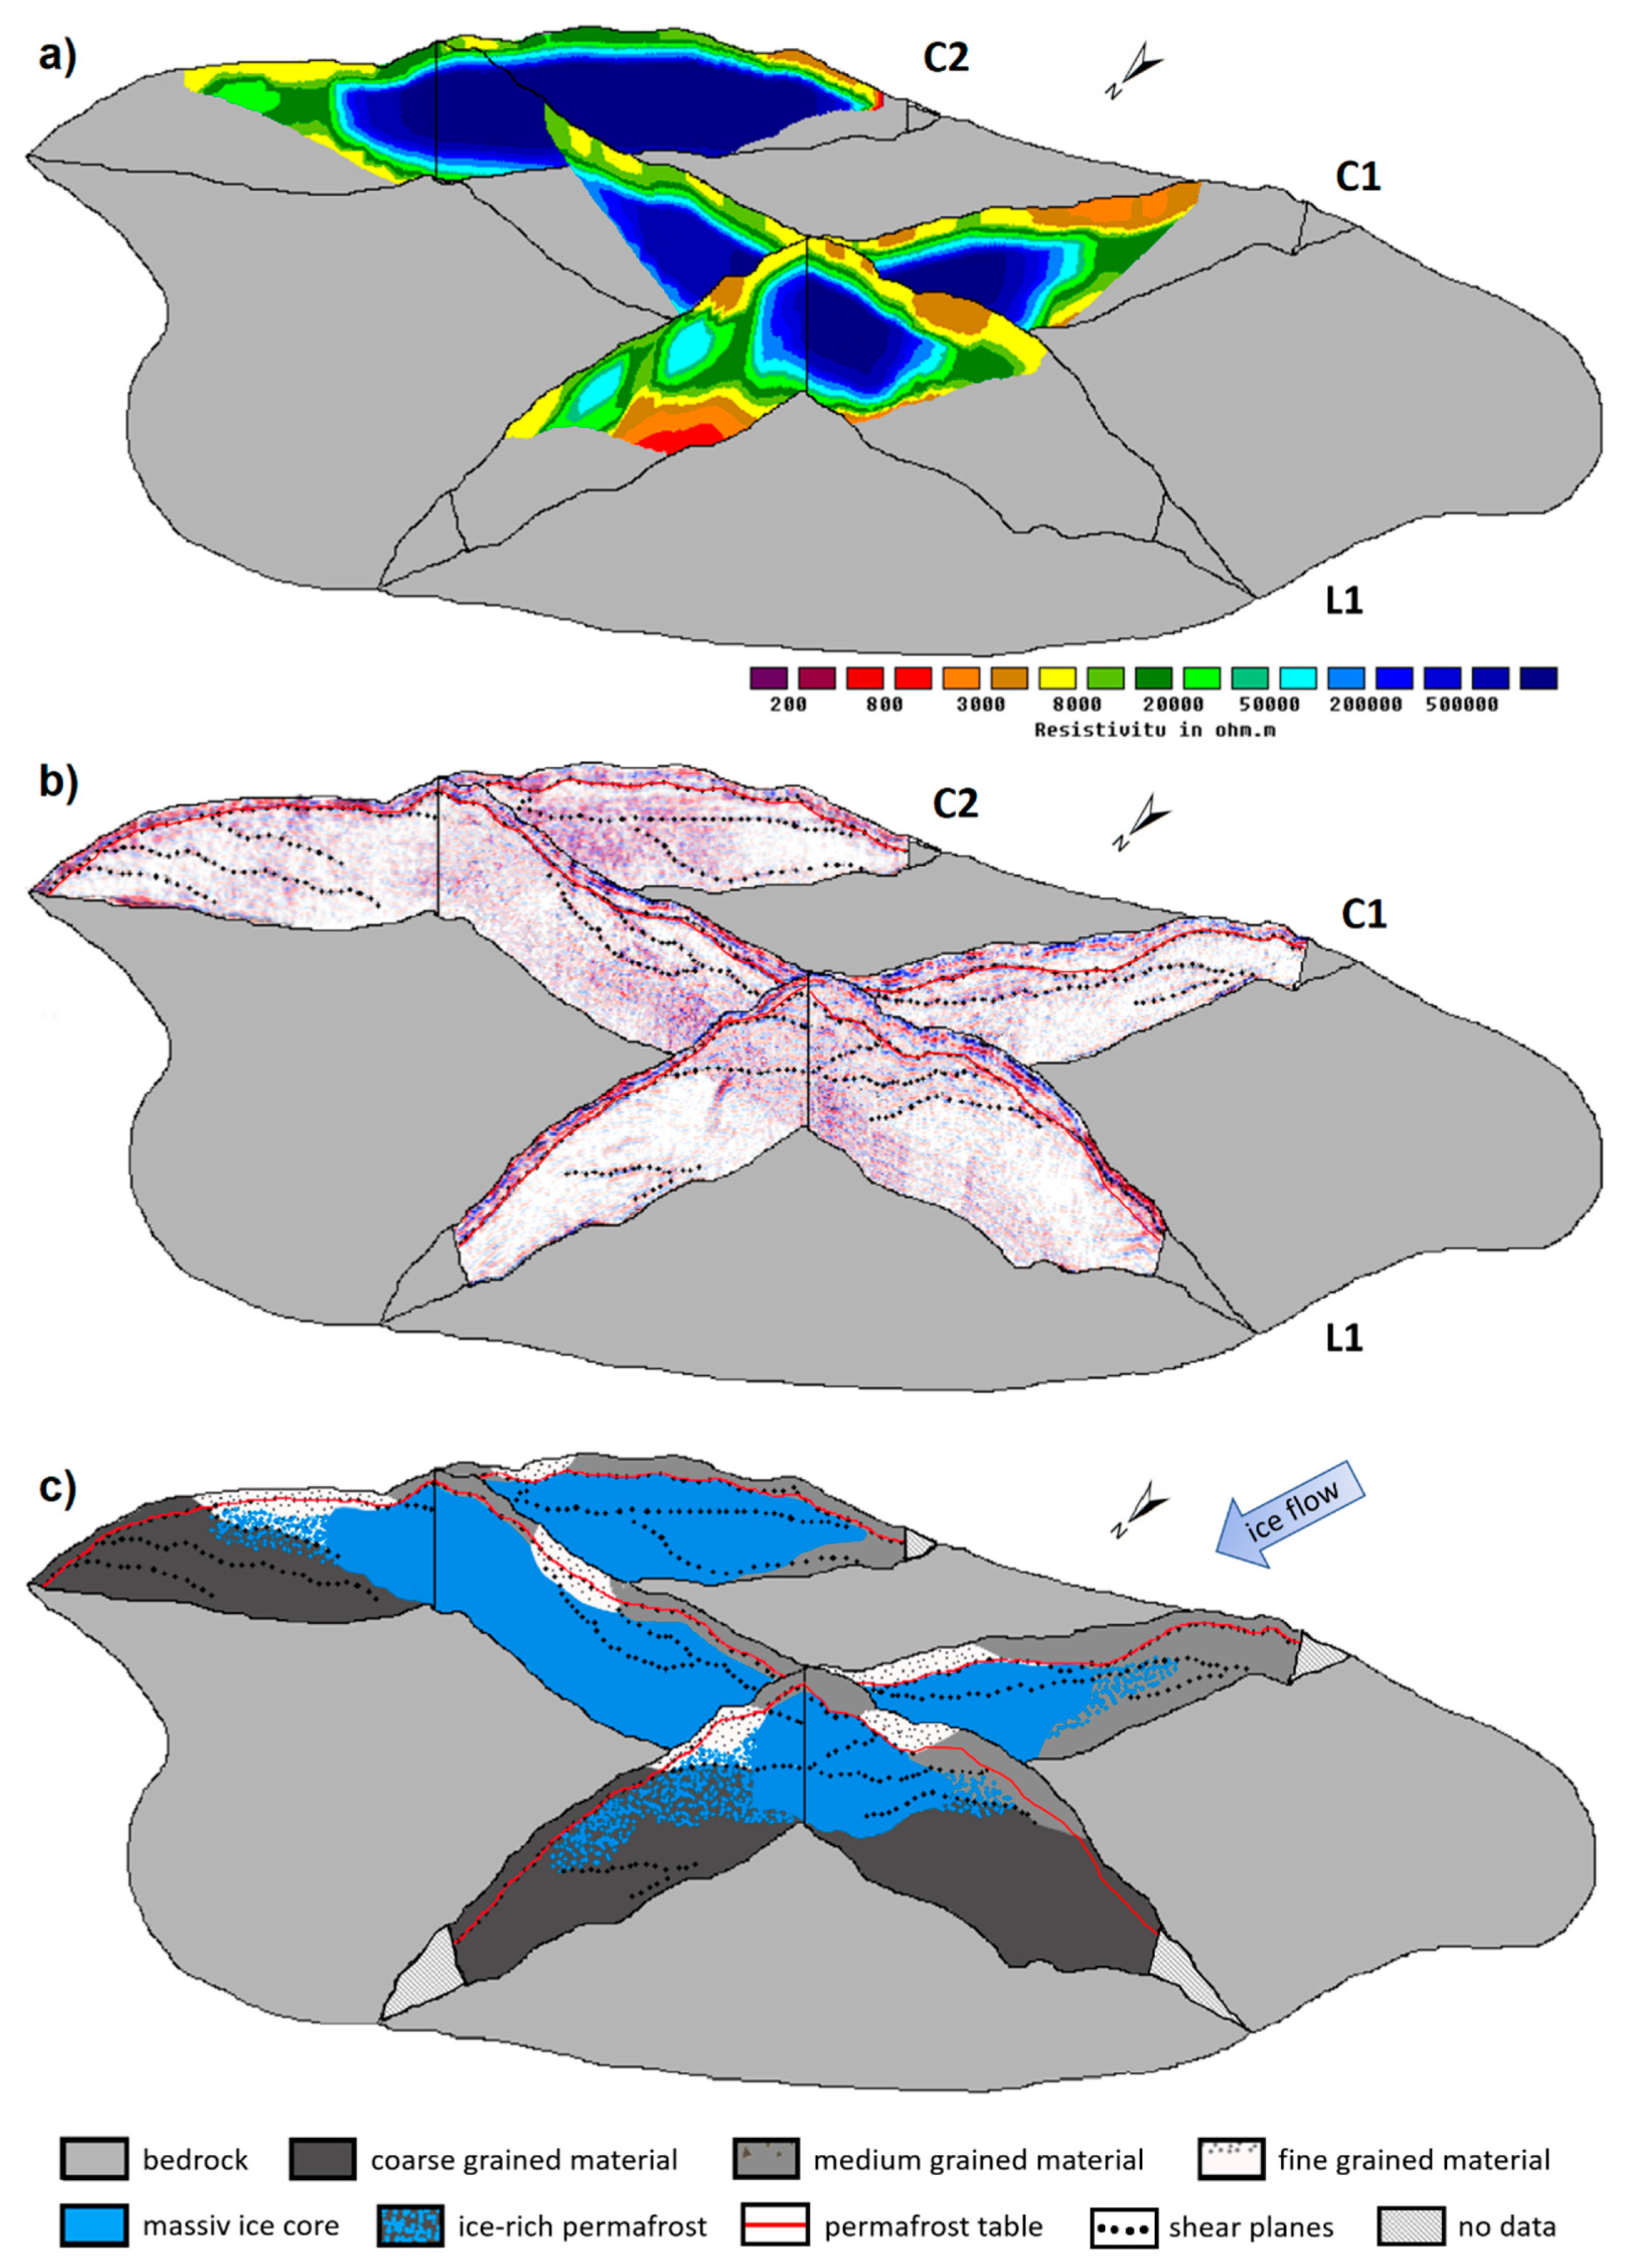
The ERT cross profile C1 (Figure 3) shows a three-layered structure typical for thin permafrost occurrences. At the top of the profile, there is a 2 to 6 m thick layer with resistivity values between 2 and 15 kΩm. In the distal part of the moraine (north slope), the layer is slightly thinner and the resistivity values are between 5 and 15 kΩm, whereas the proximal area is characterized by a thicker uppermost layer and lower resistivity values (<5 kΩm). Based on the geomorphological situation and the resistivity values as well as the GPR data (cf. Figure 4 and interpretations further below), this layer is interpreted as the active layer. Below the active layer, a large high resistivity anomaly exists in the central and proximal part of the moraine complex. It begins approximately 3 to 6 m below the surface and extends to a maximum depth of approximately 18 m. The lateral extent in the profile direction is about 70 m. The high resistivity area (values > 1.5 MΩm), which was previously detected by Kneisel [15,16], seems to be homogeneous and relatively sharp bounded and is interpreted as a massive ice core. In the distal moraine slope, two additional and slightly thinner (up to 10 m thick) high resistivity anomalies were detected. In contrast to the large anomaly in the central and proximal part, it is very prominent that the resistivity values (50–100 kΩm) are high, but are lower by an order of magnitude compared to the central part. Based on this finding, they were interpreted as ice-rich permafrost within the outermost, coarse blocky moraine ridge (blue speckles in Figure 5c). Below the three anomalies, a sharp boundary to an underlying low resistivity layer (<3 kΩm) was detected. This layer was interpreted as unfrozen material. A massive ice core of the central part was also detected in the longitudinal profile (L1), which crosses C1 in the area of this structure. At the cross point of the profiles, the coincidence in terms of absolute resistivity values, depth, and thickness of the anomaly is striking. Furthermore, it also seems to extend from the longitudinal profile in an easterly direction, since a similar area of high resistivity can also be seen in the cross profile C2 further east. In this profile, it extends from the center of the moraine to the edge of the profile on the proximal moraine flank and is significantly thicker. Because of the very high resistivity values, similar to those in previous studies [36], this anomaly is interpreted as a massive ice core of sedimentary or polygenetic origin. Its extent is also marked in the schematic model of the moraine complex (Figure 5c).
In profile C1 and in L1, unfrozen material beneath the massive ice core was detected. In the second cross profile (C2), this layer was not detected. The massive ice core in this part of the moraine was too thick to penetrate it with the applied array length. Additionally, a smaller high resistivity anomaly in the outermost moraine ridge was detected in the second cross profile further east. At the top of the profiles C2 and L1, the active layer was characterized by resistivity values between 2 and 30 kΩm. In the distal flank of the moraine, it was 2 to 3 m thick, whereas it is 3–6 m thick in the proximal zone of the complex. Since the measurements were carried out in early September, the active layer had reached its maximum thickness and its base was comparable to the permafrost table. Variations of resistivity in the topmost layer matched the boundaries of different substrates in the moraine complex, which is probably due to different grain sizes and corresponding different moisture contents.
Results of the GPR surveying confirm these results and present new insights into the internal sedimentological structure of the moraine complex. In the central part of the moraine complex, CMP measurements (not shown) confirmed the assumption of a massive ice core because of high signal propagation velocities. These high values of around 0.16 m/ns are indicative of massive sedimentary ice and exceed the normal range of permafrost, determined as being between 0.11 and 0.15 m/ns in the common literature [37,38,39,40].
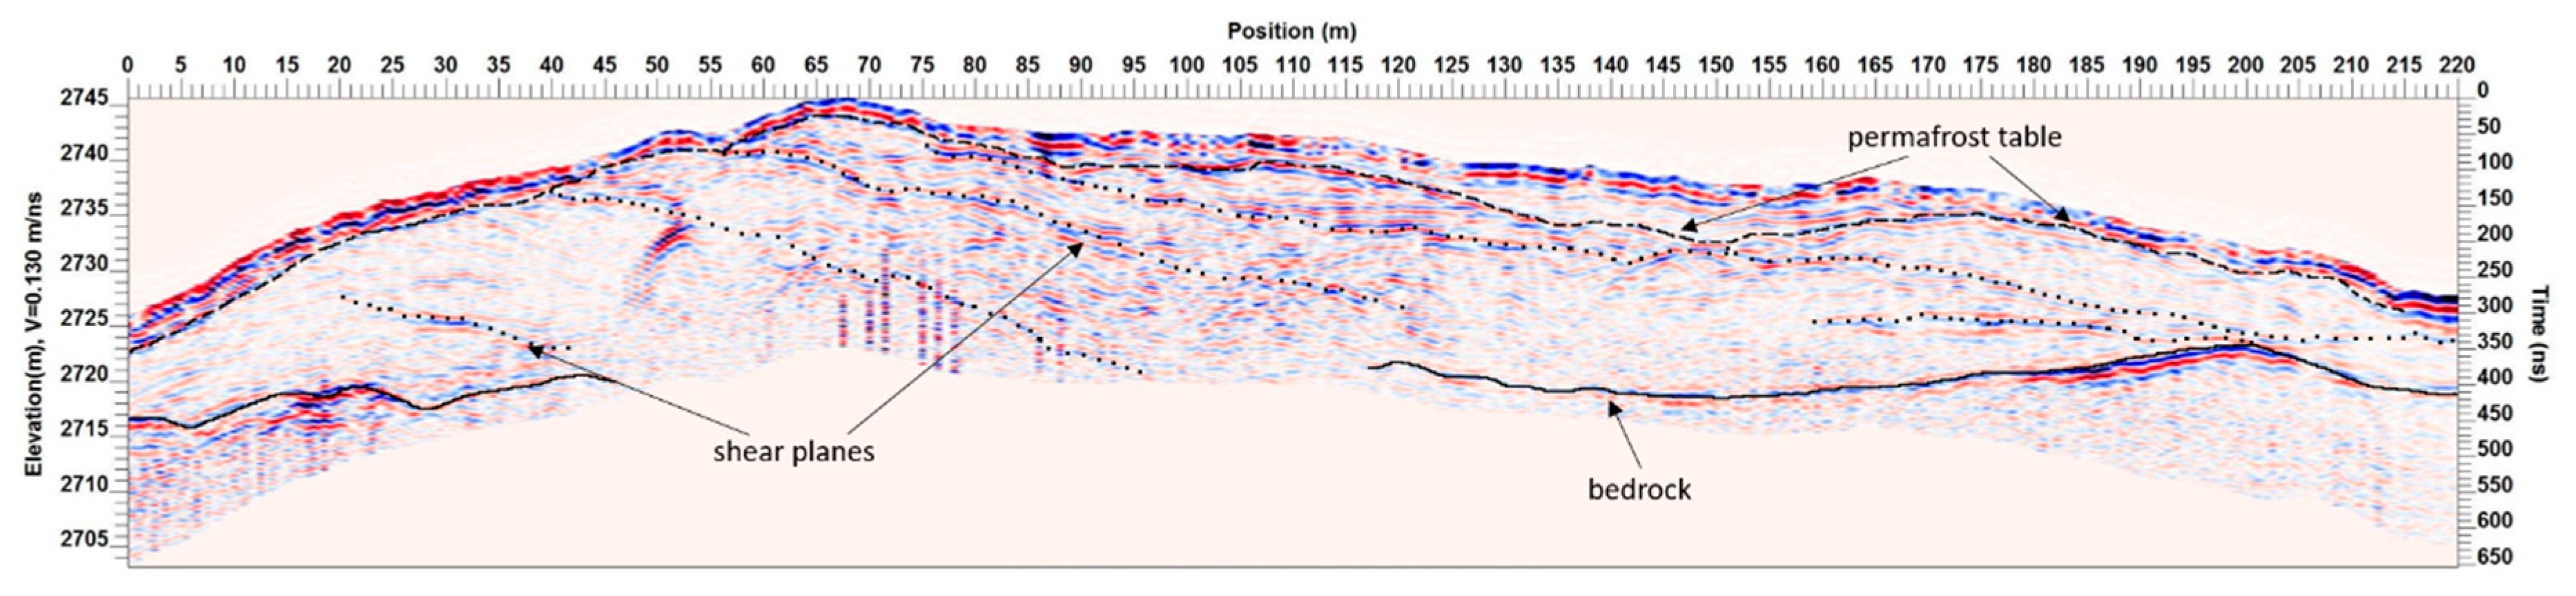
In the upper few meters of profile C1 (Figure 4), but also in the other profiles, a more or less continuous, nearly surface-parallel reflector is visible, which is interpreted as the permafrost table. Its location matches the findings of the ERT measurements that the active layer in the proximal slope is deeper than in the distal slope. It can be observed that the area above the permafrost table is characterized by much stronger reflections than the area underneath. This is probably due to the alternating layers of blocks and cavities, which in combination with moisty surfaces of blocks and boulders within the active layer leads to a strong signal scattering.
Furthermore, the GPR measurements enabled a detection of the bedrock underneath broad parts of the moraine complex. There are strong linear continuous reflectors dipping into the central part of the moraine complex, which are different in reflection behavior in comparison with all other reflections. Specifically, the high signal intensity at this depth beneath the ground surface suggests a sharp boundary and strong contrasts in the geophysical properties. Looking at the depth of these reflectors, it fits well with the moraine height above the bedrock at the margins of the moraine complex.
In the two cross profiles, many linear dipping reflectors towards the proximal flank were detected, in addition to the nearly surface-parallel reflector of the permafrost table and the lowermost reflections of the bedrock. The reflectors start on the surface and dip at a relatively uniform angle into the proximal moraine flank. The start positions of the strongest of these dipping reflectors are equivalent to the positions of substrate boundaries between zones of coarse blocky material, blocky material, and stony material at the surface. These substrate boundaries were mapped along the profiles and were also visible in phase changes of the surface waves in the GPR profiles. The location at the substrate boundaries as well as the shape and the structure of these reflectors lead to the assumption that these reflectors mark sedimentological structures that originated during moraine formation. The dotted lines in Figure 4 and Figure 5b mark the main reflectors of this type. The areas between these reflectors are characterized by chaotic reflections, which indicate a missing sorting or layering of the moraine material. The shape and the orientation of these reflectors indicate that these structures could represent shear planes, which resulted from glaciotectonic processes during the formation of the moraine complex. This would also explain why these linear reflectors run through the assumed massive ice core and do not end at its boundaries. The glacial thrusting leads to an inclusion and transportation of subglacial till into the ice and thus to a concentration of fine-grained sediments along these shear planes. In turn, this sediment concentration leads to a stronger geophysical contrast within the ice body, so that it is visible as a continuous or discontinuous linear reflector amidst the chaotic reflections of the surrounding ice–debris mixture.
When comparing the depth of the lowermost reflector and the results of the ERT measurements, a coincidence between the two data sets occurs. The location of the bedrock reflector and the boundary between the high resistivity anomaly and the underlying low resistivity layer in the central part of the moraine complex correspond to each other. Accordingly, it can be assumed that the low resistivity layer at the bottom of the profiles C1 and L1 is to be equated with unfrozen bedrock beneath the frozen moraine material. Another comparison of the results from ERT and GPR shows that the reflection intensity and density in the GPR data are noticeably higher in the areas of the high resistivity anomalies of the ERT data. This is surprising at first, assuming that the center of the moraine is characterized by a massive ice core. The strong reflections do not deny this; however, they indicate a high degree of impurity of the ice or a high proportion of debris in the ice. Assuming that this is basal thrusted glacier ice of the basal and frontal parts of the glacier, such a concentration of debris would not be unusual but is even to be expected. The assumptions of the internal structures of the moraine complex were summarized in a conceptual model, which is shown in Figure 5c. It presents a schematic model of the internal moraine structures including the massive ice core, the ice-rich permafrost lenses in the outermost moraine ridges as well as linear structures like the permafrost table and the detected shear planes. Additionally, the different dominating clast size of each moraine ridge or thrust block is presented.
5. Discussion
Evidence of a former polythermal regime of the Muragl glacier is given by the strongly differentiated morphology within the forefield. One clear evidence is the coexistence of a thrust moraine complex and glacial flutes within the glacier forefield. While the thrust moraine is a clear evidence of permafrost in the marginal positions, the flutes signal temperate conditions in the central part of the glacier forefield. The cause of this could be the relief of the former glacier bed, which led to a canalization of the ice into two narrowed streams through a dome-like structure in the central apron (see Figure 1 and Figure 2). The channeling led to convergent flow in the central apron and consequently to an increase in pressure and internal friction, which could contribute to a tempering of the glacier. Following the veined canal, especially in the orographic right part of the apron, it was possible to spread strongly (divergent flow) (see Figure 1), resulting in lower ice thicknesses and lower pressures. Thus, the pressure melting point possibly could not be reached and the glacier froze to the bed. These differences in the subglacial thermal regime have had a major impact on permafrost distribution in the glacier forefield even after deglaciation [14,15]. As is also similar in other glacier forefields, a direct link between sub- or englacial conditions and the distribution of permafrost in the glacier forefield was also detected in ice-marginal positions [41].
A differentiation of frozen and unfrozen materials based on geophysical properties, especially electrical resistivity, is quite common in the field of permafrost research. In this case study, values for the unfrozen active layer varied between 1.5 and 30 kΩm and showed a significant dependence on the substrate classes. While the resistivity values of the active layer ranged between 1.5 and 8 kΩm in areas with fine-grained materials, they increased up to 30 kΩm in areas of coarse blocky moraine material. These values match the observations from other studies [15,22,36], but the strong spatial variations complicate the interpretation and delineation of the active layer thickness. A clear differentiation between frozen and unfrozen sediments using a single threshold is not possible because of the changing substrate conditions at the surface. Nevertheless, because of the mapped substrate classes along the profile and the particular threshold of each substrate class, a delineation of the active layer is still possible.
The determination of different ice types is more complex. In the context of this study, two different types classified by Shumskii [31], namely sedimentary ice and congelation ice, are particularly important. The fact that determination is possible with geoelectrical methods has already been shown in some studies; the boundary value of the electrical resistivity values between the two ice types was determined at a few MΩm (for glacier ice in the European Alps). According to King [42] or Vonder Mühll [20], the resistivity values of congelation ice are between 10 kΩm and a few MΩm, whereas the values of sedimentary ice are more than 10 MΩm. The resistivity values of the anomaly in the central part of the moraine complex were higher than 1.5 MΩm, which is therefore lower than the assumed threshold value. Nevertheless, former ERT measurements on the Muragl glacier proved that the resistivity values of the glacier ice were around 2 MΩm in some areas [15], and are therefore similar to the values detected within the moraine complex.
Since profile C2 is located at a similar position as the profile that was shown by Kneisel and Kääb [36] (profile was measured in reverse direction and a few meters further north), a comparison of the structures and the resistivity values is possible. The internal structures of the moraine complex did not change significantly, but the unprocessed raw data showed slightly lower resistivity values for the data presented herein compared to those measured in 2002. This could be due to the slightly differing profile position, but it could also be due to an alteration in the physical properties of the massive ice core, induced by percolating melt water and increasing temperatures. Such a slightly decreasing effect of electrical resistivity values was observed by Mollaret et al. [43] at several permafrost sites within the European Alps.
The GPR data could also not absolutely clarify the origin of the ice core. Its margins are not visible as a single sharp boundary, but the reflection behavior changes significantly, which stands out if comparing the data from ERT and GPR. The reflections in the high resistivity area of the moraine complex are much stronger than in the other parts. According to theory, the area should be transparent for electromagnetic waves if it contains a pure massive ice core. The intense reflections would therefore tend to disprove a pure massive ice core, but considering the position in the glacial system, we would not expect pure ice. The ice in the cold-based frontal part of a polythermal glacier is particularly subject to strong glaciotectonic shearing that leads to the incorporation of debris [44,45,46,47,48]. Consequently, the sedimentary ice has a high content of debris and is not transparent for electromagnetic signals. A sedimentary origin of the ice would also explain the high signal velocities of 0.16 m/ns that were determined in the center of the moraine during the CMP measurements. This value is greater than the expected value for permafrost and fits well with the expected values for buried glacier ice, which are between 0.15 and 0.17 m/ns [49,50].
The detected linear structures within the moraine complex could also be a result of the thrusting in front of the advancing glacier. Their alignment and the accordance with the substrate boundaries lead to the assumption that these must be shear planes, which result from the glaciotectonic processes occurring during the moraine genesis. The alignment of the different linear structures fits well with observations from other studies, which investigated the internal structures of thrust moraines [44,45,50,51]. The linear shape of these reflectors and the absence of larger faults are a direct hint to brittle deformation of the moraine material during genesis and therefore evidence of frozen ground conditions at that time. Specifically, the fact that the spaces in between the linear reflectors are characterized by chaotic reflections and therefore by a missing layering strengthens the theory of the shear planes. If the different layers were formed by slow glacial accumulation, such as the process of dumping, then the material would have an adjustment [52] that would be indicated by ordered reflections [29,51]. Since these are not present, this gives evidence of a shift in the blocks of frozen materials. As a strong cohesion of the individual blocks must prevail for this type of displacement, the question arises as to how it could come to the process of thrusting in such a coarse material at all. This could be explained only by very high contents of interstitial ice within the coarse-grained loose material, which ensure a corresponding cohesion of the material. On the other hand, low temperatures and/or low water contents within the ice leads to hard-frozen ground and prevents a plastic deformability, so that a brittle deformation is the only way to respond to the strain [8]. Regardless of this, however, it is clear that the moraine complex in the center is characterized by very high ice contents, which will also be of great importance for the future development of the moraine complex and its morphology. In particular, the increasing degradation of permafrost in the course of global warming can lead to distinct changes in surface topography through melt out of the massive ice core as it was shown in other studies [53,54,55].
6. Conclusions
The combination of electrical resistivity tomography and ground-penetrating radar enabled a more detailed investigation of the internal structures of the moraine complex in the glacier forefield Muragl. In addition to the already roughly known distribution of resistivity values within the moraine complex, GPR allowed the determination of internal sedimentological structures of the complex. The detected structures resemble those of large thrust moraine complexes only on a smaller scale and give evidence of a glaciotectonic origin of the moraine complex. That, in turn, confirms the assumption of a glacier–permafrost interaction during moraine formation and reinforces the theory of a polygenetic origin of the detected massive ice core in the central part of the moraine complex. At the same time, however, the question arises as to how it could undergo the process of thrusting in such coarse-grained material, since the process has so far only been verified in much finer sediments, such as sands or gravels. One answer may be the high ice contents in the coarse blocky material, which prevented a plastic deformation of the moraine material. The internal structures and the occurrence of the different units and layers of the moraine contributed to a better understanding of the moraine genesis and enabled the creation of a conceptual model of thrust moraine formation in the glacier forefield Muragl. While the study of moraine formation initially represents pure fundamental research, the study of current internal structures in such cases also shows a need for applied research in this field of research. In the context of climate change and global warming, this type of moraines in particular, which are characterized by very high ice contents, may undergo intense morphological changes as well as reactivation of moraine material.
Author Contributions
Conceptualization, J.K. and C.K.; methodology, J.K. and C.K.; software, J.K.; validation, J.K.; formal analysis, J.K.; investigation, J.K.; resources, C.K.; data curation, J.K.; writing—original draft preparation, J.K.; writing—review and editing, C.K.; visualization, J.K.; supervision, C.K.; project administration, C.K.; funding acquisition, C.K. All authors have read and agreed to the published version of the manuscript.
Funding
This research was funded by the German Research Foundation (DFG), grant number KN 542/13-1.
Acknowledgments
The authors gratefully acknowledge Franziska Losert, Adrian Emmert, Julian Trappe, and Johannes Kunz for their assistance in the field and would also like to thank two anonymous reviewers for their constructive comments. This publication was supported by the Open Access Publication Fund of the University of Wuerzburg, Wuerzburg, Germany.
Conflicts of Interest
The authors declare no conflict of interest.
References
- Mathews, W.H.; Mackay, J.R. Deformation of soils by glacier ice and the influence of pore pressures and permafrost. Philos. Trans. R. Soc. Can. 1960, 54, 27–36. [Google Scholar]
- Kälin, M. The Active Push Moraine of the Thompson Glacier, Axel Heiberg Island, Canadian Arctic Archipelago. Ph.D. Thesis, ETH Zürich, Zürich, Switzerland, 1971. [Google Scholar]
- Aber, J.; Croot, D.G.; Fenton, M.M. Glaciotectonic Landforms and Structures; Kluwer Academic Publishers: Boston, MA, USA; London, UK, 1989. [Google Scholar]
- Boulton, G.S.; Caban, P. Groundwater flow beneath ice sheets: Part II – Its impact on glacier tectonic structures and moraine formation. Quat. Sci. Rev. 1995, 14, 563–587. [Google Scholar] [CrossRef]
- Boulton, G.S.; Van der Meer, J.J.M.; Beets, D.J.; Hart, J.K.; Ruegg, G.H.J. The sedimentary and structural evolution of a recent push moraine complex: Holmstrømbreen, Spitsbergen. Quat. Sci. Rev. 1999, 18, 339–371. [Google Scholar] [CrossRef]
- Hambrey, M.J.; Huddart, D. Englacial and proglacial glaciotectonic processes at the snout of a thermally complex glacier in Svalbard. J. Quat. Sci. 1995, 10, 313–326. [Google Scholar] [CrossRef]
- Bennett, M.R. The morphology, structural evolution and significance of push moraines. Earth Sci. Rev. 2001, 53, 197–236. [Google Scholar] [CrossRef]
- Waller, R.I.; Murton, J.B.; Kristensen, L. Glacier–permafrost interactions: Processes, products and glaciological implications. Sediment. Geol. 2012, 255, 1–28. [Google Scholar] [CrossRef]
- Haeberli, W. Untersuchungen zur Verbreitung von Permafrost zwischen Flüelapass und Piz Grialetsch (Graubünden). In Mitt. d. Vers. für Wasserbau, Hydrologie und Glaziologie; ETH Zürich: Zürich, Switzerland, 1975; Volume 17. [Google Scholar]
- Haeberli, W. Holocene Push-Moraines in Alpine Permafrost. Geogr. Ann. 1979, 61A, 43–48. [Google Scholar] [CrossRef]
- Barsch, D. Refraktionsseismische Bestimmungen der Obergrenze des gefrorenen Schuttkörpers in verschiedenen Schuttkörpern Graubündens. Z. für Gletsch. und Glazialgeol. 1973, 9, 143–167. [Google Scholar]
- Fisch, W.; Fisch, W.; Haeberli, W. Electrical DC resistivity soundings with long profiles on rock glaciers and moraines in the Alps of Switzerland. Z. für Gletsch. und Glazialgeol. 1977, 13, 239–260. [Google Scholar]
- Haeberli, W.; Patzelt, G. Permafrostkartierung im Gebiet der Hochebenkar-Blockgletscher, Obergurgl, Ötztaler Alpen. Z. für Gletsch. und Glazialgeol. 1982, 18, 127–150. [Google Scholar]
- Kneisel, C. Occurrence of surface ice and ground ice/permafrost in recently deglaciated glacier forefields, St. Moritz area, Eastern Swiss Alps. In Proceedings of the seventh International Conference on Permafrost, Yellowknife, NT, Canada, 23–27 June 1998; pp. 575–581. [Google Scholar]
- Kneisel, C. Permafrost in Gletschervorfeldern–Eine vergleichende Untersuchung in den Ostschweizer Alpen und Nordschweden. Ph.D. Thesis, University of Trier, Trier, Germany, 1999. [Google Scholar]
- Kneisel, C. New Insights into Mountain Permafrost Occurrence and Characteristics in Glacier Forefields at High Altitude through the Application of 2D Resistivity Imaging. Permafr. Periglac. Process. 2004, 15, 221–227. [Google Scholar] [CrossRef]
- Lugon, R.; Delaloye, R.; Serrano, E.; Reynard, E.; Lambiel, C.; Gonzales-Trueba, J.J. Permafrost and Little Ice Age Glacier Relationships, Posets Massif, Central Pyrenees, Spain. Permafr. Periglac. Process. 2004, 15, 207–220. [Google Scholar] [CrossRef]
- Delaloye, R. Contribution à l’étude du pergélisol de montagne en zone marginale. Ph.D. Thesis, University Fribourg, Fribourg, Switzerland, 2004. [Google Scholar]
- Reynard, E.; Lambiel, C.; Delaloye, R.; Devaud, G.; Baron, L.; Chapellier, D.; Marescot, L.; Monnet, R. Glacier/permafrost relationships in forefields of small glaciers (Swiss Alps). In Proceedings of the 8th International Conference on Permafrost, Zurich, Switzerland, 20–25 July 2003; pp. 947–952. [Google Scholar]
- Vonder Mühll, D.S. Geophysikalische Untersuchungen im Permafrost des Oberengadins. Ph.D. Thesis, ETH Zürich, Zürich, Switzerland, 1993. [Google Scholar]
- Rödder, T.; Kneisel, C. Permafrost mapping using quasi-3D resistivity imaging, Murtèl, Swiss Alps. Near Surf. Geophys. 2012, 10, 117–127. [Google Scholar] [CrossRef]
- Kneisel, C.; Emmert, A.; Kästl, J. Application of 3D electrical resistivity imaging for mapping frozen ground conditions exemplified by three case studies. Geomorphology 2014, 210, 71–82. [Google Scholar] [CrossRef]
- Emmert, A.; Kneisel, C. Internal structure of two alpine rock glaciers investigated by quasi-3-D electrical resistivity imaging. Cryosphere 2017, 11, 841–855. [Google Scholar] [CrossRef] [Green Version]
- King, L.; Fisch, W.; Haeberli, W.; Waechter, H.P. Comparison of resistivity and radio-echo soundings on rock glacier permafrost. Z. für Gletsch. und Glazialgeol. 1987, 23, 77–97. [Google Scholar]
- Degenhardt, J.J.; Giardino, J.R.; Junck, M.B. GPR survey of a lobate rock glacier in Yankee Boy Basin, Colorado, USA. Geol. Soc. Lond. Spec. Publ. 2003, 211, 167–179. [Google Scholar] [CrossRef]
- Hausmann, H.; Krainer, K.; Brückl, E.; Mostler, W. Internal structure and ice content of Reichenkar rock glacier (Stubai Alps, Austria) assessed by geophysical investigations. Permafr. Periglac. Process. 2007, 18, 351–367. [Google Scholar] [CrossRef] [Green Version]
- Monnier, S.; Camerlynck, C.; Rejiba, F. Ground penetrating radar survey and stratigraphic interpretation of the Plan du Lac rock glaciers, Vanoise Massif, northern French Alps. Permafr. Periglac. Process. 2008, 19, 19–30. [Google Scholar] [CrossRef]
- Monnier, S.; Camerlynck, C.; Rejiba, F.; Kinnard, C.; Feuillet, T.; Dhemaied, A. Structure and genesis of the Thabor rock glacier (Northern French Alps) determined from morphological and ground-penetrating radar surveys. Geomorphology 2011, 134, 269–279. [Google Scholar] [CrossRef]
- Lukas, S.; Sass, O. The formation of alpine lateral moraines inferred from sedimentology and radar reflection patterns: A case study from Gornergletscher, Switzerland. Geol. Soc. Lond. Spec. Publ. 2011, 354, 77–92. [Google Scholar] [CrossRef]
- Otto, J.C.; Keuschnig, M.; Götz, J.; Marbach, M.; Schrott, L. Detection of mountain permafrost by combining high resolution surface and subsurface information—An example from the Glatzbach catchment, Austrian Alps. Geogr. Ann. Ser. Physical Geogr. 2012, 94, 43–57. [Google Scholar] [CrossRef]
- Shumskii, P.A. Principles of Structural Glaciology; Dover Publivations: New York, NY, USA, 1964. [Google Scholar]
- Benediktsson, Í.Ö.; Schomacker, A.; Lokrantz, H.; Ingólfsson, Ó. The 1890 surge end moraine at Eyjabakkajökull, Iceland: A re-assessment of a classic glaciotectonic locality. Quat. Sci. Rev. 2010, 29, 484–506. [Google Scholar] [CrossRef]
- Kunz, J. Eine Untersuchung von Gletscher-Permafrost-Interaktion im Vorfeld Muragl (Schweizer Alpen). Bachelor’s Thesis, University of Wuerzburg, Würzburg, Germany, 2016. [Google Scholar]
- Federal Office of Meteorology and Climatology MeteoSwiss. Climate normals Samedan—Reference Period 1981–2010. Available online: https://www.meteoswiss.admin.ch/product/output/climate-data/climate-diagrams-normal-values-station-processing/SAM/climsheet_SAM_np8110_e.pdf (accessed on 23 March 2020).
- Federal Office of Meteorology and Climatology MeteoSwiss. Climate normals Piz Corvatsch—Reference period 1981–2010. Available online: https://www.meteoswiss.admin.ch/product/output/climate-data/climate-diagrams-normal-values-station-processing/COV/climsheet_COV_np8110_e.pdf (accessed on 23 March 2020).
- Kneisel, C.; Kääb, A. Mountain permafrost dynamics within a recently exposed glacier forefield inferred by a combined geomorphological, geophysical and photogrammetrical approach. Earth Surf. Process. Landf. 2007, 32, 1797–1810. [Google Scholar] [CrossRef]
- Hauck, C.; Kneisel, C. Applied Geophysics in Periglacial Environments; Cambridge University Press: Cambridge, UK, 2008. [Google Scholar]
- Moorman, B.J.; Robinson, S.D.; Burgess, M.M. Imaging periglacial conditions with ground-penetrating radar. Permafr. Periglac. Process. 2003, 14, 319–329. [Google Scholar] [CrossRef]
- Neal, A. Ground-penetrating radar and its use in sedimentology: Principles, problems and progress. Earth Sci. Rev. 2004, 66, 261–330. [Google Scholar] [CrossRef]
- Davis, J.L.; Annan, A.P. Ground-penetrating radar for high-resolution mapping of soil and rock stratigraphy 1. Geophys. Prospect. 1989, 37, 531–551. [Google Scholar] [CrossRef]
- Dobiński, W.; Grabiec, M.; Glazer, M. Cold—Temperate transition surface and permafrost base (CTS-PB) as an environmental axis in glacier–permafrost relationship, based on research carried out on the Storglaciären and its forefield, northern Sweden. Quat. Res. 2017, 88, 551–569. [Google Scholar] [CrossRef]
- King, L. Permafrost in Skandinavien. Untersuchungsergebnisse aus Lappland, Jotunheimen und Dovre/Rondane; Geographisches Institut der Universität Heidelberg: Heidelberg, Germany, 1984. [Google Scholar]
- Mollaret, C.; Hilbich, C.; Pellet, C.; Flores-Orozco, A.; Delaloye, R.; Hauck, C. Mountain permafrost degradation documented through a network of permanent electrical resistivity tomography sites. Cryosphere 2019, 13, 2557–2578. [Google Scholar] [CrossRef] [Green Version]
- Huddart, D.; Hambrey, M.J. Sedimentary and tectonic development of a high-arctic, thrust-moraine complex: Comfortlessbreen, Svalbard. Boreas 1996, 25, 227–243. [Google Scholar] [CrossRef]
- Overgaard, T.; Jakobsen, P.R. Mapping of glaciotectonic deformation in an ice marginal environment with ground penetrating radar. J. Appl. Geophys. 2001, 47, 191–197. [Google Scholar] [CrossRef]
- Woodward, J.; Murray, T.; Clark, R.A.; Stuart, G.W. Glacier surge mechanisms inferred from ground-penetrating radar: Kongsvegen, Svalbard. J. Glaciol. 2003, 49, 473–480. [Google Scholar] [CrossRef] [Green Version]
- Sadura, S.; Martini, I.P.; Endres, A.L.; Wolf, K. Morphology and GPR stratigraphy of a frontal part of an end moraine of the Laurentide Ice Sheet: Paris Moraine near Guelph, ON, Canada. Geomorphology 2006, 75, 212–225. [Google Scholar] [CrossRef]
- Larsen, N.K.; Kronborg, C.; Yde, J.C.; Knudsen, N.T. Debris entrainment by basal freeze-on and thrusting during the 1995–1998 surge of Kuannersuit Glacier on Disko Island, west Greenland. Earth Surf. Process. Landf. 2010, 35, 561–574. [Google Scholar] [CrossRef]
- Brandt, O.; Langley, K.; Kohler, J.; Hamran, S.E. Detection of buried ice and sediment layers in permafrost using multi-frequency Ground Penetrating Radar: A case examination on Svalbard. Remote Sens. Environ. 2007, 111, 212–227. [Google Scholar] [CrossRef]
- Midgley, N.G.; Cook, S.J.; Graham, D.J.; Tonkin, T.N. Origin, evolution and dynamic context of a Neoglacial lateral-frontal moraine at Austre Lovénbreen, Svalbard. Geomorphology 2013, 198, 96–106. [Google Scholar] [CrossRef] [Green Version]
- Tonkin, T.N. Characteristics of lateral-frontal moraine formed at Arctic and Alpine glaciers. Ph.D. Thesis, Nottingham Trent University, Nottingham, UK, 2016. [Google Scholar]
- Lukas, S.; Graf, A.; Coray, S.; Schlüchter, C. Genesis, stability and preservation potential of large lateral moraines of Alpine valley glaciers–towards a unifying theory based on Findelengletscher, Switzerland. Quat. Sci. Rev. 2012, 38, 27–48. [Google Scholar] [CrossRef]
- Kjær, K.H.; Krüger, J. The final phase of dead-ice moraine development: Processes and sediment architecture, Kötlujökull, Iceland. Sedimentology 2001, 48, 935–952. [Google Scholar] [CrossRef]
- Ewertowski, M.W.; Tomczyk, A.M. Quantification of the ice-cored moraines’ short-term dynamics in the high-Arctic glaciers Ebbabreen and Ragnarbreen, Petuniabukta, Svalbard. Geomorphology 2015, 234, 211–227. [Google Scholar] [CrossRef] [Green Version]
- Tonkin, T.N.; Midgley, N.G.; Cook, S.J.; Graham, D.J. Ice-cored moraine degradation mapped and quantified using an unmanned aerial vehicle: A case study from a polythermal glacier in Svalbard. Geomorphology 2016, 258, 1–10. [Google Scholar] [CrossRef] [Green Version]
Figure 1.
Glacier forefield Muragl. The positions of the electrical resistivity tomography (ERT) profiles (blue lines) and ground-penetrating radar (GPR) profiles (red lines) as well as the viewpoints of the photographs are marked in the map. The former ice flow direction is illustrated by blue arrows. The investigated thrust moraine complex is highlighted by yellow lines in photographs (A,B).

Figure 2.
Geomorphological map of the glacier forefield Muragl.

Figure 3.
ERT profile C1 (see Figure 1 for location).
Figure 3.
ERT profile C1 (see Figure 1 for location).

Figure 4.
GPR profile C1 (see Figure 1 for location). Distinct reflectors are traced by solid lines (bedrock), dashed lines (permafrost table), and dotted lines (internal shear planes).
Figure 4.
GPR profile C1 (see Figure 1 for location). Distinct reflectors are traced by solid lines (bedrock), dashed lines (permafrost table), and dotted lines (internal shear planes).

Figure 5.
Three-dimensional arrangement of the ERT (a) and GPR profiles (b) and the deduced conceptual model of the thrust moraine complex (c).
Figure 5.
Three-dimensional arrangement of the ERT (a) and GPR profiles (b) and the deduced conceptual model of the thrust moraine complex (c).


Table 1.
Profile Information.
| Profile | Profile Length (in m) | Used Iteration | Absolute Error (in %) | Used Datum Points (from a Total of 288) |
|---|---|---|---|---|
| C1 | 175 | 7 | 11.9 | 283 |
| C2 | 175 | 7 | 13.3 | 287 |
| L1 | 175 | 7 | 7.9 | 288 |
C, cross profile; L, longitudinal profile.
© 2020 by the authors. Licensee MDPI, Basel, Switzerland. This article is an open access article distributed under the terms and conditions of the Creative Commons Attribution (CC BY) license (http://creativecommons.org/licenses/by/4.0/).
Share and Cite
MDPI and ACS Style
Kunz, J.; Kneisel, C. Glacier–Permafrost Interaction at a Thrust Moraine Complex in the Glacier Forefield Muragl, Swiss Alps. Geosciences 2020, 10, 205. https://0-doi-org.brum.beds.ac.uk/10.3390/geosciences10060205
AMA Style
Kunz J, Kneisel C. Glacier–Permafrost Interaction at a Thrust Moraine Complex in the Glacier Forefield Muragl, Swiss Alps. Geosciences. 2020; 10(6):205. https://0-doi-org.brum.beds.ac.uk/10.3390/geosciences10060205
Chicago/Turabian StyleKunz, Julius, and Christof Kneisel. 2020. "Glacier–Permafrost Interaction at a Thrust Moraine Complex in the Glacier Forefield Muragl, Swiss Alps" Geosciences 10, no. 6: 205. https://0-doi-org.brum.beds.ac.uk/10.3390/geosciences10060205
Note that from the first issue of 2016, this journal uses article numbers instead of page numbers. See further details here.