Characteristics of Sedimentary Organic Matter and Phosphorus in Minor Rivers Discharging into Zhejiang Coast, China


Abstract
:1. Introduction
2. Materials and Methods
2.1. Study Areas and Sampling
2.2. Analytical Methods
2.2.1. Bulk Elemental and Lignin Analysis
2.2.2. Sedimentary P Species
3. Results
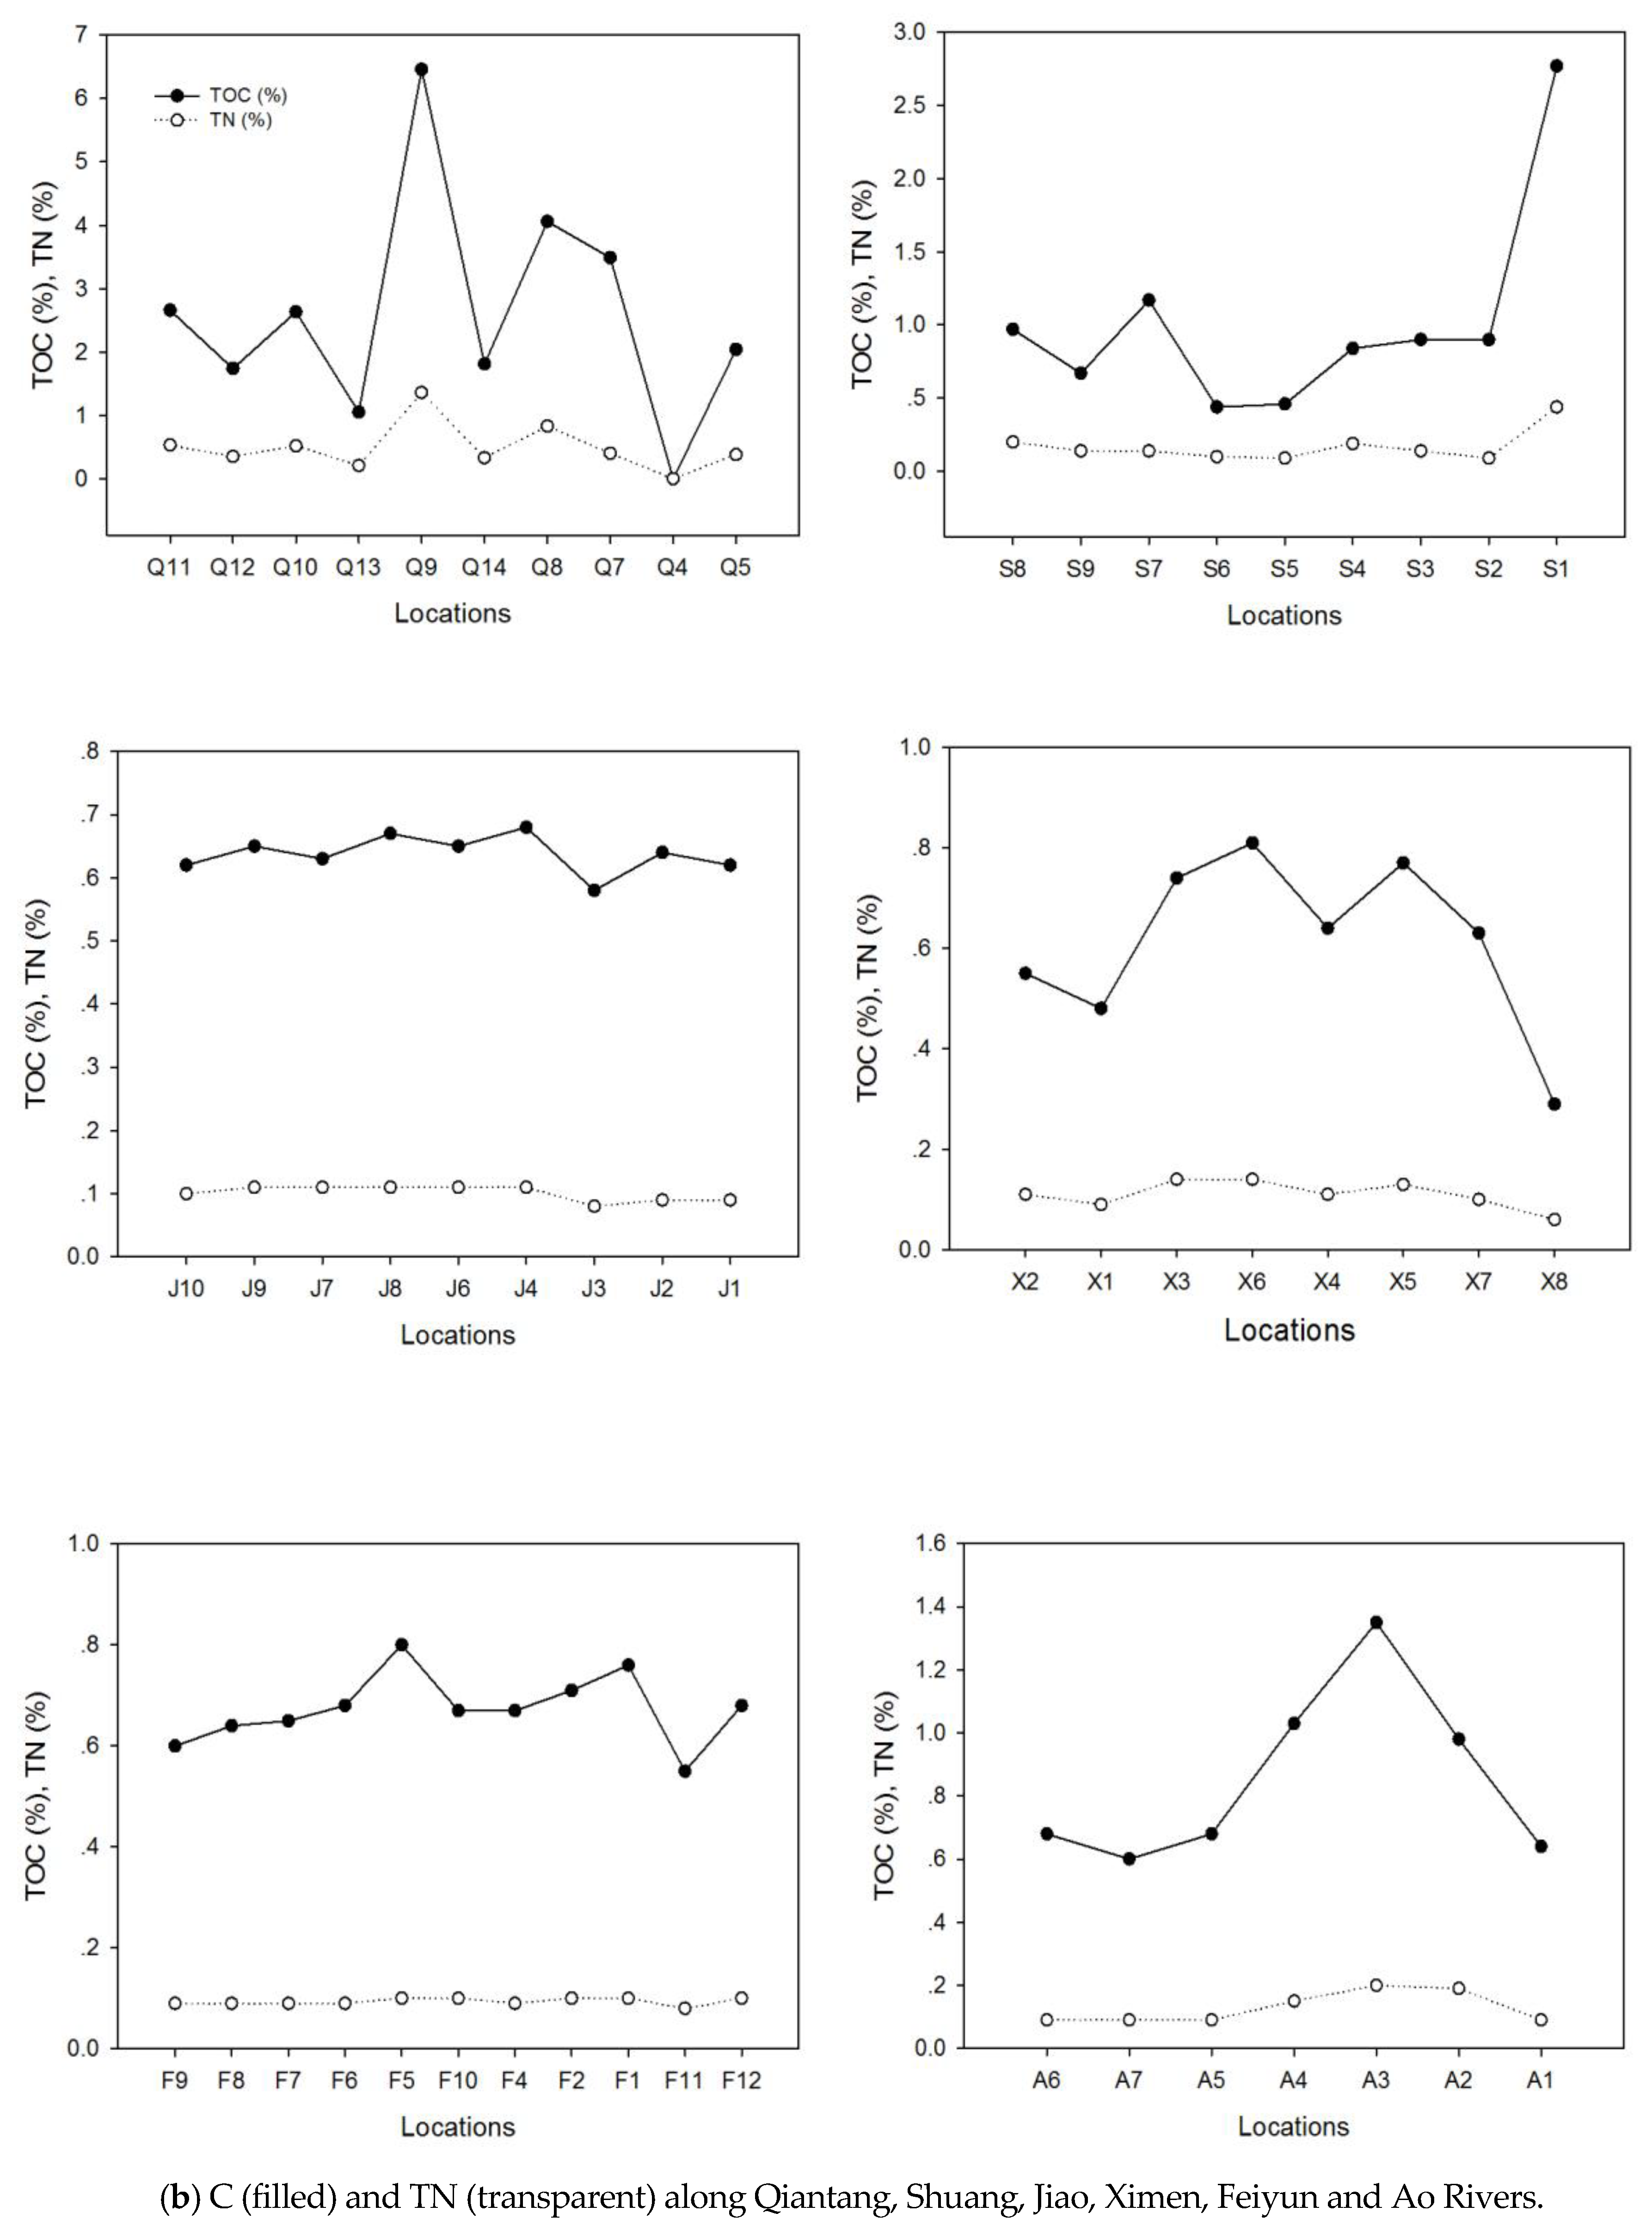
3.1. Sedimentary Organic Matter
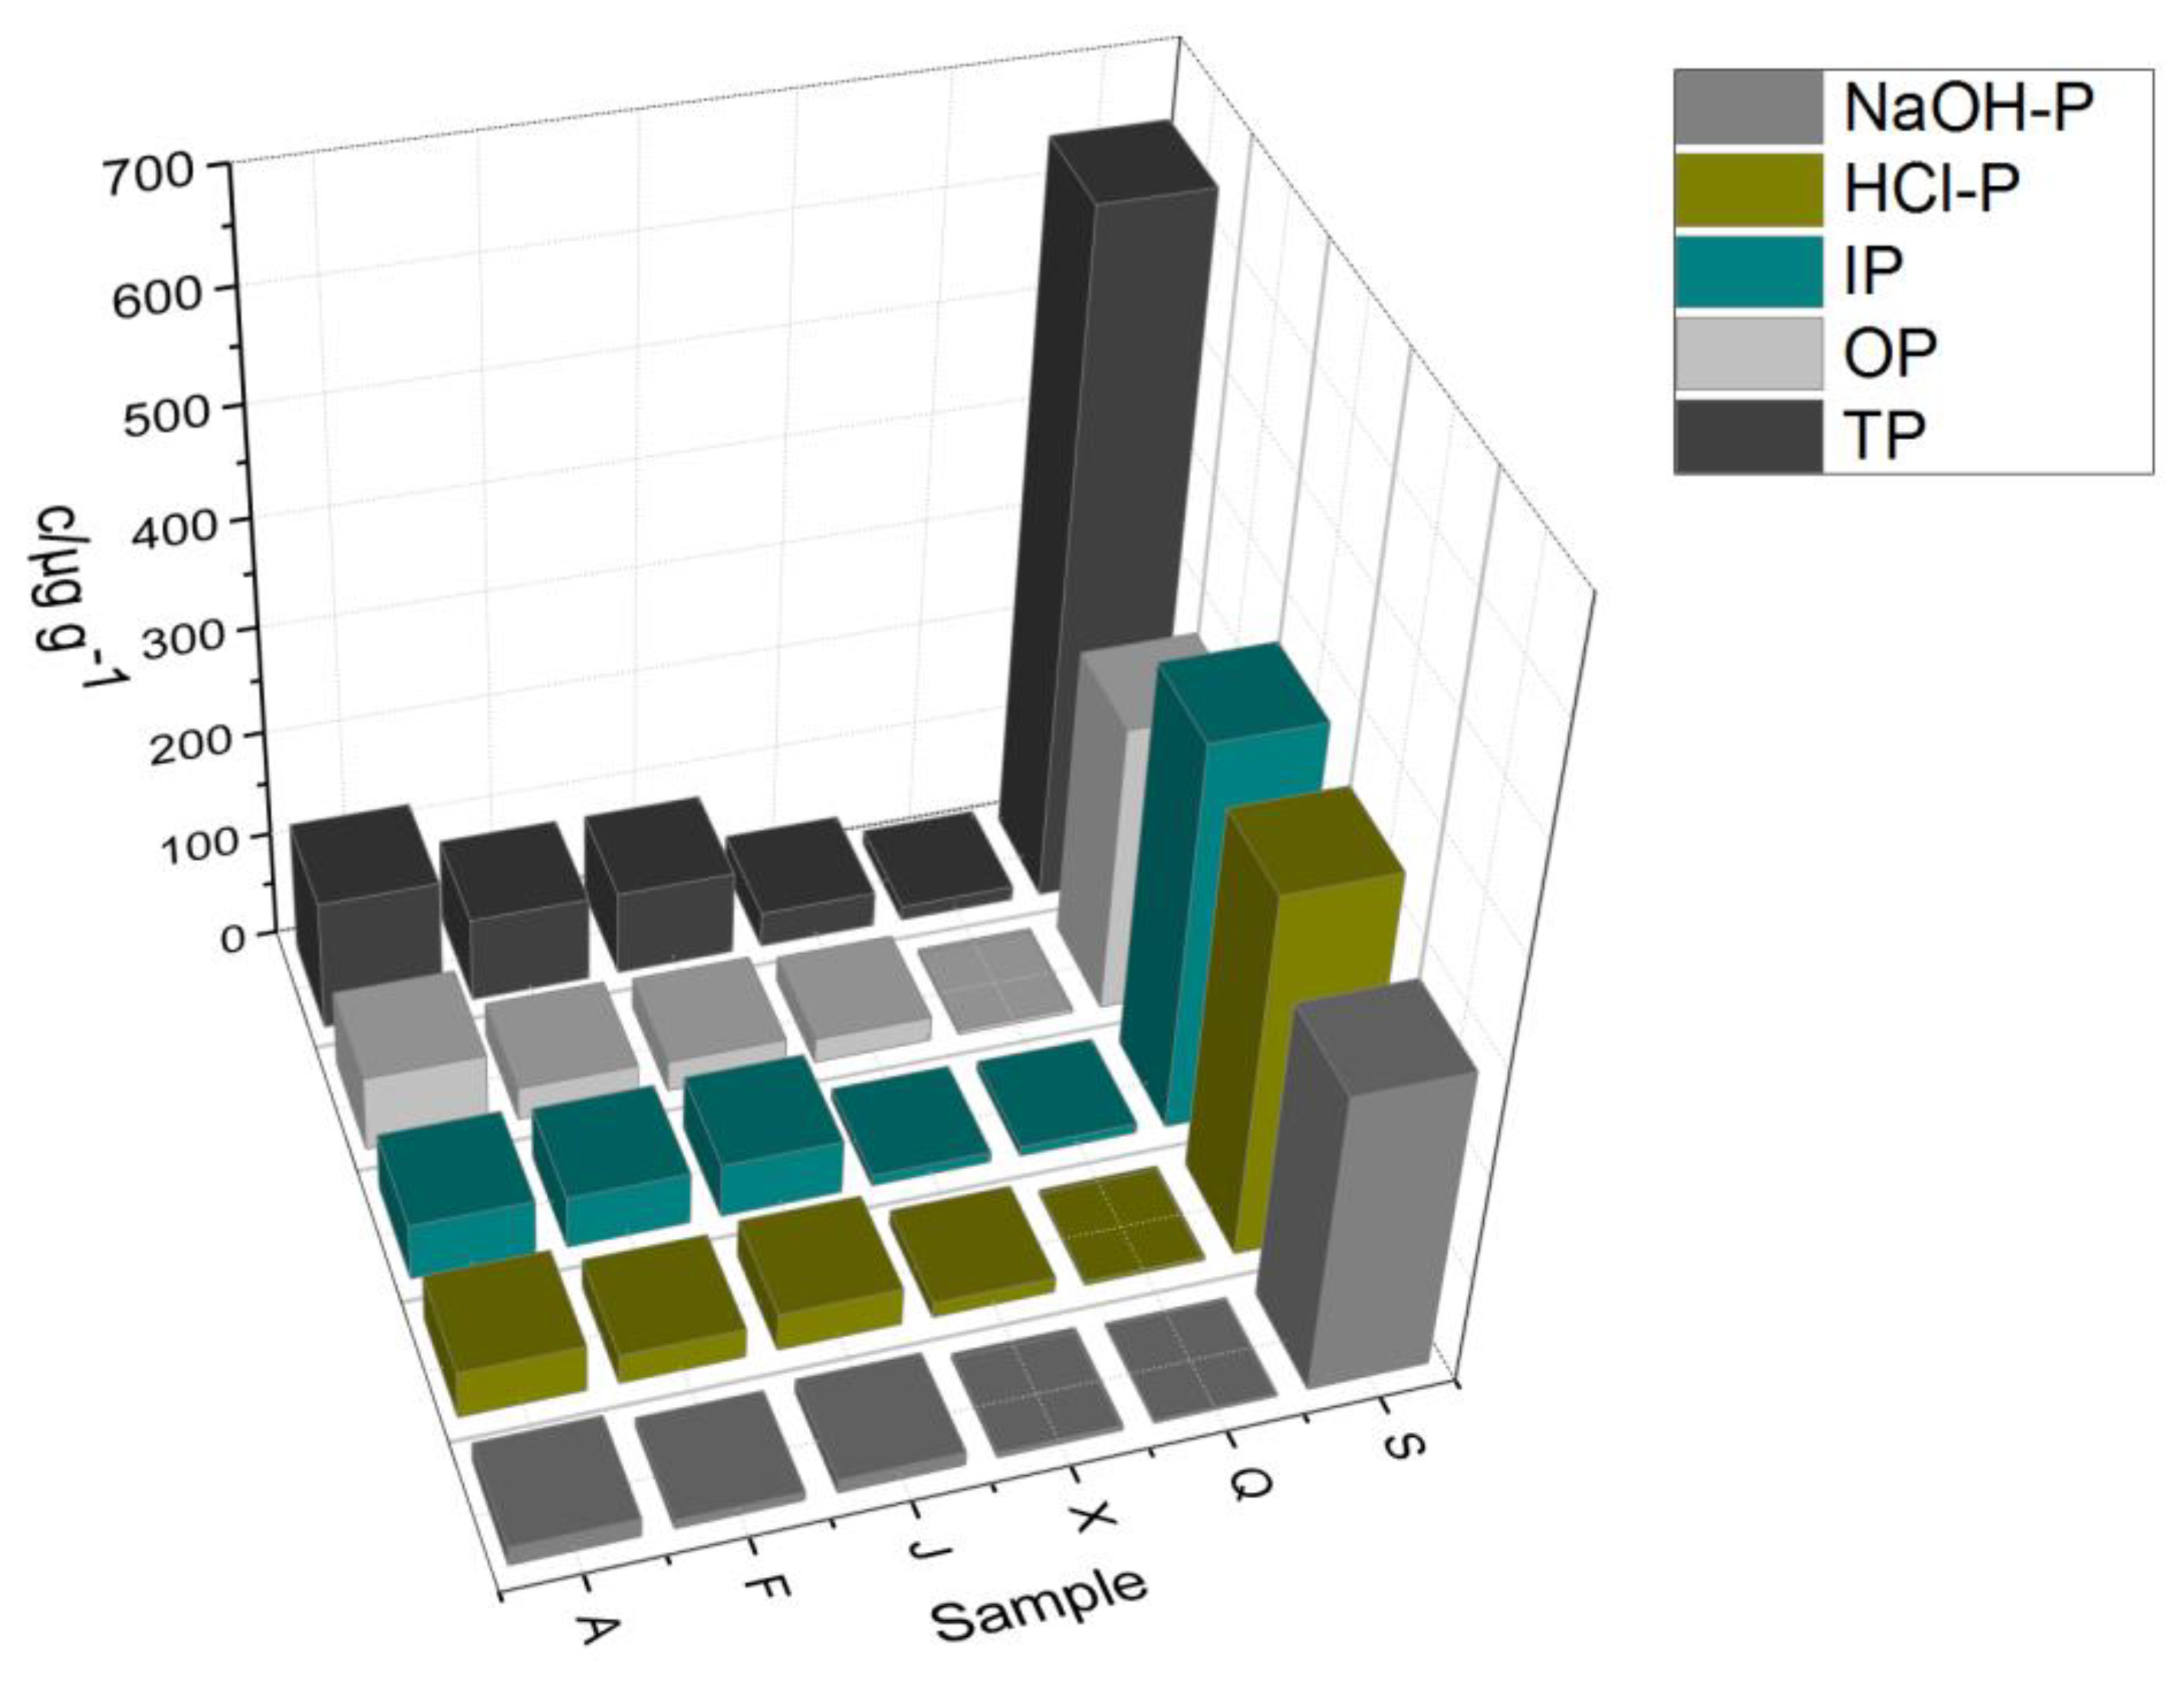
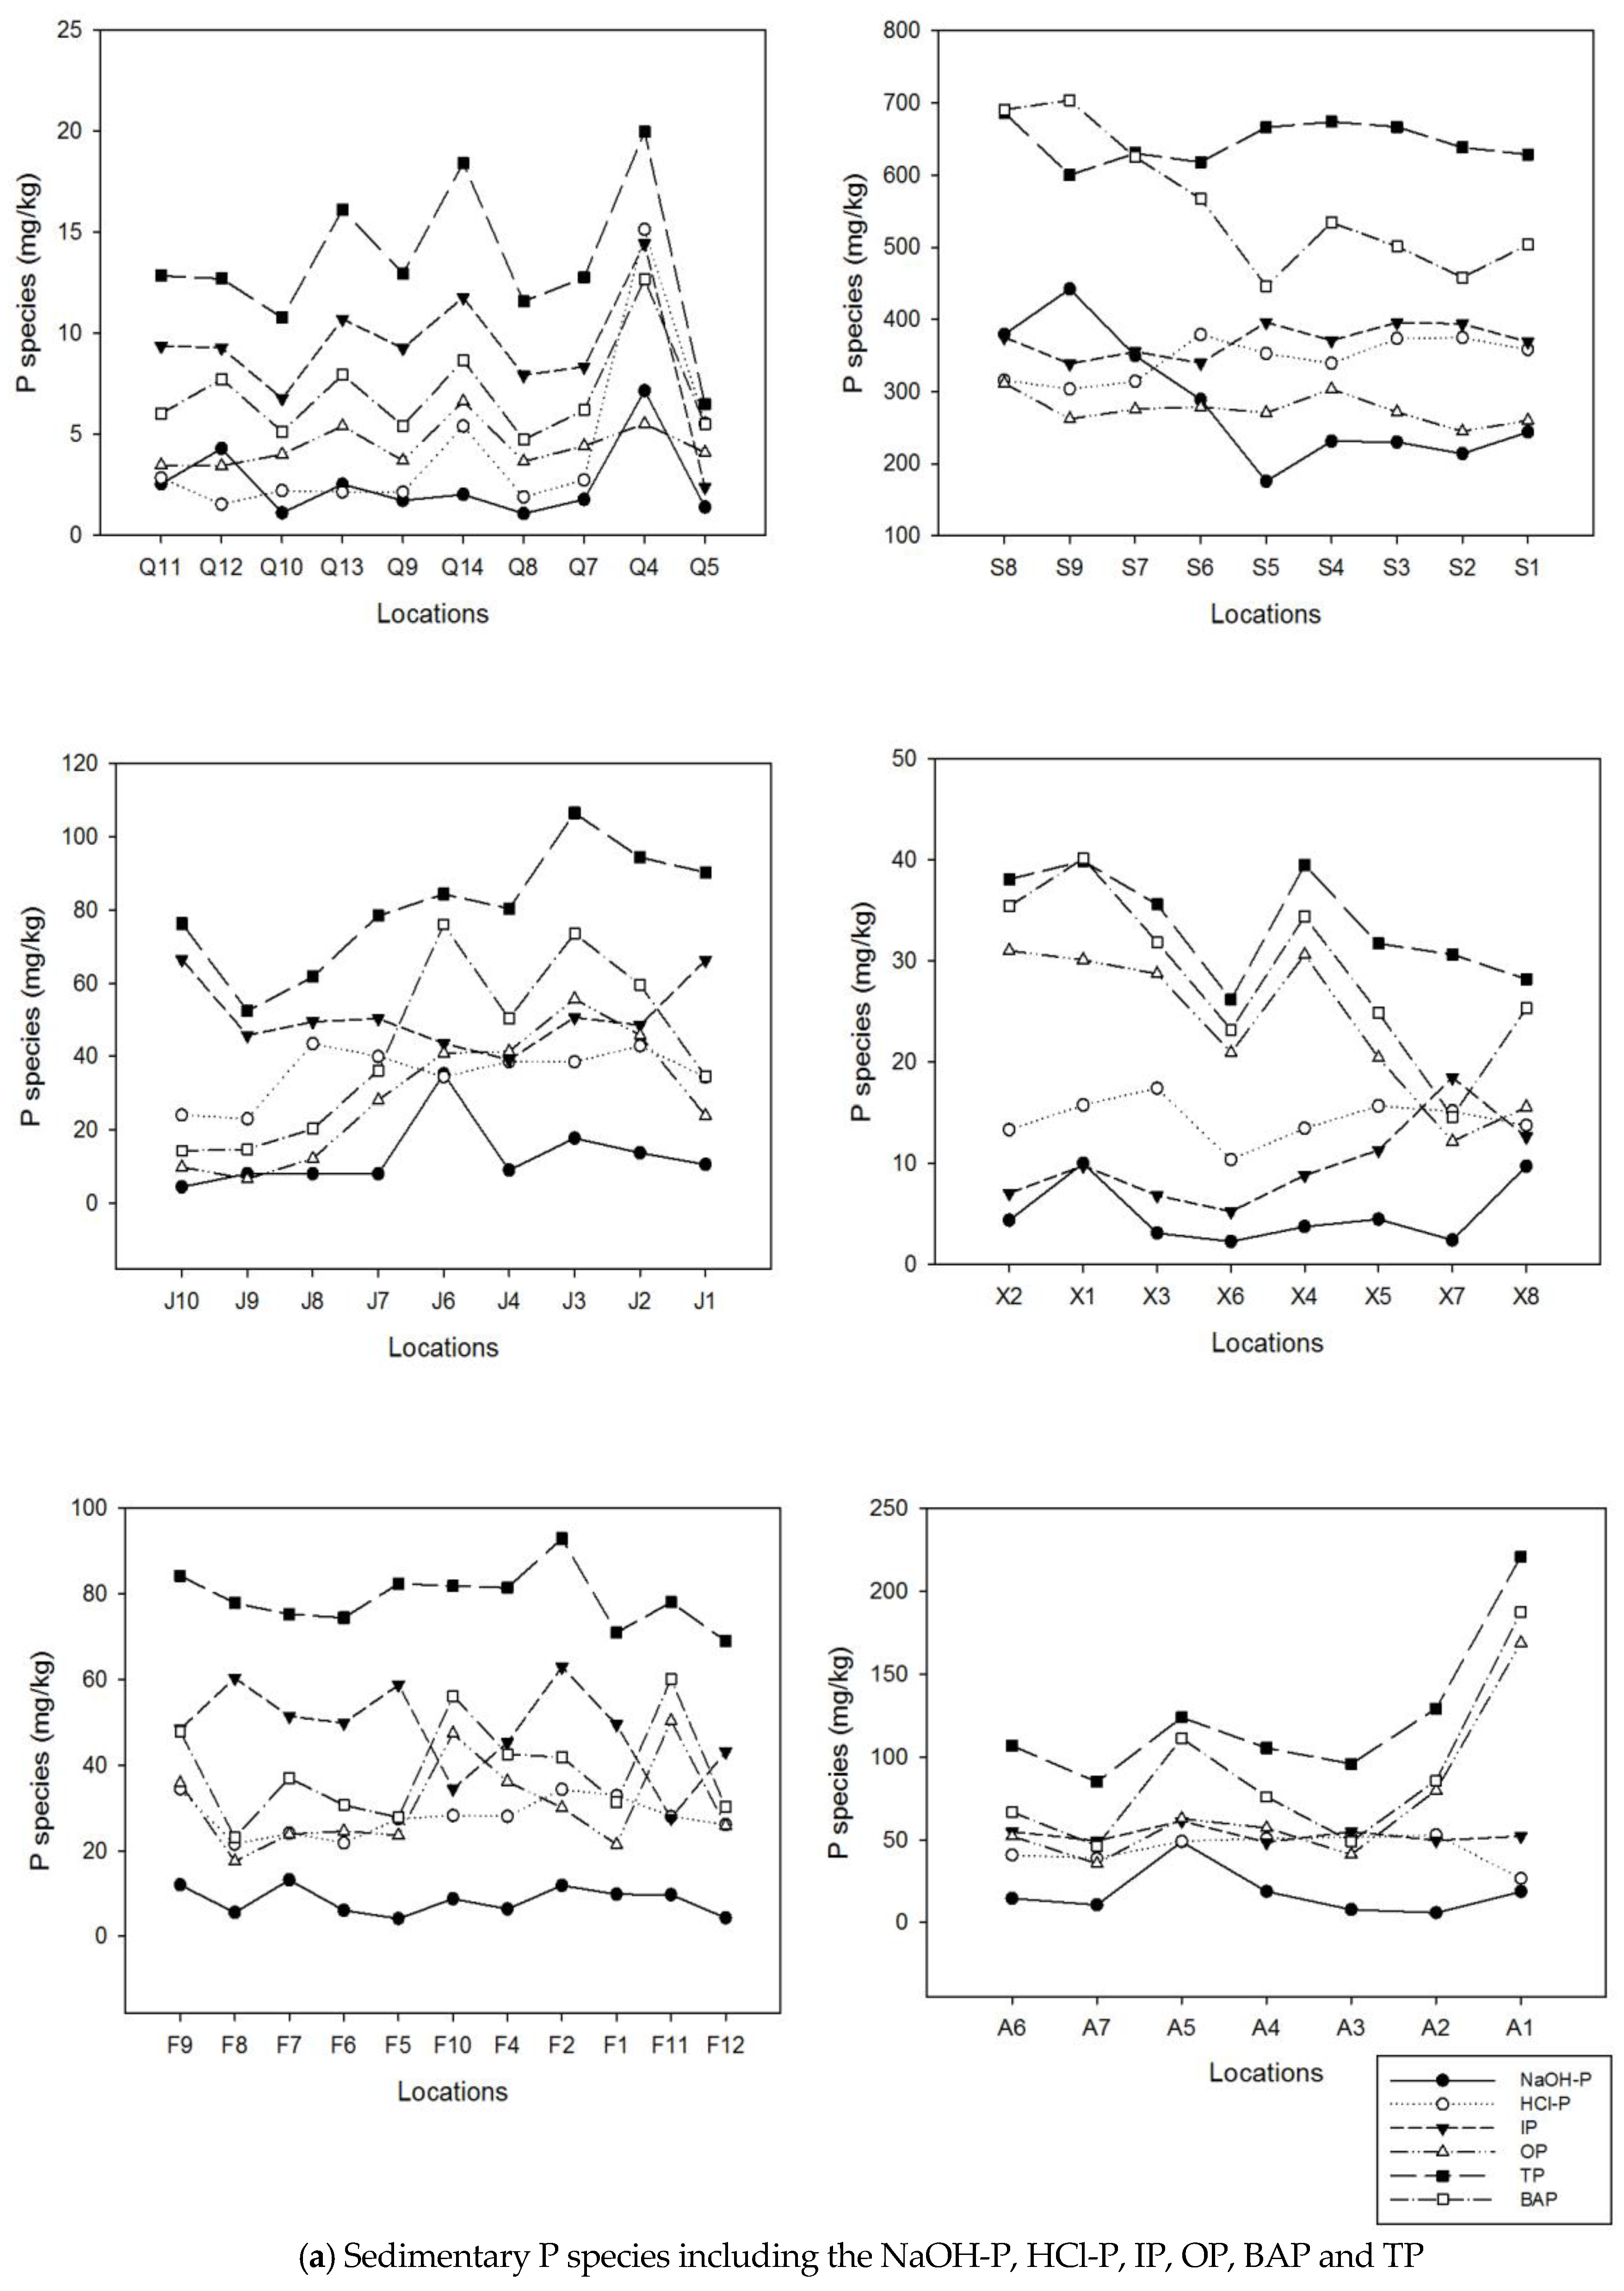
3.2. Sedimentary P Species
4. Discussion
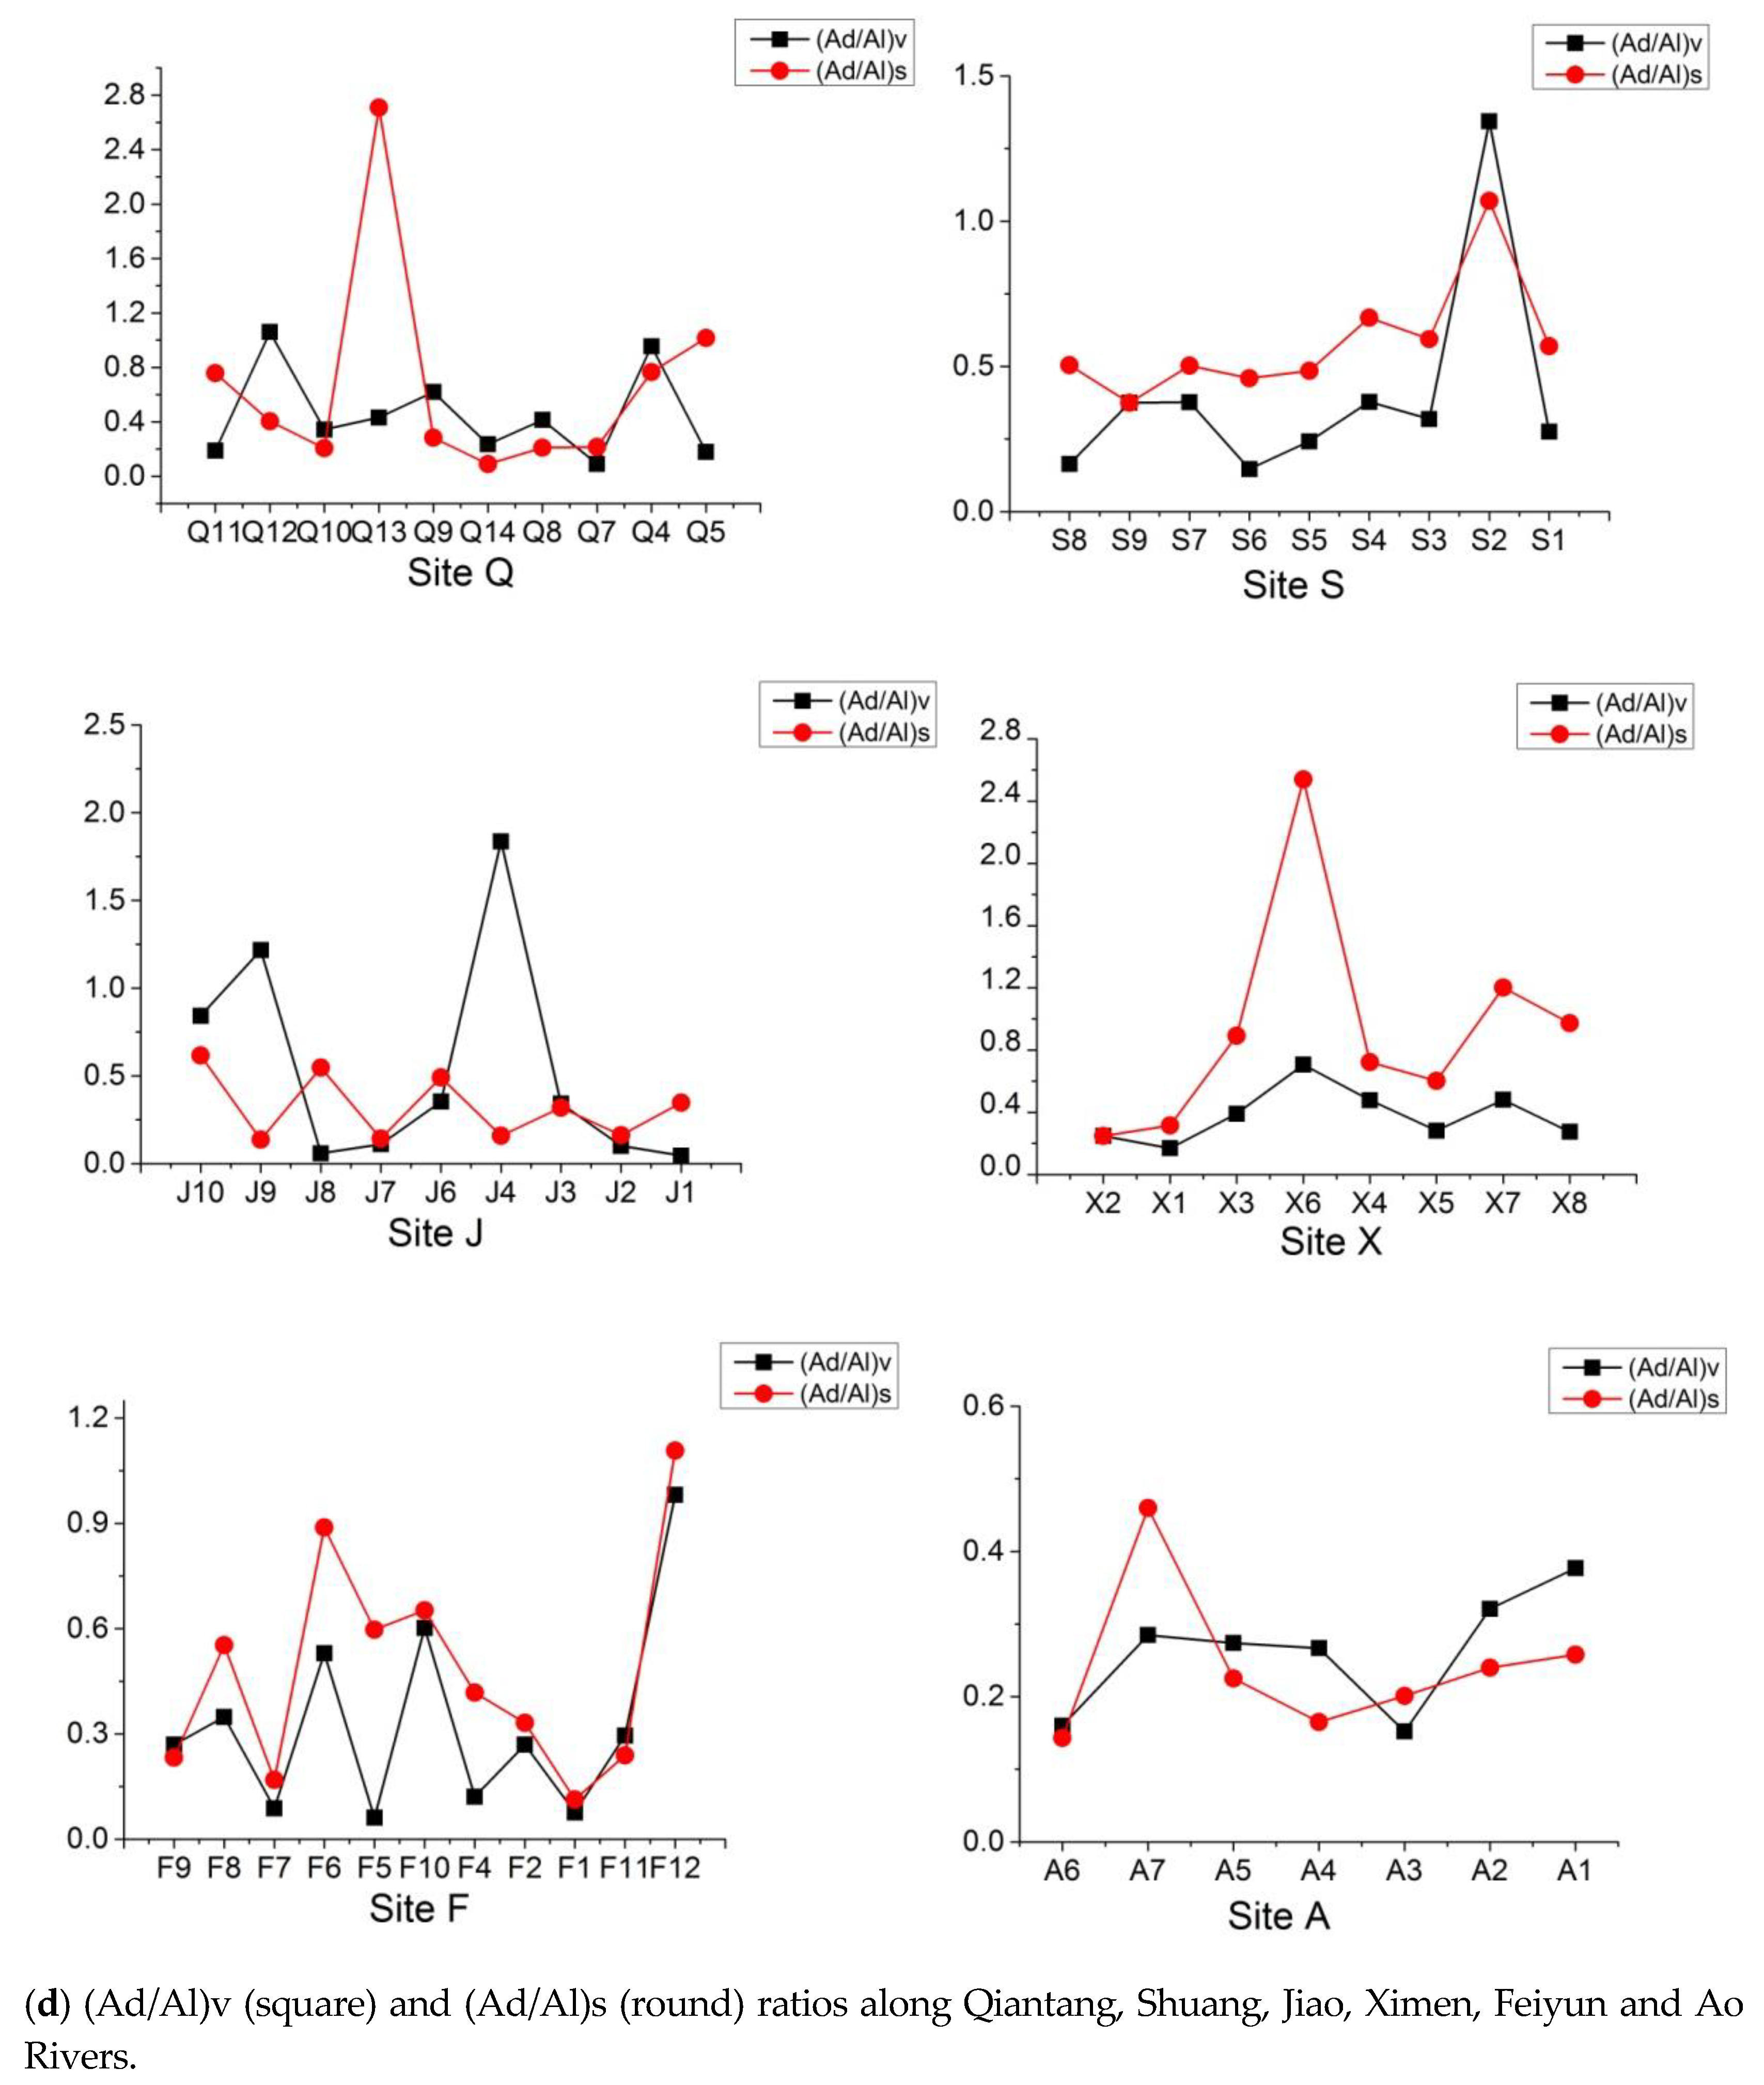
4.1. Sources of Sedimentary Organic Matter
4.2. P Pollution
4.3. Dynamics of Sedimentary Organic Matter and P
5. Conclusions
Author Contributions
Funding
Acknowledgments
Conflicts of Interest
Appendix A

| Date | Station | Longitude (°) | Latitude (°) | Date | Station | Longitude (°) | Latitude (°) |
|---|---|---|---|---|---|---|---|
| 2014.10.16 | A1 | 120.6009 | 27.5884 | 2014.10.18 | J1 | 121.4632 | 28.6900 |
| Ao River | A2 | 120.5952 | 27.5901 | Jiao River | J2 | 121.4511 | 28.6930 |
| A3 | 120.5827 | 27.5873 | J3 | 121.4421 | 28.6958 | ||
| A4 | 120.5725 | 27.5803 | J4 | 121.4265 | 28.6992 | ||
| A5 | 120.5620 | 27.5793 | J5 | 121.4206 | 28.6991 | ||
| A6 | 120.5546 | 27.5864 | J6 | 121.4115 | 28.7001 | ||
| A7 | 120.5562 | 27.5879 | J7 | 121.3905 | 28.7028 | ||
| 2014.10.17 | F1 | 120.6456 | 27.7355 | J8 | 121.3928 | 28.7014 | |
| Feiyun River | F2 | 120.6371 | 27.7426 | J9 | 121.3675 | 28.7036 | |
| F4 | 120.6242 | 27.7604 | J10 | 121.3522 | 28.7058 | ||
| F5 | 120.6200 | 27.7664 | 2014.10.19 | S1 | 121.5572 | 29.2164 | |
| F6 | 120.6170 | 27.7734 | Shuang River | S2 | 121.5702 | 29.1933 | |
| F7 | 120.6193 | 27.7807 | S3 | 121.5905 | 29.1744 | ||
| F8 | 120.6170 | 27.7877 | S4 | 121.6085 | 29.1631 | ||
| F9 | 120.6130 | 27.7924 | S5 | 121.6238 | 29.1669 | ||
| F10 | 120.6282 | 27.7703 | S6 | 121.6252 | 29.1808 | ||
| F11 | 120.6455 | 27.7341 | S7 | 121.6253 | 29.1883 | ||
| F12 | 120.6526 | 27.7275 | S8 | 121.6073 | 29.1961 | ||
| 2014.10.18 | X1 | 121.2078 | 28.3264 | S9 | 121.6217 | 29.1997 | |
| Ximen Island | X2 | 121.2127 | 28.3306 | 2014.10.20 | Q4 | 120.4421 | 30.3903 |
| X3 | 121.2166 | 28.3261 | Qiantang River | Q5 | 120.4533 | 30.3921 | |
| X4 | 121.2144 | 28.3194 | Q7 | 120.4224 | 30.3635 | ||
| X5 | 121.2121 | 28.3118 | Q8 | 120.4176 | 30.3520 | ||
| X6 | 121.2085 | 28.3193 | Q9 | 120.4128 | 30.3405 | ||
| X7 | 121.2103 | 28.3082 | Q10 | 120.4067 | 30.3266 | ||
| X8 | 121.2112 | 28.3035 | Q11 | 120.4019 | 30.3133 | ||
| Q12 | 120.4185 | 30.3074 | |||||
| Q13 | 120.4244 | 30.3185 | |||||
| Q14 | 120.4292 | 30.3308 |
| (a) Qiantang River (Q) | ||||||||||||
| Qiantang | S (mg/g) | V (mg/g) | C (mg/g) | Total (mg/g) | S/V | C/V | (Ad/Al)v | (Ad/Al)s | TOC (%) | TN (%) | C/N | Λ (mg/100 mg TOC) |
| Q11 | 0.007 | 0.004 | 0.009 | 0.020 | 1.750 | 2.250 | 0.188 | 0.757 | 2.66 | 0.53 | 5.9 | 0.075 |
| Q12 | 0.006 | 0.002 | 0.005 | 0.013 | 3.000 | 2.500 | 1.060 | 0.403 | 1.74 | 0.35 | 5.8 | 0.075 |
| Q10 | 0.042 | 0.002 | 0.005 | 0.049 | 21.000 | 2.500 | 0.343 | 0.206 | 2.63 | 0.52 | 5.9 | 0.186 |
| Q13 | 0.005 | 0.004 | 0.004 | 0.013 | 1.250 | 1.000 | 0.432 | 2.709 | 1.05 | 0.21 | 5.8 | 0.124 |
| Q9 | 0.074 | 0.002 | 0.016 | 0.092 | 37.000 | 8.000 | 0.619 | 0.283 | 6.46 | 1.36 | 5.5 | 0.142 |
| Q14 | 0.022 | 0.002 | 0.003 | 0.027 | 11.000 | 1.500 | 0.235 | 0.088 | 1.81 | 0.33 | 6.3 | 0.149 |
| Q8 | 0.037 | 0.003 | 0.002 | 0.042 | 12.333 | 0.667 | 0.414 | 0.209 | 4.06 | 0.83 | 5.7 | 0.103 |
| Q7 | 0.037 | 0.004 | 0.002 | 0.043 | 9.250 | 0.500 | 0.091 | 0.216 | 3.49 | 0.40 | 10.3 | 0.123 |
| Q4 | 0.047 | 0.037 | 0.018 | 0.102 | 1.270 | 0.486 | 0.955 | 0.765 | ||||
| Q5 | 0.006 | 0.008 | 0.011 | 0.025 | 0.750 | 1.375 | 0.178 | 1.016 | 2.04 | 0.38 | 6.3 | 0.123 |
| Mean | 0.028 | 0.007 | 0.008 | 0.043 | 9.860 | 2.078 | 0.451 | 0.665 | 2.88 | 0.55 | 6.4 | 0.122 |
| (b) Shuang River (S) | ||||||||||||
| Shuang | S (mg/g) | V (mg/g) | C (mg/g) | Total (mg/g) | S/V | C/V | (Ad/Al)v | (Ad/Al)s | TOC (%) | TN (%) | C/N | Λ (mg/100 mg TOC) |
| S8 | 0.018 | 0.033 | 0.006 | 0.057 | 0.545 | 0.182 | 0.164 | 0.504 | 0.97 | 0.20 | 5.6 | 0.588 |
| S9 | 0.043 | 0.042 | 0.012 | 0.097 | 1.008 | 0.284 | 0.375 | 0.357 | 0.67 | 0.14 | 5.6 | 1.454 |
| S7 | 0.037 | 0.052 | 0.006 | 0.095 | 0.712 | 0.115 | 0.377 | 0.503 | 1.17 | 0.14 | 9.5 | 0.812 |
| S6 | 0.027 | 0.048 | 0.009 | 0.084 | 0.563 | 0.188 | 0.147 | 0.459 | 0.44 | 0.10 | 5.3 | 1.909 |
| S5 | 0.018 | 0.035 | 0.003 | 0.056 | 0.514 | 0.086 | 0.242 | 0.485 | 0.46 | 0.09 | 6.0 | 1.217 |
| S4 | 0.019 | 0.038 | 0.004 | 0.061 | 0.500 | 0.105 | 0.378 | 0.668 | 0.84 | 0.19 | 5.0 | 0.726 |
| S3 | 0.024 | 0.035 | 0.004 | 0.063 | 0.686 | 0.114 | 0.319 | 0.594 | 0.90 | 0.14 | 7.5 | 0.700 |
| S2 | 0.043 | 0.049 | 0.001 | 0.093 | 0.878 | 0.020 | 1.344 | 1.070 | 0.90 | 0.09 | 11.0 | 1.033 |
| S1 | 0.043 | 0.042 | 0.006 | 0.091 | 1.024 | 0.143 | 0.275 | 0.570 | 2.77 | 0.44 | 7.3 | 0.329 |
| Mean | 0.030 | 0.042 | 0.006 | 0.077 | 0.714 | 0.137 | 0.402 | 0.579 | 1.01 | 0.17 | 7.0 | 0.974 |
| (c) Jiao River (J) | ||||||||||||
| Jiao | S (mg/g) | V (mg/g) | C (mg/g) | Total (mg/g) | S/V | C/V | (Ad/Al)v | (Ad/Al)s | TOC (%) | TN (%) | C/N | Λ (mg/100 mg TOC) |
| J10 | 0.008 | 0.018 | 0.006 | 0.032 | 0.444 | 0.333 | 0.842 | 0.616 | 0.62 | 0.10 | 7.1 | 0.516 |
| J9 | 0.026 | 0.019 | 0.004 | 0.049 | 1.368 | 0.211 | 1.217 | 0.136 | 0.65 | 0.11 | 7.1 | 0.754 |
| J7 | 0.019 | 0.030 | 0.005 | 0.054 | 0.633 | 0.167 | 0.058 | 0.547 | 0.63 | 0.11 | 7.0 | 0.857 |
| J8 | 0.028 | 0.008 | 0.003 | 0.039 | 3.500 | 0.375 | 0.110 | 0.143 | 0.67 | 0.11 | 7.3 | 0.582 |
| J6 | 0.080 | 0.090 | 0.008 | 0.178 | 0.889 | 0.089 | 0.353 | 0.491 | 0.65 | 0.11 | 7.2 | 2.738 |
| J4 | 0.090 | 0.141 | 0.037 | 0.268 | 0.638 | 0.262 | 1.837 | 0.158 | 0.68 | 0.11 | 7.4 | 3.941 |
| J3 | 0.052 | 0.050 | 0.011 | 0.113 | 1.040 | 0.220 | 0.342 | 0.319 | 0.58 | 0.08 | 8.0 | 1.948 |
| J2 | 0.055 | 0.066 | 0.009 | 0.13 | 0.833 | 0.136 | 0.101 | 0.161 | 0.64 | 0.09 | 8.1 | 2.031 |
| J1 | 0.021 | 0.019 | 0.008 | 0.048 | 1.105 | 0.421 | 0.045 | 0.346 | 0.62 | 0.09 | 8.0 | 0.774 |
| Mean | 0.042 | 0.049 | 0.010 | 0.101 | 1.161 | 0.246 | 0.545 | 0.324 | 0.64 | 0.10 | 7.5 | 1.571 |
| (d) Ximen Island (X) | ||||||||||||
| Ximen | S (mg/g) | V (mg/g) | C (mg/g) | Total (mg/g) | S/V | C/V | (Ad/Al)v | (Ad/Al)s | TOC (%) | TN (%) | C/N | Λ (mg/100 mg TOC) |
| X2 | 0.041 | 0.051 | 0.007 | 0.099 | 0.804 | 0.137 | 0.249 | 0.249 | 0.55 | 0.11 | 6.0 | 1.800 |
| X1 | 0.036 | 0.038 | 0.015 | 0.089 | 0.947 | 0.395 | 0.170 | 0.316 | 0.48 | 0.09 | 6.0 | 1.854 |
| X3 | 0.043 | 0.062 | 0.021 | 0.126 | 0.694 | 0.339 | 0.391 | 0.892 | 0.74 | 0.14 | 6.3 | 1.703 |
| X6 | 0.011 | 0.013 | 0.005 | 0.029 | 0.846 | 0.385 | 0.706 | 2.540 | 0.81 | 0.14 | 6.9 | 0.358 |
| X4 | 0.033 | 0.043 | 0.008 | 0.084 | 0.767 | 0.186 | 0.478 | 0.722 | 0.64 | 0.11 | 6.7 | 1.313 |
| X5 | 0.033 | 0.056 | 0.016 | 0.105 | 0.589 | 0.286 | 0.282 | 0.603 | 0.77 | 0.13 | 6.8 | 1.364 |
| X7 | 0.032 | 0.036 | 0.008 | 0.076 | 0.889 | 0.222 | 0.481 | 1.203 | 0.63 | 0.10 | 7.2 | 1.206 |
| X8 | 0.040 | 0.041 | 0.009 | 0.090 | 0.976 | 0.220 | 0.275 | 0.973 | 0.29 | 0.06 | 5.4 | 3.103 |
| Mean | 0.034 | 0.043 | 0.011 | 0.087 | 0.814 | 0.271 | 0.379 | 0.937 | 0.61 | 0.11 | 6.4 | 1.588 |
| (e) Feiyun River (F) | ||||||||||||
| Feiyun | S (mg/g) | V (mg/g) | C (mg/g) | Total (mg/g) | S/V | C/V | (Ad/Al)v | (Ad/Al)s | TOC (%) | TN (%) | C/N | Λ (mg/100 mg TOC) |
| F9 | 0.053 ± 0.0065 | 0.067 ± 0.0113 | 0.016 ± 0.0062 | 0.137 | 0.798 ± 0.0497 | 0.244 ± 0.0749 | 0.269 ± 0.1485 | 0.232 ± 0.0842 | 0.60 | 0.09 | 8.1 | 2.294 |
| F8 | 0.013 | 0.028 | 0.008 | 0.049 | 0.464 | 0.286 | 0.348 | 0.553 | 0.64 | 0.09 | 8.7 | 0.766 |
| F7 | 0.031 | 0.034 | 0.011 | 0.076 | 0.912 | 0.324 | 0.088 | 0.169 | 0.65 | 0.09 | 8.6 | 1.169 |
| F6 | 0.053 | 0.061 | 0.009 | 0.123 | 0.869 | 0.148 | 0.530 | 0.888 | 0.68 | 0.09 | 8.8 | 1.809 |
| F5 | 0.010 | 0.008 | 0.008 | 0.026 | 1.250 | 1.000 | 0.061 | 0.597 | 0.80 | 0.10 | 9.5 | 0.325 |
| F10 | 0.030 | 0.054 | 0.006 | 0.090 | 0.556 | 0.111 | 0.602 | 0.652 | 0.67 | 0.10 | 8.1 | 1.343 |
| F4 | 0.016 | 0.027 | 0.004 | 0.047 | 0.593 | 0.148 | 0.121 | 0.417 | 0.67 | 0.09 | 8.7 | 0.701 |
| F2 | 0.030 | 0.043 | 0.008 | 0.081 | 0.698 | 0.186 | 0.269 | 0.331 | 0.71 | 0.10 | 8.6 | 1.141 |
| F1 | 0.067 | 0.067 | 0.024 | 0.158 | 1.000 | 0.358 | 0.076 | 0.113 | 0.76 | 0.10 | 9.3 | 2.079 |
| F11 | 0.108 | 0.109 | 0.016 | 0.233 | 0.991 | 0.147 | 0.295 | 0.239 | 0.55 | 0.08 | 7.7 | 4.236 |
| F12 | 0.007 | 0.028 | 0.003 | 0.038 | 0.250 | 0.107 | 0.981 | 1.107 | 0.68 | 0.10 | 7.8 | 0.559 |
| Mean | 0.038 | 0.048 | 0.010 | 0.096 | 0.762 | 0.278 | 0.331 | 0.482 | 0.67 | 0.09 | 8.5 | 1.493 |
| (f) Ao River (A) | ||||||||||||
| Ao | S (mg/g) | V (mg/g) | C (mg/g) | Total (mg/g) | S/V | C/V | (Ad/Al)v | (Ad/Al)s | TOC (%) | TN (%) | C/N | Λ (mg/100 mg TOC) |
| A6 | 0.042 | 0.054 | 0.020 | 0.116 | 0.778 | 0.370 | 0.160 | 0.143 | 0.68 | 0.09 | 8.6 | 1.706 |
| A7 | 0.036 | 0.035 | 0.008 | 0.079 | 1.029 | 0.229 | 0.285 | 0.460 | 0.60 | 0.09 | 8.0 | 1.317 |
| A5 | 0.039 | 0.045 | 0.011 | 0.095 | 0.867 | 0.244 | 0.274 | 0.225 | 0.68 | 0.09 | 8.7 | 1.397 |
| A4 | 0.045 | 0.067 | 0.015 | 0.127 | 0.672 | 0.224 | 0.267 | 0.165 | 1.03 | 0.15 | 7.8 | 1.233 |
| A3 | 0.011 | 0.013 | 0.009 | 0.033 | 0.846 | 0.692 | 0.152 | 0.201 | 1.35 | 0.20 | 8.0 | 0.244 |
| A2 | 0.018 | 0.013 | 0.009 | 0.040 | 1.385 | 0.692 | 0.321 | 0.240 | 0.98 | 0.19 | 6.0 | 0.408 |
| A1 | 0.041 | 0.050 | 0.010 | 0.101 | 0.820 | 0.200 | 0.377 | 0.258 | 0.64 | 0.09 | 8.1 | 1.578 |
| Mean | 0.033 | 0.040 | 0.012 | 0.084 | 0.914 | 0.379 | 0.262 | 0.242 | 0.85 | 0.13 | 7.9 | 1.126 |
| (a) Qiantang River (Q): N = 10 | ||||||||
| Q | S/V | C/V | (Ad/Al)V | (Ad/Al)S | Λ | TOC | TN | C/N |
| S/V | 1 | 0.692 * | −0.031 | −0.669 * | 0.501 | 0.861 ** | 0.871 ** | 0.124 |
| C/V | 1 | 0.261 | −0.171 | 0.009 | 0.661 | 0.764 * | −0.393 | |
| (Ad/Al)V | 1 | 0.344 | −0.387 | 0.058 | 0.199 | −0.468 | ||
| (Ad/Al)S | 1 | −0.490 | −0.545 | −0.439 | −0.287 | |||
| Λ | 1 | 0.127 | 0.112 | 0.054 | ||||
| TOC | 1 | 0.954 ** | 0.037 | |||||
| TN | 1 | −0.262 | ||||||
| C/N | 1 | |||||||
| (b) Shuang River (S): N = 9 | ||||||||
| S | S/V | C/V | (Ad/Al)V | (Ad/Al)S | Λ | TOC | TN | C/N |
| S/V | 1 | −0.209 | 0.464 | 0.446 | −0.396 | 0.779 * | 0.572 | 0.664 |
| C/V | 1 | −0.723 * | −0.656 | 0.144 | 0.006 | 0.227 | −0.683 * | |
| (Ad/Al)V | 1 | 0.967 ** | −0.026 | −0.024 | −0.225 | 0.778 * | ||
| (Ad/Al)S | 1 | −0.112 | 0.020 | −0.152 | 0.646 | |||
| Λ | 1 | −0.704 * | −0.681 * | −0.212 | ||||
| TOC | 1 | 0.939 * | 0.243 | |||||
| TN | 1 | −0.094 | ||||||
| C/N | 1 | |||||||
| (c) Jiao River (J): N = 9 | ||||||||
| J | S/V | C/V | (Ad/Al)V | (Ad/Al)S | Λ | TOC | TN | C/N |
| S/V | 1 | 0.265 | −0.203 | −0.367 | −0.260 | 0.454 | 0.351 | −0.166 |
| C/V | 1 | 0.040 | 0.312 | −0.460 | −0.024 | −0.127 | 0.108 | |
| (Ad/Al)V | 1 | 0.110 | 0.514 | 0.429 | 0.374 | −0.336 | ||
| (Ad/Al)S | 1 | −0.362 | −0.306 | −0.106 | −0.255 | |||
| Λ | 1 | 0.382 | 0.140 | 0.110 | ||||
| TOC | 1 | 0.796 * | −0.423 | |||||
| TN | 1 | −0.865 ** | ||||||
| C/N | 1 | |||||||
| (d) Ximen Island (X): N = 8 | ||||||||
| X | S/V | C/V | (Ad/Al)V | (Ad/Al)S | Λ | TOC | TN | C/N |
| S/V | 1 | −0.056 | 0.457 | 0.544 | 0.263 | −0.347 | −0.462 | −0.031 |
| C/V | 1 | 0.076 | 0.394 | −0.241 | 0.288 | 0.299 | 0.070 | |
| (Ad/Al)V | 1 | 0.843 ** | −0.655 | 0.602 | 0.505 | 0.662 | ||
| (Ad/Al)S | 1 | −0.519 | 0.388 | 0.321 | 0.391 | |||
| Λ | 1 | −0.845 ** | −0.766 * | −0.831 * | ||||
| TOC | 1 | 0.961 ** | 0.800 ** | |||||
| TN | 1 | 0.618 | ||||||
| C/N | 1 | |||||||
| (e) Feiyun River (F): N = 11 | ||||||||
| F | S/V | C/V | (Ad/Al)V | (Ad/Al)S | Λ | TOC | TN | C/N |
| S/V | 1 | 0.590 | −0.490 | −0.376 | 0.396 | 0.207 | −0.258 | 0.433 |
| C/V | 1 | −0.523 | −0.158 | −0.335 | 0.639 * | 0.290 | 0.710 * | |
| (Ad/Al)V | 1 | 0.798 ** | −0.070 | −0.183 | 0.204 | −0.603 * | ||
| (Ad/Al)S | 1 | −0.497 | 0.220 | 0.416 | −0.168 | |||
| Λ | 1 | −0.632 * | −0.655 * | −0.455 | ||||
| TOC | 1 | 0.810 ** | 0.806 ** | |||||
| TN | 1 | 0.378 | ||||||
| C/N | 1 | |||||||
| (f) Ao River (A): N = 7 | ||||||||
| A | S/V | C/V | (Ad/Al)V | (Ad/Al)S | Λ | TOC | TN | C/N |
| S/V | 1 | −0.221 | 0.560 | 0.193 | 0.157 | −0.628 | −0.341 | −0.364 |
| C/V | 1 | −0.397 | 0.485 | −0.888 ** | 0.742 | 0.844 * | −0.574 | |
| (Ad/Al)V | 1 | −0.001 | 0.176 | −0.449 | −0.242 | −0.365 | ||
| (Ad/Al)S | 1 | −0.636 | 0.226 | 0.377 | −0.376 | |||
| Λ | 1 | −0.825 * | −0.931 ** | −0.666 | ||||
| TOC | 1 | 0.931 ** | −0.360 | |||||
| TN | 1 | −0.688 | ||||||
| C/N | 1 | |||||||
| (a) Qiantang River (Q) | ||||||||
| Locs | Concentration of P fraction (mg/kg) | OC (%) | OC/OP molar ratio | |||||
| NaOH-P | HCl-P | IP | OP | TP | BAP | |||
| Q11 | 2.55 | 2.85 | 9.37 | 3.48 | 12.85 | 6.03 | 2.66 | 19741 |
| Q12 | 4.30 | 1.54 | 9.28 | 3.44 | 12.72 | 7.74 | 1.74 | 13050 |
| Q10 | 1.12 | 2.21 | 6.77 | 4.01 | 10.78 | 5.13 | 2.63 | 16921 |
| Q13 | 2.53 | 2.15 | 10.71 | 5.41 | 16.12 | 7.94 | 1.05 | 5005 |
| Q9 | 1.73 | 2.14 | 9.26 | 3.70 | 12.96 | 5.43 | 6.46 | 45130 |
| Q14 | 2.03 | 5.41 | 11.79 | 6.63 | 18.42 | 8.66 | 1.81 | 7050 |
| Q8 | 1.08 | 1.90 | 7.93 | 3.66 | 11.59 | 4.74 | 4.06 | 28621 |
| Q7 | 1.78 ± 0.24 | 2.74 ± 1.29 | 8.35 ± 0.14 | 4.42 ± 0.59 | 12.77 | 6.20 | 3.49 | 20410 |
| Q4 | 7.16 | 15.1480 | 14.45 | 5.53 | 19.98 | 12.69 | ||
| Q5 | 1.40 | 5.5449 | 2.39 | 4.10 | 6.49 | 5.50 | 2.04 | 12853 |
| Mean | 2.57 | 4.16 | 9.03 | 4.44 | 13.47 | 7.01 | 2.88 | 18753 |
| stdev | ± 1.87 | ± 4.11 | ± 3.18 | ± 1.07 | ± 3.87 | ± 2.39 | ± 1.63 | ± 12214 |
| (b) Shuang Creek (S) | ||||||||
| Locs | Concentration of P fraction (mg/kg) | OC (%) | OC/OP molar ratio | |||||
| NaOH-P | HCl-P | IP | OP | TP | BAP | |||
| S8 | 379.14 | 315.42 | 375.00 | 311.60 | 686.60 | 690.74 | 0.97 | 80 |
| S9 | 442.12 ± 17.41 | 303.34 ± 2.39 | 338.37 ± 2.80 | 261.85 ± 8.87 | 600.22 | 703.97 | 0.67 | 66 |
| S7 | 349.51 | 313.79 | 354.98 | 275.26 | 630.24 | 624.77 | 0.71 | 66 |
| S6 | 288.74 | 378.91 | 339.34 | 278.53 | 617.87 | 567.27 | 0.44 | 41 |
| S5 | 175.60 | 352.34 | 395.93 | 270.21 | 666.14 | 445.81 | 0.46 | 44 |
| S4 | 231.12 | 339.26 | 370.65 | 303.27 | 673.92 | 534.39 | 0.84 | 72 |
| S3 | 229.94 | 373.42 | 395.53 | 271.49 | 667.02 | 501.43 | 0.73 | 70 |
| S2 | 213.81 | 374.51 | 393.66 | 244.55 | 638.21 | 458.36 | 0.90 | 95 |
| S1 | 243.64 | 358.08 | 368.59 | 259.95 | 628.54 | 503.59 | 2.77 | 275 |
| Mean | 283.74 | 345.45 | 370.23 | 275.19 | 645.42 | 558.93 | 0.94 | 90 |
| Stdev | ± 88.31 | ± 28.87 | ± 22.57 | ± 20.95 | ± 29.10 | ± 95.33 | ± 0.71 | ± 71 |
| (c) Jiao River (J) | ||||||||
| Locs | Concentration of P fraction (mg/kg) | OC (%) | OC/OP molar ratio | |||||
| NaOH-P | HCl-P | IP | OP | TP | BAP | |||
| J10 | 4.48 | 24.12 | 66.50 | 9.87 | 76.37 | 14.35 | 0.62 | 1629 |
| J9 | 8.11 | 23.07 | 45.83 | 6.68 | 52.51 | 14.79 | 0.65 | 2507 |
| J8 | 8.11 | 43.48 | 49.54 | 12.25 | 61.79 | 20.36 | 0.67 | 1406 |
| J7 | 8.06 | 39.97 | 50.42 | 28.06 | 78.48 | 36.12 | 0.63 | 579 |
| J6 | 35.22 ± 10.85 | 34.43 ± 5.74 | 43.56 ± 6.54 | 40.87 ± 5.06 | 84.43 | 76.09 | 0.65 | 411 |
| J4 | 9.05 | 38.56 | 39.09 | 41.37 | 80.46 | 50.42 | 0.68 | 422 |
| J3 | 17.81 | 38.50 | 50.73 | 55.81 | 106.54 | 73.62 | 0.58 | 268 |
| J2 | 13.79 | 42.85 | 48.59 | 45.83 | 94.42 | 59.62 | 0.64 | 360 |
| J1 | 10.62 | 34.38 | 66.35 | 23.98 | 90.33 | 34.6 | 0.62 | 672 |
| Mean | 12.81 | 35.48 | 51.18 | 29.41 | 80.59 | 42.22 | 0.64 | 917 |
| stdev | ± 9.24 | ± 7.44 | ± 9.41 | ± 17.55 | ± 16.35 | ± 23.99 | ± 0.03 | ± 765 |
| (d) Ximen Island | ||||||||
| Locs | Concentration of P fraction (mg/kg) | OC (%) | OC/OP molar ratio | |||||
| NaOH-P | HCl-P | IP | OP | TP | BAP | |||
| X2 | 4.40 | 13.34 | 7.07 | 31.04 | 38.11 | 35.44 | 0.55 | 453 |
| X1 | 10.03 | 15.77 | 9.78 | 30.13 | 39.91 | 40.16 | 0.48 | 412 |
| X3 | 3.12 | 17.41 | 6.85 | 28.76 | 35.61 | 31.88 | 0.75 | 651 |
| X6 | 2.29 | 10.40 | 5.26 | 20.94 | 26.2 | 23.23 | 0.81 | 997 |
| X4 | 3.76 | 13.48 | 8.84 | 30.65 | 39.49 | 34.41 | 0.64 | 537 |
| X5 | 4.49 ± 0.45 | 15.69 ± 0.59 | 11.32 ± 0.41 | 20.43 ± 1.13 | 31.75 | 24.92 | 0.77 | 969 |
| X7 | 2.43 | 15.18 | 18.47 | 12.20 | 30.67 | 14.63 | 0.63 | 1337 |
| X8 | 9.75 | 13.78 | 12.65 | 15.57 | 28.22 | 25.32 | 0.29 | 475 |
| Mean | 5.03 | 14.38 | 10.03 | 23.72 | 33.75 | 28.75 | 0.62 | 729 |
| stdev | ± 3.11 | ± 2.12 | ± 4.19 | ± 7.42 | ± 5.27 | ± 8.22 | ± 0.17 | ± 335 |
| (e) Feiyun River (F) | ||||||||
| Locs | Concentration of P fraction (mg/kg) | OC (%) | OC/OP molar ratios | |||||
| NaOH-P | HCl-P | IP | OP | TP | BAP | |||
| F9 | 12.01 | 34.40 | 48.43 | 35.81 | 84.24 | 47.82 | 0.60 | 430 |
| F8 | 5.57 | 21.51 | 60.38 | 17.52 | 77.9 | 23.09 | 0.64 | 943 |
| F7 | 13.20 ± 0.25 | 24.09 ± 0.67 | 51.47 ± 0.47 | 23.80 ± 2.82 | 75.27 | 37 | 0.65 | 707 |
| F6 | 6.05 | 21.83 | 49.89 | 24.59 | 74.48 | 30.64 | 0.68 | 716 |
| F5 | 4.16 | 27.49 | 58.80 | 23.61 | 82.41 | 27.77 | 0.80 | 870 |
| F10 | 8.75 | 28.22 | 34.47 | 47.43 | 81.9 | 56.18 | 0.67 | 365 |
| F4 | 6.41 | 28.01 | 45.28 | 36.19 | 81.47 | 42.6 | 0.67 | 475 |
| F2 | 11.89 | 34.30 | 62.95 | 30.00 | 92.95 | 41.89 | 0.71 | 607 |
| F1 | 9.84 | 32.86 | 49.52 | 21.44 | 70.96 | 31.28 | 0.76 | 914 |
| F11 | 9.72 | 27.97 | 27.66 | 50.40 | 78.06 | 60.12 | 0.55 | 284 |
| F12 | 4.34 | 26.11 | 43.13 | 25.90 | 69.03 | 30.24 | 0.68 | 679 |
| Mean | 8.36 | 27.89 | 48.36 | 30.61 | 78.97 | 38.97 | 0.67 | 635 |
| Stdev | ± 3.23 | ± 4.51 | ± 10.67 | ± 10.69 | ± 6.70 | ± 11.96 | ± 0.07 | ± 225 |
| (f) Ao River (A) | ||||||||
| Locs | Concentration of P fraction (mg/kg) | OC (%) | OC/OP molar ratio | |||||
| NaOH-P | HCl-P | IP | OP | TP | BAP | |||
| A6 | 14.60 | 40.79 | 54.79 | 52.08 | 106.87 | 66.68 | 0.68 | 338 |
| A7 | 10.62 | 38.74 | 49.27 | 35.64 | 84.91 | 46.26 | 0.60 | 435 |
| A5 | 48.77 | 49.05 | 61.31 | 62.68 | 123.99 | 111.45 | 0.68 | 279 |
| A4 | 18.73 | 50.68 | 48.38 | 57.13 | 105.51 | 75.86 | 1.03 | 465 |
| A3 | 7.87 ± 0.84 | 51.42 ± 1.83 | 54.91 ± 6.17 | 40.99 ± 2.62 | 95.9 | 48.86 | 1.35 | 851 |
| A2 | 5.95 | 52.87 | 49.51 | 79.79 | 129.3 | 85.74 | 0.98 | 317 |
| A1 | 18.64 | 26.55 | 52.12 | 168.97 | 221.09 | 187.61 | 0.64 | 97 |
| Mean | 17.88 | 44.30 | 52.90 | 71.04 | 123.94 | 88.92 | 0.85 | 397 |
| stdev | ± 14.50 | ± 9.54 | ± 4.55 | ± 45.54 | ± 45.47 | ± 48.90 | ± 0.28 | ± 233 |
| HCl-P | IP | OP | TP | BAP | OC | TOC/OP | |
| NaOH-P | 0.919 | 0.923 | 0.925 | 0.932 | 0.983 | −0.0964 | −0.208 |
| 1.232E-022 | 2.977E-023 | 1.895E-023 | 1.270E-024 | 3.586E-040 | 0.492 | 0.135 | |
| 54 | 54 | 54 | 54 | 54 | 53 | 53 | |
| HCl-P | 0.992 | 0.963 | 0.989 | 0.958 | −0.122 | −0.258 | |
| 1.765E-048 | 2.291E-031 | 1.522E-044 | 8.198E-030 | 0.385 | 0.0618 | ||
| 54 | 54 | 54 | 54 | 53 | 53 | ||
| IP | 0.963 | 0.993 | 0.960 | −0.133 | −0.266 | ||
| 2.722E-031 | 3.153E-050 | 1.951E-030 | 0.342 | 0.0543 | |||
| 54 | 54 | 54 | 53 | 53 | |||
| OP | 0.988 | 0.978 | −0.160 | −0.293 | |||
| 9.743E-044 | 2.619E-037 | 0.254 | 0.0335 | ||||
| 54 | 54 | 53 | 53 | ||||
| TP | 0.977 | −0.146 | −0.280 | ||||
| 1.698E-036 | 0.298 | 0.0424 | |||||
| 54 | 53 | 53 | |||||
| BAP | −0.128 | −0.252 | |||||
| 0.360 | 0.0683 | ||||||
| 53 | 53 | ||||||
| OC | 0.945 | ||||||
| 2.270E-026 | |||||||
| 53 | |||||||
| LIGNIN | TN | TOC/TN | (Ad/Al)v | (Ad/Al)s | |||
| NaOH-P | −0.0422 | −0.0665 | −0.127 | −0.0376 | −0.0152 | ||
| 0.764 | 0.636 | 0.366 | 0.787 | 0.913 | |||
| 53 | 53 | 53 | 54 | 54 | |||
| HCl-P | −0.0435 | −0.105 | −0.0565 | −0.00136 | −0.00302 | ||
| 0.757 | 0.455 | 0.688 | 0.992 | 0.983 | |||
| 53 | 53 | 53 | 54 | 54 | |||
| IP | −0.0691 | −0.117 | −0.0172 | −0.00292 | −0.0157 | ||
| 0.623 | 0.405 | 0.903 | 0.983 | 0.910 | |||
| 53 | 53 | 53 | 54 | 54 | |||
| OP | 0.00593 | −0.135 | −0.0818 | −0.0404 | −0.0384 | ||
| 0.966 | 0.336 | 0.560 | 0.772 | 0.783 | |||
| 53 | 53 | 53 | 54 | 54 | |||
| TP | −0.0373 | −0.126 | −0.0453 | −0.0192 | −0.0257 | ||
| 0.791 | 0.370 | 0.747 | 0.891 | 0.854 | |||
| 53 | 53 | 53 | 54 | 54 | |||
| BAP | −0.0201 | −0.100 | −0.108 | −0.0397 | −0.0266 | ||
| 0.887 | 0.475 | 0.443 | 0.776 | 0.849 | |||
| 53 | 53 | 53 | 54 | 54 | |||
| OC | −0.473 | 0.977 | −0.204 | 0.0123 | −0.0990 | ||
| 0.000352 | 1.103E-035 | 0.142 | 0.930 | 0.481 | |||
| 53 | 53 | 53 | 53 | 53 | |||
| TOC/OP | −0.421 | 0.950 | −0.268 | 0.0472 | −0.0729 | ||
| 0.00170 | 1.752E-027 | 0.0528 | 0.737 | 0.604 | |||
| 53 | 53 | 53 | 53 | 53 | |||
| LIGNIN | −0.450 | 0.0934 | 0.126 | −0.207 | |||
| 0.000717 | 0.506 | 0.367 | 0.138 | ||||
| 53 | 53 | 53 | 53 | ||||
| TN | −0.345 | 0.0338 | −0.0762 | ||||
| 0.0114 | 0.810 | 0.587 | |||||
| 53 | 53 | 53 | |||||
| TOC/TN | 0.0185 | −0.142 | |||||
| 0.895 | 0.310 | ||||||
| 53 | 53 | ||||||
| (Ad/Al)v | 0.198 | ||||||
| 0.151 | |||||||
| 54 | |||||||
| (Ad/Al)s |
References
- Wohl, E. A World of Rivers. Environmental Change on Ten of the World’s Great Rivers; University of Chicago Press: Chicago, IL, USA, 2013; p. 359. [Google Scholar]
- Kandasamy, S.; Nagender Nath, B. Perspective on the terrestrial organic matter transport and burial along the land-deep sea continuum: Caveats in our understanding of biogeochemical processes and future needs. Front. Mar. Sci. 2016, 3, 259. [Google Scholar] [CrossRef] [Green Version]
- Blaas, H.; Krosze, C. Excessive nitrogen and phosphorus in European rivers: 2000–2050. Ecol. Indic. 2016, 67, 328–337. [Google Scholar] [CrossRef]
- Mandaric, L.; Diamantini, E.; Stella, E.; Cano-Paoli, K.; Valle-Sistac, J.; Molins-Delgado, D.; Bellin, A.; Chiogna, G.; Majone, B.; Diaz-Cruz, M.S.; et al. Contamination sources and distribution patterns of pharmaceuticals and personal care products in Alpine rivers strongly affected by tourism. Sci. Total Environ. 2017, 590, 484–494. [Google Scholar] [CrossRef]
- Peng, F.J.; Pan, C.G.; Zhang, M.; Zhang, N.S.; Windfield, R.; Salvito, D.; Selck, H.; Van den Brink, P.J.; Ying, G.G. Occurrence and ecological risk assessment of emerging organic chemicals in urban rivers: Guangzhou as a case study in China. Sci. Total Environ. 2017, 589, 46–55. [Google Scholar] [CrossRef] [PubMed]
- Syvitski, J.P.M.; Vörösmarty, C.J.; Kettner, A.J.; Green, P. Impact of humans on the flux of terrestrial sediment to the global coastal ocean. Science 2015, 308, 376–380. [Google Scholar] [CrossRef] [PubMed]
- Aufdenkampe, A.K.; Mayorga, E.; Hedges, J.I.; Llerena, C.; Quay, P.D.; Gudeman, J.; Krusche, A.V.; Richey, J.E. Organic matter in the Peruvian headwaters of the Amazon: Compositional evolution from the Andes to the lowland Amazon mainstem. Org. Geochem. 2007, 38, 337–364. [Google Scholar] [CrossRef]
- Alin, S.R.; Aalto, R.; Goñi, M.A.; Richey, J.E.; Dietrich, W.E. Biogeochemical characterization of carbon sources in the Strickland and Fly rivers, Papua New Guinea. J. Geophys. Res. 2007, 113, F01S05. [Google Scholar] [CrossRef] [Green Version]
- Loh, P.S.; Chen, C.T.A.; Anshari, G.Z.; Wang, J.T.; Lou, J.Y.; Wang, S.L. A comprehensive survey of lignin geochemistry in the sedimentary organic matter along the Kapuas River (West Kalimantan, Indonesia). J. Asian Earth Sci. 2012, 43, 118–129. [Google Scholar] [CrossRef]
- Li, Z.; Peterse, F.; Wu, Y.; Bao, H.; Eglinton, T.I.; Zhang, J. Sources of organic matter in Changjiang (Yangtze River) bed sediments: Preliminary insights from organic geochemical proxies. Org. Geochem. 2015, 85, 11–21. [Google Scholar] [CrossRef] [Green Version]
- Ishiwatari, R.; Fujino, N.; Brincat, D.; Yamamoro, S.; Takahara, H.; Shichi, K.; Krivonogov, S.K. A 35 kyr record of organic matter composition and δ13C of n-alkanes in bog sediments close to Lake Baikal: Implications for paleoenvironmental studies. Org. Geochem. 2009, 40, 51–60. [Google Scholar] [CrossRef]
- Tareq, S.M.; Kitagawa, H.; Ohta, K. Lignin biomarker and isotopic records of paleovegetation and climate changes from Lake Erhai, southwest China, since 18.5 ka BP. Quarter. Inter. 2011, 229, 47–56. [Google Scholar] [CrossRef]
- Wu, Y.; Dittmar, T.; Ludwichowski, K.U.; Kattner, G.; Zhang, J.; Zhu, Z.Y.; Koch, B.P. Tracing suspended organic nitrogen from the Yangtze River catchment into the East China Sea. Mar. Chem. 2007, 107, 367–377. [Google Scholar] [CrossRef]
- Goñi, M.A.; Aceves, H.; Benitez-Nelson, B.; Tappa, E.; Thunnell, R.; Black, D.E.; Muller-Karger, F.; Astor, Y.; Varela, R. Oceanographic and climatologic controls on the compositions and fluxes of biogenic materials in the water column and sediments of the Cariaco Basin over the Late Holocene. Deep-Sea Res. I 2009, 56, 614–640. [Google Scholar] [CrossRef]
- Yao, P.; Yu, G.; Bianchi, T.S.; Guo, Z.; Zhao, M.; Knappy, C.S.; Keely, B.J.; Zhao, B.; Zhang, T.; Pan, H.; et al. A multiproxy analysis of sedimentary organic carbon in the Changjiang Estuary and adjacent shelf. J. Geophys. Res. Biogeo. 2015, 120, 1407–1429. [Google Scholar] [CrossRef]
- Kendall, C.; Silva, S.R.; Kelly, V.J. Carbon and nitrogen isotopic compositions of particulate organic matter in four large river systems across the United States. Hydrol. Proces. 2001, 15, 1301–1346. [Google Scholar] [CrossRef]
- Longworth, B.E.; Petsch, S.T.; Raymond, R.A.; Bauer, J.E. Linking lithology and land use to sources of dissolved and particulate organic matter in headwaters of a temperate, passive-margin river system. Geochim. Cosmochim. Acta 2007, 71, 4233–4250. [Google Scholar] [CrossRef] [Green Version]
- Kao, S.J.; Liu, K.K. Stable carbon and nitrogen isotope systematic in a human-disturbed watershed (Lanyang-Hsi) in Taiwan and the estimation of biogenic particulate organic carbon and nitrogen fluxes. Global Biogeochem. Cycles 2000, 14, 189–198. [Google Scholar] [CrossRef]
- Farella, N.; Lucotte, M.; Louchouarn, P.; Roulet, M. Deforestation modifying terrestrial organic transport in the Rio Tapajόs, Brazilian Amazon. Org. Geochem. 2001, 32, 1443–1458. [Google Scholar] [CrossRef]
- Tian, J.R.; Zhou, P.J. Phosphorus fractions of floodplain sediments and phosphorus exchange on the sediment-water interface in the lower reaches of the Han River in China. Ecol. Eng. 2007, 30, 264–270. [Google Scholar] [CrossRef]
- Sun, S.J.; Huang, S.L.; Sun, X.M.; Wen, W. Phosphorus fractions and its release in the sediments of Haihe River, China. J. Environ. Sci. 2009, 21, 291–295. [Google Scholar] [CrossRef]
- Nürnberg, G.K. Prediction of phosphorus release rates from total and reductant-soluble phosphorus in anoxic lake sediments. Can. J. Fish. Aqua. Sci. 1988, 45, 453–462. [Google Scholar] [CrossRef]
- Loh, P.S.; Molot, L.A.; Nürnberg, G.K.; Watson, S.B.; Ginn, B. Evaluating relationships between sediment chemistry and anoxic phosphorus and iron release across three different water bodies. Inland Waters 2013, 3, 105–118. [Google Scholar] [CrossRef] [Green Version]
- Shan, B.; Li, J.; Zhang, W.; Di, Z.; Jin, X. Characteristics of phosphorus components in the sediments of main rivers into the Bohai Sea. Ecol. Eng. 2016, 97, 426–433. [Google Scholar] [CrossRef]
- Adhikari, P.L.; White, J.R.; Maiti, K.; Nguyen, N. Phosphorus speciation and sedimentary phosphorus release from the Gulf of Mexico sediments: Implication for hypoxia. Estuar. Coast. Shelf Sci. 2015, 164, 77–85. [Google Scholar] [CrossRef]
- Ertel, J.R.; Hedges, J.I. The lignin component of humic substances: Distribution among soil and sedimentary humic, fulvic, and base-insoluble fractions. Geochim. Cosmochim. Acta 1984, 48, 2065–2074. [Google Scholar] [CrossRef]
- Meyers, P.A. Preservation of elemental and isotopic source identification of sedimentary organic matter. Chem. Geol. 1994, 114, 289–302. [Google Scholar] [CrossRef] [Green Version]
- Kopáček, J.; Borovec, J.; Hejzlar, J.; Ulrich, K.-U.; Norton, S.A.; Amirbahman, A. Aluminum control of phosphorus sorption by lake sediments. Environ. Sci. Technol. 2005, 39, 8784–8789. [Google Scholar] [CrossRef] [PubMed]
- Hiriart-Baer, V.P.; Milne, J.E.; Marvin, C.H. Temporal trends in phosphorus and lacustrine productivity in Lake Simcoe inferred from lake sediment. J. Great Lakes Res. 2011, 37, 764–771. [Google Scholar] [CrossRef]
- Ruban, V.; Lópezsánchez, J.F.; Pardo, P.; Rauret, G.; Muntau, H.; Quevauviller, P. Selection and evaluation of sequential extraction procedures for the determination of phosphorus forms in lake sediment. J. Environ. Monit. 1999, 1, 51–56. [Google Scholar] [CrossRef]
- Ruban, V.; Lópezsánchez, J.F.; Pardo, P.; Rauret, G.; Muntau, H.; Quevauviller, P. Development of a harmonised phosphorus extraction procedure and certification of a sediment reference material. J. Environ. Monit. 2001, 3, 121–125. [Google Scholar] [CrossRef]
- Galhardo, C.X.; Masini, J.C. Spectrophotometric determination of phosphate and silicate by sequential injection using molybdenum blue chemistry. Anal. Chim. Acta 2000, 417, 191–200. [Google Scholar] [CrossRef]
- Ni, J.; Lin, P.; Zhen, Y.; Yao, X.; Guo, L. Distribution, source and chemical speciation of phosphorus in surface sediments of the central Pacific Ocean. Deep. Sea Res. Part I: Oceanogr. Res. Pap. 2015, 105, 74–82. [Google Scholar] [CrossRef]
- Goñi, M.A.; Yunker, M.B.; Macdonald, R.W.; Eglinton, T.I. Distribution and Sources of Organic Biomarkers in Arctic Sediments from the Mackenzie River and Beaufort Shelf. Mar. Chem. 2000, 71, 23–51. [Google Scholar] [CrossRef]
- Miltner, A.; Emeis, K.-C. Origin and transport of terrestrial organic matter from the Oder lagoon to the Arkona Basin, Southern Baltic Sea. Org. Geochem. 2000, 31, 57–66. [Google Scholar] [CrossRef]
- Yuan, H.W.; Chen, J.F.; Ye, Y.; Lou, Z.H.; Jin, A.M.; Chen, X.G.; Jiang, Z.P.; Lin, Y.S.; Chen, C.T.A.; Loh, P.S. Sources and distribution of sedimentary organic matter along the Andong salt marsh, Hangzhou Bay. J. Mar. Syst. 2017, 174, 78–88. [Google Scholar] [CrossRef]
- Selvaraj, K.; Lee, T.Y.; Yang, J.Y.T.; Canuel, E.A.; Huang, J.C.; Dai, M.; Liu, J.T.; Kao, S.J. Stable isotopic and biomarker evidence of terrigeneous organic matter export to the deep sea during tropical storm. Mar. Geol. 2015, 364, 32–42. [Google Scholar] [CrossRef]
- Kang, X.M.; Song, J.M.; Yuan, H.M.; Shi, X.; Wang, W.F.; Li, X.G.; Li, N.; Duan, L.Q. Phosphorus speciation and its bioavailability in sediments of the Jiaozhou Bay. Estuar. Coast. Shelf Sci. 2017, 188, 127–136. [Google Scholar] [CrossRef]
- Zhang, W.L.; Zeng, C.S.; Tong, C.; Zhai, S.J.; Lin, X. Spatial distribution of phosphorus speciation in marsh sediments along a hydrologic gradient in a subtropical estuarine wetland, China. Estuar. Coast. Shelf Sci. 2015, 154, 30–38. [Google Scholar] [CrossRef]
- Cui, Y.; Xiao, R.; Xie, Y.; Zhang, M. Phosphorus fraction and phosphate sorption-release characteristics of the wetland sediments in the Yangtze River Delta. Phys. Chem. Earth 2018, 103, 19–27. [Google Scholar] [CrossRef]
- Yang, Y.; Gao, B.; Hao, H.; Zhou, H.; Lu, J. Nitrogen and phosphorus in sediments in China: A national-scale assessment and review. Sci. Total Environ. 2017, 576, 840–849. [Google Scholar] [CrossRef]
- Yang, B.; Liu, S.-M.; Wu, Y.; Zhang, J. Phosphorus speciation and availability in sediments off the eastern coast of Hainan Island, South China Sea. Conti. Shelf Res. 2016, 118, 111–127. [Google Scholar] [CrossRef]
- Mayorga, E.; Aufdenkampe, A.K.; Masiello, C.A.; Kruscge, A.V.; Hedges, J.I.; Quay, P.D.; Richey, J.E.; Brown, T.A. Young organic matter as a source of carbon dioxide outgassing from Amazonian rivers. Nature 2005, 436, 538–541. [Google Scholar] [CrossRef] [PubMed]
- Chen, C.T.A.; Zhai, W.; Dai, M. Riverine input and air-sea CO2 exchanges near the Changjiang (Yangtze River) Estuary: Status quo and implication on possible future changes in metabolic status. Conti. Shelf Res. 2008, 28, 1476–1482. [Google Scholar] [CrossRef]
- Li, Y.; Pan, D.Z.; Chanson, H.; Pan, C.H. Real-time characteristics of tidal bore propagation in the Qiantang River Estuary, China, recorded by marine radar. Conti. Shelf Res. 2019, 180, 48–58. [Google Scholar] [CrossRef] [Green Version]


| Locs | Concentration Ranges and Mean (in Brackets) (mg P/kg) | Percentages to TP (%) | |||||||||
|---|---|---|---|---|---|---|---|---|---|---|---|
| NaOH-P | AP | IP | OP | TP | BAP | NaOH-P | AP | IP | OP | BAP | |
| Q | 1.08–7.16 | 1.54–15.15 | 2.39–14.45 | 3.44–6.63 | 6.49–19.98 | 4.74–12.69 | |||||
| (2.57) | (4.16) | (9.03) | (4.44) | (13.47) | (7.01) | 19.08 | 30.88 | 67.04 | 32.96 | 52.04 | |
| S | 175.60–442.12 | 303.34–378.91 | 338.37–395.93 | 244.55–311.60 | 600.23–686.60 | 445.81–703.97 | |||||
| (283.74) | (345.45) | (370.23) | (275.19) | (645.42) | (558.93) | 43.96 | 53.52 | 57.36 | 42.64 | 86.60 | |
| J | 4.48–35.23 | 23.07–43.48 | 39.09–66.50 | 6.68–55.81 | 52.51–106.54 | 14.35–76.10 | |||||
| (12.81) | (35.48) | (51.18) | (29.41) | (80.59) | (42.22) | 15.90 | 44.03 | 63.51 | 36.49 | 52.39 | |
| X | 2.29–10.03 | 10.40–17.41 | 5.26–18.47 | 12.20–31.04 | 26.20–39.91 | 14.63–40.16 | |||||
| (5.03) | (14.38) | (10.03) | (23.72) | (33.75) | (28.75) | 14.90 | 42.61 | 29.72 | 70.28 | 85.19 | |
| F | 4.16–13.20 | 21.51–34.40 | 27.66–62.95 | 17.52–50.40 | 70.96–92.95 | 23.09–60.12 | |||||
| (8.36) | (27.89) | (48.36) | (30.61) | (78.97) | (38.97) | 10.59 | 35.32 | 61.24 | 38.76 | 49.35 | |
| A | 5.95–48.77 | 26.55–52.87 | 48.38–61.31 | 35.64–168.97 | 84.91–221.09 | 46.26–187.61 | |||||
| (17.88) | (44.30) | (52.90) | (71.04) | (123.94) | (88.92) | 14.43 | 35.74 | 42.68 | 57.32 | 71.74 | |
© 2020 by the authors. Licensee MDPI, Basel, Switzerland. This article is an open access article distributed under the terms and conditions of the Creative Commons Attribution (CC BY) license (http://creativecommons.org/licenses/by/4.0/).
Share and Cite
Loh, P.S.; Cheng, L.-X.; Lin, S.-Y.; Kandasamy, S. Characteristics of Sedimentary Organic Matter and Phosphorus in Minor Rivers Discharging into Zhejiang Coast, China. Geosciences 2020, 10, 357. https://0-doi-org.brum.beds.ac.uk/10.3390/geosciences10090357
Loh PS, Cheng L-X, Lin S-Y, Kandasamy S. Characteristics of Sedimentary Organic Matter and Phosphorus in Minor Rivers Discharging into Zhejiang Coast, China. Geosciences. 2020; 10(9):357. https://0-doi-org.brum.beds.ac.uk/10.3390/geosciences10090357
Chicago/Turabian StyleLoh, Pei Sun, Long-Xiu Cheng, Shi-Yuan Lin, and Selvaraj Kandasamy. 2020. "Characteristics of Sedimentary Organic Matter and Phosphorus in Minor Rivers Discharging into Zhejiang Coast, China" Geosciences 10, no. 9: 357. https://0-doi-org.brum.beds.ac.uk/10.3390/geosciences10090357