Article

Fluid-Rock Interactions in a Paleo-Geothermal Reservoir (Noble Hills Granite, California, USA). Part 2: The Influence of Fracturing on Granite Alteration Processes and Fluid Circulation at Low to Moderate Regional Strain

1
B2R, Geosciences Department, Institut Polytechnique UniLaSalle Beauvais, 19 Rue Pierre Waguet, F-60026 Beauvais, France
2
Geosciences and Environment Cergy, CY Cergy Paris Université, 1 Rue Descartes, F-95000 Neuville-sur-Oise, France
*
Author to whom correspondence should be addressed.
Submission received: 23 September 2021 / Revised: 13 October 2021 / Accepted: 18 October 2021 / Published: 20 October 2021

Abstract

:
Fracture connectivity within fractured granitic basement geothermal reservoirs is an important factor controlling their permeability. This study aims to improve the understanding of fluid–rock interaction processes at low to moderate regional strain. The Noble Hills range (Death Valley, CA, USA) was chosen as a naturally exhumed paleo geothermal reservoir. A series of petrographic, petrophysical, and geochemical investigations, combined with a fracture distribution analysis, were carried out on samples collected across fracture zones. Our results indicate that several generations of fluids have percolated through the reservoir. An increase of (1) the alteration degree; (2) the porosity values; and (3) the calcite content was observed when approaching fracture zones. No correlation was identified among the alteration degree, the porosity, or the calcite content. At a local scale, samples showed that the degree of alteration does not necessarily depend on the fracture density or on the amount of the strain. It is concluded that the combined influence of strain and coeval fluid–rock interaction processes drastically influence the petrophysical properties of fracture zones, which in turn impact geothermal production potential.

1. Introduction

Long-term exploitation of geothermal resources is closely linked to reservoir rock petrophysical properties and regional geological settings [1]. Due to the low matrix porosity and permeability of granitic rocks, underground granitic units are considered as a reservoir only when fractures are present. These fractures provide the essential reservoir permeability and porosity for fluid flow [2,3] and are therefore of primary importance regarding geothermal exploitation [4,5,6,7,8]. These structures control the deep flow at the reservoir scale, in case of good connectivity [2,3,9,10,11], which is one of the most important controls on the permeability [12]. Several granitic reservoirs, as Soultz-sous-Forêts in the Upper Rhine Graben, France [6,13] or the Cooper Basin in Australia [14], give invaluable experience in terms of exploration and exploitation feedback. In addition to these datasets gained from data limited to boreholes and indirect geophysical methods, studies of surface reservoir analogues are common [15,16,17]. The MEET H2020 project (Multidisciplinary and multi-context demonstration of EGS exploration and Exploitation Techniques and potentials) [18] aims to develop enhanced geothermal systems throughout Europe. Within this project, the Noble Hills (NH) range, located in the southern termination of the Death Valley (DV, CA, USA), has been chosen as an analogue of fractured granitic basements in a context of transtensional deformation [19]. Klee et al. (2021) [19] highlighted numerous evidences of hydrothermal alterations: (1) a propylitic alteration affecting pervasively a large volume of rock during the cooling of the pluton and (2) an argillic alteration, also called vein alteration [19,20,21,22,23], inducing changes of the bulk-rock chemical and mineralogical compositions and of physical properties [7,24].
A vast amount of literature [9,11,25] has proven that increasing amounts of strain within fault zones drastically change their petrophysical properties. The present paper focuses on the influence of fractures on the fluid circulation and alteration processes at low to moderate regional strain.
The present study aims to:
  • Characterize the relations among the varying amounts of strain, fracture densities, and alteration degrees at the NH scale, as well as the sample scales through the case studies.
  • Characterize the variations in (1) chemical elements concentrations; (2) calcite content; (3) porosity; and (4) temperature condition variations when approaching fracture zones.
  • Identify the different fluid circulation episodes through the granite body.
Macroscopic and microscopic petrographic studies, XRD mineralogical characterization of whole rock and clay minerals, bulk rock chemical analyses by inductively coupled plasma (ICP), mass spectrometry (MS), atomic emission spectrometry (AES), scanning electron microscopy coupled with energy dispersive spectrometry (SEM-EDS) for structural observation and local chemical analyses, mass balance calculations, fracture density calculations, calcimetry, and porosimetry, were performed on samples collected in the vicinity of fracture zones within areas of the NH affected by low to moderate regional transcurrent strains. The results will be discussed and compared with the protolith studied by [19].

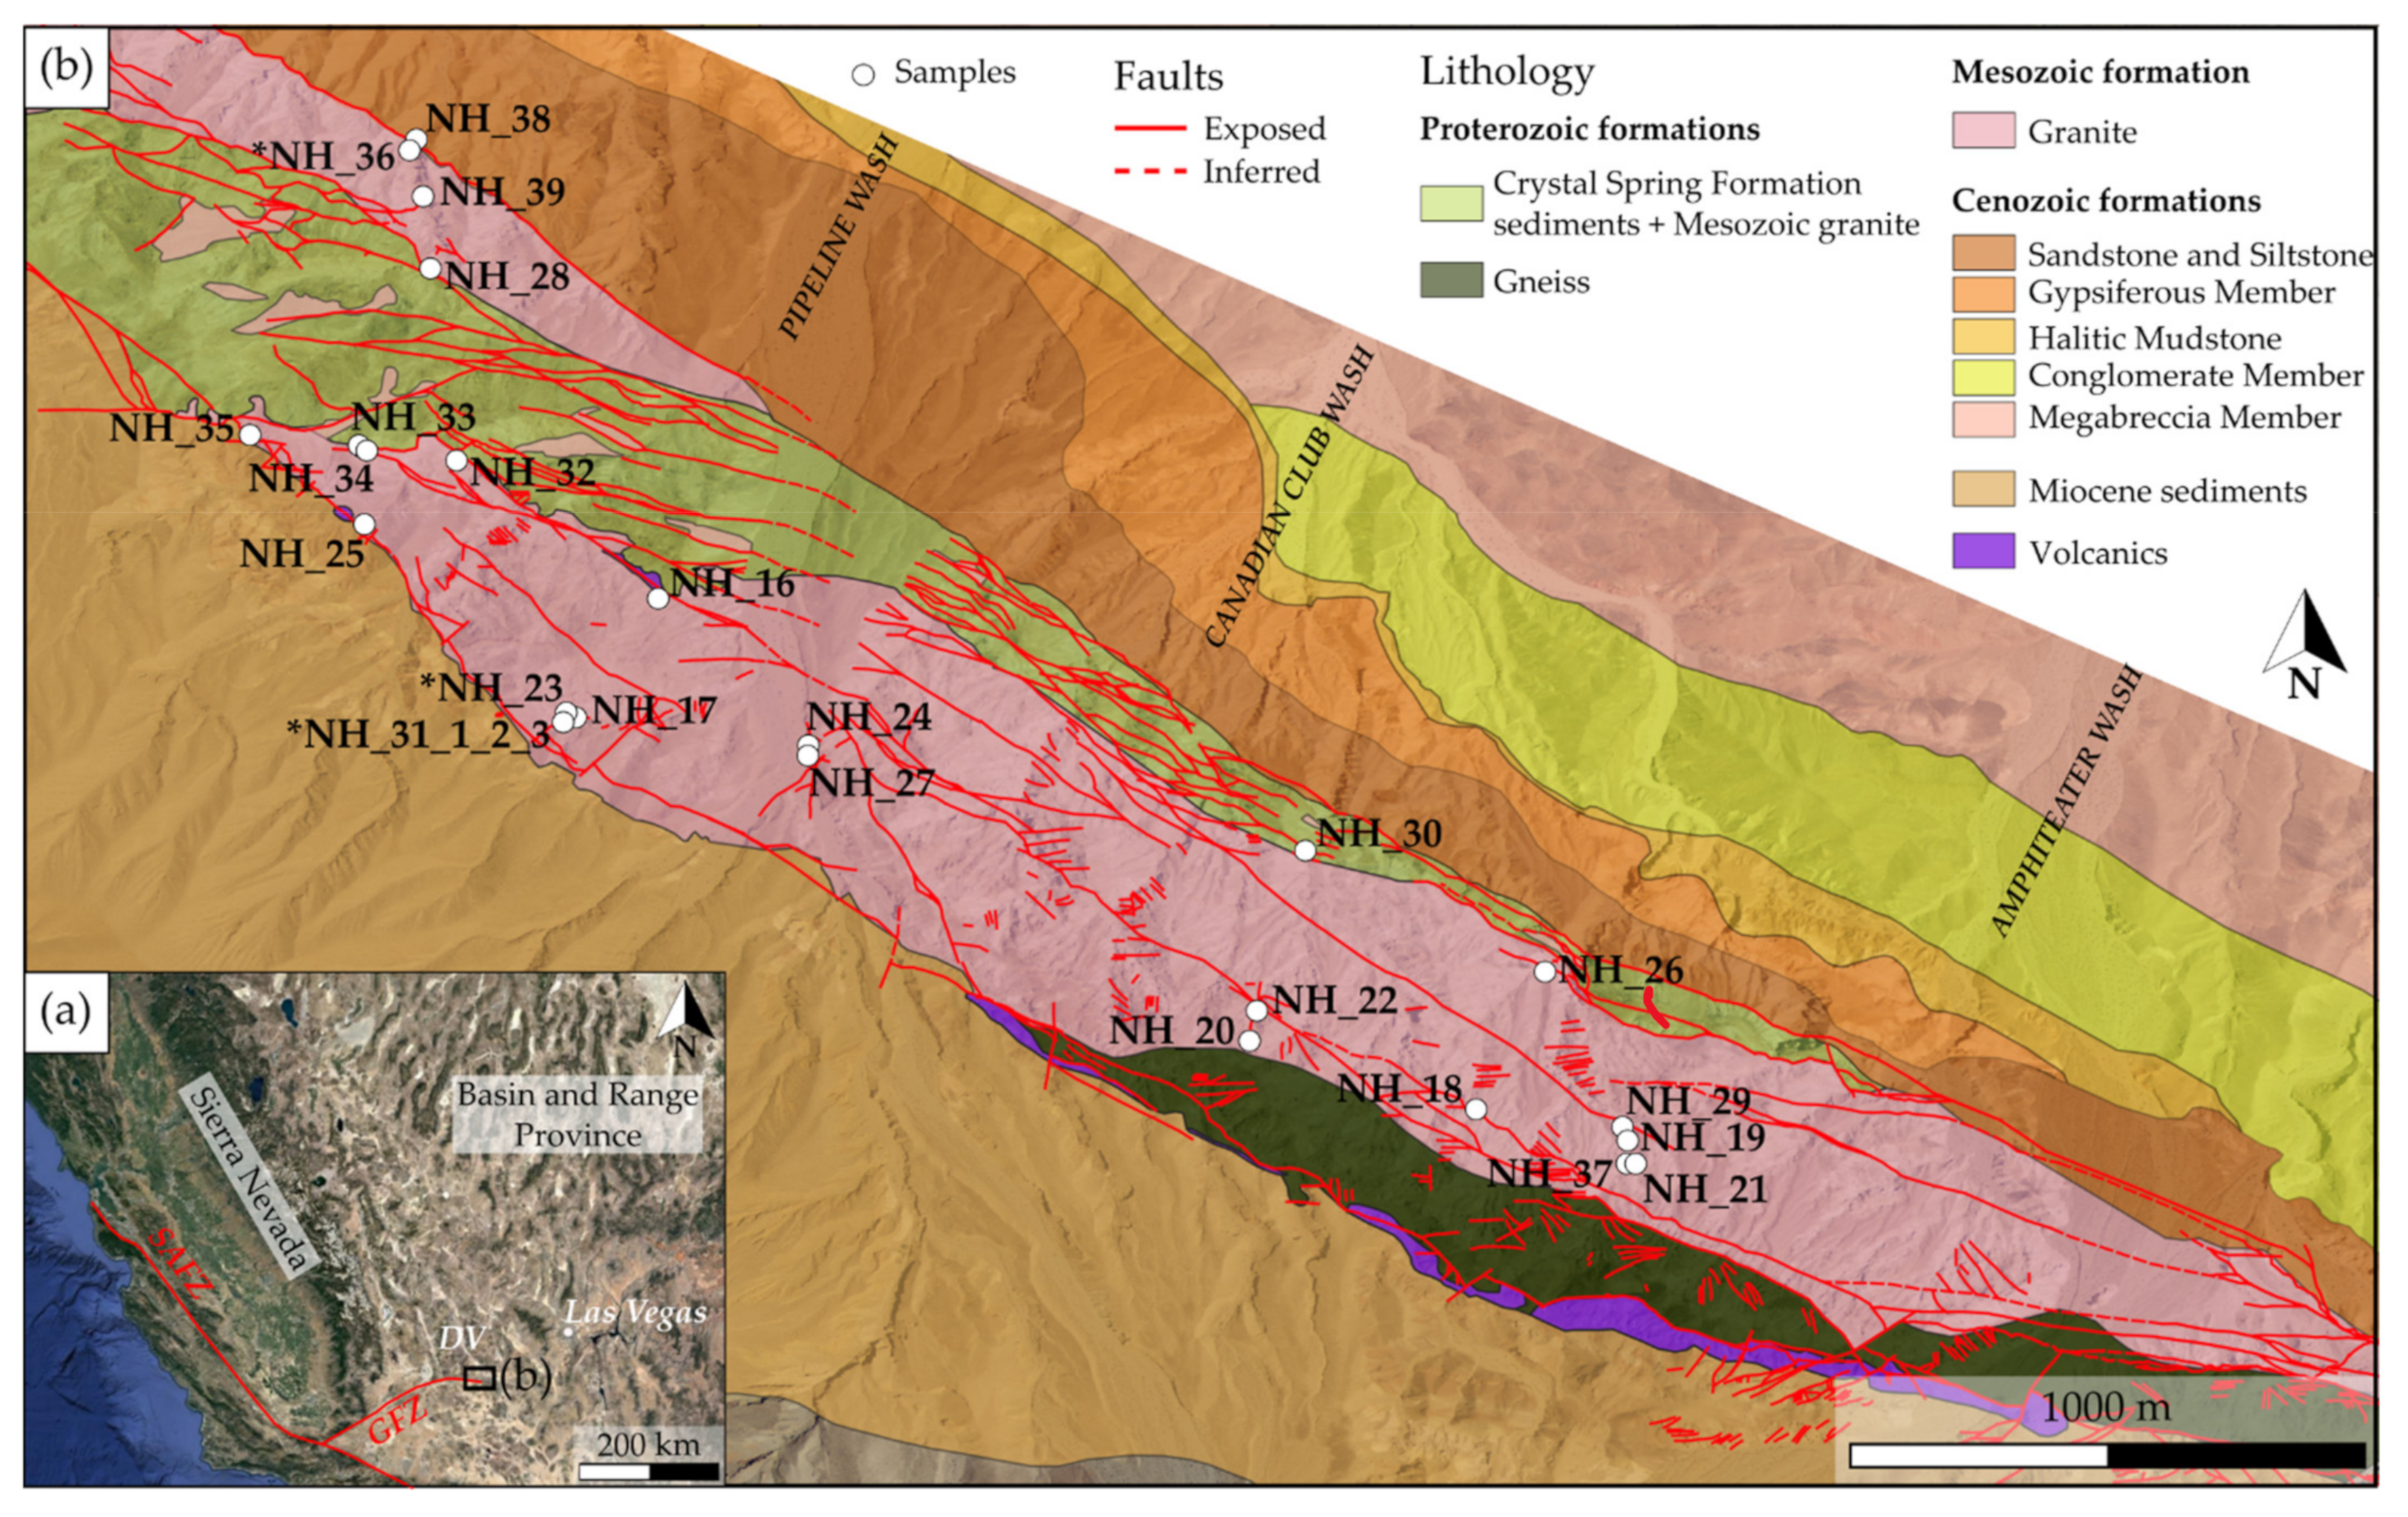
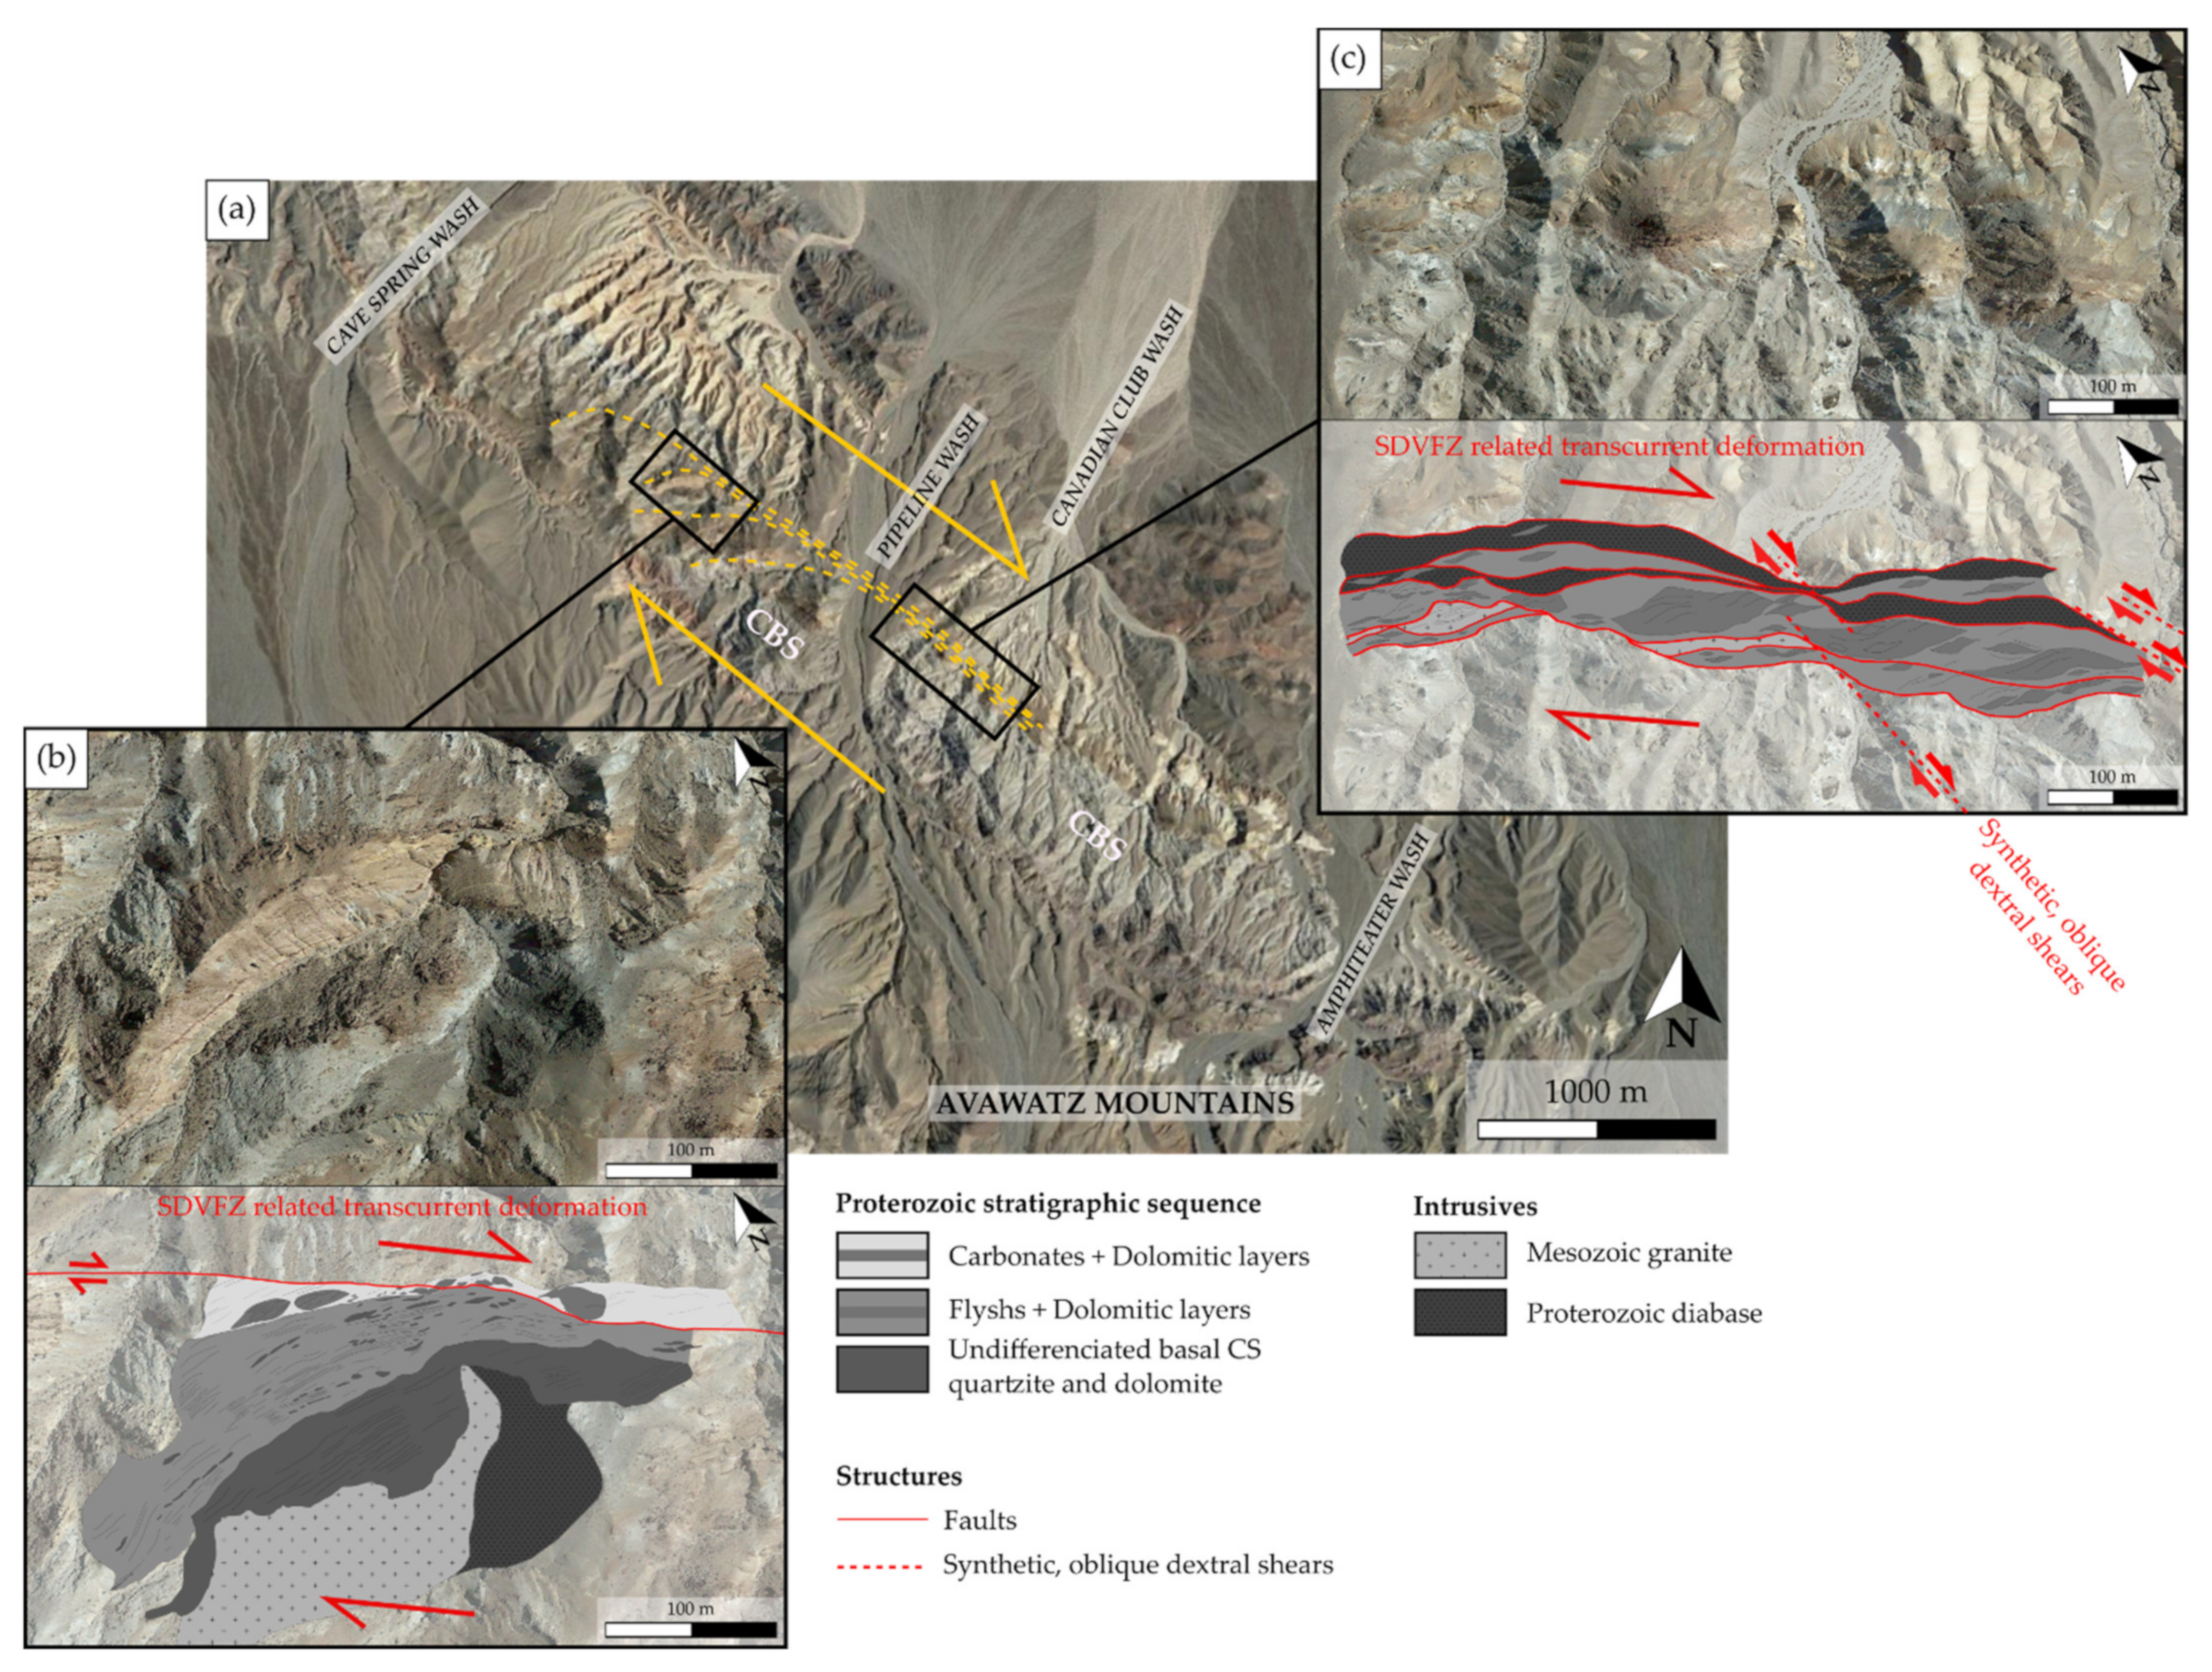
2. Geological Setting

The Death Valley (DV, Figure 1a) is located in the core of a Cenozoic distributed system of dextral strike-slips, about 700 km long, comprising the Walker Lane Belt and the Eastern California Shear Zone (ECSZ/WLB) [26,27,28,29]. This narrow northwest-trending system, lying between the Basin and Range region to the east and the Sierra Nevada batholith to the west [28], today accommodate ~25% of the Pacific-North America relative motion [26,30]. DV is a structural depression, NNW–SSE oriented, bounded by the Black and Funeral Mountains to the west and by the Panamint Range to the east [31]. It has been formed by a right-lateral movement giving a pull-apart structure [32].
The area of interest for this study is the Noble Hills range (NH, Figure 1b). It is located in the southernmost part of the DV region and trends parallel to the NW-striking SDVFZ at its southern end. Geological markers along the SDVFZ trace [33] suggest that the NH correspond to a transported fragment of the frontal part of the Owlshead Mountains (OM), a Cretaceous (~95 Ma, [34]) granitic pluton at a 40–41 km distance to the SE. Several attempts have been made and discussed in the literature to give insight to the geological setting of the NH and structural relationships between SDVFZ and GFZ [35,36,37]. Particular emphasis has been given to a detailed description of sedimentary sequence deposits on each side of the NH Crystalline Bedrock Slice (CBS) [38,39]. The CBS is composed of Proterozoic sediments with upward younging direction the Crystal Spring (CS) quartzite, CS dolomite, detrital flysh, and carbonate sequences possibly part of the Pahrump Group, intruded by 1.1 Ga diabase sills, the whole intruded by Mesozoic granite [40]. However, a detailed structural analysis of the CBS itself is missing. Thus, Section 4.1 of this study will give new elements, improving the observations made by [38,41] concerning the NH structure. A precise fracture pattern characterization of the NH was performed by [42], through a wide-ranging analysis scale from the microscopic scale to the regional scale. These authors showed that the NH fracture network geometry has been controlled by the SDVFZ and the GFZ.
Figure 1. (a) Location of the Noble Hills on the western USA satellite map. SAFZ—San Andreas Fault Zone, GFZ—Garlock fault zone, and DV—Death Valley. (b) The geological map of the Noble Hills range, modified after [19,38,41]. The quaternary is not displayed, but available on the map provided by [38]. Sample locations are represented by the white dots. The asterisk shows the samples used as case studies in this work. NHF—Noble Hills Formation.
Geosciences 11 00433 g001
The NH granite was poorly studied in terms of microstructure, petrography, and geochemistry. A recent study conducted by Klee et al. (2021) [19] characterized the granite as a leucocratic equigranular monzogranite (S-type), ranging in the high-K calc-alkaline and peraluminous domains. The NH granite is composed of primary plagioclase, quartz, K-feldspar, and biotite. Klee et al. (2021) [19] have also shown that the NH granite underwent two alteration stages, forming secondary minerals that recorded the chemical and paleo-thermal conditions of the system: (1) a pervasive, propylitic alteration linked to the cooling of the pluton; and (2) a more local alteration corresponding to the argillic alteration (illitization and sometimes kaolinitization), which overprints the propylitic alteration. Among the primary minerals, optical observations and geochemical data show that only plagioclase and biotite are affected by those alteration processes.

3. Materials and Methods

3.1. Material and Sample Selection

Digital field mapping techniques have been used in the field; these include the use of portable rugged tablet laptop with internal GPS. The QGIS software has been used for sample location, geological digitization, and structural data acquisition. Georeferenced topographic maps and ortho-imagery were the initial input of the database.
A detailed petrographic, mineralogical, geochemical, and petrophysical characterization was conducted on 25 samples from the NH granite, based on fieldwork and laboratory analyses.
Samples were selected by targeting fracture zones located in CBS areas that have been affected by low to moderate strain, aimed at characterizing the influence of fracturing on fluid circulations and the associated argillic alteration, mentioned only by [19] until now. Thus, the collected samples consisted of altered granite presenting open fractures, veins, reactivated veins, and breccias. All samples were georeferenced for precise locations as well as database supply (Figure 1b). The selection took into account ranges of fracture density (Fd) defined by [19] from scanlines realized on thin sections, based on [43]:
Fd 0 < 1687 fracs/m—no to very low microfracturing;
Fd 1 = 1687 fracs/m—microfracturing of order less than the grain size;
Fd 2 = 2694 fracs/m, with a multiplicator factor of 1.6 compared to Fd1—microfracturing of grain size order with interconnections;
Fd 3 = 3549 fracs/m, with a multiplicator factor of 1.3 compared to Fd2—abundant microfracturing;
Fd 4 ≥ 5140 fracs/m ([42] this issue), with a multiplicator factor of 1.4 compared to Fd3—very abundant microfracturing.
Samples selected for this study had a fracture density higher than 2694 fracs/m, meaning they fell into categories from Fd2 to Fd4. Fd4 corresponds to highly strained zones in which granite becomes a breccia. In order to correlate the fracture density with the amount of alteration, three hand specimens and seven thin sections, located in the granite body, were used for fracture extraction and analysis. These fracture characterizations are based on the scanline method, described in Section 3.1. Data from Chabani et al. (this issue, under review) [44] will be used to complete the characterization.

3.2. Methods

3.2.1. Fracture Network Parameters

Fracture networks can be characterized by their spatial arrangements [45]. The fracture network geometry is used to predict fluid circulation [45] and evidence of structural growth processes [46]. Spacing measurements through the 1D-scanline method are widely used to characterize arrangements [47,48,49,50]. They consist of the digitization of fractures along those lines, in order to calculate the linear fracture density P10 characterized by the number of fractures per length calculated along the scanline [47,48]. The Terzaghi correction has been applied [51]. Two parallel scanlines were performed on the hand specimens, perpendicular to a major fracture. For each oriented thin section mosaic, two scanlines were realized perpendicular to the main structures. For each scanline, stick plots and cumulative frequency diagrams were realized to describe the fractures spatial distribution [50]. A coefficient of variation Cv was computed for each scanline in order to quantify the fracture distribution [48]: Cv < 1 indicates a regular fracture spacing, Cv~1 indicates a random distribution, and Cv > 1 indicates a clustered distribution. Fracture density data obtained by [42] on selected samples will be used in this study.

3.2.2. Petrographic Characterization

Twenty-four samples were selected to prepare thirty-one covered and polished thin sections, for petrographic observations. Optical microscopy was used to study the mineralogical assemblage, the alteration paragenesis, the microfabric, and the degree of microfracturing. The thin sections were observed under a Leica DM4500-P optical microscope, equipped with a Leica DFC450C camera at Institut Polytechnique UniLaSalle (ULS, Beauvais, France). Large field area imaging under polarized-analyzed and polarized-non-analyzed light was conducted using Leica automatized stage facility and Leica Application Suite (LAS) v4.11.0 software [19].
Based on optical microscopical observations, microsites were selected on 9 thin sections for energy dispersive X-ray spectrometry (EDS) analyses [52] performed at ULS. These were conducted with a Hitachi S-3400N scanning electron microscope (SEM) equipped with a Thermo Ultradry EDS [53] and associated with NSS thermal scientific software. These analyses aimed to obtain qualitative and semi-quantitative chemical compositions and to characterize the microstructure of different selected phases. The analytical conditions consisted of a 50 µA beam current, an accelerating voltage of 20 kV, and an acquisition time of 30 s. A NORAN-type correction procedure was used.
In addition, cathodoluminescence (CL) analyses [54] was performed on 8 thin sections from 4 samples. CL imaging was performed (1) at the University of Göttingen using a “hot-cathode” cathodoluminescence microscope HC3-LM apparatus and (2) at CY Cergy Paris University in the Geosciences and Environment Cergy (GEC) laboratory, using a cathodoluminescence Olympus BX50. CL of minerals is predominantly a “defect luminescence”. This allowed the detection of distribution patterns of certain trace elements, such as iron (Fe), which is the most efficient quencher element and manganese (Mn), which is the most important activator element. Many minerals show visible CL colors like quartz (blue-purple), K-feldspar (blue when fresh and brownish when weathered), plagioclase (green and blue–purple when highly affected by hydrothermal alteration), calcite (yellow or yellow–orange when resulting from hydrothermal alteration), dolomite (orange–red), magnesite (red), apatite (yellow), kaolinite (dark blue) [54,55]. Illite shows no luminescence [54,55].
Most of the mineral abbreviations used in this paper refer to [56] mineral symbols and only a few others were defined by the authors.

3.2.3. X-ray Diffraction (XRD)

XRD analyses were carried out to identify and determine the mineral phases (semi-quantitative, around 3–5%). The analyses were performed at (1) ULS using a D8-Advance Bruker-AXS (Siemens) diffractometer with a Ni-filtered CuKα radiation at 40 kV and 40 mA, a primary Soller slit of 2.5°, divergence slit of 0.6 mm, and a secondary Soller slit of 2.5°, with a detector slit of 0.1 mm and an anti-scattering slit of 0.6 mm; and (2) the University of Göttingen, using a PHILIPS PW1800 diffractometer with a Cu-anode and an automatic divergence slit. Whole rock powders and oriented clay fractions (2–6 µm and <2 µm) analyses were performed on 12 samples. Quantitative phase analysis based on reference intensity ratio values were performed on randomly oriented whole-rock powders with a step length of 0.5° and a scan speed of 0.014°/s over the range 3°–70°2θ for whole rocks composition. The uncertainty is estimated to be ±5%. Clay mineral separation was conducted using a technique described by [19], based on [57,58], according to the standard techniques suggested by [59]. For the XRD analyses of both fractions, oriented specimens were measured at air-dried (AD), solvated with ethylene glycol (G), and after heating at 550 °C (H) conditions. These three analytical steps were routinely used to better determine clay minerals content and swelling properties [7]. The clay minerals identification, which is based on d-values and the relative intensity of their 00l reflections, was undertaken, referencing [60,61]. These measurements were performed with a step length of 0.5° and a speed of 0.01°/s per step over the range 3°–35°2θ. The interpretations of the data obtained at ULS were performed using the DIFFRAC EVA v4.2 (©Bruker AXS) software. Two fractions were collected in order to (1) separate the last produced or neoformed clay minerals (fraction <2 µm), which could be assimilated to the result of the last fluid circulation event, from the fraction 2–6 µm assimilated to old grain recrystallization or to a possible mix between detrital and neoformed clay mineral; (2) obtain the respective clay composition; and (3) obtain the temperature conditions.
Kübler Index and Kaolinite Crystallinity Index determination
The Kübler Index (KI) was used to define the limits of metamorphic zones (diagenetic zone, anchizone, and epizone) [19,62], following the recommendations for Kübler Index calibration of [59] and the CIS-KI transformation formalism of [63], as well as the temperature of illite formation [64,65]. The KI was calculated from the illite crystallinity (IC), which is defined as the full width at half maximum (FWHM) of the (001) 10Å peak of illite, on the AD oriented clay fractions. A recent study [66] has confirmed that IC provides a useful method for characterizing regional grades of diagenesis and low-grade metamorphism. Temperature is thought to be the main factor controlling IC, but other parameters, such as lithology, also have important effects [67,68,69]. Working at constant lithology allows this effect to be avoided. In some conditions, an altered granite shows similarities with diagenetic reactions present in feldspathic sandstones [20]. Thus, it is possible to characterize temperature ranges by using the KI values obtained for granitic rocks. The values obtained by IC were thus standardized using the crystallinity index-standard (CIS) samples provided by [70] in order to calculate the KI. The KI values of raw data expressed in ∆°2θ, were measured into three slots, corresponding to different campaigns, which induced three standardizations given by [19]. The Kaolinite Crystallinity Index (KCI) was calculated and put in parallel with the KI in order to identify any correlation between both, and to determine temperature evolution as an indicator for samples free of illite. The KCI is defined as the FWHM of the (001) 7Å peak of kaolinite on the AD oriented clay fraction.

3.2.4. Manocalcimetry

Manocalcimetry is used as an indicator of the total calcite content in a rock sample and to assess its possible influence on permeability and consequently better understand the hydrothermal sealing of a reservoir [71]. Calcite content was determined using an OFITE 152–95 manocalcimeter composed of a glass flask and a high precision manometer. The analyses were performed on 15 samples at CY-GEC. High quality results were obtained with an accuracy of ±0.5 wt.%. Prior to measurement, sample preparation was conducted according to [71]. Two replicates were performed for each sample, following the protocol described by [19], in order to check the reproducibility of the results. This procedure was considered to be good when the difference between the two results was lower than 0.5 wt.%, corresponding to the precision mentioned above. The CaCO3 percentage was calculated according to [19]. The average calcite content of a fresh granite is 0.252 wt.% and does not exceed 1.8 wt.% [72]. As a consequence, measurements above this last value can be regarded as a calcite anomaly [71], due to hydrothermal alteration.

3.2.5. Ethanol Saturation Porosimetry

Porosity measurement quantify the available volume for fluid storage [73]. The connected porosity was measured on three samples by the triple weighing method [19,74] defined by the RILEM standard (test n°I.1, 1978). The measurements were carried out at CY Cergy Paris University in the Mechanics and Material for Civil Engineering laboratory (L2MGC). They consist in the saturation of the samples after vacuum degassing. The analyses and calculations were conducted using the technique described by [19]. Ethanol has been chosen instead of water in classical methods, in order to avoid possible clay swelling [75], which could lead to the destruction of the sample and bias to porosity values. Even though ethanol (0.469 nm) is a larger molecule than water (0.343 nm), the pore volume is not estimated to be under-evaluated, because the pore size is likely much larger than that of ethanol molecules.

3.2.6. Bulk Rock Geochemical Analyzes

Chemical analyzes of the major element oxides, rare earth elements, and trace elements were conducted on five samples, selected as case studies in this paper. Analyzes were performed at the Bureau Veritas Minerals (Vancouver, BC, Canada) using inductively coupled plasma emission spectrometry or mass spectrometry (ICP-ES and ICP-MS, respectively). Samples were crushed and mixed with LiBO2/LiB4O7 flux. Crucibles were fused in a furnace at 980 °C. The obtained cooled bead was dissolved in ACS grade nitric acid and analyzed. Loss on ignition (LOI) was determined by igniting the samples split then measuring the weight loss. These chemical analyses were performed in order to determine the element transfers and the degree of alteration.

3.2.7. Mass-Balance Using Gresens’ Method

Bulk-rock mass-balance were used to establish element transfers during hydrothermal alteration by applying Gresens’ mass-balance procedure [76], consisting of the quantification of gains and losses of major elements by comparing unaltered and altered samples. NH_2 is considered as the reference because it is the freshest sample collected in the area by [19] and 3 altered samples were selected from this study (NH_20, NH_28, NH_32_3, and NH_37). The following equation defined by [76] relates the composition and volume of altered rocks to unaltered/fresh rocks:
Xn = Fv × (dA/dF) × CnA − CnB
With Xn corresponding to the gain or loss of a considered element n (absolute mobility (%)), Fv the volume factor, dA and dF the density (in g/cm3) of the altered (A) and the fresh (F) rocks, respectively, and CnA and CnB, the oxide percentage of the element n for the altered (A) and the fresh (F) rocks, respectively, which were given by the bulk geochemical analyses, recalculated without the LOI. The densities were calculated from the sample masses obtained during the porosity measurements. The Fv was calculated for each altered sample by considering XAl2O3 = 0 following the analysis of the values. Xn was calculated for each element. Then, the obtained Fv values being very close to 1, the Xn values were recalculated by considering Fv = 1 (constant volume). Hence, Xn values > 0 (positive values) represent the gains and Xn values < 0 (negative values) represent the losses for the considered elements. This calculation was applied for the major elements in each sample.

4. Results

4.1. Noble Hills Structural Overview

We investigated the geometry of outcropping Proterozoic sequences between Pipeline and Cave Spring washes (Figure 2a) and confirm at first the plutonic nature of the contact at the base of the Proterozoic sequence with the underlying Mesozoic granite by metamorphic halos [40]. The whole architecture of the NH presents signs of deformation affecting both Proterozoic and granitic units. Proterozoic units present much evidence of deformation with (1) several tectonically induced duplications of the stratigraphic sequence (Figure 2b) and (2) a lateral bending, stretching, and boudinage of this Proterozoic cover nappe stack [41]. Boudinage was identified in the field and in map view where progressive dismantling of stratigraphic markers is observed. (Figure 2b,c). Development of synthetic, oblique dextral shears (Figure 2c), offsetting along the CBS strike and accommodating the deformation, have also been identified. The age and tectonic significance of the nappe stack described in (1) is still unclear at present and possibly predates Mesozoic magmatic intrusion, as it does not appear intensively deformed along the basal contacts of the nappes. Lateral bending and stretching mentioned in (2) and depicted in Figure 2b,c are related to SDVFZ activity, since all kinematic indicators are consistent with progressive southeast oriented dextral shearing. This feature is ubiquitous within the NH as described by [33]. Given these new findings dealing with internal CBS structural organization, it is expected that areas along the rear southern limit of the CBS have recorded less transcurrent shear compared to areas situated along its northern front. Thus, the CBS gives an opportunity to study the effects of progressive transcurrent shearing within a granitic geothermal analogue. The above considerations have important implications regarding strain distribution within the NH and, in turn, concerning the sampling strategy. Given the above-mentioned findings, we consider the CBS as an exceptional example of large-scale cataclastic flow in which rock masses of the northern domain are dragged as a continuous body into a transcurrent deformation corridor (Figure 2a). No signs of a discrete, large-scale deformation structure appear on the map presented in Figure 2, where yellow dashed lines show instead a continuous flow accommodated by brittle deformation processes.

4.2. Petrographic Description

As described by [19], the primary assemblage of the NH granite is made of plagioclase (mainly oligoclase in composition), quartz, K-feldspar (perthitic orthoclase and sometimes microcline), and biotite. The granitic samples collected for this study show strong evidence of intense alteration, especially on plagioclase and biotite. Plagioclase transformed into illite, kaolinite and/or calcite and biotite into illite and oxides. In rare samples, K-feldspar perthite could be partially altered into illite. However, the magmatic texture is almost preserved, except in the case of breccias, which are not necessarily highly altered. For all samples, the alteration product is always the same, but the relative proportions of the different secondary phases might vary. The mineralogical composition and the degree of fracturing of each sample is given in Table 1.
The clay mineral composition of some samples has been precisely determined for the <2 µm and 2–6 µm (Table 1). It reveals the presence of illite/smectite (I/S) mixed-layers in three samples (NH_17, NH_24, and NH31_1_2) in both fractions when it was measurable. The I/S identified is always illite-rich (R3), with more than 90% of illite [60], where R represents the Reichweite parameter [60]. A small amount of corrensite (trioctahedral variety of regular 50:50 chlorite/smectite mixed-layer (C/S) [77]) was also identified in the samples NH_16, NH_27, and NH_32. Both mixed-layers (I/S and C/S) were already identified by [19] in the sampled granite away from the fracture zones. Two new patterns were identified in this study (Figure 3):
  • The first pattern (Figure 3a) shows illite characterized by peaks at 10.1 Å and 4.99 Å, which support the previous results [19]. Illite is present in almost all the samples except NH_28, NH_36, NH_38, and NH_39. Kaolinite is also present and could be associated to illite or not.
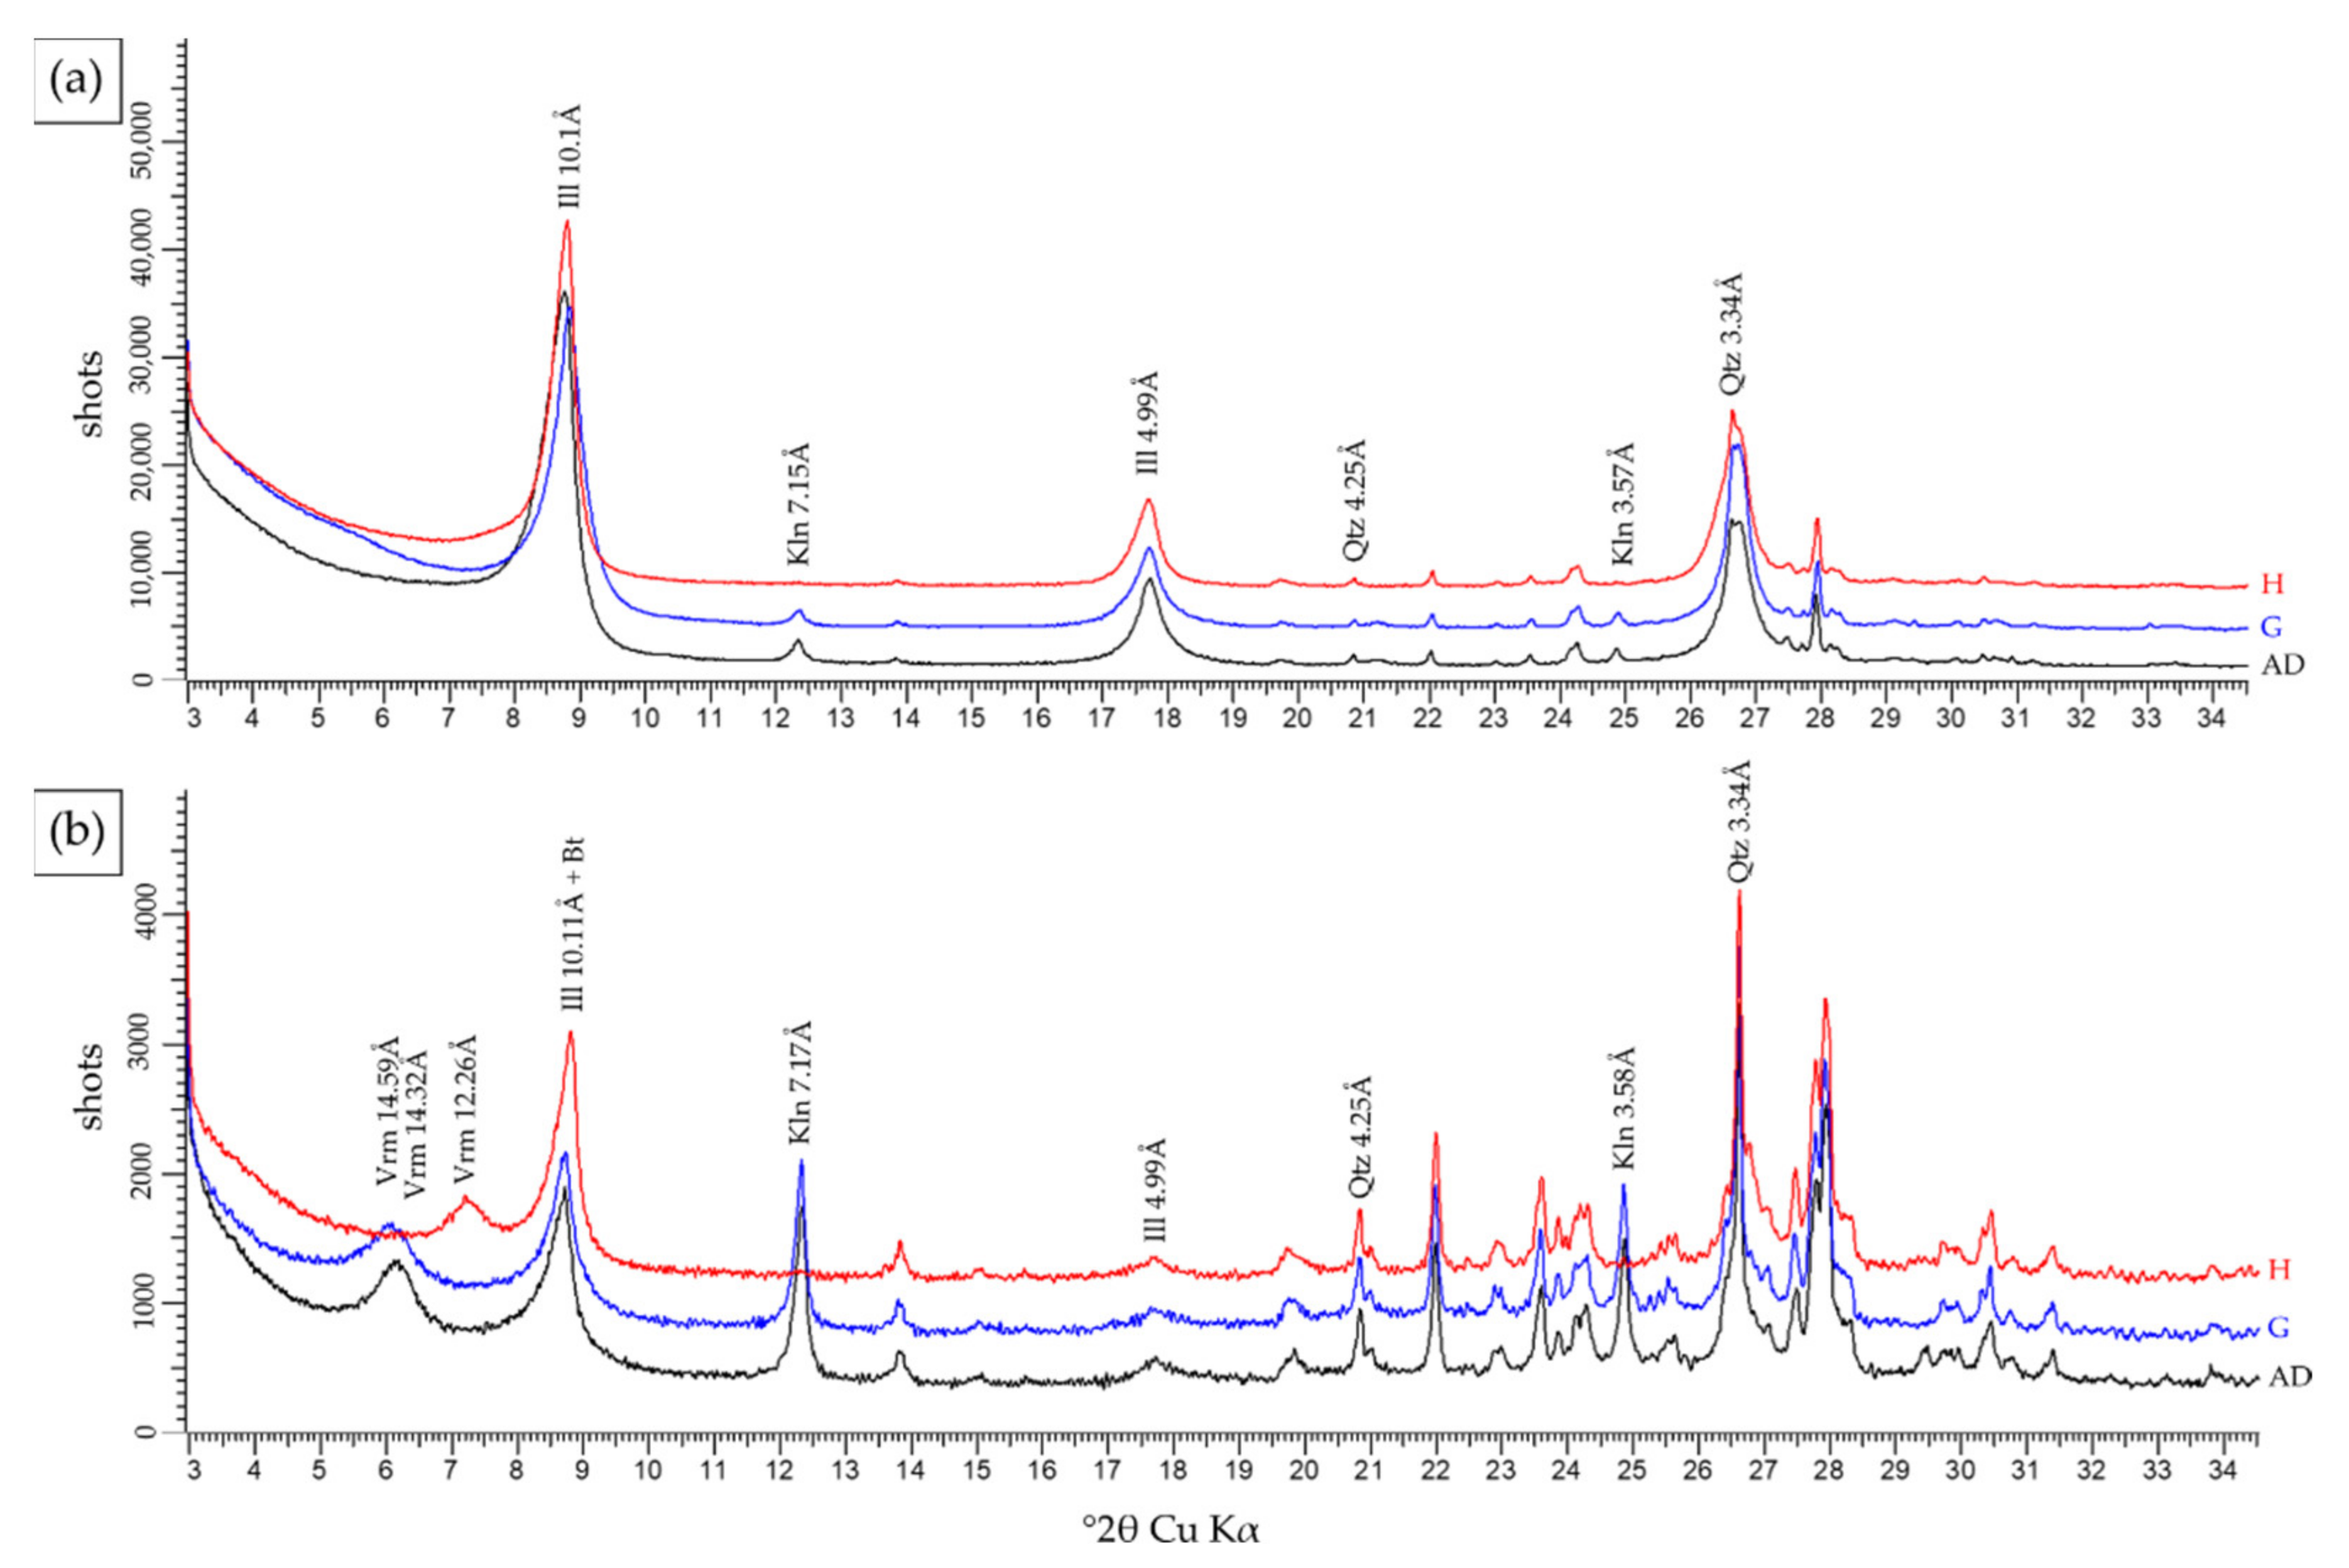
  • The second pattern (Figure 3b) shows the presence of dioctahedral vermiculite. It is characterized by a peak at 14.32Å in air-dried condition, which slightly swells up to 14.59Å after glycol solvation and slightly collapses to 12.26Å after heating. It was identified only in samples NH_24, NH_26, and NH_33, where it is associated to illite and kaolinite.
The high proportions of illite and kaolinite are characteristic of the argillic alteration [19]. Argillic alteration is prevalent in the vicinity of fracture zones (Table 1). Vermiculite can be interpreted as either hydrothermal alteration or weathering. This will be discussed in Section 5.1.
Microscopic observations and SEM-EDS analyses have shown that, in almost all the samples, carbonates (dolomite, siderite, ankerite, and calcite) and oxides were present as veins and or in replacement of plagioclase. Moreover, XRD analyses revealed the presence of gypsum and/or halite in minor amounts in few samples (Table 1). Halite only occurred in sample NH_36 and gypsum was found in samples NH_17, NH31_3, NH_34, and NH_36.

4.3. Fracturing and Fluid Circulation

The NH granite presents ubiquitous signs of both fracturing and alteration, due to its location along the SDVFZ major fault corridor. The area lies along a deformation corridor governed by transcurrent deformation along the SDVFZ. In addition to the present contribution, Klee et al. [41] argue in favor of a deformation gradient affecting the CBS. At low to moderate strains, the system presents fracture zones composed of a fault core in which fractures are branching and where most of the displacement is concentrated (Figure 4a). These fracture zones affect the surrounding rock, creating an important fracture network (the damage zone, DMZ). Open fractures and veins are observed in this DMZ (Figure 4b).
Fault zones may act as a channel when connected and open fractures are present or as a barrier when fracture are sealed by mineralization. The distinction is made between (1) zones of opening related structures (i.e., where no signs of displacement are recognized between the two borders of the vein, Figure 4b); and (2) zones of lateral displacement (i.e., indicative of a shear displacement is observable) through three samples used as case studies (NH_31 (Figure 5a), NH_36, and NH_23 (Figure 5b)). Note that these samples are spaced at 2 m and are almost perpendicular to each other.

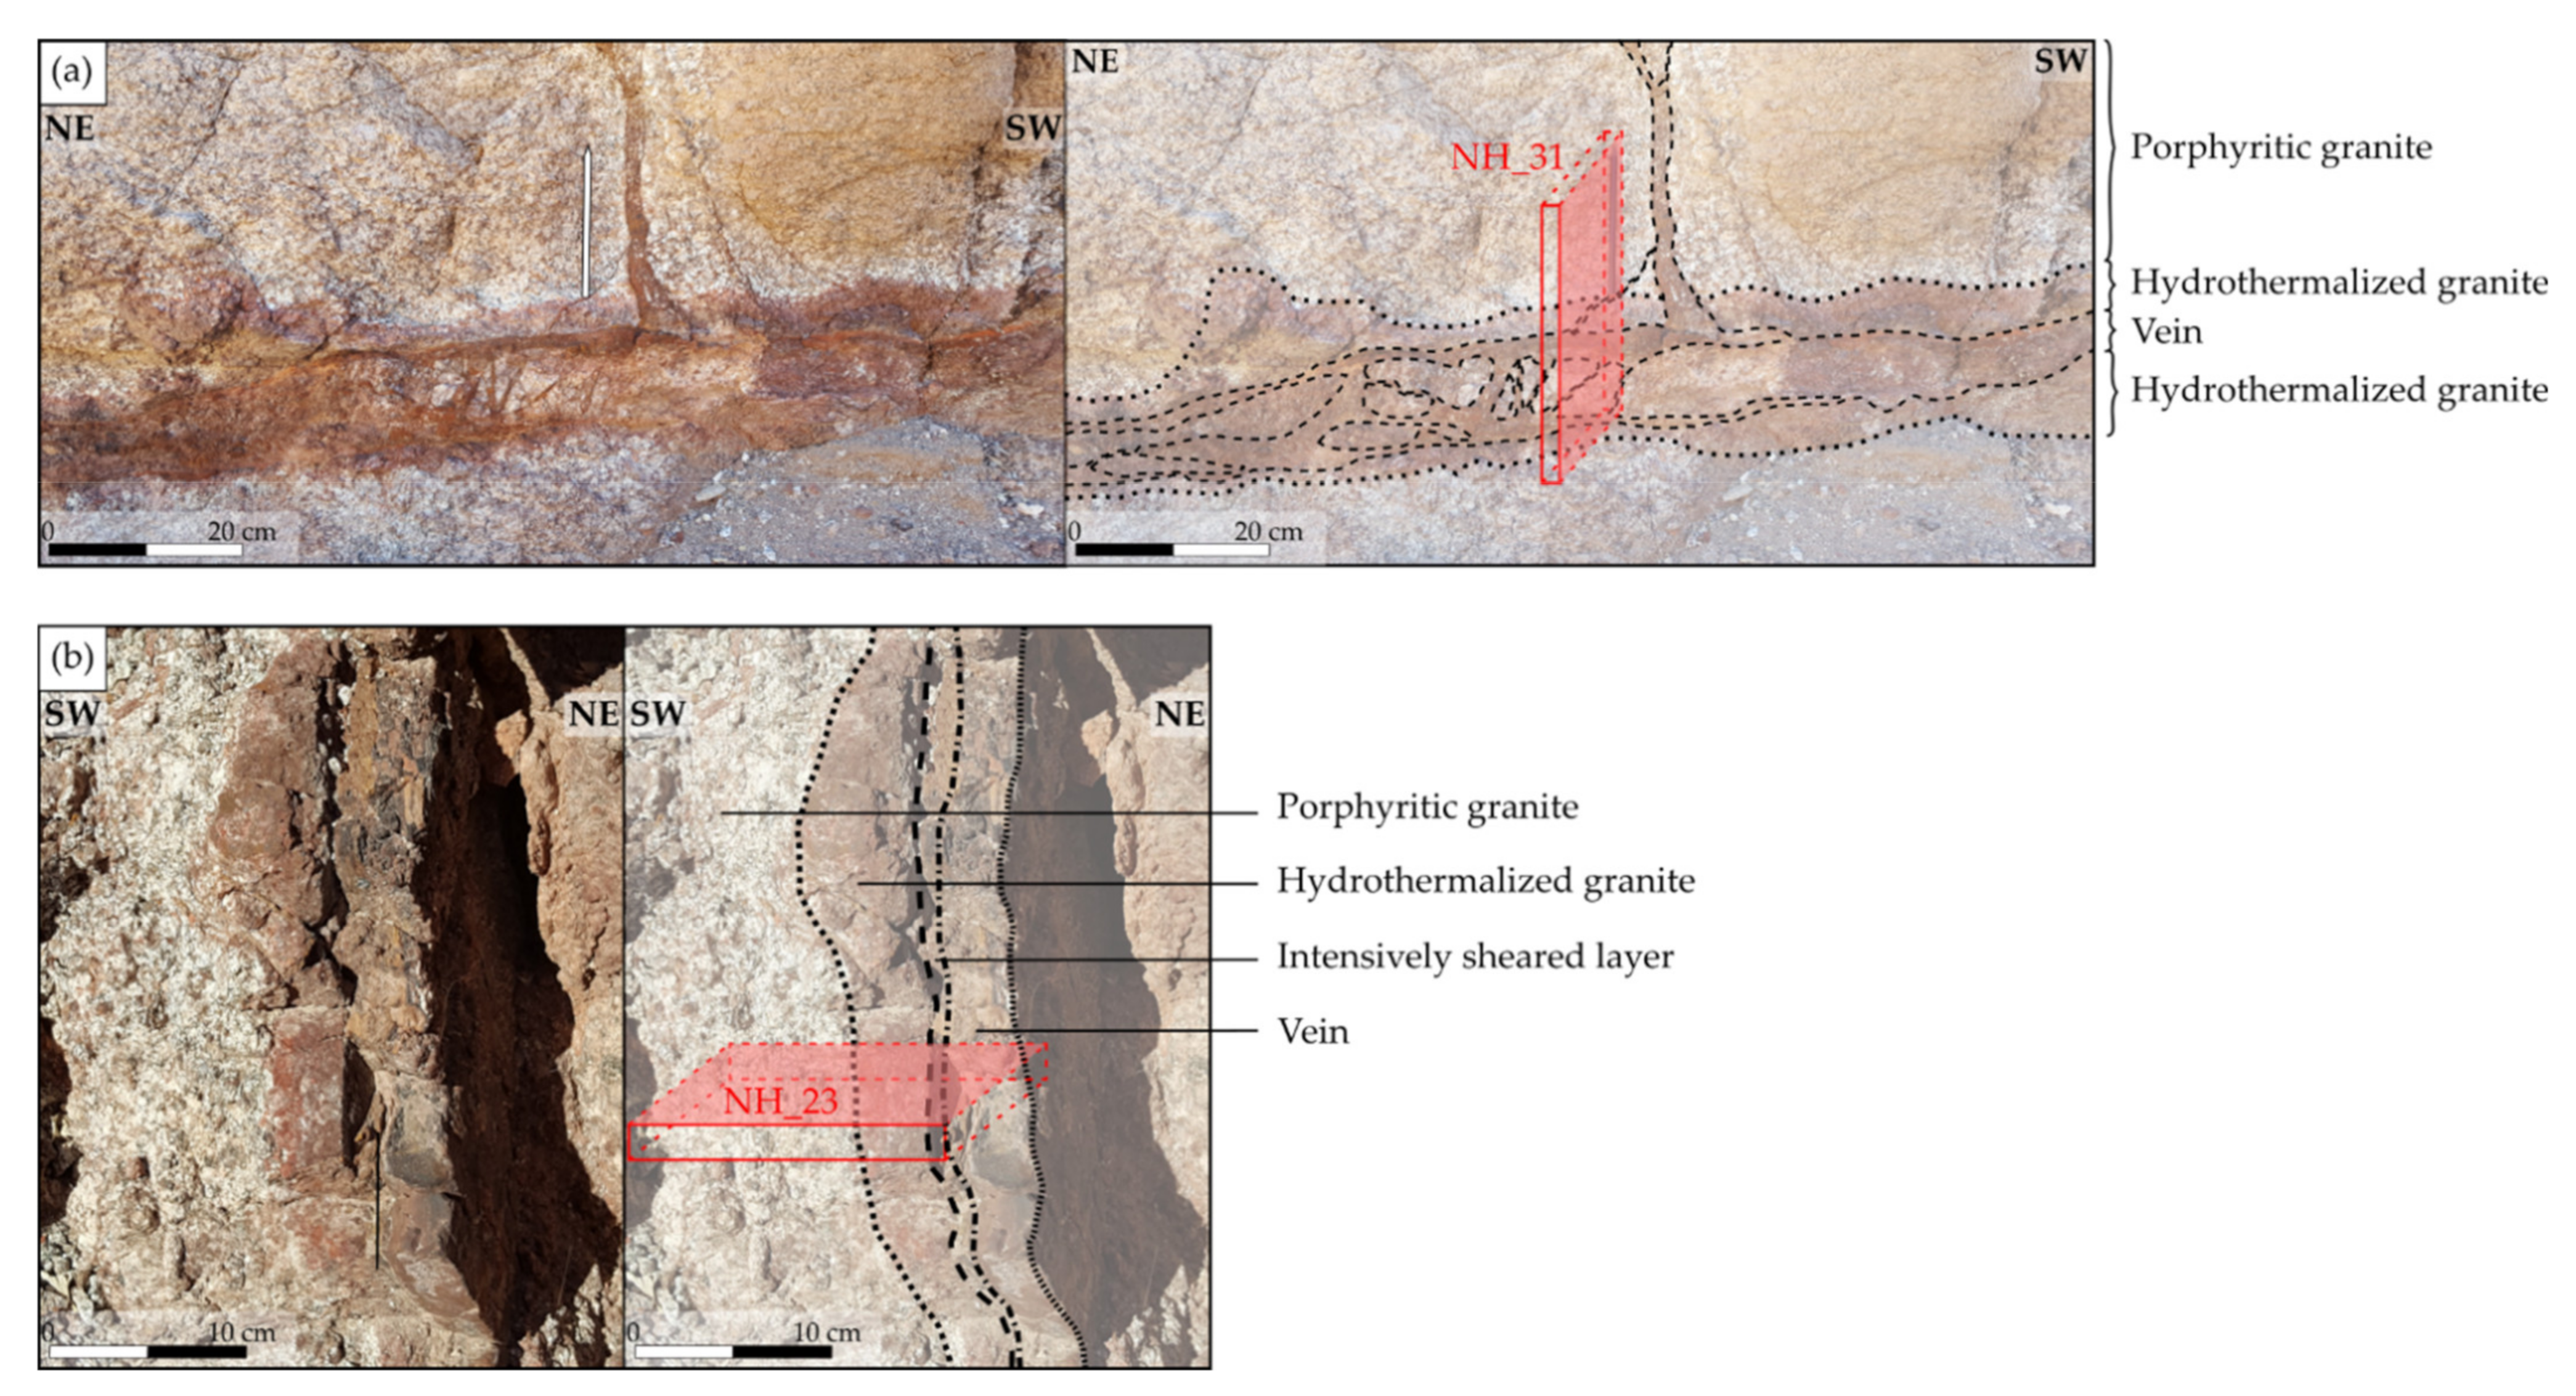
4.3.1. Opening Related Structures with Minimum Shear Displacement

A significant number of veins, veinlets, and microfractures were identified in the different samples and outcrops investigated. Veinlets of various mineralization natures (≤100 µm wide) were also identified in the samples. This variety of fracture infills shows different fluid circulation episodes. Rare veinlets of quartz were observed and intersected by illite veinlets (Figure 6a), which can be contemporaneous to kaolinite veinlets. Illite development is dependent on host mineral properties in terms of mechanical resistance and chemical stability. In that sense, quartz and K-feldspar, which remains unaltered, presents sharp open fractures in which illite precipitates (Figure 6b). Plagioclase, which is altered, presents blurred vein borders and start to spread out pervasively, due to the secondary porosity created by the alteration process (Figure 6b). These veinlets are generally intersected by carbonate veins (Figure 6c). These veins, the sizes of which range from 500-µm widths up to centimetric scales, are composed of dolomite, siderite, ankerite, and calcite. Most of the time, dolomite and ankerite appear contemporaneous. When siderite is present, it alters dolomite borders and crystallizes in it or crosscut it (Figure 6d). Then, calcite veins intersect the dolomite/ankerite and siderite veins (Figure 6d). Calcite can crystallize around angular clasts arranged in a fan shape characteristic of hydraulic fracturing (Figure 6e). Open microfractures present in the samples can show altered walls with kaolinite (Figure 6f) and/or illite (Figure 6g) indicating an influence of microfractures on mineral alteration.

4.3.2. Infill of Fractures Developed with a Confirmed Lateral Shear Displacement

The previous section shows that all of the samples in the area present many fractures where fluid has circulated, precipitating or not various secondary minerals. However, the area is constrained by a shear component. Three samples were selected in order to describe the relationship between the amount of the strain and fluid circulation.
Sample NH_31
The outcrop of the sample NH_31 (Figure 5a) presents a vein around 10 cm thick crosscutting the granite and with a pinkish halo developed on each border. This halo represents the hydrothermalized zone of the granite. The sample NH_31 (Figure 7a) is composed of (1) a brecciated vein presenting brecciated quartz remnants, which were overprinted by a carbonate matrix and granitic clasts transported by the carbonate matrix; (2) a hydrothermalized zone, which corresponds to the pinkish halo; and (3) the porphyritic granite crosscut by veinlets filled by carbonates coming from the brecciated vein. Quartz veins are scarce in the NH granite. Fractures are dominantly rich in carbonates. It can be observed through this sample that carbonates crosscut the quartz.
  • Spatial fracture distribution: two scanlines were realized in the granitic part of the sample (Figure 7a), from the brecciated vein towards the host rock, in order to evaluate the evolution of the fracture density along those two profiles. The spatial analysis is summarized in Table 2.
The cumulative frequency plotted against the fracture-projected position is presented in Figure 7b. The fracture frequency regularly and slowly increases over the first half part of the diagram curve, then increases regularly but more significantly. The Cv of 0.67 and 0.60 for each scanline shows a regular to random fracture arrangement, which is confirmed by the stick plots in Figure 7c. Both scanlines present an equivalent fracture density of 829 and 882 fracs/m.
Moreover, three thin sections were gained from the sample and one scanline was realized for each thin section (Figure 8a,b). As for the sample scanlines, the thin section scanlines were realized perpendicular to the vein and towards the host rock (Figure 8c).
SL_NH_31_1 shows a fracture frequency that increases following a random arrangement (Cv = 1.03) (Figure 8c,d).
The SL_NH_31_2, parallel to the previous scanline, also presents an irregular distribution. The frequency increases slowly at the beginning, followed by a high fracture density zone around 0.7–1.05 (fracture cluster), then a more significant increase comprising a new fracture cluster around 2–2.2 (Figure 8c). The slightly higher Cv compared to the previous scanline (Cv = 1.07) and the fracture distribution (Figure 8c) indicate a random to clustered arrangement of the fractures.
The last scanline SL_NH_31_3, which is the furthest from the vein, shows a greater overall increase of the fracture frequency compared to the two previous scanlines (Figure 8c). Only one fracture cluster was identified around 1.7–1.9 cm even if the Cv is higher (Cv = 1.11). The fracture arrangement is again considered as random to clustered.
Cv values, as well as fracture density values, increase from the vein towards the host rock, from 1.03 to 1.11 and from 2997 to 5084 fracs/m, respectively (Figure 8d).
By comparing fracture analyses between sample scale and thin section scale, a clear difference is observed among P10, the mean spacing, and Cv values (Table 2). At thin section scale, the fracture density is significantly higher (×4.7) than at sample scale and the mean spacing is six times lower. At sample scale, the Cv is lower than 1 indicating an almost regular spacing between the fractures, even if there is a change of the slope (Figure 7c). Whereas, at the thin section scale, the Cv is around 1 or slightly higher, indicating a global random distribution of the fractures along the scanlines with the appearance of a few clusters (Figure 7c). For both, differences in the fracture distribution can be linked to a subjective bias during the data collection [78], but also to the image resolution, which prevents from seeing all the fractures and so induced a bias. Thin section fracture analyses are, thus, more precise.
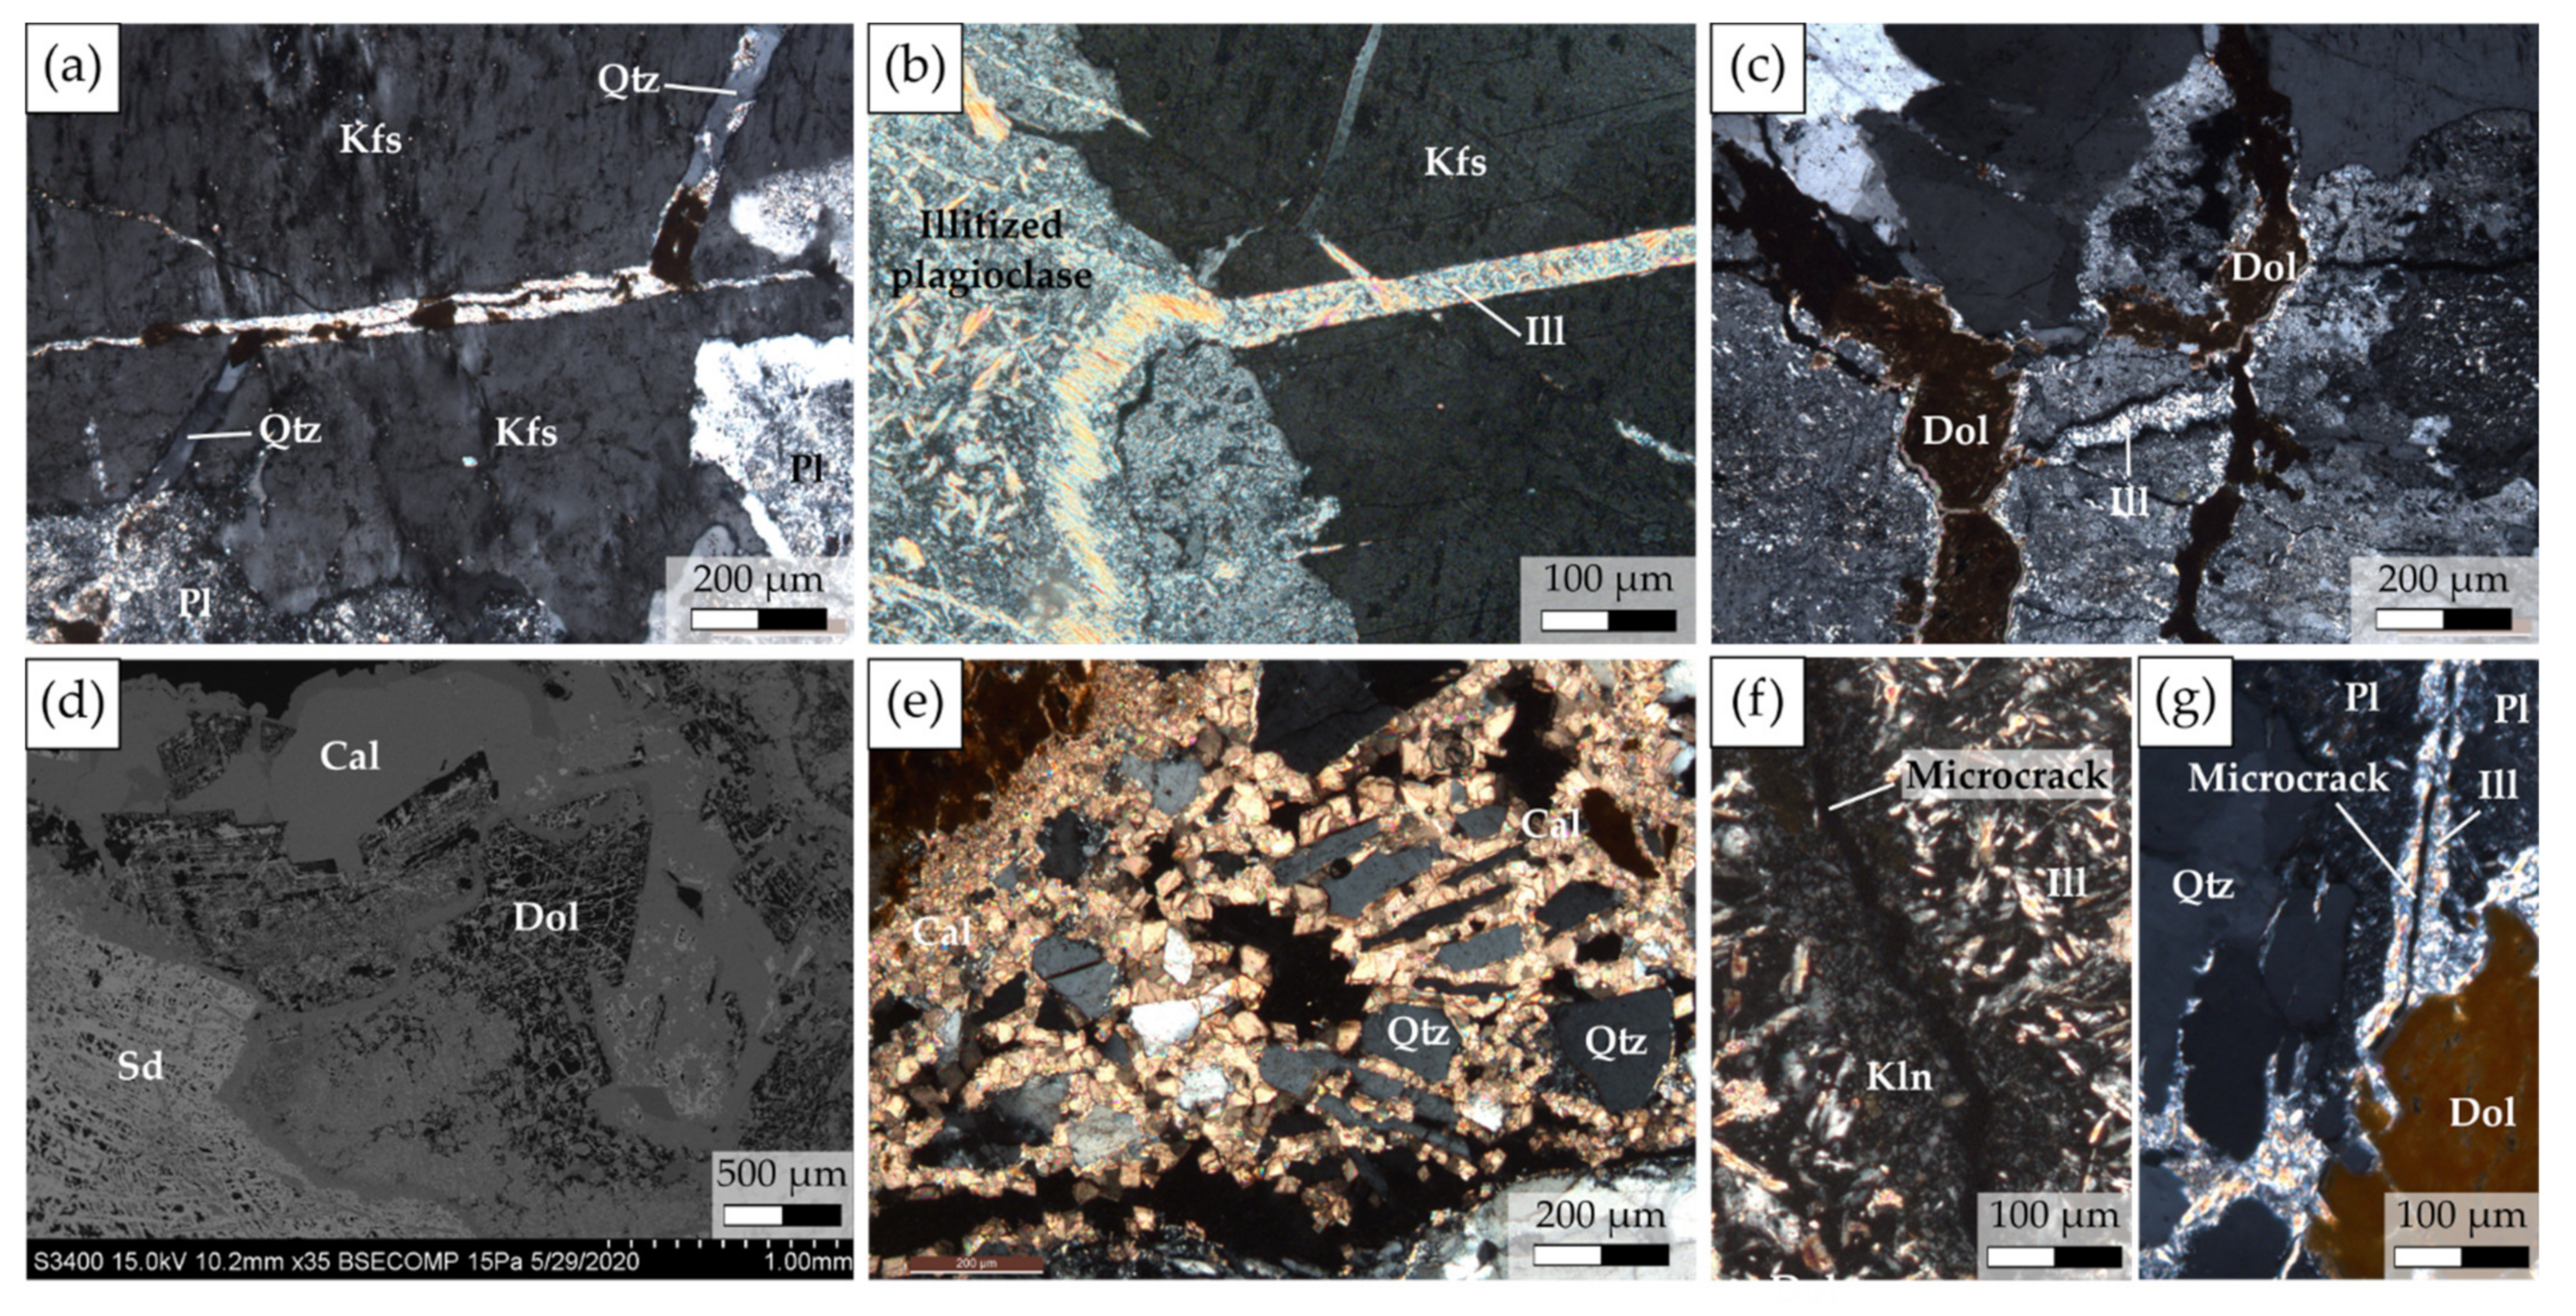
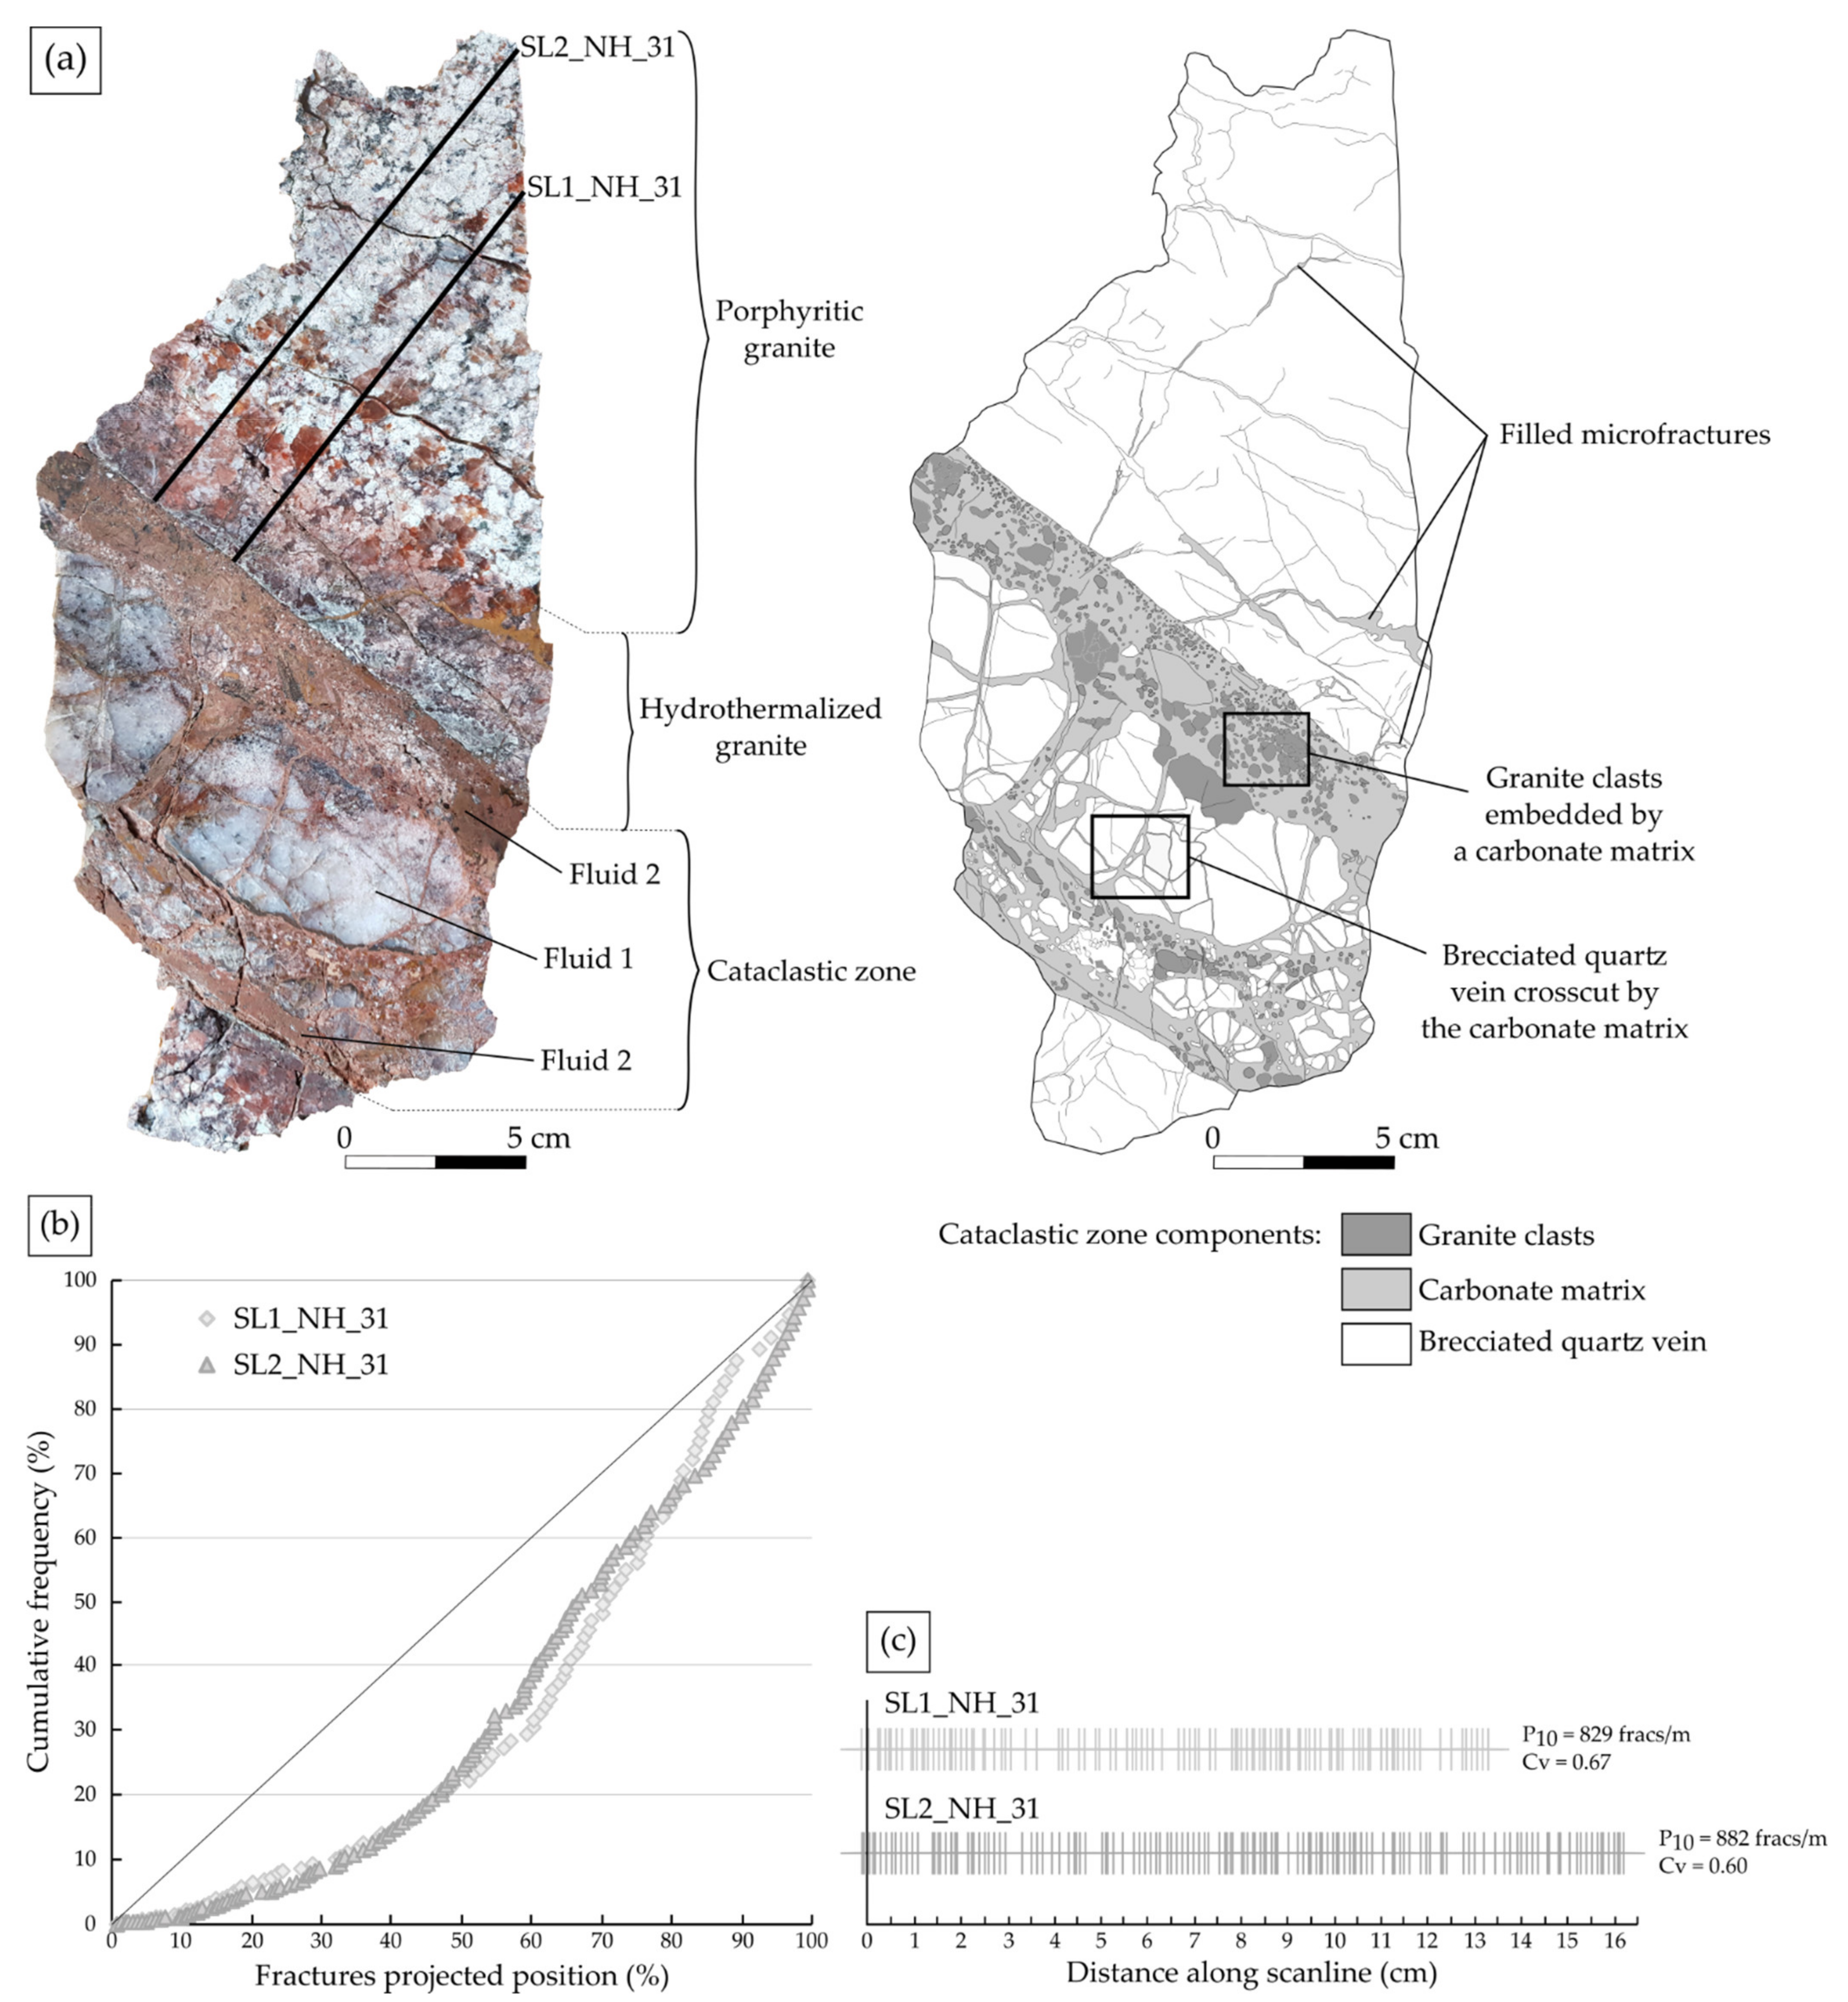
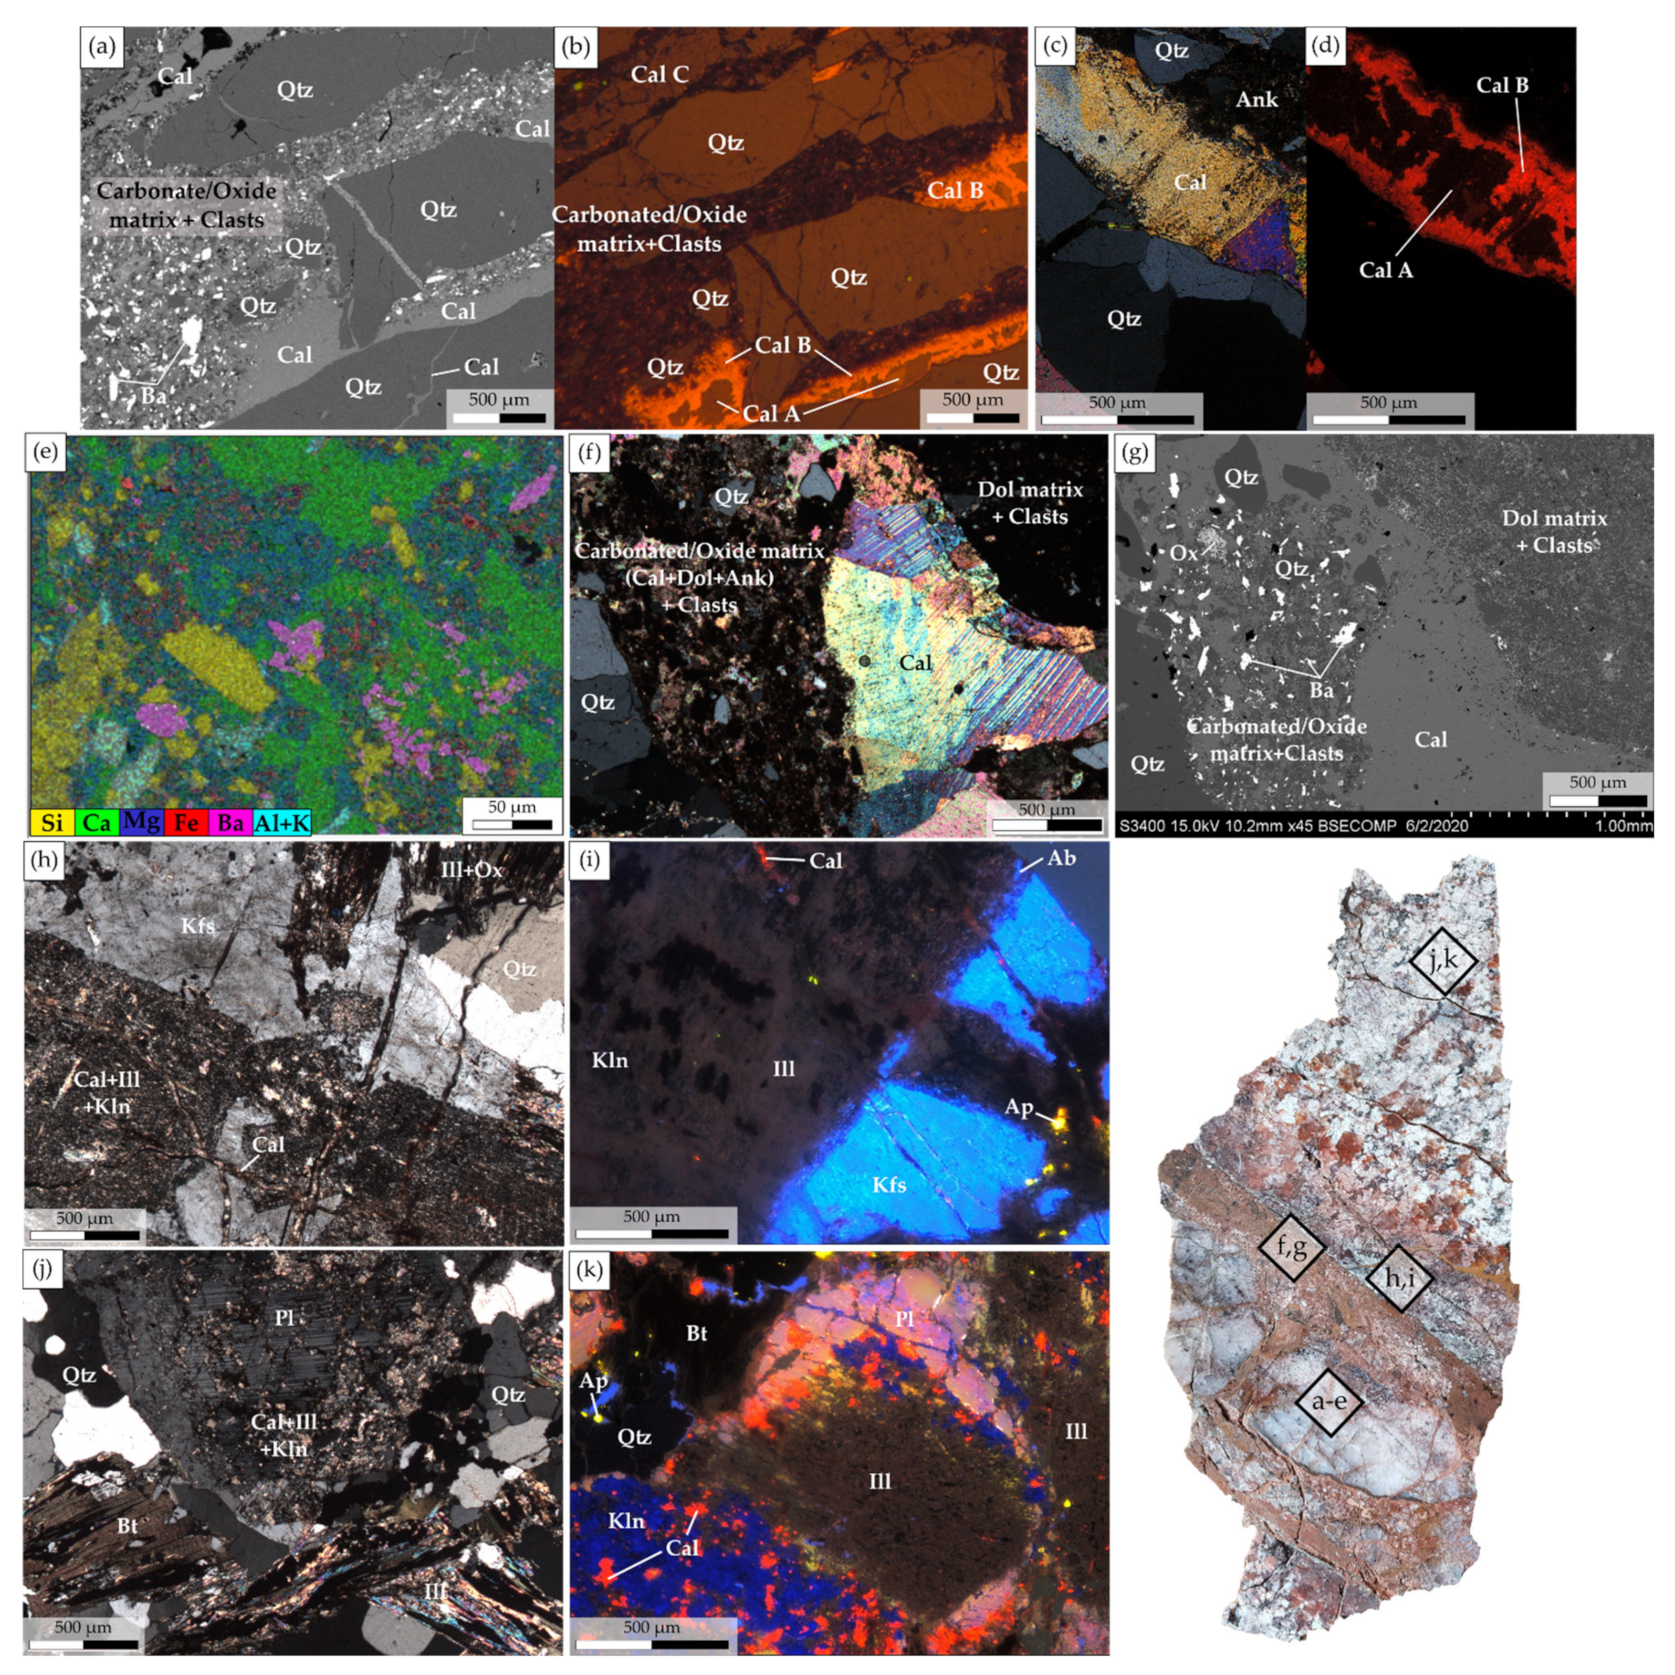
  • Petrographic and petrophysical characterization: the brecciated vein presents a large variety of mineralogical phases. As shown in Figure 7a, this zone shows a carbonate matrix containing clasts of granite, which overprints a brecciated quartz vein remnant showing an undulatory extinction but no evidence of dynamic recrystallization. The carbonate matrix is complex, composed of several phases (Figure 9a–g).
Focusing on the veins crosscutting the quartz porphyroclasts, three phases are identified (Figure 9a–e):
  • Phase 1 is composed of calcite veins crosscutting the quartz. These veins, appearing as a single phase under SEM and optical microscope (Figure 9a,c), present two phases under cathodoluminescence (CL): a dark phase (Cal A) in the center of the vein and an orange bright phase (Cal B) (Figure 9b,d). Cal B phase seems to dissolve or corrode the Cal A phase (Figure 9b,d). A zonation corresponding to calcite growth halos are visible in the phase A, which are used as weakness zones in which the phase B can penetrate by dissolving the phase A.
  • Phase 2 is composed of a matrix rich in carbonates (calcite, dolomite, ankerite) transported clasts of quartz, K-feldspars and few biotite, but also presents barite precipitation patches (Figure 9e). This phase crosscuts the quartz and the calcite veins.
  • Phase 3 consists again of calcite veins. However, they crosscut the whole rock, and appear as a dark single phase (Cal C) under CL (Figure 9b).
Evidence of hydraulic fracturing, as presented in Figure 6e, have also been observed in this part of the sample.
By focusing in the carbonate matrix, at the contact with the granite, a new phase is observed, composed of dolomite embedding small clasts (mainly quartz). This phase is intersected by the phase 2, which is intersected by the phase 3 (Figure 9e,f). Examining the hydrothermalized granite along the brecciated vein (NH_31_1 and NH_31_2), the granite shows a preserved magmatic texture with plagioclase fully altered into illite, ± kaolinite, and calcite, completely altered biotite into illite and oxides, and unaltered perthitic K-feldspar (Figure 9h,i). Hematite and numerous dolomite/ankerite and calcite veinlets are present. Moving away from the brecciated vein (NH_31_3), the granite appears less affected by the alteration. Plagioclase and biotite are only partially altered and K-feldspar and quartz are unaltered (Figure 9j,k). Unlike the hydrothermalized zone, the granite presents only a few veinlets of calcite.
Bulk chemical analyses were performed on the granitic part of the sample and show a low LOI of 2.5%, a porosity of 10.1%, and a calcite content of 1.86%, close to the brecciated vein (NH_31_1_2), and a calcite content of 1.37% away from it (NH_31_3).
Sample NH_36
This sample (Figure 1b and Figure 10a) shows a fractured granite with a preserved magmatic texture intersected by brecciated zones. As for sample NH_31, the fracture distribution analyses, as well as a petrographic description, were realized.
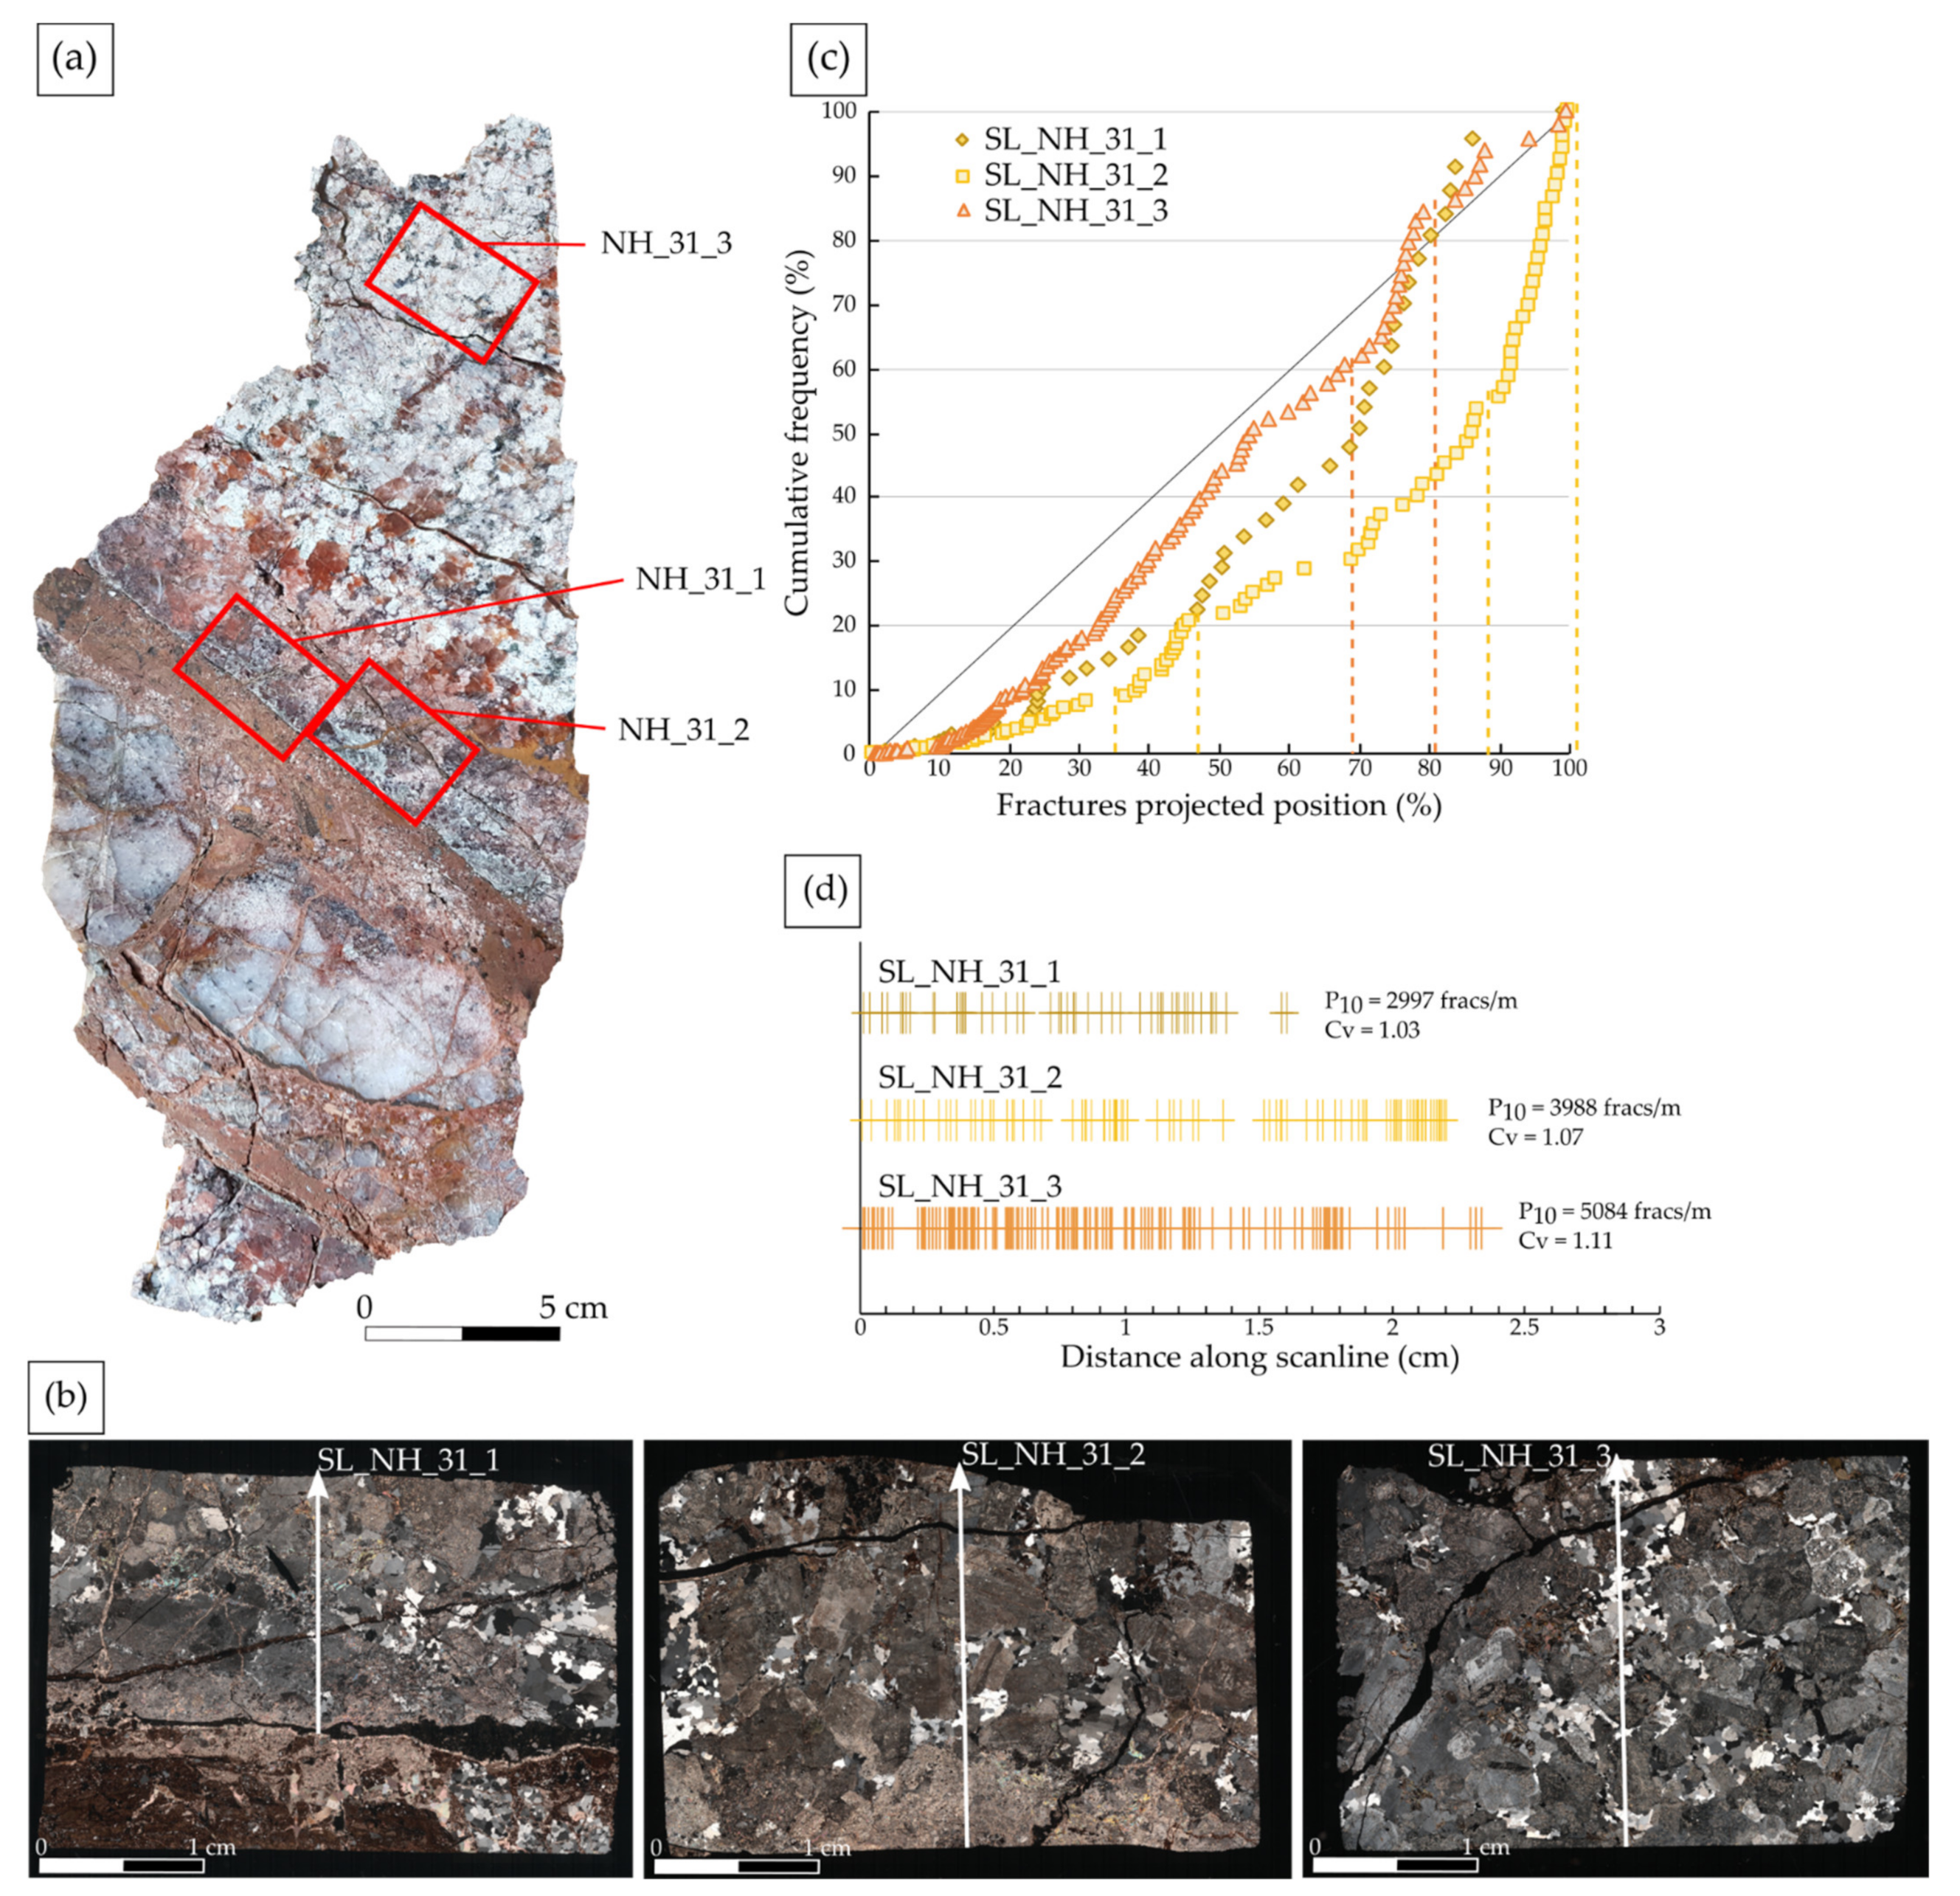
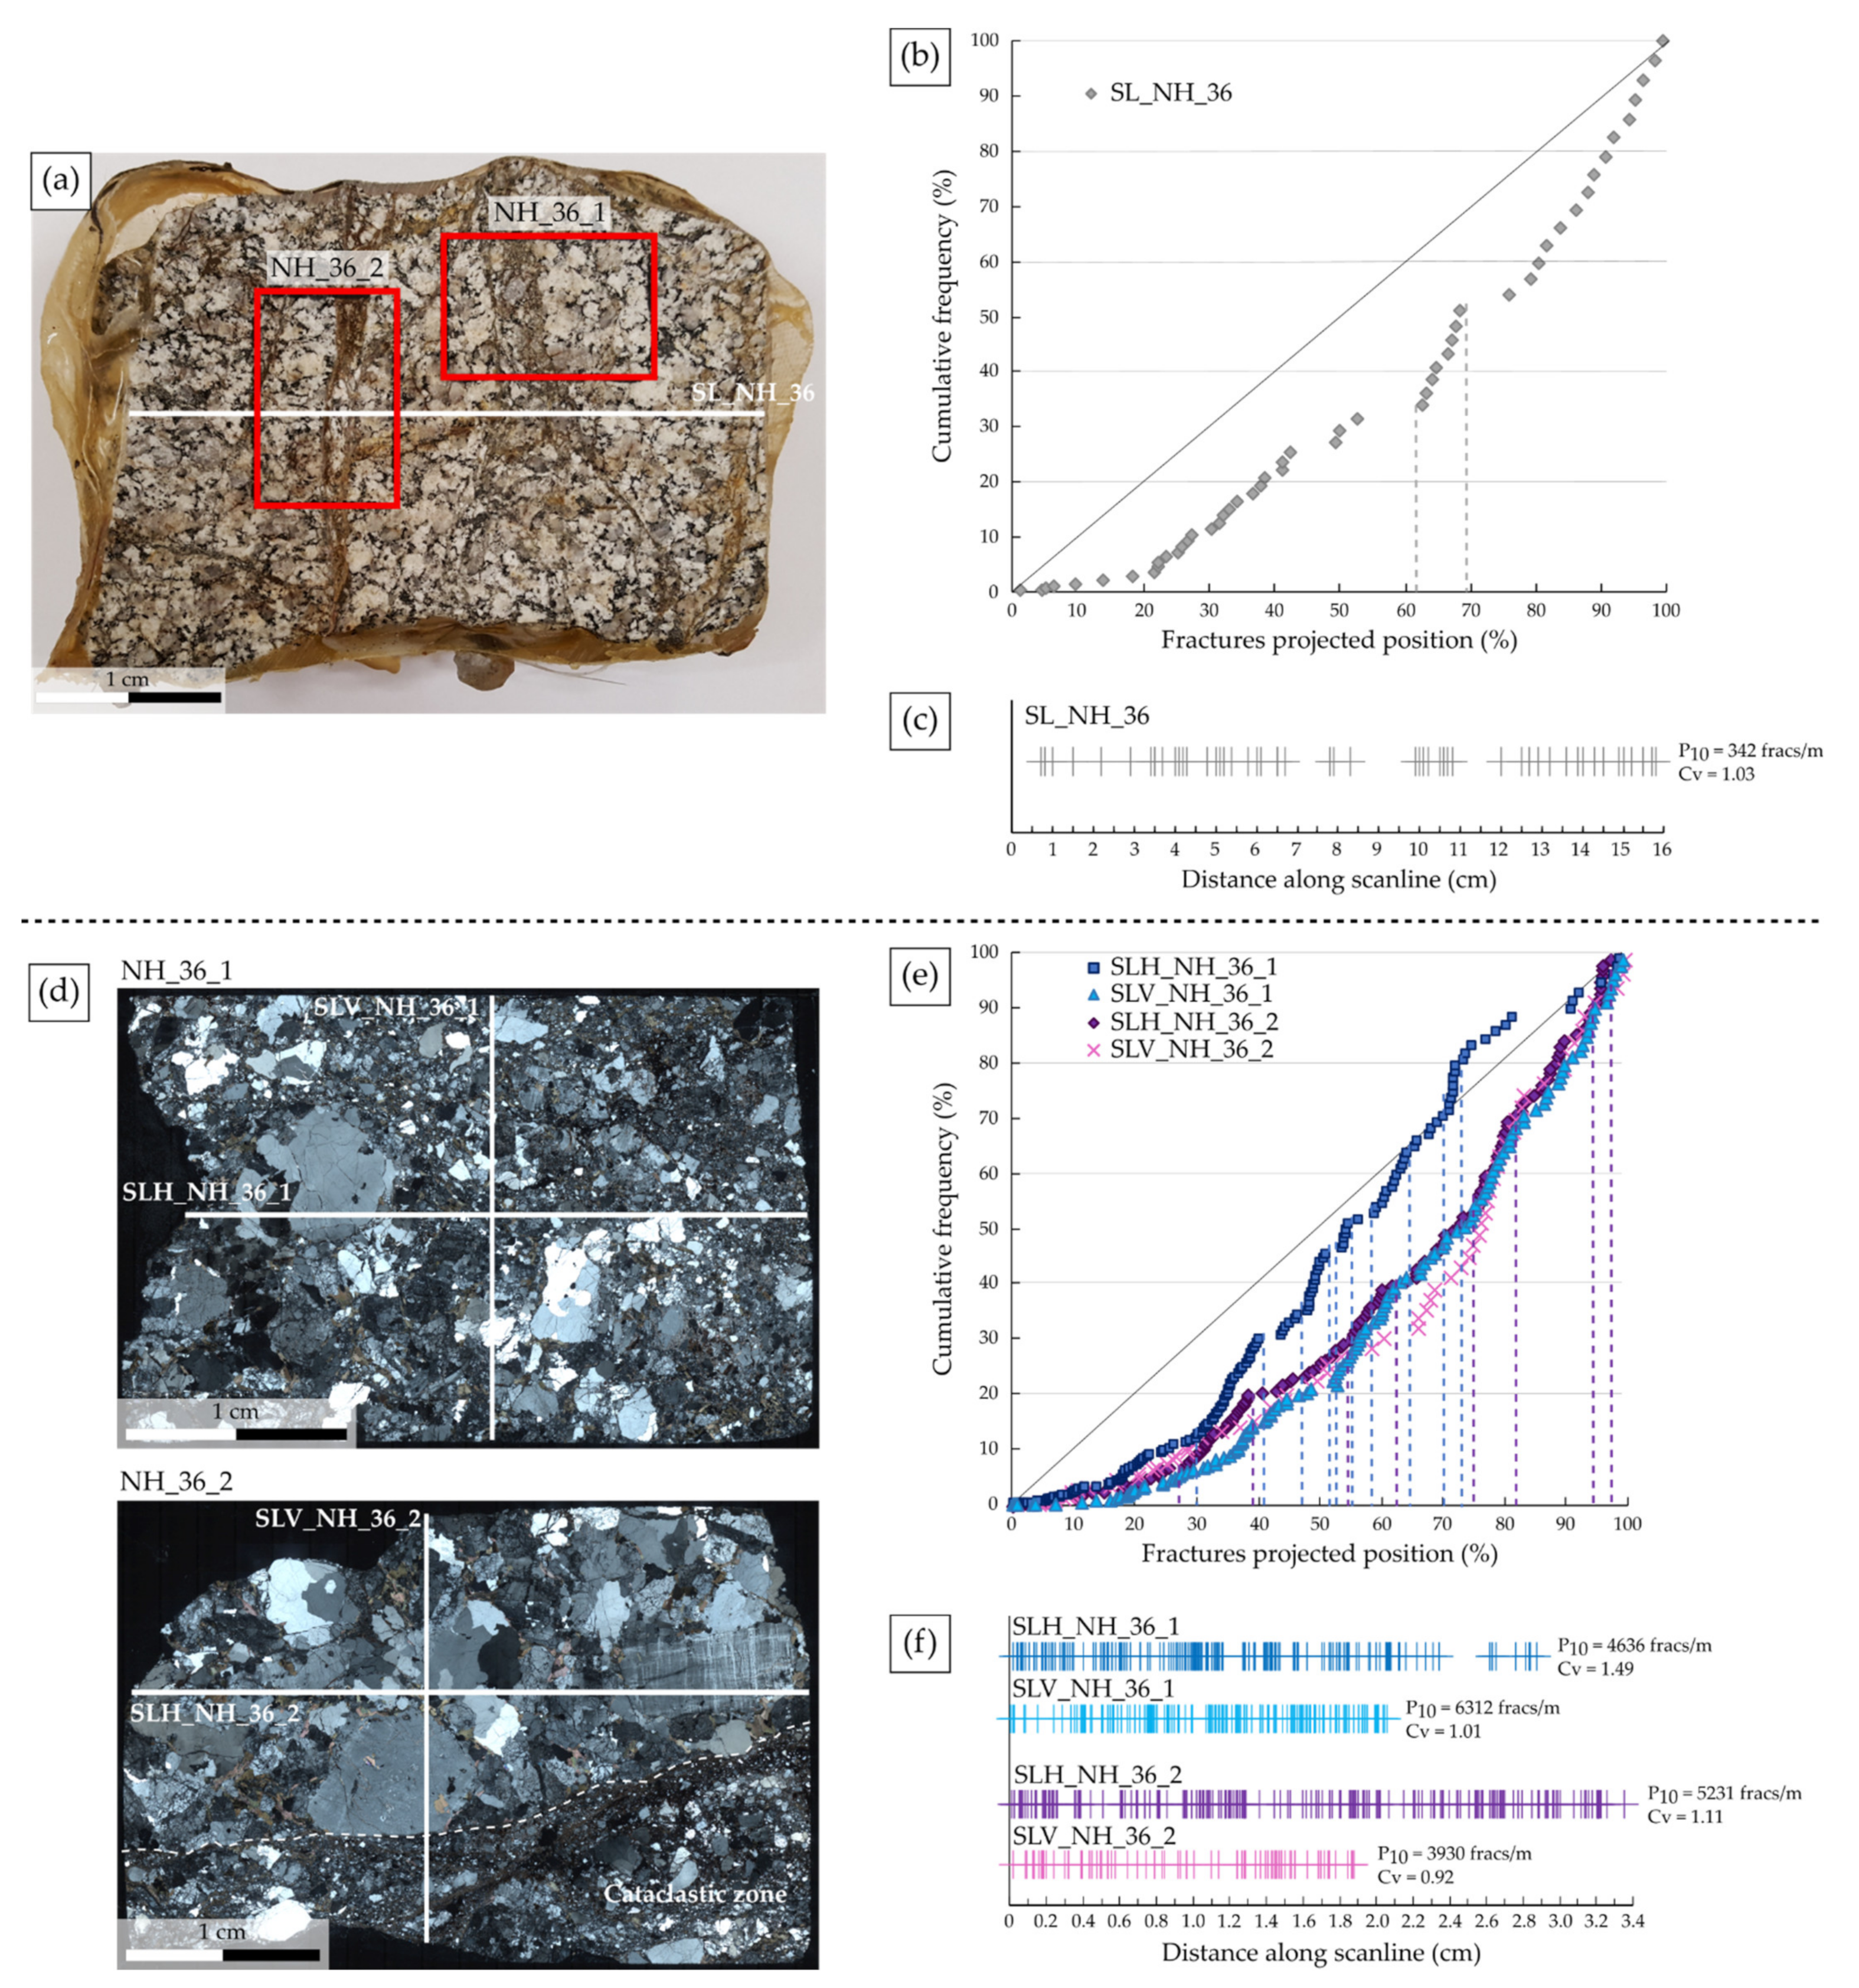
  • Spatial fracture distribution: the spatial fracture distribution analysis was realized based on data from [42]. One scanline was realized through the sample in order to evaluate the evolution of the fracture distribution and density (Table 2, Figure 10a). The cumulative frequency against the fractures projected position presented in Figure 10b shows a fracture frequency slowly increasing, as well as a fracture cluster. The Cv of 1.03 indicates a random arrangement of the fractures along the scanline (Figure 10c). A fracture density of 342 fracs/m was compiled (Figure 10c).
Two thin sections were made from the sample (Figure 10a,d). Two perpendicular scanlines were realized on each thin section (Figure 10d).
Regarding the thin section NH_36_1, the scanline SLH_NH_36_1, perpendicular to the main fractures, shows a fracture frequency increases slowly the first 30%, then increases more strongly by presenting five fracture clusters (Figure 10e). This fracture distribution is highlighted by a Cv = 1.49, confirming a clustered arrangement of the fractures (Figure 10f). The fracture clusters are respectively comprised between, 0.9–1.2 cm, 1.4–1.5 cm, 1.55–1.6 cm, 1.7–1.85 cm, and 2.05–2.1 cm intervals (Figure 10e,f). The scanline SLV_NH_36_1, parallel to the main fractures, shows a different trend. The fracture frequency increases slowly and irregularly (Figure 10e). This distribution is highlighted by a Cv = 1.01, indicating a random arrangement of the fractures (Figure 10f). Considering both scanlines, the average fracture density is of 5474 fracs/m.
Regarding thin section NH_36_2, the scanline SLH_NH_36_2, parallel to the main fractures shows a fracture frequency trending similarly to SLV_NH_36_1. Four fracture clusters were identified (Figure 10e), also visible in the stick plot between 0.95–1.3 cm, 1.85–2.05 cm, 2.5–2.7 cm, and 3.1–3.2 cm (Figure 10f). The Cv = 1.11 confirmed a random to clustered arrangement of the fractures. The scanline SLV_NH_36_2, perpendicular to the main fractures, crosscut the magmatic preserved texture of the granite and a breccia. A change of the curve inclination is visible around 65% of the scanline, where the fracture frequency strongly increases (Figure 10e). It corresponds to the limit between both zones (Figure 10d). The Cv = 0.92 indicates a global regular to random fracture arrangement along this scanline (Figure 10f). Considering both scanlines, the average fracture density is of 4581 fracs/m.
Because fractures are difficult to recognize in the breccia of the sample NH_36_2, the fracture density calculated for both thin sections may be underestimated.
As for sample NH_31, an important difference between the P10 values of the sample and the thin sections is observed. However, a global random arrangement of the fractures at both scales is observed. Only SLH_NH_36_1 presents a clustered distribution.
  • Petrographic and Petrophysical Characterization
The two thin sections (Figure 11a–c) allow petrographic characterization of the sample. The first thin section, NH_36_1 (Figure 11a,b), shows a breccia of the granite with significant variations of the grain size. No crystallographic preferential orientation (CPO) is observed. Some zones show brecciated minerals with small precipitation of carbonates as calcite and dolomite in the microfractures (Figure 11d). Primary minerals are only slightly altered but intensively deformed. Quartz shows a pronounced undulatory extinction and starts to dynamically recrystallize by means of sub-grain rotation processes (Figure 11d). Other zones show preserved minerals, but also a significant amount of carbonate, mainly calcite, between the clasts (Figure 11e). The second thin section, NH_36_2 (Figure 11c), shows a granite with a preserved magmatic texture, but fractured, and a breccia composed of a carbonate matrix and transported clasts coming from the granite with no CPO. The preserved granite part shows a low alteration degree. Quartz, K-feldspars (orthoclase and microcline), and biotite are fractured and unaltered. Plagioclase is fractured, slightly altered, and replaced by kaolinite (Figure 11f). The breccia shows a matrix composed of dolomite and calcite flowing through transported clasts of unaltered quartz and feldspar and lenses of kaolinite (Figure 11g).
Bulk analyses show a low LOI (2.6%), a calcite content of 5.95%, and a porosity of 11.5%. XRD bulk and clay fraction analyses also reveal the presence of gypsum and halite.
Sample NH_23
At outcrop (Figure 5b) and sample (Figure 12a) scales (Figure 1b), three compartments were identified: (1) a vein composed of a microcrystalline quartz-feldspathic unit, showing signs of foliation with clear shear sense indicators, bordered by a calcium rich mylonite and containing clasts of it, (2) a hydrothermalized zone in the granite along the vein, represented by a pinkish halo and (3) the porphyritic granite (Figure 12a).
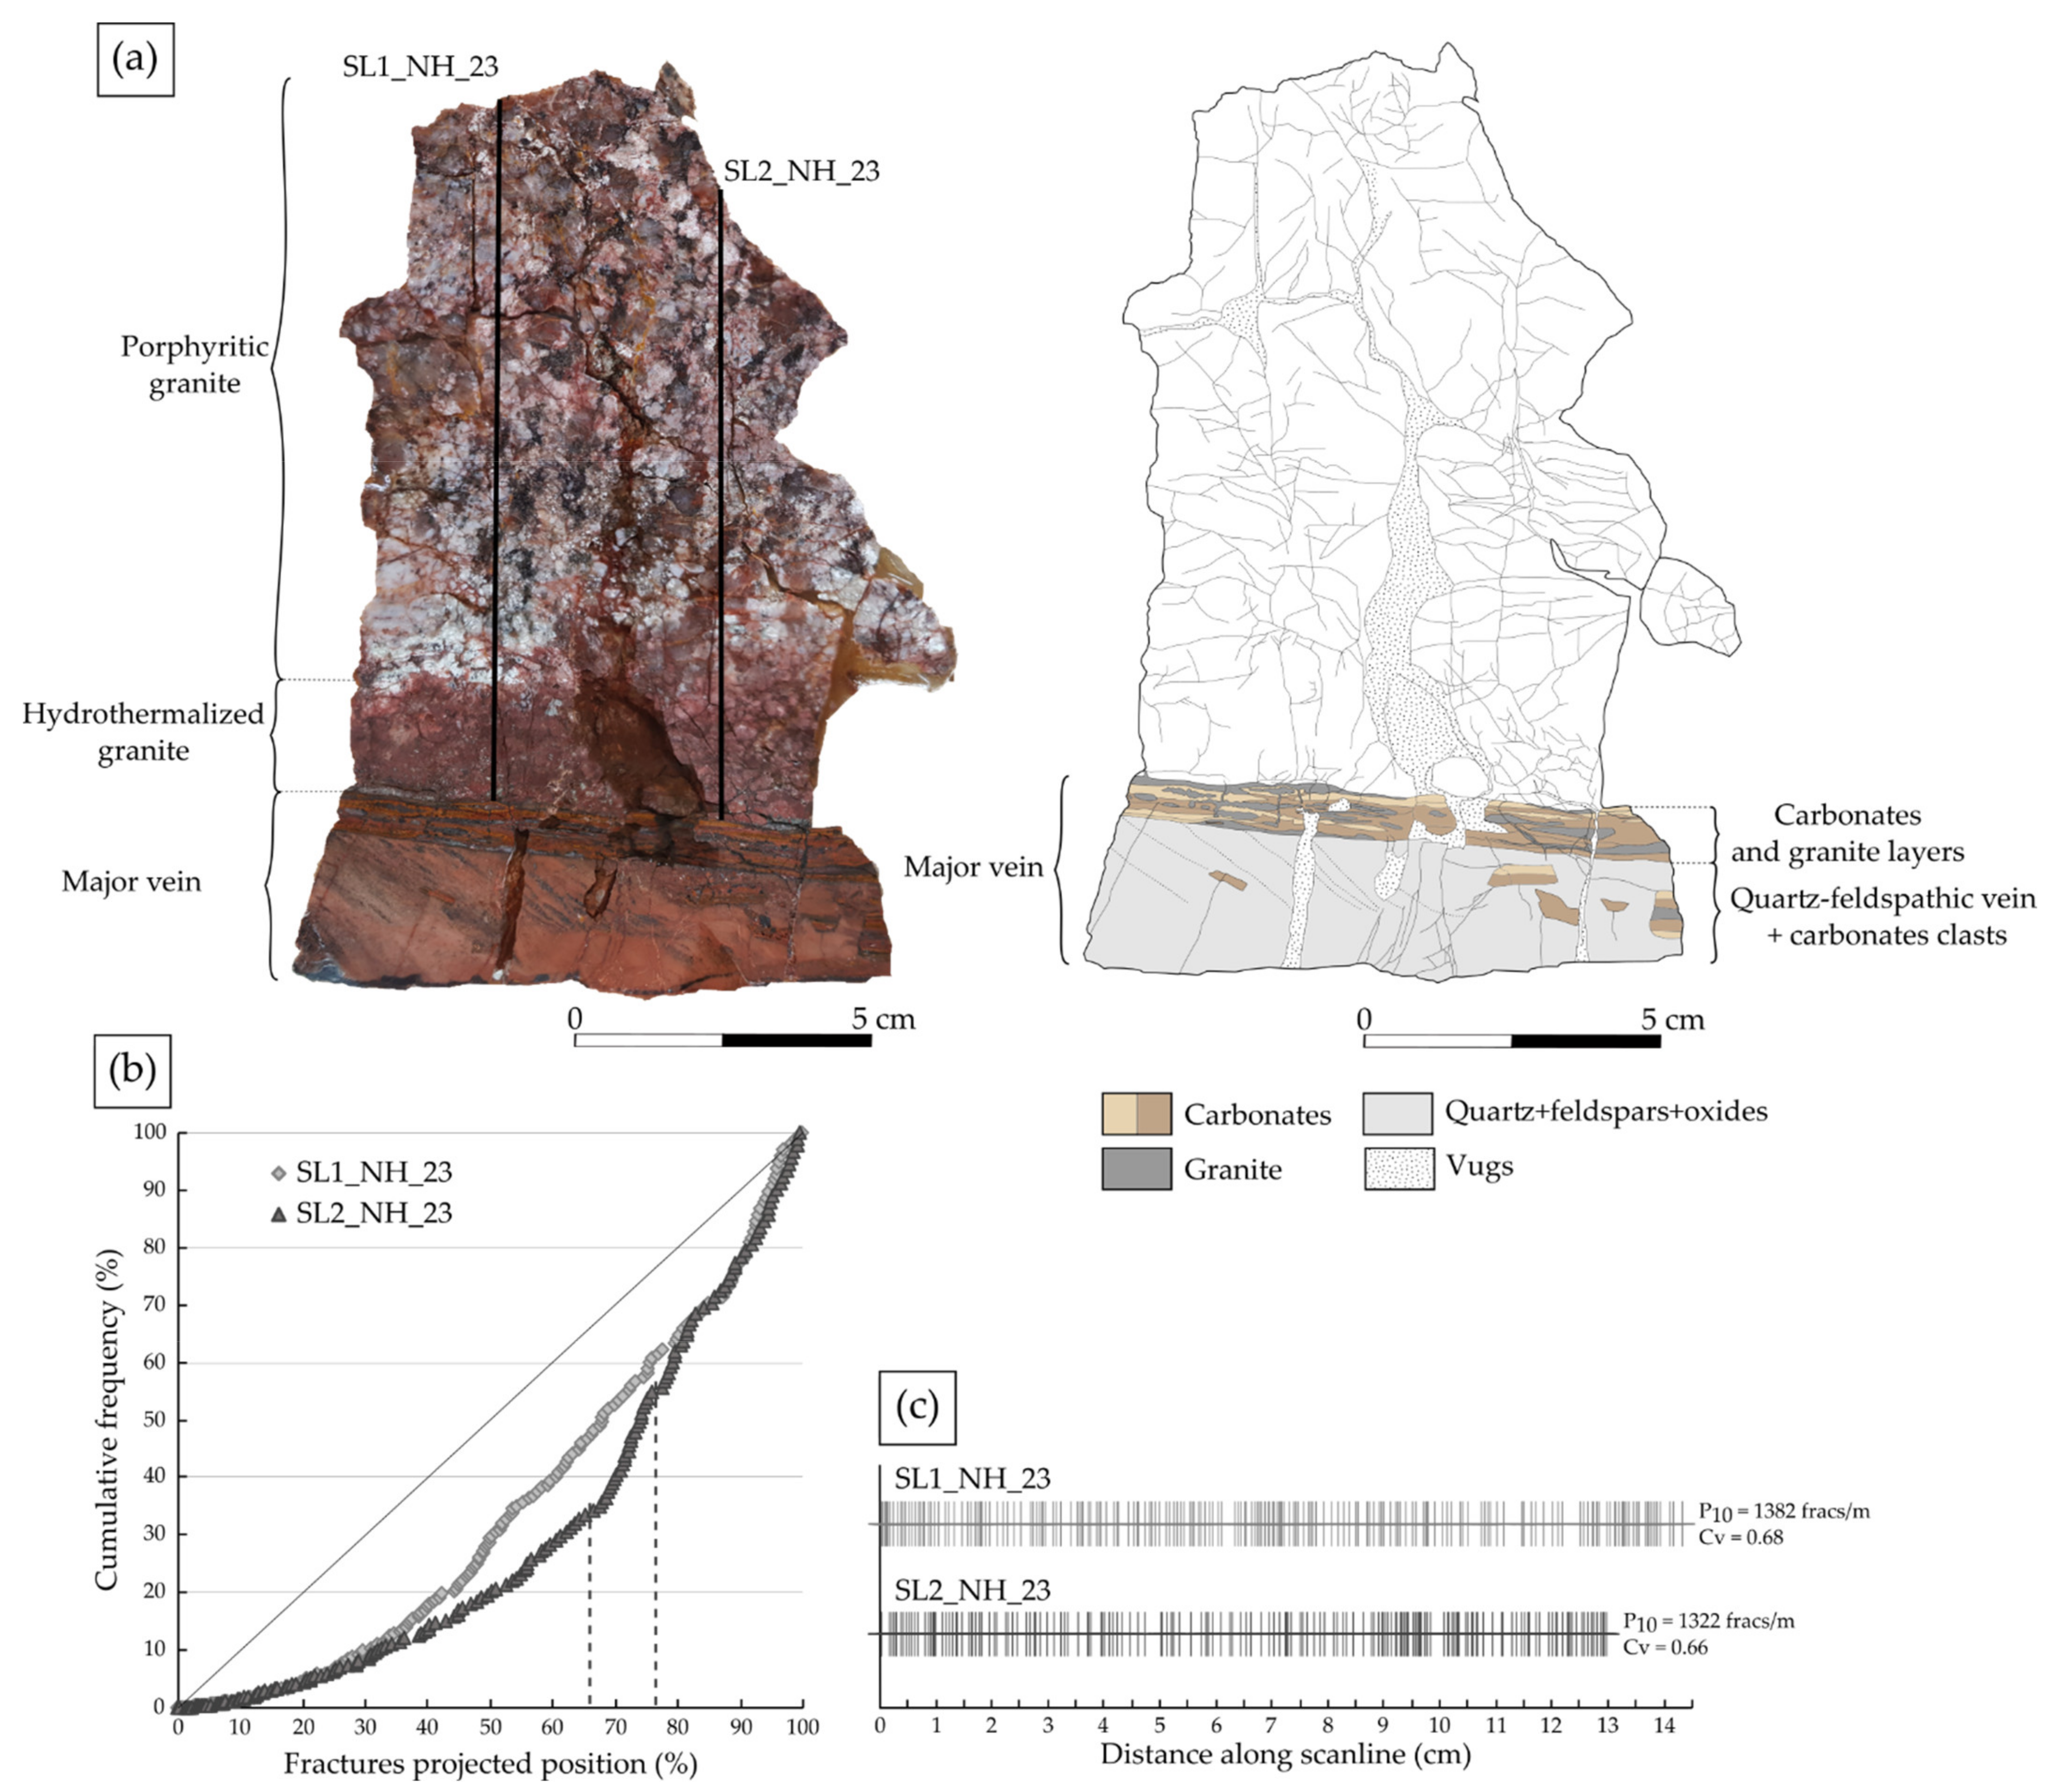
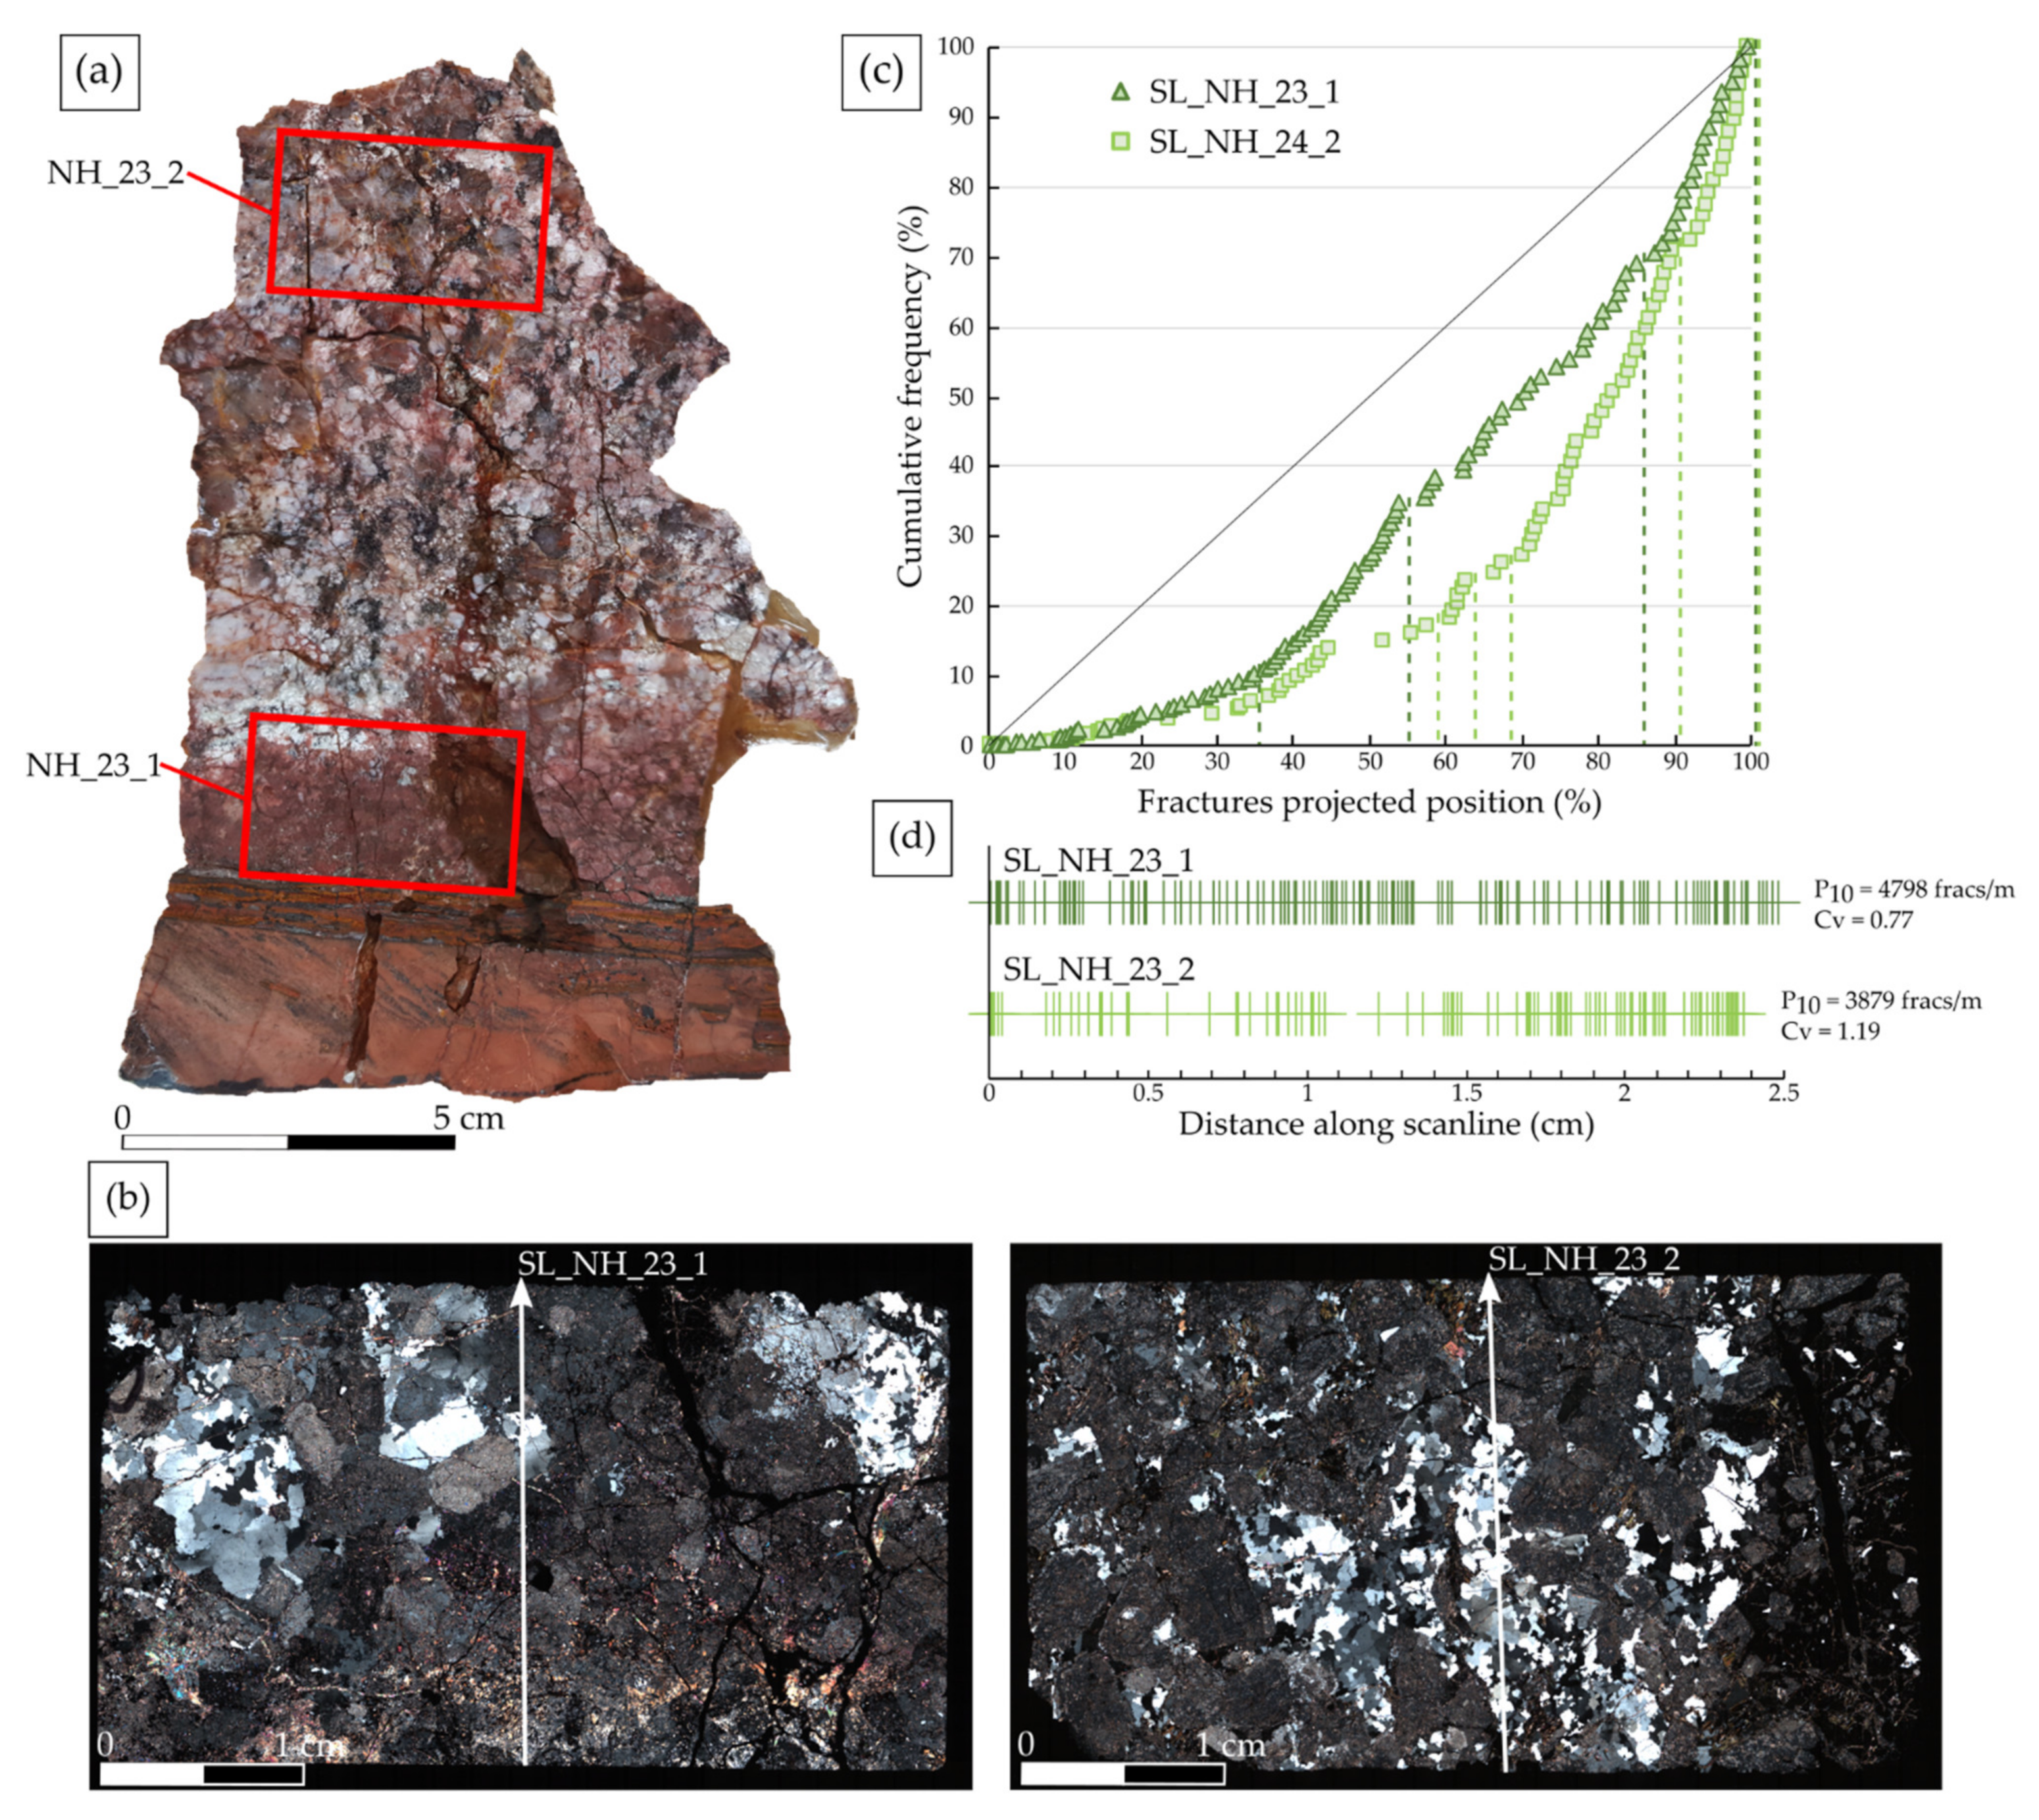
  • Spatial fracture distribution: two scanlines were realized in the granitic part of the sample NH_23 to evaluate the fracture arrangement from the vein towards the host rock (Figure 12a). The spatial analysis is summarized in Table 2. Fracture distributions presented in Figure 12b,c for each scanline show an evolution in two steps of the fracture cumulative frequency (Figure 12b).
Along the SL1_NH_23 scanline, the frequency slowly increases and shows a regular fracture distribution. At 40% of the scanline, the frequency slightly increases, with a regular arrangement of the fractures. The stick plot Figure 12c highlights this distribution. The SL2_NH_23 scanline presents a similar evolution as SL1_NH_23 scanline, with an increase in the frequency at ¾ of the scanline. This slope change is expressed at the end by a fracture cluster around 8.7–10 cm, clearly visible on the stick plot (Figure 12c). The Cv of 0.68 and 0.67 for each scanline shows a regular to random arrangement of the fractures along both scanlines (Figure 12c, Table 2). Both scanlines fracture densities are equivalent, with respectively 1382 and 1322 fracs/m (Figure 12c, Table 2).
In order to complete the dataset, the method was repeated on two thin sections from the granite. One is at the border of the vein (NH_23_1) and the second away from it (NH_23_2) (Figure 13a). A scanline was realized in both thin sections (Figure 13b), perpendicular to the major vein. The spatial analysis is presented in Table 2.
Along the SL_NH_23_1 scanline (Figure 13c), a low fracture density zone is present at the beginning of the scanline, then there is an increase of frequency between 0.9–1.4 cm (fracture cluster, Figure 13d), followed by an irregular fracture distribution until the 0.4 last cm where a fracture cluster was identified. Three fracture clusters are present in the SL_NH_23_2 scanline around 1.5 cm, between 1.7–2.1 cm, and around 2.3 cm. From the first fracture cluster, the frequency increases significantly and irregularly. The scanline SL-NH_23_1, with the Cv = 0.77, shows a regular to random arrangement of the fractures, while the Cv = 1.19 of the scanline SL_NH_23_2 indicate a random to clustered arrangement (Figure 13c). The fracture distribution varies with the position of the scanline and shows a P10 slightly higher close to the vein (4798 fracs/m) than away from it (3879 fracs/m) (Figure 13d).
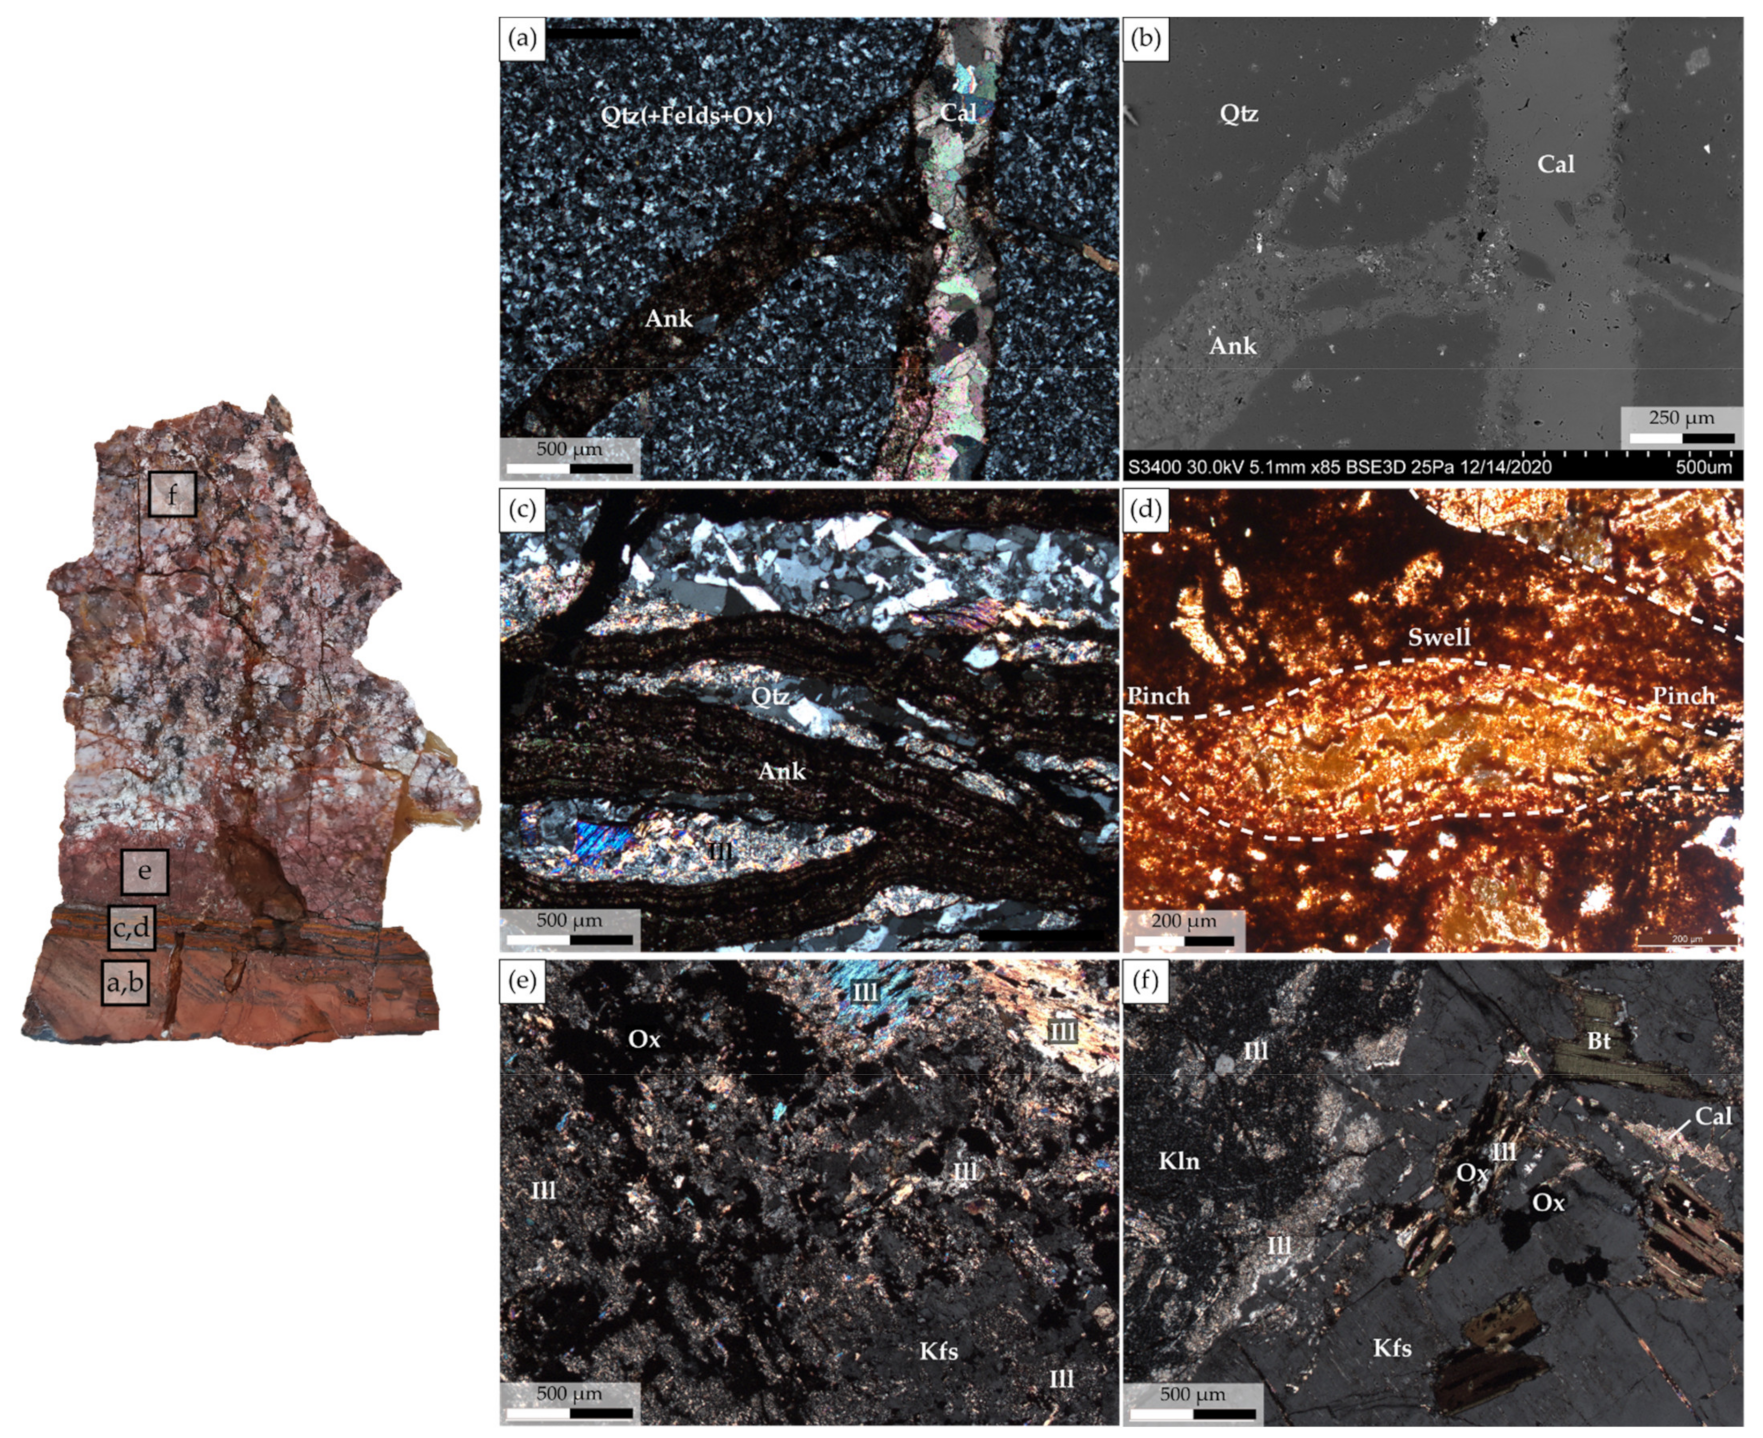
  • Petrographic and petrophysical characterization: the vein of the sample NH_23 consists of two parts. The major part is mainly composed of quartz, few feldspars, and oxide minerals having no CPO. Ankerite veinlets crosscut it, and are also intersected by calcite veinlets (Figure 14a,b). This vein includes clasts of carbonates having the same characteristics as the carbonate vein at the contact with the granite (Figure 12b). This thin carbonate vein is composed of ankerite layers and granite lenses (Figure 14c). By zooming in on the ankerite layer, some part of it appears as lenses with automorphic crystals in the swell, which are crushed and stretched through the pinches (Figure 14d). Granite is pinched between these ankerite layers. Quartz clasts present in the granite lenses show an undulatory extinction, as well as some evidences of subgrain rotation phenomena. Carbonates can deform plastically and accumulate large amount of strain at relatively low P–T conditions, from a minimum temperature of 180 °C [78,79,80,81]. Quartz crystal plastic deformation is dominant from 600 °C [82]. Hence, in the present situation, carbonates accommodate large amounts of deformation by means of crystal plasticity, while granite is being deformed by cataclastic flow, i.e., a process accommodated by brittle processes. A localized and significant amount of deformation occurred in this vein. The major vein of this sample is thus composed of (1) a highly deformed zone made of ankerite and granite lenses and (2) a siliceous vein, which contains clasts of similar composition to the carbonate vein. We suggest that the carbonate vein was the first event, which was intensively deformed, and then intersected by the siliceous vein, tearing off pieces of the carbonate vein. Calcite and ankerite veins identified in Figure 14a,b intersect the carbonate vein and the siliceous vein.
As presented above, the magmatic texture of the granitic part of the sample is preserved. However, a color change of the granite is observed close to the vein. At a sample scale, the granitic part along the vein (NH_23_1) shows a pronounced pinkish color (Figure 13a). In the thin section, the granite appears almost completely altered. Plagioclase and biotite are no longer recognizable and are replaced by illite and oxides. Perthitic K-feldspar are not completely affected by the alteration, but are partially replaced by illite (Figure 14e). Away from the vein (NH_23_2), the granite appears whitish at a sample scale (Figure 13a). Compared to NH_23_1, plagioclase are completely replaced by illite and kaolinite, but biotite are only partially altered and K-feldspar are unaltered (Figure 14f). This indicates that the granite is more affected by the alteration along the vein, in the hydrothermally altered zone. Bulk analyses performed on the granitic part of the sample show a LOI of 5.2%. In all the granite, calcite veinlets are observed coming from the major vein.

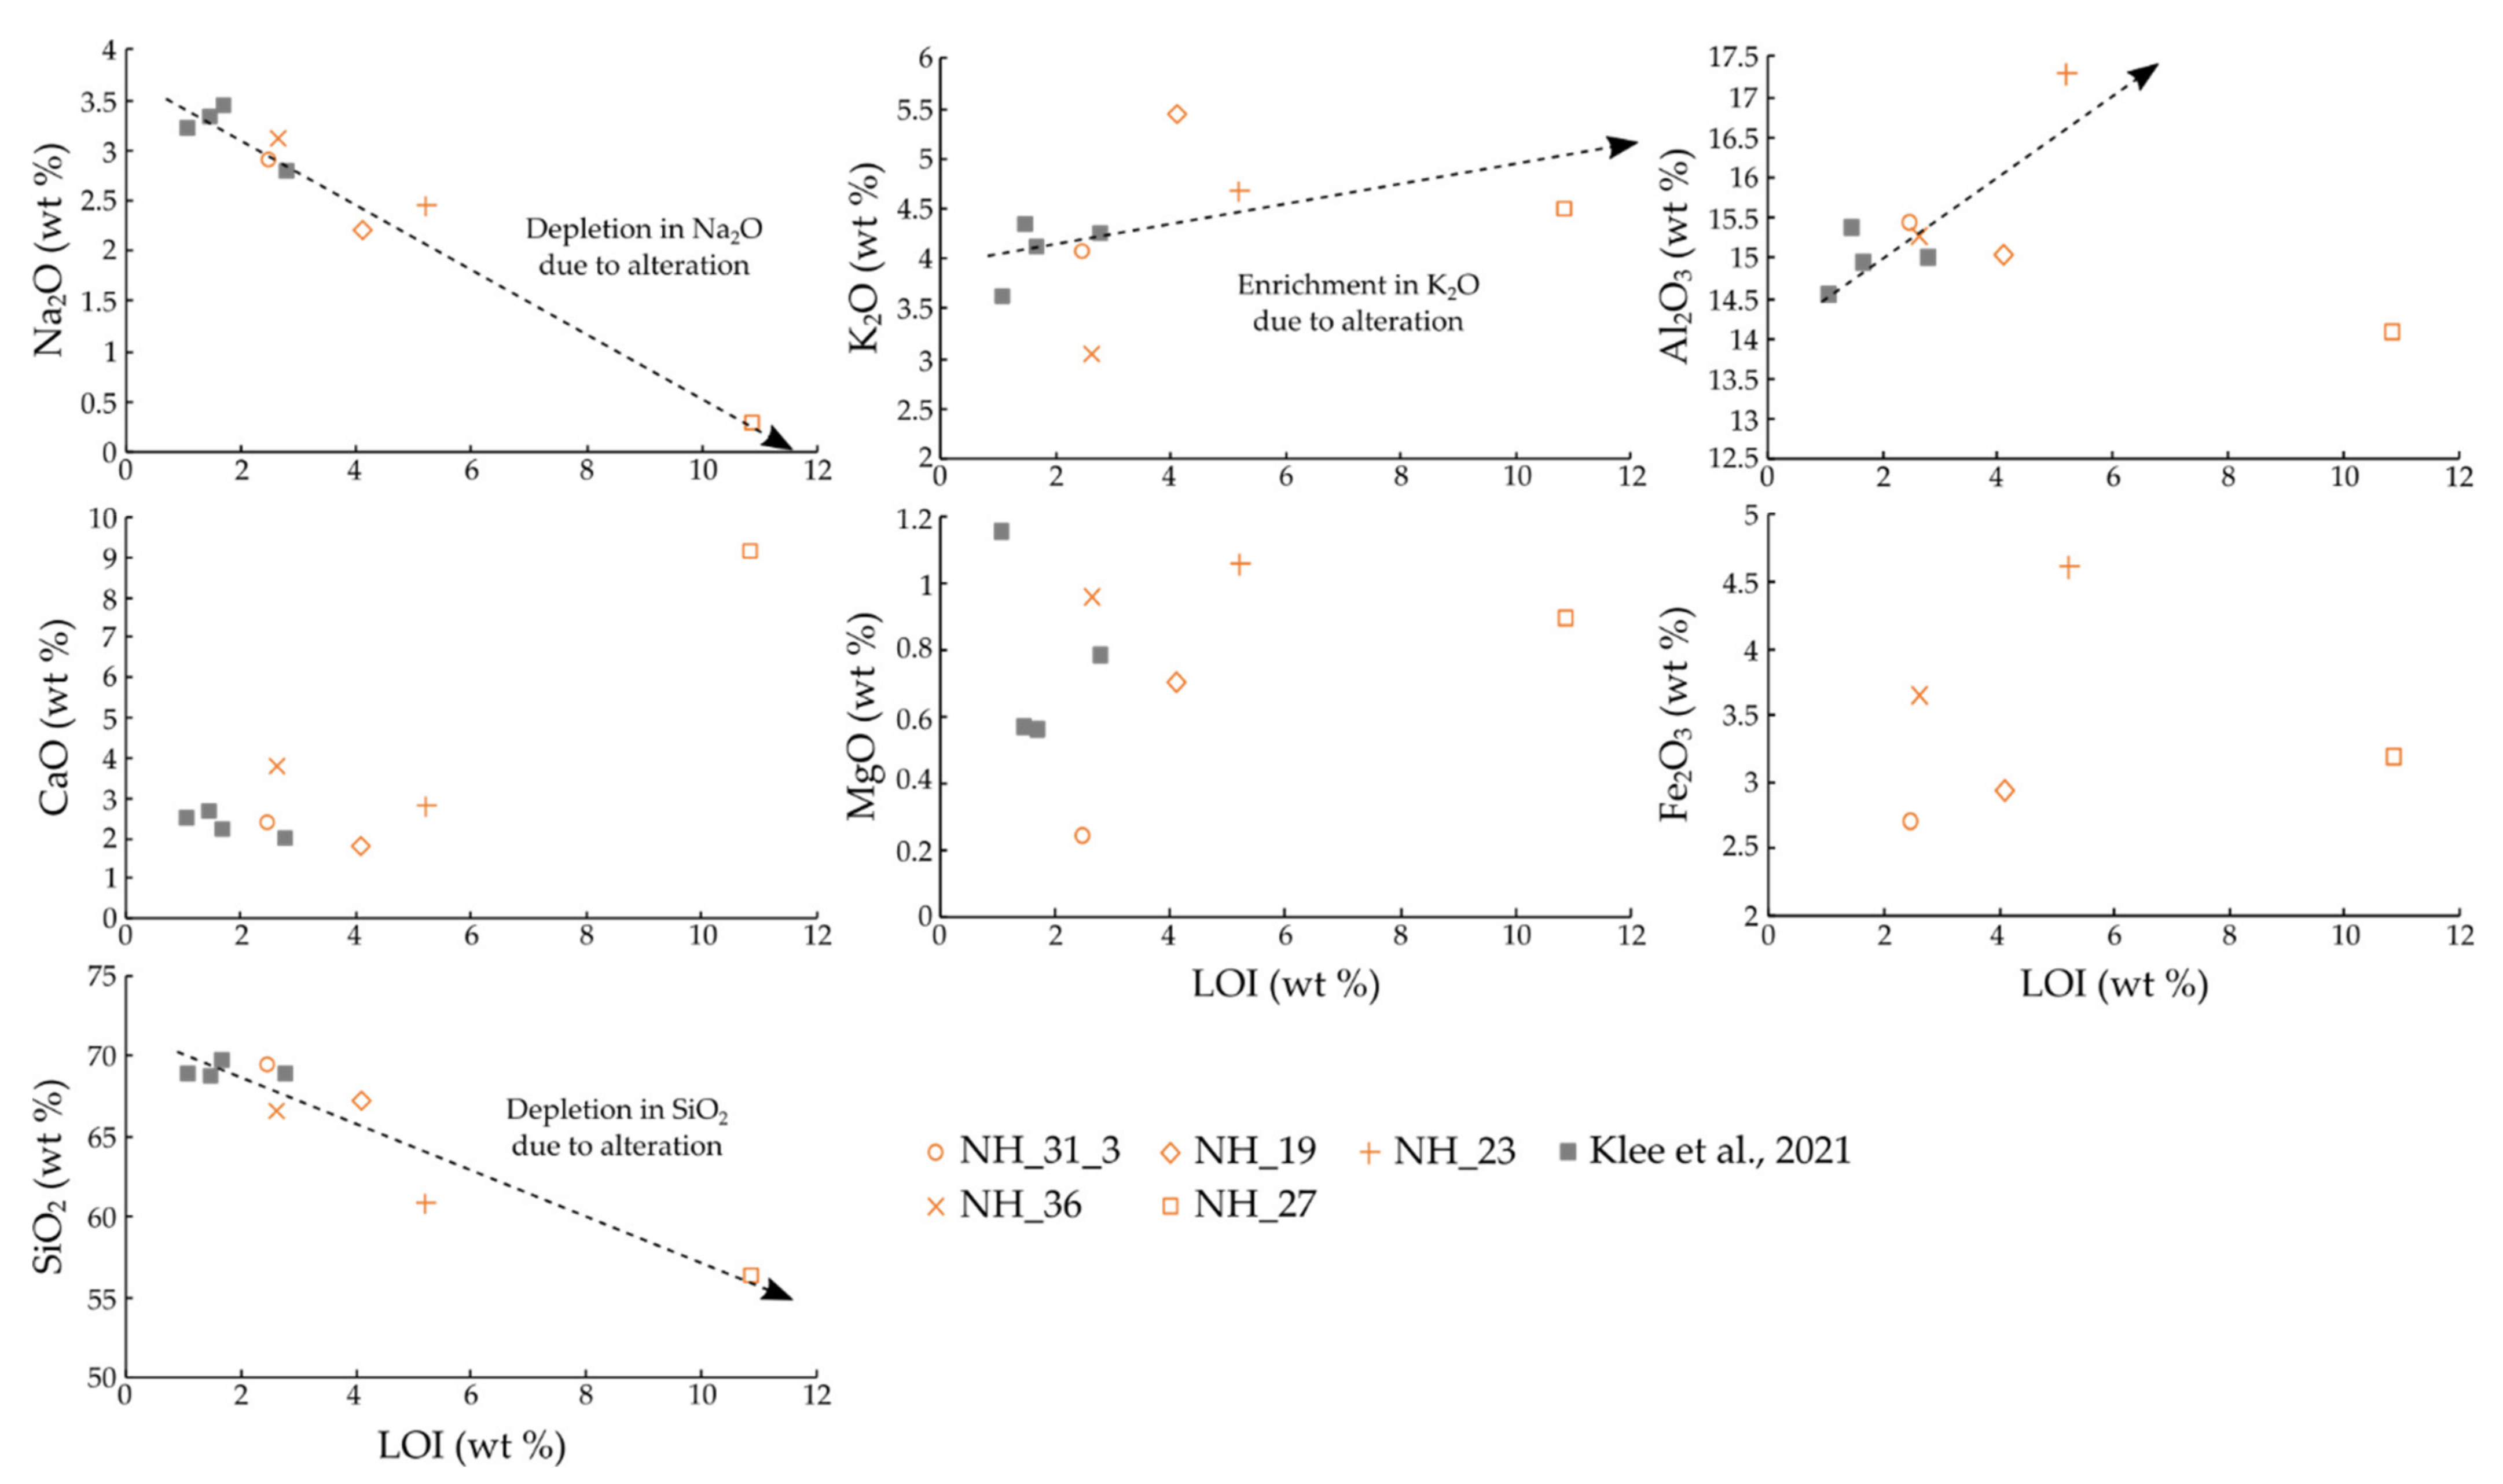
4.4. Geochemical Analyses

The geochemistry of major elements, presented in Table 3, allows establishing diagrams representing selected elements versus LOI (Figure 15) in order to study the alteration degree of the selected samples.
The LOI ranges from 2.50 to 10.90 wt% with an average around 5 wt%. The LOI values show a negative correlation with Na2O and SiO2 and a positive one with K2O. The CaO content varies slightly between 1.81 wt% and 3.12 wt%, except for the sample NH_27, which CaO content is about 9.10 wt%. Al2O3, MgO, and Fe2O3 content vary more widely in the ranges 14.05–17.31 wt%, 0.24–1.06 wt%, and 2.69–4.61 wt%, respectively. However, a positive correlation is observed between Al2O3 and LOI if the sample NH_27 is rejected. These diagrams show that carbonate (represented by Ca and Mg) and oxide (represented by Fe) precipitations do not depend on the LOI.

4.5. Calcite Content

Calcite is present in the majority of the samples. Samples homogeneously distributed in the studied area were selected for calcite content analyses. The calcite content is represented on the map in Figure 16 by the white dots and figures. The values range between 1.2% and 8.7%. Fracture zones, as well as the surrounding granite, present variable calcite content. However, the calcite content appears higher in the southeastern part of the range than in the northwest. All of the samples, except NH_17, NH_26, and NH_31_3, have a calcite content higher than 1.8%, meaning that they were affected by hydrothermal alteration, according to White et al. (2005) [72].

4.6. Porosity and Mass-Balance

Porosimetry measurement was only performed on samples NH_27, NH_31_3, and NH_36 (Table 4). NH_36 is the closest to a fracture zone and has the highest porosity (11.5%). This suggests that the porosity increases with proximity to fracture zones. Porosity measurements were used to better decipher the petrophysical properties of the rock for geothermal purpose and to realize mass-balance calculations. The chemical compositions recalculated after suppression of the LOI, the densities, and volume factors (Fv), assuming XAl2O3 = 0 of the rock samples used for mass balance calculations, are given in Table 4. The Fv shows values very close to 1, indicating a small change in volume between the freshest sample and the altered ones.
The results of mass-balance calculations, corresponding to the absolute mobility values of each element for each sample, are given in Table 5, by considering a constant volume, Fv = 1, as exposed by [76]. Positive values represent the gains and negative values the losses of the considered elements. Absolute mobility values indicate almost immobility of Al2O3, TiO2, and MnO. They also show losses of SiO2 and Na2O, which are three times more important in NH_27 than in NH_31-3, and twice that of NH_36. The losses of Fe2O3 and MgO are more important in NH_31_3 and less important in NH_36. CaO losses are observed in NH_31_3, whereas CaO gains are observed in NH_36 and a high gain is observed in NH_27. Finally, the results show a gain of K2O in samples NH_27 and NH_31_3 and a loss in NH_37.

4.7. Temperature Conditions

The clay composition of the fractions <2 µm and 2–6 µm was given in Table 1. For some of the samples containing enough illite, Kübler Index (KI) was measured for both fractions (Table 6). The fraction <2 µm likely is supposed to represent neoformed clay minerals, thus corresponding to the youngest event. By contrast, the fraction 2–6 µm might contain either more developed illite crystals by inherited grains recrystallization, or a mix of detrital and neoformed minerals. The KI gives information concerning the degree of metamorphism for each fraction. In some fraction, it was not possible to measure the KI due to the too low amount of illite.
KI values range from 1.32Δ°2θ to 0.29Δ°2θ for the <2 µm fraction and from 1.27Δ°2θ to 0.21Δ°2θ for the 2–6 µm fraction (Table 6). The spatial distribution of the samples and their associated KI values are shown in Figure 17 by the dots. In both fractions, most of the samples present KI values corresponding to the diagenetic zone, except for two samples (NH_32 and NH_34). These samples are located in the northwestern part of the main granitic body (Figure 7a,b), at the contact with the Proterozoic basement. They present lower KI values of low anchizone and epizone. No significant variations in KI or trends are observed between both fractions.
Some samples contain only kaolinite and no illite. Positive trends have been identified between KI and KCI for both clay fractions <2 µm and 2–6 µm (Figure 18). Samples NH_6, NH_8, and NH_31_1_2, with out of range values, due to the presence of I/S and/or corrensite interfering with the 7Å peak, were excluded from the correlation. The trends observed in the two different fractions are similar and give more confidence into the concomitant evolution of KI and KCI. The correlation provides temperature indications for illite-free samples. Thus, samples NH_26, NH_33, and NH_36 show values equivalent to diagenetic zone and anchizone conditions.

5. Discussion

5.1. Argillic Alteration Dominance

The characterization of the NH granite alteration processes in the vicinity of fracture zones reveals the presence of various secondary minerals, such as clay minerals (kaolinite, illite, I/S mixed layer, corrensite, and vermiculite), carbonates (calcite, dolomite, ankerite, siderite), and oxides. Thus, two successive types of hydrothermal alteration events, characterized by [19] in the protolith, were observed:
  • The propylitic alteration, which is an early stage of alteration affecting pervasively the granite during the cooling of the pluton [83]. It involves mainly the formation of corrensite and epidote considered as the major indicators of the propylitic alteration [19,22,84]. Only plagioclase and biotite are partially affected.
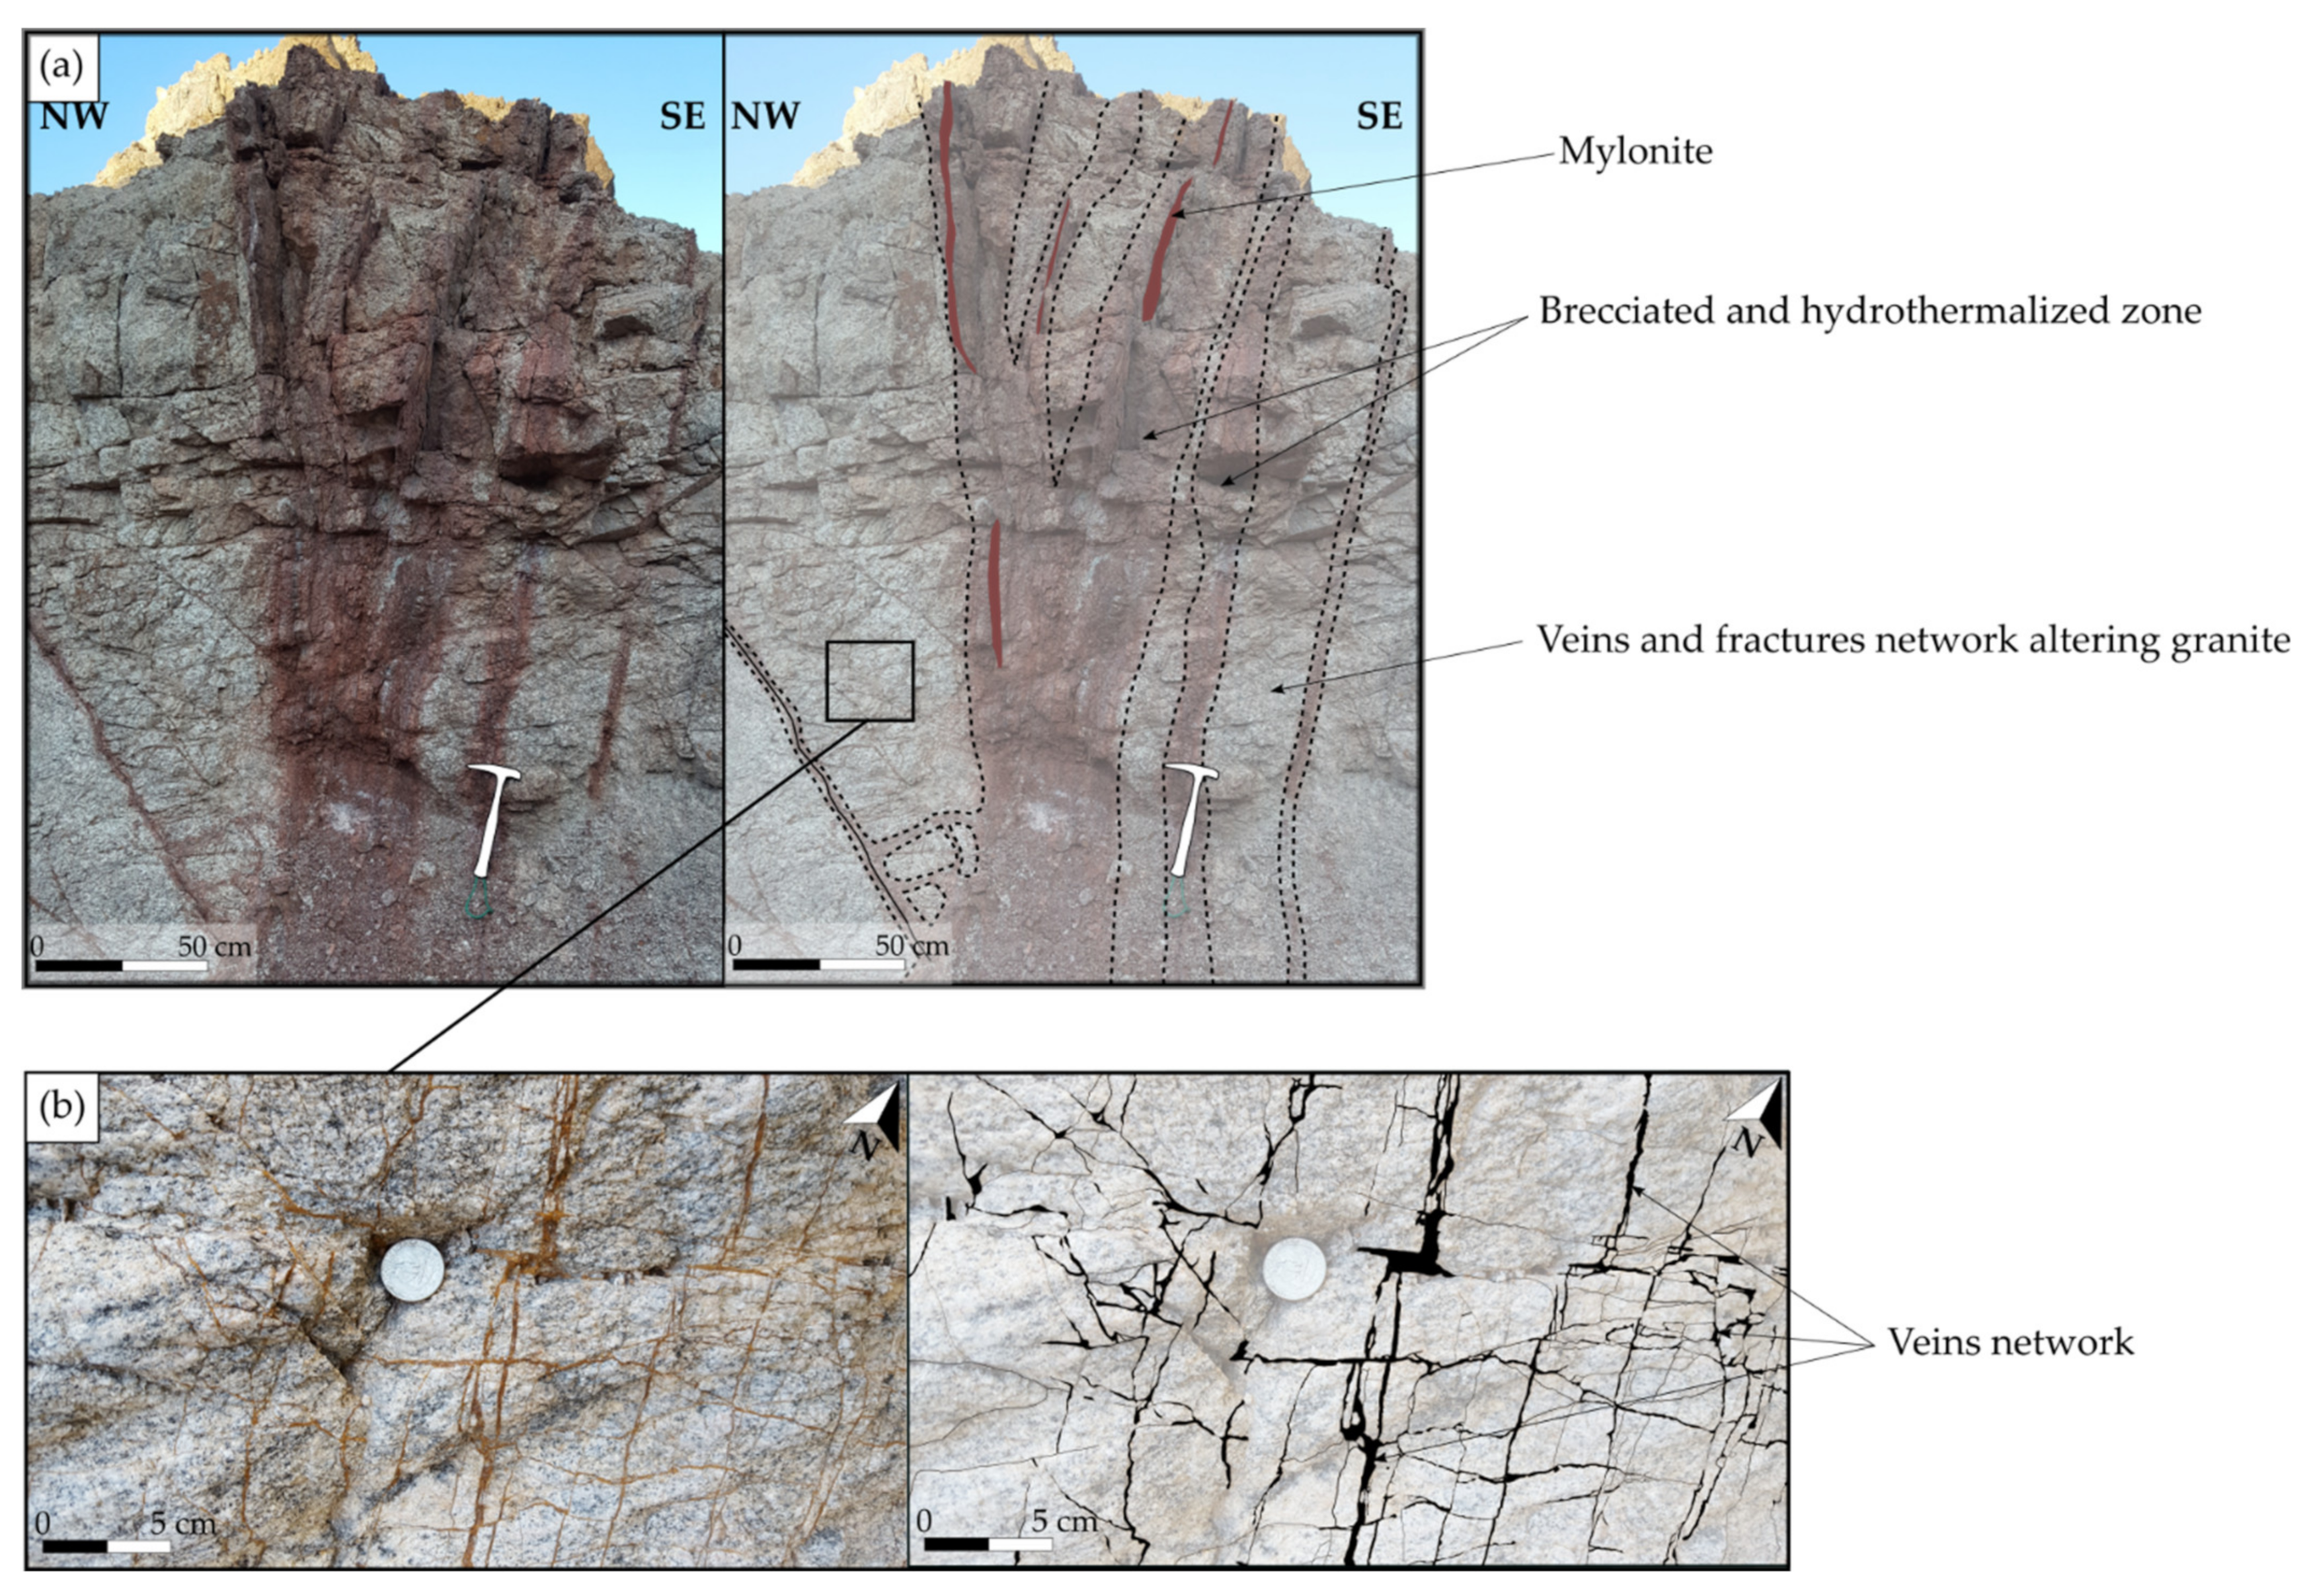
  • The argillic alteration, associated with fluid circulation through a fracture network. Thus, the argillic alteration is also called “vein” alteration [13,21,85]. It is characterized by (1) a high water/rock ratio in the fractures/veins walls, due to fluid circulating within the fracture network [20,21,24,86,87,88,89]; and (2) illite + kaolinite + illite/smectite mixed layers + carbonates + oxides replacing plagioclase, biotite and, more rarely, partially K-feldspar [19]. Fractures enhance the fluid circulation and, thus, the fluid–rock interaction. Alteration gradients are visible, increasing toward the fracture (Figure 7a, Figure 9h–k, Figure 12a and Figure 14e,f). An alteration zoning around microfractures is also presented in Figure 6f,g, which could correspond to a time dependent process controlled by a sequence of interrelated mineral reactions [15].
However, compared to [19], the samples are more altered and corrensite is not as evident as in the samples from this study. Kaolinite and illite are the prevailing clay minerals. This confirms a significant fluid–rock interaction near fractures and a predominant argillic alteration, which has overprinted almost completely the propylitic alteration. Kaolinite, being the dominant clay mineral, indicates either a more important leaching of the rock or the circulation of a more acidic fluid [90].
The samples NH_24, NH_26, and NH_33 contain a small amount of vermiculite, which can be associated to hydrothermal alteration at low temperature or to weathering. It is commonly thought that most of the vermiculite is formed under supergene conditions [91,92]. In these samples, the amount of vermiculite is low and the weathering contribution already discarded by [19].

5.2. Thermal Evolution toward Fracture Zones

Studied samples present KI values characteristic of the diagenetic zone, meaning temperatures lower than 200 °C [93]. However, KI values of samples NH_32 and NH_34 have lower KI values with anchizonal to epizonal conditions, meaning temperatures around 300 °C [93]. These two samples present the highest fracture density (Fd4) suggesting that shear heating could contribute to a local increase of temperature [94]. Moreover, KI values are similar between both clay fractions indicating the predominance of neoformed illite crystallization close to fracture zones. It is highlighted by the presence of illite veins observed microscopically. By comparing KI values from this study and from [19], the KI tends to decrease approaching fracture zones. Thus, the greater the fracturing, the higher was the temperature, except for NH_31_1_2 and NH_24. These two samples present higher KI values, meaning lower temperatures. It can be explained by the presence of I/S and vermiculite, forming at lower temperature than illite and kaolinite [91,92,95]. The samples NH_26, NH_33, and NH_36 present only kaolinite. KCI values correlating with KI values, these samples show temperatures estimated to be around 200 °C or less, which correspond to the temperature obtained for the other samples. Likewise, the presence of kaolinite in hydrothermal alteration paragenesis indicates temperature lower than 200 °C [90].

5.3. A Multi-Stage Paleo-Fluid Circulation

Hydrothermal alteration in crystalline basement rocks induces the precipitation of secondary minerals that can seal the fractures [2]. The argillic facies, described above, is also characterized by fractures filled by various kinds of secondary minerals, as a result of different fluid generations. Veins are formed from fluids that had reacted with granite [96] and transported various chemical elements. Through the petrographic analyses of the whole samples, a relative chronology between the different veins can be determined. Six vein generations, following each other, were identified (Figure 6 and Figure 9):
  • Quartz veins resulting in the precipitation of secondary quartz due to primary silicate partial dissolution.
  • Illite veinlets, which have different behaviors, according to the mineral crossed. Indeed, as presented by [19,97], plagioclase is the main pathway for fluid flow due to their abundance in the rock and to dissolution pit porosity, allowing the interconnection between the pores. In quartz and K-feldspar; however, only microfractures create the porosity allowing the fluid to circulate. This explains why veinlets look like straight lines in quartz and K-feldspar and are twisted and blurred lines in altered plagioclase. Illite veinlets can be contemporary to kaolinite veinlets.
  • A dolomitic brecciated vein embedding essentially quartz clasts, such as in sample NH_31.
  • Carbonate veins with different compositions: contemporary ankerite/dolomite veins, intersected by siderite veins and the whole intersected by later calcite veins. They are preferentially oriented NW–SE, according to the direction of the NH. It is suggested that the fluids, having precipitated these carbonate veins, have circulated through the fracture network formed by the activity of the SDVFZ.
  • A carbonate brecciated vein that is likely to have transported clasts of quartz, K-feldspar, and biotite, and is presenting precipitations of barite. This phase, but also barite itself, is only present in sample NH_31. This phase was probably due to a later event that reactivated the main fracture composing the sample and let a new fluid circulate.
  • Calcite veins, as shown in the sample NH_31, which are of a different compositions from generation 4.
Two types of calcite veins and the carbonate vein of phase 5 were, thus, identified through the sample NH_31, allowing the definition of two generations of calcite. However, they do not allow a decision on if the calcite veins identified in the other samples correspond to the generation 4 or 6. CL analyses are ongoing to identify the type of calcite generation. Sample NH_31 and the multiple vein generations show how complex the fluid circulation history was in this area.

5.4. Fluid Circulation and Argillic Alteration Effects on Petrographic and Petrophysical Behavior

The effects of the alteration on the element transfers are described by the diagrams plotting major element oxides against LOI (Figure 15) and by mass-balance calculations (Table 5) using the Gresens method [76] to quantify the losses and gains of elements during hydrothermal alteration. To this end, data from this study and from [19] were used. LOI has been defined as an indicator of the alteration degree [19,98,99] supporting optical observations. In this study, LOI values range from 2.5% to 10.9% (Table 3), whereas, Klee et al. (2021) [19] obtained values from 1.1% to 2.8% for the protolith. These values confirm a more pronounced alteration of the granite in the vicinity of fracture zones.
Concerning element transfers, only minor variations of Al2O3 were observed compared to the LOI, also confirmed through mass-balance calculations. Al is thus considered as immobile. This study has shown a significant SiO2 negative correlation with LOI. This loss is confirmed by mass-balance calculations. It indicates the partial silicate alteration, explaining the presence of quartz veins and veinlets through the granite. A negative correlation with LOI was observed for Na2O, confirmed by the loss of Na2O obtained by mass-balance calculation. Indeed, altered plagioclase are depleted in Na2O. No Na-bearing newly formed minerals (except a little I/S and C/S) was encountered. It is likely that Na was exported out of the alteration zone. When the alteration of plagioclase is less pronounced, as in samples NH_31_3 and NH_36 (Table 3), the Na2O depletion is lower. However, a global enrichment of K2O is observed linked to illite crystallization. A positive correlation is observed between the amount of alteration and illite formation. K-feldspar being rarely altered, chemical modelling would be necessary to determine whether the amount of K release by biotite alteration would be sufficient to allow the rather important formation of illite. MgO and Fe2O3 present no clear correlation with LOI. However, low depletion of Fe2O3 and MgO compared to the protolith were identified by mass-balance calculations. It is suggested that these depletions are linked to the alteration of biotite but they are compensated by their precipitation as oxides or in carbonates. Thus, it is likely that no Fe or Mg is exported out of the alteration zones. CaO and calcite content present no correlation with the LOI. Samples NH_19, NH_36 (this study), and NH_3 (in [19]) present a similar calcite content, respectively, of 6.3%, 6.0%, and 6.5%, whereas they present different LOI values (4.1%, 2.6%, and 2.8%, respectively). The case of a high calcite content associated to a low LOI can be explained by (1) physicochemical fluid composition bringing Ca, and not allowing a complete alteration of plagioclase and biotite into clay minerals [100]; (2) the residence time of the fluid not being sufficient [101]; or (3) a non-sufficient amount of fluid to allow the transformation of plagioclase and biotite into clay minerals. CaO losses are attributed to the alteration of plagioclase. However, the amount of Ca released by the alteration of plagioclase is certainly not sufficient to explain the crystallization of large amounts of carbonate into the granite veins. We infer that Ca is related to an external source as it is gained by the system (open system). As carbonate veins are related to the SDVFZ activity, we suggest that the source of the Ca is the Proterozoic series, which contain dolomite and carbonate sequences.
Fracture zones created porosity through microfractures and spaces between secondary minerals (Figure 6f) precipitated during primary mineral alteration. When fracturing increases, alteration increases too, as well as porosity [10]. However, the subsequent mineralization and chemical alteration can either decrease or increase the porosity of the rock [2]. For a similar LOI, porosity values vary significantly (e.g., NH_3 [19], NH_23, and NH_31_3). No correlation is visible between porosity and alteration or calcite content.

5.5. Relation among Fluid Circulation, Alteration, and Fracture Density

It is expected that areas along the rear southern limit of the CBS have recorded less transcurrent shear than areas situated along its northern front (Section 4.1). Recent work by Chabani et al. (2021) [42] has shown a structural compartmentalization occurring at the NH scale with a varying intensity that may influence fluid flow through the fracture network. Likewise, they identified a complex network of joints at outcrop scale, also encountered in this study at the sample and thin section scales, playing a key role in the fracture connectivity. The authors identified several fracture sets, among which, the NW/SE and the E/W oriented sets are predominant. The NW/SE trend, following the SDVFZ direction, controls the geometry in the whole range, whereas the E/W set, characterized by several short fractures, is mostly present in the central and southeastern part of the NH. The geometrical analysis of both fracture sets showed that the connectivity is ruled by fractures of different sizes. Regarding the fracture distribution, the highest fracture density is recorded within the rear southern part with values five times higher than in the northern part. This can be explained by the complex tectonic setting and the gradient of deformation observed in the entire NH range, with evidence of extreme shearing in the southern part as already presented. Moreover, through scanline analyses along drone photogrammetric outcrop profiles and ground outcrop profiles, Chabani et al. (this issue, under review) [44] show a clear correlation between fracture density and distance from a fault zone. The closer the fault zone, the greater the fracture density. There is no straightforward correlation between amounts of deformation and fracture density. Fracture density depends on a series of parameters notably rock competence, anisotropy of units and possible presence of detachment zones concentrating deformation in narrow areas.
This study, together with that of Klee et al. (2020) [19], confirm the increase of fracture density towards fault zones through several samples collected at different distances from the faults. Moreover, at the NH scale, the LOI increases as the fracture zones are approached (Section 5.4). The more intense the fracturing, the higher the alteration. Likewise, porosity values obtained for samples from Klee et al. (2021) [19] range from 2.2% to 5.2%, whereas, porosity values for this study samples range from 10.1% to 14.0%. Close to fracture zones, samples have more than twice the porosity than the samples away from them. Calcite content (Figure 16) also show higher values near to fracture zones, highlighting the importance of the presence of fractures allowing fluid circulations and thus carbonate precipitation, which mainly filled and sealed the fractures [71,102]. Carbonate veins are present in the whole range, preferentially orientated following the NH strike, probably related to the SDVFZ activity. However, calcite content is generally higher in the southeastern part of the range. This part is characterized by a high fracture density due to complex tectonic setting, related to the GFZ activity [42]. The connectivity within this part is ruled by the small and large fractures, and an additional complex joint network leading the fluid supply toward the fault zone.
The comparison of the data from Klee et al. (2021) [19] with those in this study at the NH scale shows that the increase in fracture density is correlated with the increases in alteration degree, porosity, and calcite content, respectively. However, no correlation is observed between alteration, porosity, and calcite content all together. The sample NH_36 (Figure 11) has shown that calcite content is not related to the intensity of alteration (Section 5.4). This highly fractured sample has been characterized by a specific fracture arrangement, composed mainly of fracture clusters, following the SDVFZ direction. It allows the fluid to circulate following these clusters, and then creating a flow anisotropy. However, only a low alteration degree is observed, which can either be due to (1) specific physicochemical fluid composition [100]; (2) an equilibrium between the fluid and the surrounding rock; (3) an insufficient residence time of the fluid [101]; or (4) a non-sufficient amount of fluid. Fracture density increase does not necessarily induce the increase of alteration (Figure 19a,b), whereas at the NH scale, a general correlation between fracture density and alteration was shown. Sample NH_36 shows that fluid can circulate through a highly fractured granite without necessarily producing alteration (Figure 19b).
Numerous fractures and veins, showing a high fluid–rock ratio, crosscut the granite altering it consequently (Figure 20a,b). Faulkner et al. (2010) [11] have shown that within crystalline rocks, the flow can be ruled by a small number of fractures within the rock surrounding a fracture zone. The fracture interconnections constitute the main parameter, which can enhance the fluid circulation. Samples NH_31 and NH_23 showed the relation between fracturing and alteration at local scale (Section 4.3.2). Thin section fracture analyses showed that the fracture density average is similar in both samples. NH_31 consists of a brecciated vein developing an alteration gradient but no fracturing gradient (Figure 20c), while NH_23, perpendicular to NH_31, consists of a mylonite developing an alteration and a fracturing gradient (Figure 20d). Regarding the stress axis orientation, it is suggested that the main stress axis σ3 is at a very high angle to the NH_31 initial quartz vein. The close to normal angle between the initial quartz vein and the stress axis σ3 was favorable to reactivation, inducing a brecciated vein without developing a significant additional fracture gradient in the surrounding rock (Figure 20c). It has been shown that remnants of a quartz vein composed the NH_31 brecciated vein. This quartz vein, developed during a past event of unknown age and origin, possibly magmatic (last crystallization fluids). It is suggested that this vein was reactivated, letting a new fluid rich in Ca circulates. Then carbonates crystallized giving a brecciated vein as a final product. The alteration gradient observed in the wall rock is especially pronounced at the borders of the brecciated vein. The proximity with the main fluid pathway induced an important leaching by the fluid. Within NH_23 (Figure 20d), it is supposed that the quartz-feldspathic unit was initially a dyke crosscutting the granitic pluton. Such dykes have been observed in the surroundings. During SDVFZ activity, reactivation of this zone of weakness permitted percolation of a Ca-rich fluid. An intensive shearing induced dynamic recrystallization developing a mylonite in the borders and its associated fracturing gradient in the wall rock. In that case, the main stress axis σ1 would be characterized by an intermediate angle to the shear plane. A fracturing gradient is observed in the surrounding rock. The fracture density induced in the surrounding rock does not further increase. Asymmetric clasts and shear bands are observed within this mylonitic layer.
Fluid circulation and induced fracturing have promoted fluid–rock interactions and the granite alteration, which is more pronounced in NH_23 than in NH_31 (Figure 9h–k and Figure 14e,f). Those two samples showed that at sample and outcrop scales, fracturing and alteration are heterogeneous, but also that the alteration degree is not always related to the fracture density (Figure 20c,d).
These sample analyses allowed us to study a fault zone development depending on strain, fluid–rock ratio, and material rheology. It is shown that at low to moderate regional strain, incipient local high strain concentration is present (Figure 20). It has been observed that:
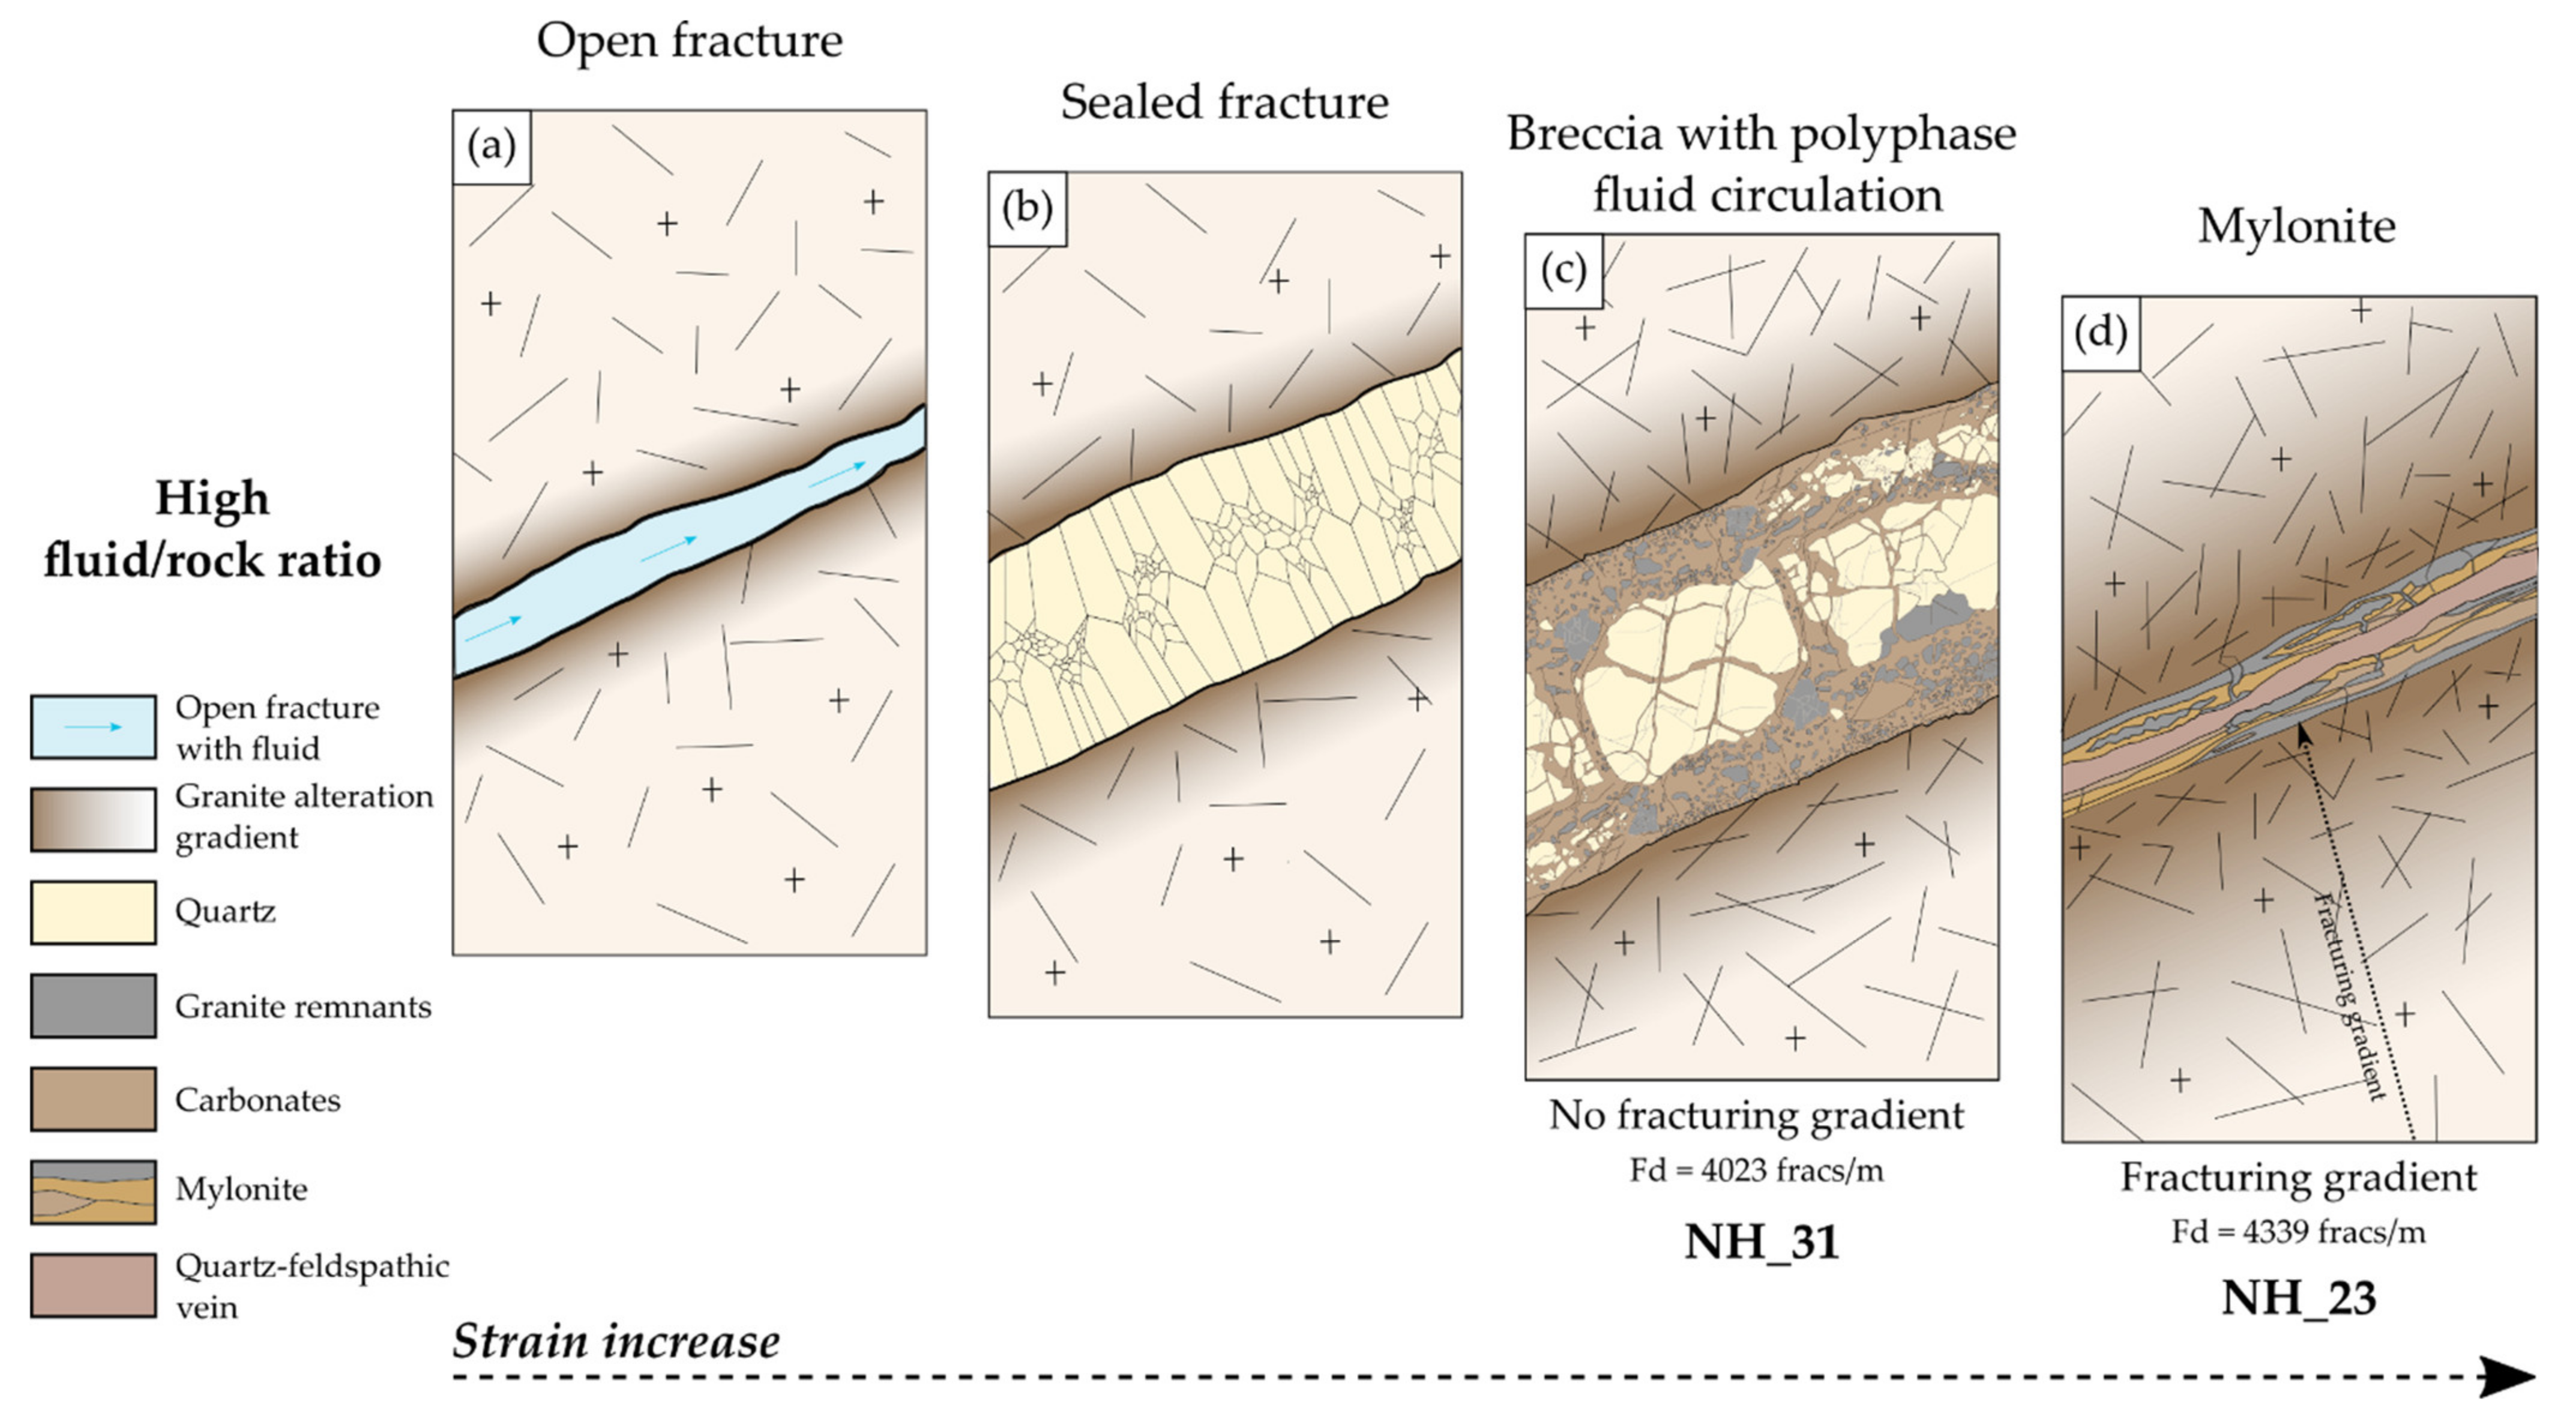
  • The fluid interacts with the surrounding rock, altering it pervasively, and fractures are sealed by secondary minerals (Figure 20a,b). Those veins can be reactivated by shearing [103]. Thus, it creates a brecciated vein (e.g., NH_31) or even a mylonite (e.g., NH_23), developing an alteration gradient. Sample NH_23 shows that mylonitic deformation appears at low to moderate regional strain when carbonates are involved. Fault reactivation tends to cause a mineral fill breakage and reopens the fracture [2,104].
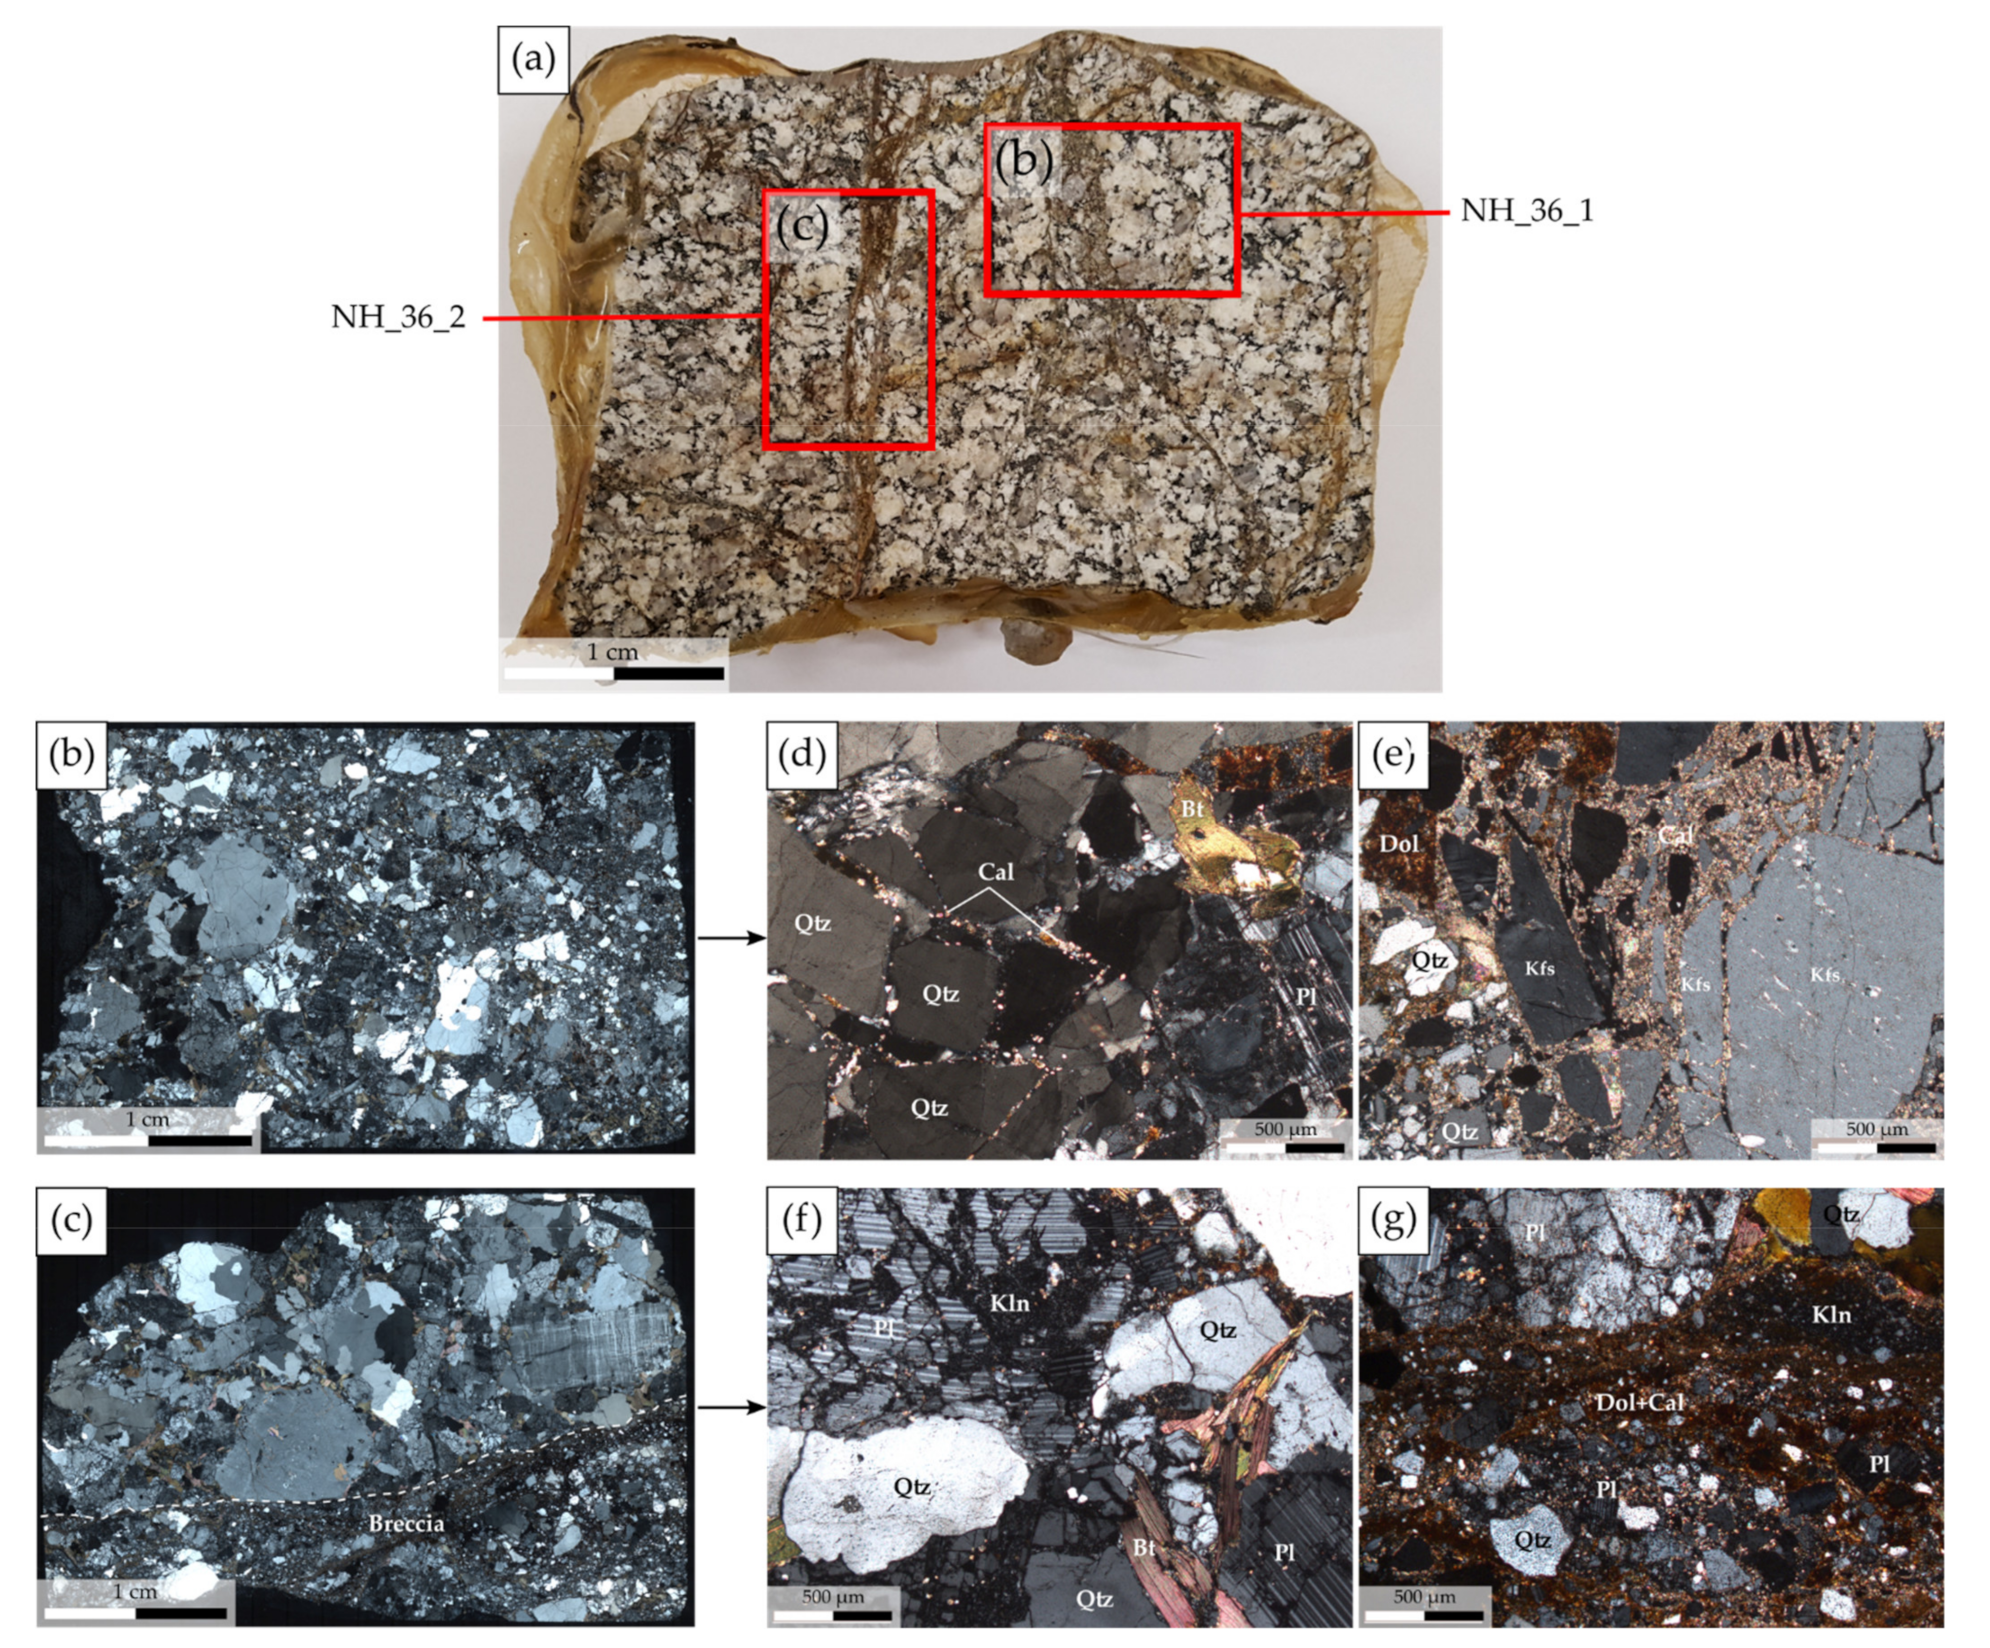
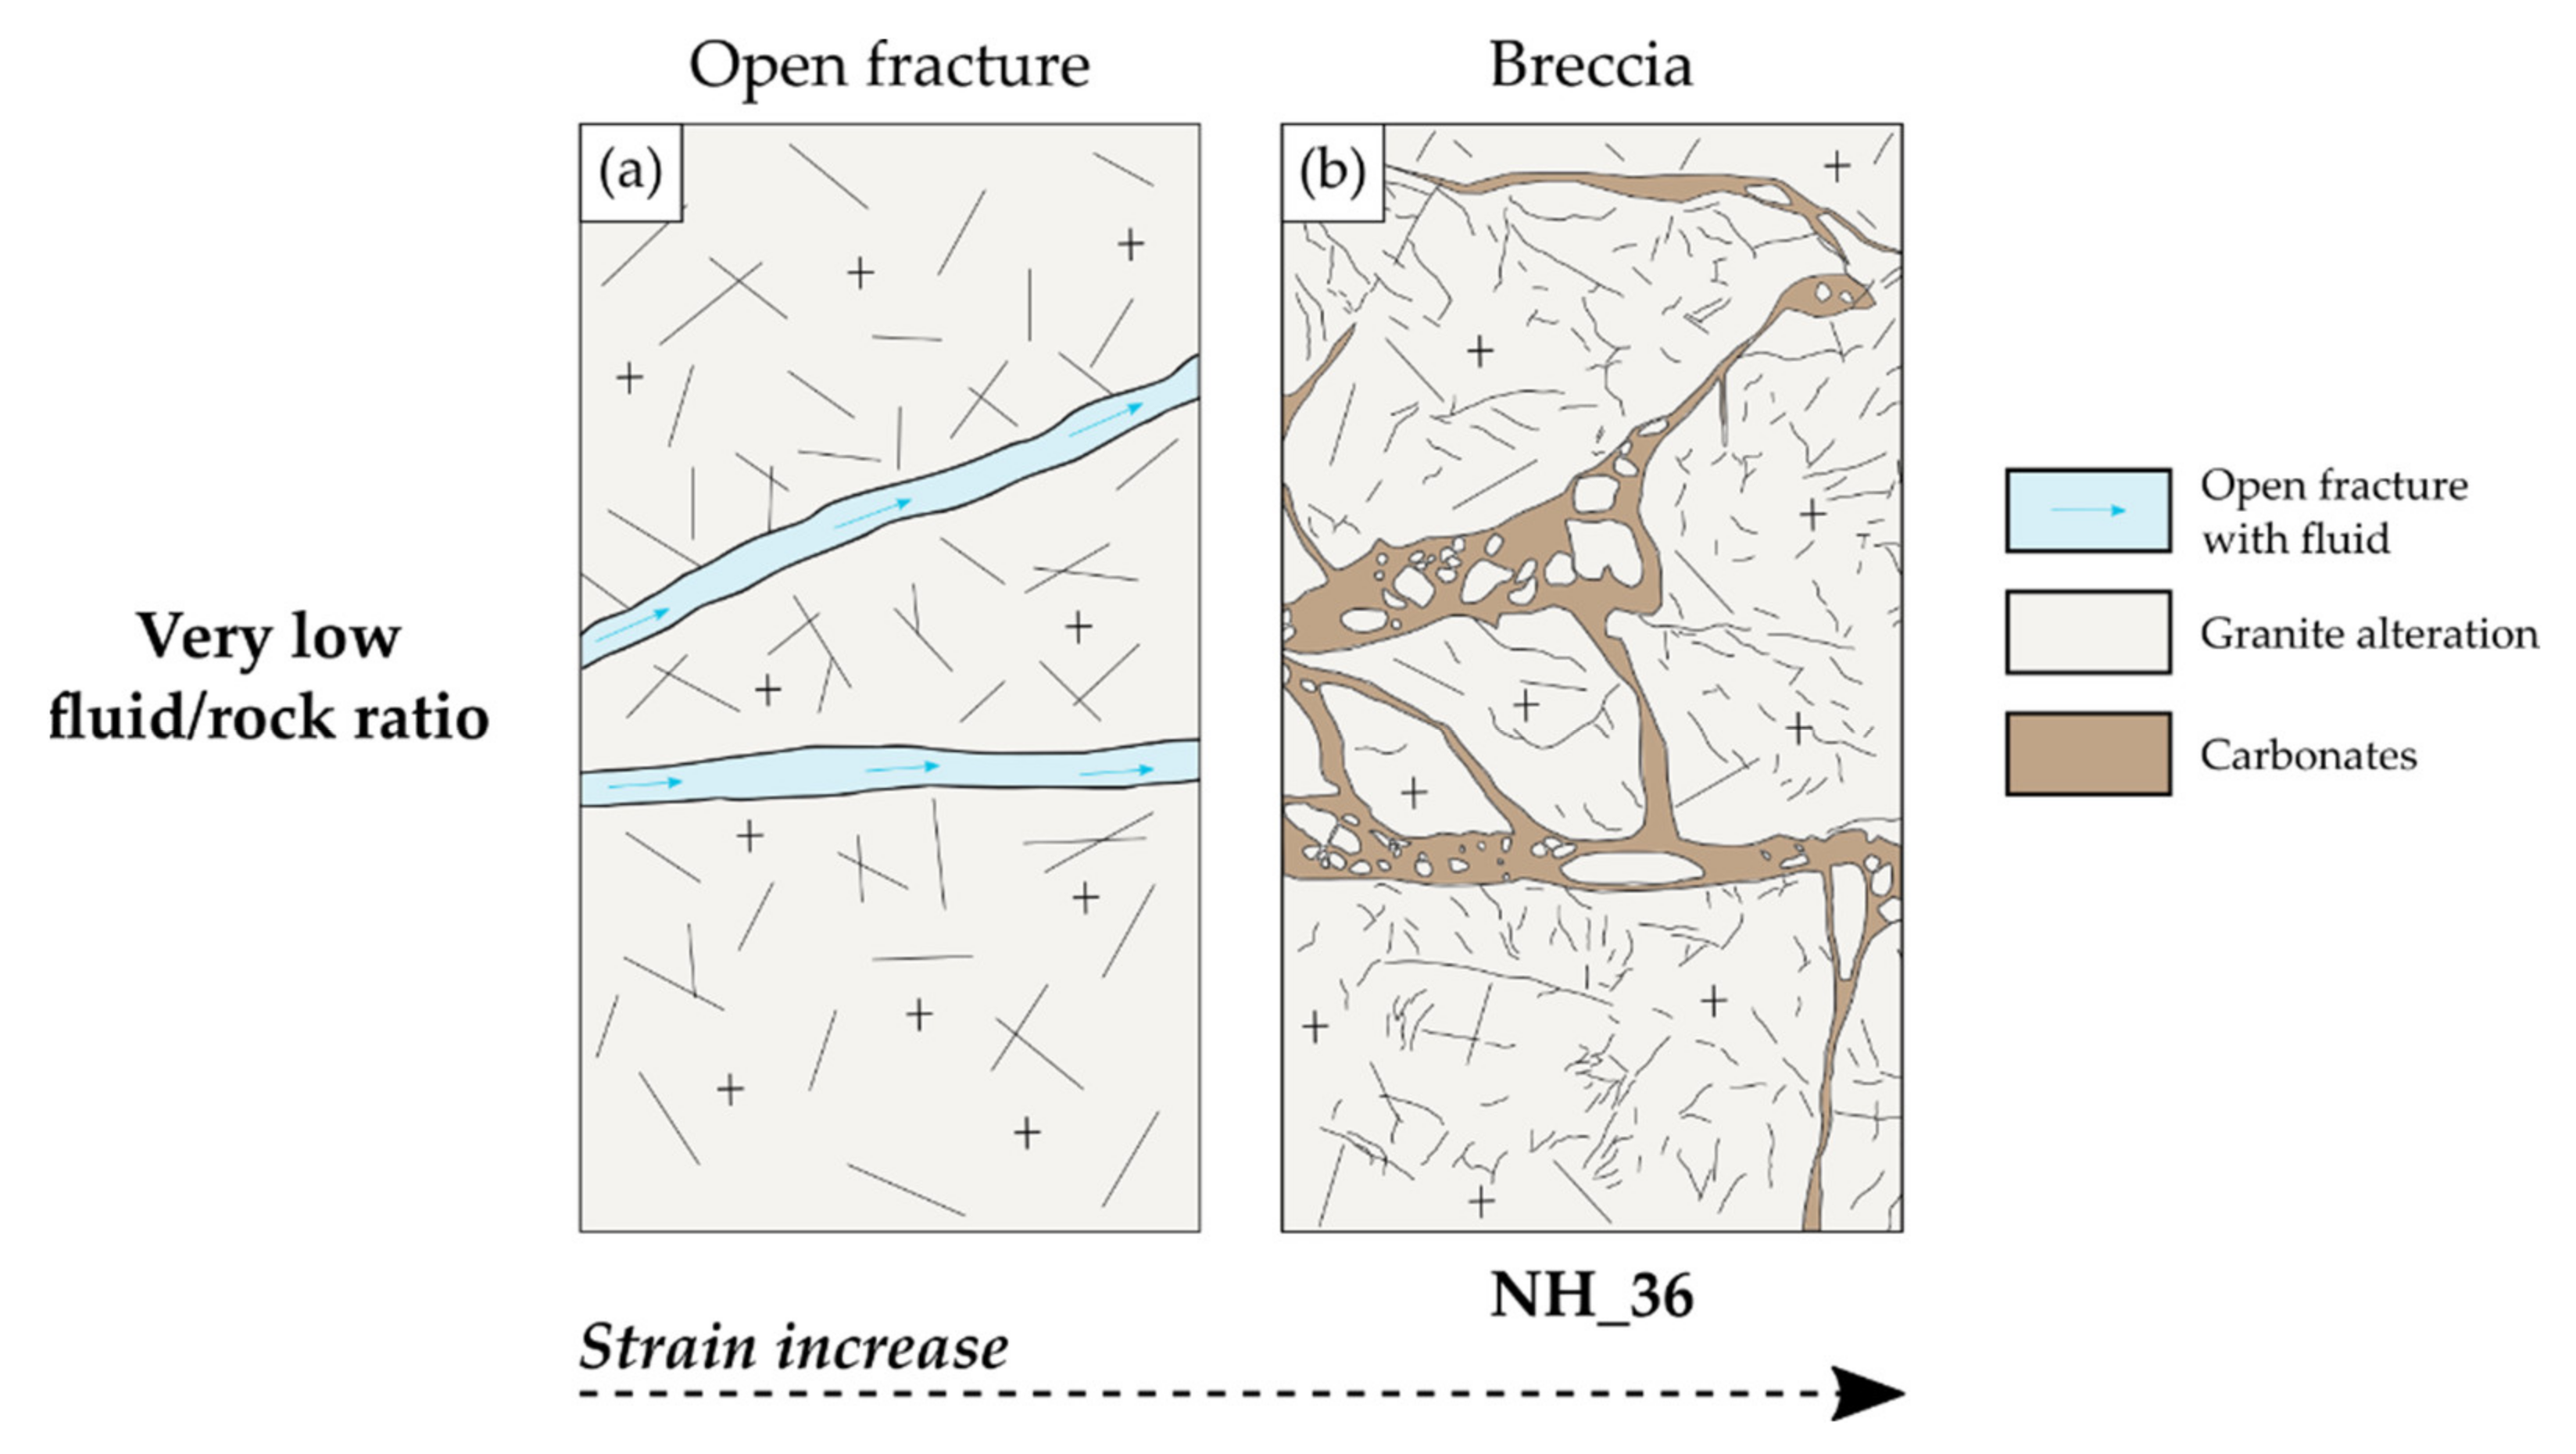
  • Open fractures let fluid circulate without interaction with the surrounding rock. Shearing creates a breccia without further alteration within the granite, such as in NH_36 (Figure 19).
At any scales, fracture density promotes fluid flow through the fracture network provided a fluid is present [5,11]. However, the alteration degree is not correlated to the fracture density.

5.6. Implication of Alteration in Terms of Geothermal Reservoir Properties

Fresh granite has a very low initial matrix porosity (<1%), which “does not allow” the fluid circulation, hence inducing a low permeability [9]. A granitic geothermal reservoir is considered as exploitable when it presents a connected fracture network increasing the permeability and in which a sufficient amount of hot fluid circulates [2,3,9,11]. By flowing through fractures, the fluid interacts with the rock, increasing the matrix porosity and permeability promoted by the dissolution of the primary minerals and crystallization of newly-formed phases [13]. However, newly-formed minerals can also crystallize in the fractures and seal them, reducing the porosity and the permeability [105,106]. Thus, sealed fractures are transformed from conduits into barriers to fluid flow [83,107,108] and impact the geothermal production by decreasing the connectivity between the fractures and hence the permeability [2,109].
The NH altered granite shows an important fracture network and a high matrix porosity, which allowed fluids to circulate and to interact with the surrounding rock. Indeed, numerous veins with various infills crosscut the granite indicating several successive fluid circulation events. Carbonates occupy a prominent part of the fracture system, which can be easily dissolved thanks to acid injections in order to connect the boreholes to major conductive fractures for geothermal exploitation. It is suggested that, when NH were an active reservoir at depth, fractures were only partially filled, and the fluid could flow through the fracture network. It has been seen that the stress field has a major impact on the fluid circulation. Indeed, drilling into fractures at a very high angle from the main stress axis σ1, such as exposed by sample NH_31, is favorable to allow fluid to circulate. In the event of geothermal exploitation, only minor chemical stimulation, if any, would have been necessary [13,71,110]. Moreover, the alteration amount is not necessarily related to the degree of fracturing and, therefore, the fracture network influence on fluid circulation is hardly predictable. Thus, due to the conduit-barrier role, the deformation gradient, the degree of fracturing, the alteration processes, and the relationship between them, have a large impact on geothermal production [109].

6. Conclusions

Noble Hills (NH) is a newly studied area, in terms of an exhumed granitic geothermal reservoir. It provides an excellent opportunity to give fundamental scientific input in 3D, allowing for better understanding of granitic reservoir behavior in a trans-tensional context. This analogue shows how complex a granitic reservoir can be, in terms of structures, fluid circulation, and fluid–rock interactions. This study proposes a geometric, petrographic, petrophysical, and geochemical description in order to characterize the influence of fracturing on fluid circulation and alteration processes.
Approaching fracture zones at large scale, the NH granite shows signs of several generations of fluid circulations resulting in successive veins of various mineralization. Fluid circulation being more important in the vicinity of fracture zones, a stronger fluid–rock interaction is observed. Thus, argillic alteration prevails compared to in the protolith. It is highlighted by the increase of the LOI correlated to a Na depletion due to plagioclase alteration and a K enrichment associated to illite precipitation. Likewise, the porosity, the calcite content, and the temperature increase nearer to fracture zones. However, no correlation exists among LOI, porosity, and calcite content altogether. Moreover, a high fracture density does not necessarily imply a strong alteration (e.g., sample NH_36).
This relation among fluid circulation, alteration, and fracturing is also visible at a sample scale. The higher the fracture density, the more pronounced the alteration. However, samples NH_31 and NH_23 showed how complex this relation could be:
  • NH_31 shows a reactivated vein giving a brecciated vein (quartz and granitic clasts in a carbonate matrix), which induced no fracture gradient in the surrounding porphyritic granite, but developed an alteration gradient.
  • NH_23 shows a carbonate mylonite creeping around deformed granite lenses, which induced a fracture gradient, as well as an alteration gradient in the surrounding porphyritic granite.
These two samples, showing different deformation features as a result of a different orientation within the stress field, present a similar fracture density. Strain was accumulated within a carbonate mylonite within sample NH_23. The alteration gradient is more pronounced in this sample, but the fracture density does not change. Sample NH_36, consisting of a granite composed of a cohesive breccia, whose matrix is made of dolomite, shows a low alteration. Even locally, alteration does not always depend on the deformation gradient or on the fracture density.
This study shows that the deformation gradient observed at a large scale is also visible locally in the context of a low to moderate strain. It also highlights the importance of mineral crystallization in a geothermal reservoir. Fluid flow depends on a connected network of open and permeable fractures. In reservoirs at depth, fractures can be sealed and act as a barrier. Stimulation techniques are needed in order to reopen them so that a drain allowing a new fluid circulation is created. The influence of fracture zones on fluid flow and alteration is difficult to predict and yet impacts the production from the reservoir.
In order to complete this work, a future study will focus on the influence of a fault zone on fluid circulation and alteration processes, in the NH, at high strain conditions. Moreover, laboratory investigations could be performed to better understand the controlling parameters of the ongoing processes and fracturing of rocks.

Author Contributions

Conceptualization, J.K., A.C., B.A.L., S.P., R.L.H., and G.T.; methodology, J.K., A.C., B.A.L., S.P., R.L.H., and G.T.; software, J.K.; validation, A.C., B.A.L., S.P., R.L.H., and G.T.; formal analysis, J.K.; investigation, J.K., A.C., B.A.L., S.P., R.L.H., and G.T.; resources, J.K.; data curation, J.K., A.C., B.A.L., S.P., R.L.H., and G.T.; writing—original draft preparation, J.K.; writing—review and editing, A.C., B.A.L., S.P., R.L.H., and G.T.; and H2020 MEET consortium; visualization, A.C., B.A.L., S.P., R.L.H., and G.T.; supervision, J.K.; project administration, G.T.; funding acquisition, G.T. and H2020 MEET consortium. All authors have read and agreed to the published version of the manuscript.

Funding

This project has received funding from the European Union’s Horizon 2020 research and innovation program under grant agreement no. 792037 (H2020 MEET project).

Data Availability Statement

Not applicable.

Acknowledgments

This manuscript was prepared as a contribution to the PhD thesis (Institut Polytechnique UniLaSalle Beauvais) of Johanne Klee, which was funded by the European Union’s Horizon 2020 research and innovation program under grant agreement no. 792037 (H2020 MEET project). The authors greatly thank Terry Pavlis for his support and helpful exchanges about the regional geology of Death Valley and the Noble Hills. Albert Genter is thanked for the helpful discussions and knowledge about fractured granitic reservoirs. We are grateful to Klaus Wemmer for his help on XRD analyses and the fruitful discussions. We also thank Graciela Sosa and Alphonse M. Van den Kerkhof for their help on cathodoluminescence observations and acquisitions. We thank Mahdi Chettabi, Thi Tuyen Nguyen, Elena Pavlovskaia, Carl Tixier, and Chloé Gindrat for their help with the analyses. We acknowledge the H2020 MEET consortium for their helpful comments and the validation of the manuscript. We would like also to thank the Hauts-de-France region for its help in setting up the MEET project, in particular the FRAPPE (Fonds Regional d’Aide aux Porteurs de Projets Euopéens). We finally would like to thank the two anonymous reviewers and the editors for their help and remarks in improving this manuscript.

Conflicts of Interest

The authors declare no conflict of interest.

References

  1. Williams, C.F.; Reed, M.J.; Anderson, A.F. Updating the Classification of Geothermal Resources. In Proceedings of the Thirty Sixth Workshop on Geothermal Reservoir Engineering Stanford University, Stanford, CA, USA, 31 January–2 February 2011. [Google Scholar]
  2. Gillespie, P.A.; Holdsworth, R.; Long, D.; Williams, A.; Gutmanis, J. Introduction: Geology of fractured reservoirs. J. Geol. Soc. 2021, 178, 2020–2197. [Google Scholar] [CrossRef]
  3. Gentier, S.; Hopkins, D.; Riss, J. Role of fracture geometry in the evolution of flow paths under stress. In Geophysical Monograph Series; Faybishenko, B., Witherspoon, P.A., Benson, S.M., Eds.; American Geophysical Union: Washington, DC, USA, 2000; Volume 122, pp. 169–184. ISBN 978-0-87590-980-6. [Google Scholar]
  4. Curewitz, D.; Karson, J.A. Structural settings of hydrothermal outflow: Fracture permeability maintained by fault propagation and interaction. J. Volcanol. Geotherm. Res. 1997, 79, 149–168. [Google Scholar] [CrossRef]
  5. Dezayes, C.; Lerouge, C. Reconstructing Paleofluid Circulation at the Hercynian Basement/Mesozoic Sedimentary Cover Interface in the Upper Rhine Graben. Available online: https://www.hindawi.com/journals/geofluids/2019/4849860/abs/ (accessed on 21 June 2019).
  6. Vidal, J.; Genter, A. Overview of naturally permeable fractured reservoirs in the central and southern Upper Rhine Graben: Insights from geothermal wells. Geothermics 2018, 74, 57–73. [Google Scholar] [CrossRef]
  7. Callahan, O.A.; Eichhubl, P.; Olson, J.E.; Davatzes, N.C. Fracture Mechanical Properties of Damaged and Hydrothermally Altered Rocks, Dixie Valley-Stillwater Fault Zone, Nevada, USA. J. Geophys. Res. Solid Earth 2019, 124, 4069–4090. [Google Scholar] [CrossRef] [Green Version]
  8. Bauer, J.F.; Meier, S.; Philipp, S. Architecture, fracture system, mechanical properties and permeability structure of a fault zone in Lower Triassic sandstone, Upper Rhine Graben. Tectonophysics 2015, 647–648, 132–145. [Google Scholar] [CrossRef]
  9. Géraud, Y.; Rosener, M.; Surma, F.; Place, J.; Le Garzic, É.; Diraison, M. Physical properties of fault zones within a granite body: Example of the Soultz-sous-Forêts geothermal site. Comptes Rendus Geosci. 2010, 342, 566–574. [Google Scholar] [CrossRef]
  10. Géraud, Y.; Surma, F.; Rosener, M. Porosity Network of Soultz-Sous-Forets Granite: The Importance of the Damaged Zone around Faults and Fractures; Ecole et Observatoire des Sciences de la Terre: Strasbourg, France, 2005. [Google Scholar]
  11. Faulkner, D.; Jackson, C.; Lunn, R.; Schlische, R.; Shipton, Z.; Wibberley, C.; Withjack, M. A review of recent developments concerning the structure, mechanics and fluid flow properties of fault zones. J. Struct. Geol. 2010, 32, 1557–1575. [Google Scholar] [CrossRef]
  12. Long, J.C.S.; Witherspoon, P.A. The relationship of the degree of interconnection to permeability in fracture networks. J. Geophys. Res. Space Phys. 1985, 90, 3087–3098. [Google Scholar] [CrossRef]
  13. Ledésert, B.; Hebert, R.; Genter, A.; Bartier, D.; Clauer, N.; Grall, C. Fractures, hydrothermal alterations and permeability in the Soultz Enhanced Geothermal System. Comptes Rendus Geosci. 2010, 342, 607–615. [Google Scholar] [CrossRef]
  14. Kuncoro, G.B. Fluid-Rock Interaction Studies on an Enhanced Geothermal System in the Cooper Basin, South Australia. Ph.D. Thesis, University of Adelaide, Adelaide, SA, Australia, 2015. [Google Scholar]
  15. Turpault, M.-P.; Berger, G.; Meunier, A. Dissolution-precipitation processes induced by hot water in a fractured granite Part 1: Wall-rock alteration and vein deposition processes. Eur. J. Miner. 1992, 4, 1457–1476. [Google Scholar] [CrossRef]
  16. Dezayes, C.; Lerouge, C.; Innocent, C.; Lach, P. Structural control on fluid circulation in a graben system: Constraints from the Saint Pierre Bois quarry (Vosges, France). J. Struct. Geol. 2021, 146, 104323. [Google Scholar] [CrossRef]
  17. Dalmais, E.; Genter, A.; Trullenque, G.; Leoutre, E.; Leiss, B.; Wagner, B.; Mintsa, A.C.; Bär, K.; Rajsl, I. MEET Project: Toward the Spreading of EGS across Europe. In Proceedings of the European Geothermal Congress, Den Haag, The Netherlands, 11–14 June 2019. [Google Scholar]
  18. Trullenque, G.; Genter, A.; Leiss, B.; Wagner, B.; Bouchet, R.; Leoutre, E.; Malnar, B.; Bär, K.; Rajšl, I. Upscaling of EGS in Different Geological Conditions: A European Perspective. In Proceedings of the 43rd Workshop on Geothermal Reservoir Engineering Stanford University, Stanford, CA, USA, 12–14 February 2018. [Google Scholar]
  19. Klee, J.; Potel, S.; Ledésert, B.; Hébert, R.; Chabani, A.; Barrier, P.; Trullenque, G. Fluid-Rock Interactions in a Paleo-Geothermal Reservoir (Noble Hills Granite, California, USA). Part 1: Granite Pervasive Alteration Processes away from Fracture Zones. Geosciences 2021, 11, 325. [Google Scholar] [CrossRef]
  20. Ledésert, B.; Berger, G.; Meunier, A.; Genter, A.; Bouchet, A. Diagenetic-type reactions related to hydrothermal alteration in the Soultz-sous-Forêts granite, France. Eur. J. Miner. 1999, 11, 731–742. [Google Scholar] [CrossRef]
  21. Genter, A. Géothermie Roches Chaudes Sèches: Le Granite de Soultz-Sous-Forêts (Bas-Rhin, France): Fracturation Naturelle, Altérations Hydrothermales et Interaction Eau-Roche. Ph.D. Thesis, Université d’Orléans, Orléans, France, 1989. [Google Scholar]
  22. Traineau, H.; Genter, A.; Cautru, J.P.; Fabriol, H.; Chevremont, P. Petrography of the Granite Massif from Drill Cutting Analysis and Well Log Interpretation in the Geothermal HDR Borehole GPK1 (Soultz, Alsace, France). Geotherm. Sci. Technol. 1991, 3, 1–29. [Google Scholar]
  23. Meunier, A. Hydrothermal Alteration by Veins. In Origin and Mineralogy of Clays: Clays and the Environment; Velde, B., Ed.; Springer: Berlin/Heidelberg, Germany, 1995; pp. 247–267. ISBN 978-3-662-12648-6. [Google Scholar]
  24. Bonorino, F.G. Hydrothermal alteration in the front range mineral belt, colorado. GSA Bull. 1959, 70, 53–90. [Google Scholar] [CrossRef]
  25. Caine, J.S.; Bruhn, R.L.; Forster, C.B. Internal structure, fault rocks, and inferences regarding deformation, fluid flow, and mineralization in the seismogenic Stillwater normal fault, Dixie Valley, Nevada. J. Struct. Geol. 2010, 32, 1576–1589. [Google Scholar] [CrossRef]
  26. Norton, I. Two-stage formation of Death Valley. Geosphere 2011, 7, 171–182. [Google Scholar] [CrossRef]
  27. Dokka, R.K.; Travis, C.J. Role of the Eastern California Shear Zone in accommodating Pacific-North American Plate motion. Geophys. Res. Lett. 1990, 17, 1323–1326. [Google Scholar] [CrossRef]
  28. Stewart, J.H.; Ernst, W.G. Tectonics of the Walker Lane Belt, Western Great Basin: Mesozoic and Cenozoic Deformation in a Zone of Shear. Metamorph. Crustal Evol. West. United States 1988, 7, 683–713. [Google Scholar]
  29. Lifton, Z.M.; Newman, A.V.; Frankel, K.L.; Johnson, C.W.; Dixon, T.H. Insights into distributed plate rates across the Walker Lane from GPS geodesy. Geophys. Res. Lett. 2013, 40, 4620–4624. [Google Scholar] [CrossRef] [Green Version]
  30. Miller, M.M.; Johnson, D.J.; Dixon, T.H.; Dokka, R.K. Refined kinematics of the eastern California shear zone from GPS observations, 1993–1998. J. Geophys. Res. Space Phys. 2001, 106, 2245–2263. [Google Scholar] [CrossRef]
  31. Hill, M.L.; Troxel, B.W. Tectonics of Death Valley region, California. GSA Bull. 1966, 77, 435–438. [Google Scholar] [CrossRef]
  32. Burchfiel, B.C.; Stewart, J.H. “Pull-Apart” Origin of the Central Segment of Death Valley, California. GSA Bull. 1966, 77, 439–442. [Google Scholar] [CrossRef]
  33. Pavlis, T.L.; Trullenque, G. Evidence for 40–41 km of dextral slip on the southern Death Valley fault: Implications for the Eastern California shear zone and extensional tectonics. Geology 2021, 49, 767–772. [Google Scholar] [CrossRef]
  34. Rämö, T.O.; Calzia, J.P.; Kosunen, P.J. Geochemistry of Mesozoic plutons, southern Death Valley region, California: Insights into the origin of Cordilleran interior magmatism. Contrib. Miner. Pet. 2002, 143, 416–437. [Google Scholar] [CrossRef]
  35. Reinert, E. Low-Temperature Thermochronometry of the Avawatz Mountains, California: Implications for the Inception of the Eastern California Shear Zone. Ph.D. Thesis, University of Washington, Seattle, WA, USA, 2004. [Google Scholar]
  36. Chinn, L.D. Low-Temperature Thermochronometry of the Avawatz Mountains; Implications for the Eastern Terminus and Inception of the Garlock Fault Zone; University of Washington: Seattle, WA, USA, 2013; 48p. [Google Scholar]
  37. Spencer, J.E. Chapter 15: Late Cenozoic extensional and compressional tectonism in the southern and western Avawatz Mountains, southeastern California. In Geological Society of America Memoirs; Geological Society of America: Boulder, CO, USA, 1990; Volume 176, pp. 317–334. [Google Scholar]
  38. Niles, J.H. Post-Middle Pliocene Tectonic Development of the Noble Hills, Southern Death Valley, California. Ph.D. Thesis, San Francisco State University, San Francisco, CA, USA, 2016. [Google Scholar]
  39. Brady, R.H. Neogene stratigraphy of the Avawatz Mountains between the Garlock and Death Valley fault zones, southern Death Valley, California: Implications as to late Cenozoic tectonism. Sediment. Geol. 1984, 38, 127–157. [Google Scholar] [CrossRef]
  40. Troxel, B.W.; Butler, P.R. Rate of Cenozoic Slip on Normal Faults, South-Central Death Valley, California; Department of Geology, University of California: Berkeley, CA, USA, 1979. [Google Scholar]
  41. Klee, J.; Trullenque, G.; Ledésert, B.; Potel, S.; Hébert, R.; Chabani, A.; Genter, A. Petrographic Analyzes of Fractured Granites Used as An Analogue of the Soultz-Sous-Forêts Geothermal Reservoir: Noble Hills, CA, USA. In Proceedings of the World Geothermal Congress 2020+1, Reykjavik, Iceland, 24–27 October 2020. [Google Scholar]
  42. Chabani, A.; Trullenque, G.; Ledésert, B.; Klee, J. Multiscale Characterization of Fracture Patterns: A Case Study of the Noble Hills Range (Death Valley, CA, USA), Application to Geothermal Reservoirs. Geoscience 2021, 11, 280. [Google Scholar] [CrossRef]
  43. Castaing, C.; Rabu, D. Apports de La Géologie à La Recherche et à l’exploitation de Pierres de Taille (Roches Ornementales et de Construction). BULL BRGM 1981, 3, 1. [Google Scholar]
  44. Chabani, A.; Trullenque, G.; Klee, J.; Ledésert, B.A. Fracture Spacing Variability and the Distribution of Fracture Patterns in Granitic Geothermal Reservoir: A Case Study in the Noble Hills Range (Death Valley, CA, USA). Geosciences 2021, 11, 280. [Google Scholar] [CrossRef]
  45. Laubach, S.; Lamarche, J.; Gauthier, B.; Dunne, W.; Sanderson, D. Spatial arrangement of faults and opening-mode fractures. J. Struct. Geol. 2018, 108, 2–15. [Google Scholar] [CrossRef]
  46. Olson, J.E. Joint pattern development: Effects of subcritical crack growth and mechanical crack interaction. J. Geophys. Res. Space Phys. 1993, 98, 12251–12265. [Google Scholar] [CrossRef]
  47. Bisdom, K.; Gauthier, B.; Bertotti, G.; Hardebol, N. Calibrating discrete fracture-network models with a carbonate three-dimensional outcrop fracture network: Implications for naturally fractured reservoir modeling. AAPG Bull. 2014, 98, 1351–1376. [Google Scholar] [CrossRef]
  48. Gillespie, P.; Howard, C.; Walsh, J.; Watterson, J. Measurement and characterisation of spatial distributions of fractures. Tectonophysics 1993, 226, 113–141. [Google Scholar] [CrossRef]
  49. Priest, S.; Hudson, J. Discontinuity spacings in rock. Int. J. Rock Mech. Min. Sci. Géoméch. Abstr. 1976, 13, 135–148. [Google Scholar] [CrossRef]
  50. Sanderson, D.J.; Peacock, D.C. Line sampling of fracture swarms and corridors. J. Struct. Geol. 2019, 122, 27–37. [Google Scholar] [CrossRef]
  51. Terzaghi, R.D. Sources of Error in Joint Surveys. Géotechnique 1965, 15, 287–304. [Google Scholar] [CrossRef]
  52. Zhou, W.; Wang, Z.L. Scanning Microscopy for Nanotechnology: Techniques and Applications; Springer Science & Business Media: Berlin/Heidelberg, Germany, 2007; ISBN 978-0-387-39620-0. [Google Scholar]
  53. Kanda, K. Energy Dispersive X-Ray Spectrometer. U.S. Patent 5,065,020, 1991. [Google Scholar]
  54. Götze, J. Cathodoluminescence in Applied Geosciences. In Cathodoluminescence in Geosciences; Pagel, M., Barbin, V., Blanc, P., Ohnenstetter, D., Eds.; Springer: Berlin/Heidelberg, Germany, 2000; ISBN 978-3-662-04086-7. [Google Scholar]
  55. Götze, J. Application of Cathodoluminescence Microscopy and Spectroscopy in Geosciences. Microsc. Microanal. 2012, 18, 1270–1284. [Google Scholar] [CrossRef] [PubMed] [Green Version]
  56. Kretz, R. Symbols for Rock-Forming Minerals. Am. Mineral. 1983, 68, 277–279. [Google Scholar]
  57. Schmidt, D.; Schmidt, S.T.; Mullis, J.; Mählmann, R.F.; Frey, M. Very low grade metamorphism of the Taveyanne formation of western Switzerland. Contrib. Miner. Pet. 1997, 129, 385–403. [Google Scholar] [CrossRef]
  58. Kisch, H.J. Illite crystallinity: Recommendations on sample preparation, X-ray diffraction settings, and interlaboratory samples. J. Metamorph. Geol. 1991, 9, 665–670. [Google Scholar] [CrossRef]
  59. Mählmann, R.F.; Frey, M. Standardisation, calibration and correlation of the Kübler-index and the vitrinite/bituminite reflectance: An inter-laboratory and field related study. Swiss J. Geosci. 2012, 105, 153–170. [Google Scholar] [CrossRef]
  60. Moore, D.M.; Reynolds, R.C. X-ray Diffraction and the Identification and Analysis of Clay Minerals; Oxford University Press: New York, NY, USA, 1989. [Google Scholar]
  61. Starkey, H.C.; Blackmon, P.D.; Hauff, P.L. The Routine Mineralogical Analysis of Clay-Bearing Samples; U.S. G.P.O.: Washington, DC, USA, 1984. [Google Scholar]
  62. Kübler, B. La Cristallinite de l’illite et Les Zones Tout a Fait Superieures Du Metamorphisme. In Etages Tectoniques; La Baconniere: Boudry, Switzerland, 1967; pp. 105–121. [Google Scholar]
  63. Warr, L.; Mählmann, R.F. Recommendations for Kübler Index standardization. Clay Miner. 2015, 50, 283–286. [Google Scholar] [CrossRef]
  64. Kisch, H.J. Correlation between indicators of very low-grade metamorphism. In Low-Temperature Metamorphism; Frey, M., Ed.; Blackie and Son Ltd.: Glasgow, UK, 1987; pp. 227–300. [Google Scholar]
  65. Árkai, P.; Sassi, F.; Desmons, J. Very Low- to Low-Grade Metamorphic Rocks. In Metamorphic Rocks A Classification and Glossary Terms; Cambridge University Press: Cambridge, UK, 2003. [Google Scholar]
  66. Warr, L.N.; Cox, S.C. Correlating illite (Kübler) and chlorite (Árkai) “crystallinity” indices with metamorphic mineral zones of the South Island, New Zealand. Appl. Clay Sci. 2016, 134, 164–174. [Google Scholar] [CrossRef]
  67. Frey, M. Very low-grade metamorphism of clastic sedimentary rocks. In Low-Temperature Metamorphism; Frey, M., Ed.; Blackie: Glasgow, UK, 1987; pp. 9–58. [Google Scholar]
  68. Árkai, P.; Maehlmann, R.; Suchy, V.; Balogh, K.; Sykorová, I.; Frey, M. Possible Effects of Tectonic Shear Strain on Phyllosilicates: A Case Study from the Kandersteg Area, Helvetic Domain, Central Alps, Switzerland. TMPM Tschermaks Mineral. Petrogr. Mitt. 2002, 82, 273–290. [Google Scholar]
  69. Mullis, J.; Mählmann, R.F.; Wolf, M. Fluid inclusion microthermometry to calibrate vitrinite reflectance (between 50 and 270 °C), illite Kübler-Index data and the diagenesis/anchizone boundary in the external part of the Central Alps. Appl. Clay Sci. 2017, 143, 307–319. [Google Scholar] [CrossRef]
  70. Warr, L.N.; Rice, A.H.N. Interlaboratory standardization and calibration of day mineral crystallinity and crystallite size data. J. Metamorph. Geol. 1994, 12, 141–152. [Google Scholar] [CrossRef]
  71. Ledésert, B.; Hébert, R.L.; Grall, C.; Genter, A.; Dezayes, C.; Bartier, D.; Gérard, A. Calcimetry as a useful tool for a better knowledge of flow pathways in the Soultz-sous-Forêts Enhanced Geothermal System. J. Volcanol. Geotherm. Res. 2009, 181, 106–114. [Google Scholar] [CrossRef]
  72. White, A.F.; Schulz, M.S.; Lowenstern, J.B.; Vivit, D.V.; Bullen, T.D. The ubiquitous nature of accessory calcite in granitoid rocks: Implications for weathering, solute evolution, and petrogenesis. Geochim. Cosmochim. Acta 2005, 69, 1455–1471. [Google Scholar] [CrossRef]
  73. Dullien, F.A.L. Porous Media: Fluid Transport and Pore Structure; Academic Press: San Diego, CA, USA, 1979; ISBN 978-0-323-13933-5. [Google Scholar]
  74. Navelot, V.; Géraud, Y.; Favier, A.; Diraison, M.; Corsini, M.; Lardeaux, J.-M.; Verati, C.; de Lépinay, J.M.; Legendre, L.; Beauchamps, G. Petrophysical properties of volcanic rocks and impacts of hydrothermal alteration in the Guadeloupe Archipelago (West Indies). J. Volcanol. Geotherm. Res. 2018, 360, 1–21. [Google Scholar] [CrossRef]
  75. Gates, W.P.; Nefiodovas, A.; Peter, P. Permeability of an Organo-Modified Bentonite to Ethanol-Water Solutions. Clays Clay Miner. 2004, 52, 192–203. [Google Scholar] [CrossRef]
  76. Gresens, R.L. Composition-volume relationships of metasomatism. Chem. Geol. 1967, 2, 47–65. [Google Scholar] [CrossRef]
  77. Beaufort, D.; Baronnet, A.; Lanson, B.; Meunier, A. Corrensite; a single phase or a mixed-layer phyllosilicate in saponite-to-chlorite conversion series? A case study of Sancerre-Couy deep drill hole (France). Am. Miner. 1997, 82, 109–124. [Google Scholar] [CrossRef]
  78. Andrews, B.J.; Roberts, J.J.; Shipton, Z.K.; Bigi, S.; Tartarello, M.C.; Johnson, G. How do we see fractures? Quantifying subjective bias in fracture data collection. Solid Earth 2019, 10, 487–516. [Google Scholar] [CrossRef] [Green Version]
  79. Bestmann, M.; Kunze, K.; Matthews, A. Evolution of a calcite marble shear zone complex on Thassos Island, Greece: Microstructural and textural fabrics and their kinematic significance. J. Struct. Geol. 2000, 22, 1789–1807. [Google Scholar] [CrossRef]
  80. Burkhard, M. Ductile deformation mechanisms in micritic limestones naturally deformed at low temperatures (150–350 °C.). Geol. Soc. London Spéc. Publ. 1990, 54, 241–257. [Google Scholar] [CrossRef]
  81. Schmid, S.; Panozzo, R.; Bauer, S. Simple shear experiments on calcite rocks: Rheology and microfabric. J. Struct. Geol. 1987, 9, 747–778. [Google Scholar] [CrossRef]
  82. Stipp, M.; Kunze, K. Dynamic recrystallization near the brittle-plastic transition in naturally and experimentally deformed quartz aggregates. Tectonophysics 2008, 448, 77–97. [Google Scholar] [CrossRef]
  83. Glaas, C.; Patrier, P.; Vidal, J.; Beaufort, D.; Genter, A. Clay Mineralogy: A Signature of Granitic Geothermal Reservoirs of the Central Upper Rhine Graben. Minerals 2021, 11, 479. [Google Scholar] [CrossRef]
  84. Burnham, C.W. Facies and types of hydrothermal alteration. Econ. Geol. 1962, 57, 768–784. [Google Scholar] [CrossRef]
  85. Dubois, M.; Ledesert, B.; Potdevin, J.-L.; Vançon, S. Détermination des conditions de précipitation des carbonates dans une zone d’altération du granite de Soultz (soubassement du fossé Rhénan, France): L’enregistrement des inclusions fluides. Comptes Rendus l’Académie Sci. Ser. II A Earth Planet. Sci. 2000, 331, 303–309. [Google Scholar] [CrossRef]
  86. Marqués, J.M.; Matias, M.J.; Basto, M.J.; Carreira, P.M.; Aires-Barros, L.A.; Goff, F.E. Hydrothermal alteration of Hercynian granites, its significance to the evolution of geothermal systems in granitic rocks. Geothermics 2010, 39, 152–160. [Google Scholar] [CrossRef]
  87. Pauwels, H.; Fouillac, C.; Fouillac, A.-M. Chemistry and isotopes of deep geothermal saline fluids in the Upper Rhine Graben: Origin of compounds and water-rock interactions. Geochim. Cosmochim. Acta 1993, 57, 2737–2749. [Google Scholar] [CrossRef]
  88. Parneix, J.; Petit, J. Hydrothermal alteration of an old geothermal system in the Auriat granite (Massif Central, France): Petrological study and modelling. Chem. Geol. 1991, 89, 329–351. [Google Scholar] [CrossRef]
  89. Berger, G.; Velde, B. Chemical parameters controlling the propylitic and argillic alteration process. Eur. J. Miner. 1992, 4, 1439–1456. [Google Scholar] [CrossRef]
  90. Fulignati, P. Clay Minerals in Hydrothermal Systems. Minerals 2020, 10, 919. [Google Scholar] [CrossRef]
  91. Fordham, A.W. Weathering of Biotite into dioctahedral Clay Minerals. Clay Miner. 1989, 25, 51–63. [Google Scholar] [CrossRef]
  92. Kajdas, B.; Michalik, M.; Migoń, P. Mechanisms of granite alteration into grus, Karkonosze granite, SW Poland. Catena 2017, 150, 230–245. [Google Scholar] [CrossRef]
  93. Abad, I. Physical Meaning and Applications of the Illite Kübler Index: Measuring Reaction Progress in Low-Grade Metamorphism. In Diagenesis and Low-Temperature Metamorphism, Theory, Methods and Regional Aspects, Seminarios, Sociedad Espanola: Sociedad Espanola Mineralogia; University of Jaen: Jaen, Spain, 2007; pp. 53–64. [Google Scholar]
  94. Camacho, A.; McDougall, I.; Armstrong, R.; Braun, J. Evidence for shear heating, Musgrave Block, central Australia. J. Struct. Geol. 2001, 23, 1007–1013. [Google Scholar] [CrossRef]
  95. Środoń, J. Nature of mixed-layer clays and mechanisms of their formation and alteration. Annu. Rev. Earth Planet. Sci. 1999, 27, 19–53. [Google Scholar] [CrossRef]
  96. Bruhn, R.L.; Parry, W.T.; Yonkee, W.A.; Thompson, T. Fracturing and hydrothermal alteration in normal fault zones. Pure Appl. Geophys. 1994, 142, 609–644. [Google Scholar] [CrossRef]
  97. Sardini, P.; Ledesert, B.; Touchard, G. Quantification of Microscopic Porous Networks By Image Analysis and Measurements of Permeability in the Soultz-Sous-Forêts Granite (Alsace, France). In Fluid Flow and Transport in Rocks; Springer: Berlin/Heidelberg, Germany, 1997; pp. 171–189, Chapter 10. [Google Scholar]
  98. Liu, Y.; Xie, C.; Li, C.; Li, S.; Santosh, M.; Wang, M.; Fan, J. Breakup of the northern margin of Gondwana through lithospheric delamination: Evidence from the Tibetan Plateau. GSA Bull. 2019, 131, 675–697. [Google Scholar] [CrossRef]
  99. Chambefort, I.; Moritz, R.; von Quadt, A. Petrology, geochemistry and U–Pb geochronology of magmatic rocks from the high-sulfidation epithermal Au–Cu Chelopech deposit, Srednogorie zone, Bulgaria. Miner. Deposita 2007, 42, 665–690. [Google Scholar] [CrossRef] [Green Version]
  100. Glassley, W.; Crossey, L.; Montañez, I. Fluid–Rock Interaction. In Encyclopedia of Geochemistry; Springer Iinternational Publishing: Cham, Switzerland, 2016. [Google Scholar]
  101. Kadko, D.; Butterfield, D.A. The relationship of hydrothermal fluid composition and crustal residence time to maturity of vent fields on the Juan de Fuca Ridge. Geochim. Cosmochim. Acta 1998, 62, 1521–1533. [Google Scholar] [CrossRef]
  102. Hebert, R.L.; Ledesert, B.; Bartier, D.; Dezayes, C.; Genter, A.; Grall, C. The Enhanced Geothermal System of Soultz-sous-Forêts: A study of the relationships between fracture zones and calcite content. J. Volcanol. Geotherm. Res. 2010, 196, 126–133. [Google Scholar] [CrossRef]
  103. Dhansay, T.; Navabpour, P.; de Wit, M.; Ustaszewski, K. Assessing the reactivation potential of pre-existing fractures in the southern Karoo, South Africa: Evaluating the potential for sustainable exploration across its Critical Zone. J. Afr. Earth Sci. 2017, 134, 504–515. [Google Scholar] [CrossRef]
  104. Moir, H.; Lunn, R.; Shipton, Z.; Kirkpatrick, J. Simulating brittle fault evolution from networks of pre-existing joints within crystalline rock. J. Struct. Geol. 2010, 32, 1742–1753. [Google Scholar] [CrossRef]
  105. Laubach, S.E. Practical approaches to identifying sealed and open fractures. AAPG Bull. 2003, 87, 561–579. [Google Scholar] [CrossRef]
  106. Woodcock, N.H.; Dickson, J.A.D.; Tarasewicz, J.P.T. Transient permeability and reseal hardening in fault zones: Evidence from dilation breccia textures. Geol. Soc. London, Spéc. Publ. 2007, 270, 43–53. [Google Scholar] [CrossRef]
  107. Vidal, J.; Patrier, P.; Genter, A.; Beaufort, D.; Dezayes, C.; Glaas, C.; Lerouge, C.; Sanjuan, B. Clay minerals related to the circulation of geothermal fluids in boreholes at Rittershoffen (Alsace, France). J. Volcanol. Geotherm. Res. 2018, 349, 192–204. [Google Scholar] [CrossRef]
  108. Liotta, D.; Brogi, A.; Ruggieri, G.; Rimondi, V.; Zucchi, M.; Helgadóttir, H.M.; Montegrossi, G.; Friðleifsson, G. Ómar Fracture analysis, hydrothermal mineralization and fluid pathways in the Neogene Geitafell central volcano: Insights for the Krafla active geothermal system, Iceland. J. Volcanol. Geotherm. Res. 2020, 391, 106502. [Google Scholar] [CrossRef]
  109. Griffiths, L.; Heap, M.; Wang, F.; Daval, D.; Gilg, H.; Baud, P.; Schmittbuhl, J.; Genter, A. Geothermal implications for fracture-filling hydrothermal precipitation. Geothermics 2016, 64, 235–245. [Google Scholar] [CrossRef]
  110. Ito, H. Inferred role of natural fractures, veins, and breccias in development of the artificial geothermal reservoir at the Ogachi Hot Dry Rock site, Japan. J. Geophys. Res. Space Phys. 2003, 108. [Google Scholar] [CrossRef] [Green Version]
Figure 2. (a) Satellite view of the NH range showing a deformation gradient increasing southeastward, represented by the yellow dashed lines. (b,c) Map view zooms on the Proterozoic units along the NH strike showing the strain increase from (b) to (c), where basal CS sedimentary sequence appears increasingly stretched and boudinated.
Geosciences 11 00433 g002
Figure 3. Two examples of XRD patterns obtained for the clay fraction <2 µm in air-dried (AD–dark), after glycol solvation (G-blue) and heated (H-red) conditions for the NH granite, which were not identified in the fresh granite described by [19], and showing different clay compositions. (a) Illite, kaolinite, and quartz. (b) Vermiculite, illite, kaolinite, and quartz.
Geosciences 11 00433 g003
Figure 4. (a) Photograph and digitization showing representative hydrothermalized fracture zones observed on the field. (b) Photograph and digitization of granite crosscutting by multiple carbonate veins (veins network) altering pervasively the rock.
Geosciences 11 00433 g004
Figure 5. (a) Photograph and digitization of a brecciated and recrystallized vein also developing a gradient of alteration. Location of the sample NH_31 used as a case study in this section. (b) Photograph and digitization of a mylonitic vein developing a gradient of alteration. Location of the sample NH_23 used as a case study in this section.
Geosciences 11 00433 g005
Figure 6. (a) Photomicrograph of a quartz veinlets intersected by an illite veinlets under optical microscope in polarized–analyzed light. (b) Photomicrograph showing an illite vein crosscutting K-feldspar and illitized plagioclase under optical microscope in polarized–analyzed light. (c) Back-scattered image showing the different phases presented in (b). (c) Photomicrograph showing dolomite intersecting illite under optical microscope in polarized–analyzed light. (d) Back-scattered image of a dolomite, siderite, and calcite showing their chronology. (e) Hydraulic fracturing with calcite precipitating around clasts of quartz placed like a fan under optical microscope in polarized–analyzed light. (f) Photomicrograph under optical microscope in polarized–analyzed light of a microfracture intersecting an altered plagioclase which borders are made of pure kaolinite, whereas the plagioclase was recrystallized into kaolinite and illite. (g) Photomicrograph under an optical microscope in polarized–analyzed light, showing illite developing on the walls of an open microfracture and dolomite filling this open space.
Geosciences 11 00433 g006
Figure 7. (a) Photo and the respective digitalization of the sample NH_31, gathering NH_31_1_2 and NH_31_3, showing the different compartments that compose it, as well as the two scanlines realized in the host rock of the vein. (b) Plots of the cumulative frequency percentage against distance percentage for both scanlines. The diagonal represents a uniform distribution. (c) Stick plots showing the fracture position along the scanlines and for which the fracture density (P10) and the coefficient of variation (Cv) are given.
Geosciences 11 00433 g007
Figure 8. (a) Thin sections location on the sample NH_31. (b) Thin section mosaics showing the position and orientation of the scanlines. (c) Plots of the cumulative frequency percentage against distance percentage for each scanline. The diagonal represents a uniform distribution. Dashed lines indicate a zone where a rapid increase of the number of fractures is observed (slope threshold >2). (d) Stick plots showing the position of the fracture along the scanlines and for which the fracture density (P10) and the coefficient of variation (Cv) are given.
Geosciences 11 00433 g008
Figure 9. Photomicrographs of the different compartments of the sample NH_31 and their locations in the sample. (a,b) Respectively back-scattered image and CL images of calcite veins composed of two phases (Cal A and Cal B) crosscutting quartz, crosscut by a phase made of a carbonate/oxide matrix (calcite, dolomite, ankerite) with barium patches and transported clasts of quartz, K-feldspars, and few biotites, crosscut by later calcite veins (Cal C). (c,d) Zoom on the first generation of calcite vein and crosscutting quartz under optical microscope in polarized–analyzed light and showing two phases under CL. (e) A chemical quantification map realized under SEM of the carbonate/oxide matrix with barium and clasts. Different colors show a relative abundance of specific chemical elements (counts). (f,g) A photomicrograph under optical microscope in polarized–analyzed and under SEM, respectively, of the contact with the granite showing a dolomite matrix with transported clasts intersected by a calcite vein, the whole intersected by a carbonate/oxide matrix with transported clasts and barium precipitation patches. (h) The altered granite close to the brecciated vein showing a completely altered plagioclase replaced by calcite, kaolinite, and illite, a completely altered biotite replaced by illite and oxides and non–altered K-feldspar and quartz under an optical microscope in polarized–analyzed light. (i) The altered granite close to the brecciated vein presented in (h) under CL showing illite with no luminescence, in light blue an unaltered K-feldspar, in red some calcite and apatite in yellow. (j) The altered granite, away from the brecciated vein, showing a plagioclase partially replaced by calcite, kaolinite, and illite, biotites partially replaced by illite, and oxides, and unaltered quartz under optical microscope in polarized–analyzed light. (k) The altered granite away from the brecciated vein presented in (j) under CL showing kaolinite in dark blue, calcite in red, apatite in yellow and illite, quartz and biotite with no luminescence.
Geosciences 11 00433 g009
Figure 10. (a) Photograph of the sample NH_36 showing the scanline and the emplacement of the two thin sections made in the sample. (b) Plot of the cumulative frequency percentage against distance percentage for the scanline. The diagonal line represents a uniform distribution. Dashed lines indicate a cluster, meaning a zone where a rapid increase of the number of fractures is observed (slope threshold >2). (c) Stick plot showing the fracture position along the scanline and for which the fracture density (P10) and the coefficient of variation (Cv) are given. (d) Thin section mosaics showing the position and the orientation of the scanlines. (e) Plots of the cumulative frequency percentage against distance percentage for each scanline. The diagonal line represents a uniform distribution and the dashed lines delimit a fracture cluster. (f) Stick plot showing the fracture position along the scanline and for which the fracture density (P10) and the coefficient of variation (Cv) are given. Data were provided by [42].
Geosciences 11 00433 g010
Figure 11. (a) Sample NH_36 collected close to a fault zone showing the location of the two thin sections. (b) A mosaic of the thin section NH_36_1 showing a breccia. (c) A mosaic of the thin section NH_36_2 showing the limit between a breccia and the almost preserved granite. (d) A microphotograph of the NH_36_1 thin section showing a brecciated and slightly altered plagioclase, a brecciated quartz with a significant undulatory extinction, starting to recrystallize into subgrains, a brecciated biotite, and calcite crystallizing in the microfractures. (e) A micrograph of thin section NH_36_1 showing brecciated and non-altered K-feldspar and quartz with dolomite and calcite deposits between the clasts. (f) A microphotograph zooming in the preserved granitic zone visible of the thin section NH_36_2 and showing a brecciated and partially replaced plagioclase into kaolinite and brecciated, but unaltered, quartz and biotite. (g) A microphotograph zooming in the brecciated part of the thin section NH_36_2 and showing a carbonate matrix composed of dolomite and calcite transported clasts from the granite.
Geosciences 11 00433 g011
Figure 12. (a) A photo and the corresponding digitalization of the sample NH_23 showing the different compartments that compose it, as well as the two scanlines realized in the host rock of the vein. (b) Plots of the cumulative frequency percentage against distance percentage for both scanlines. The diagonal represents a uniform distribution. Dashed lines indicate a zone where a rapid increase of the number of fractures is observed (slope threshold >2). (c) Stick plots showing the fracture position along the scanlines and for which the fracture density (P10) and the coefficient of variation (Cv) are given.
Geosciences 11 00433 g012
Figure 13. (a) Thin section location on the sample NH_23. (b) Thin section mosaics showing the position and orientation of the scanlines. (c) Plots of the cumulative frequency percentage against distance percentage for each scanline. The diagonal represents a uniform distribution. Dashed lines indicate a zone where a rapid increase of the number of fractures is observed (slope threshold >2). (d) Stick plots showing the position of the fractures along the scanlines and for which the fracture density (P10) and the coefficient of variation (Cv) are given.
Geosciences 11 00433 g013
Figure 14. Photomicrographs of the different compartments of the sample and their location in the sample. (a) Veins of ankerite and calcite crosscutting the major quartzitic/feldspathic vein of the sample under optical microscope in polarized–analyzed light. (b) Back-scattered electron image of the photomicrograph (a). (c) Photomicrograph of the ankerite–granite interlayering zone under optical microscope in polarized–analyzed light. (d) A zoom image of the ankerite vein, under optical microscope in polarized–analyzed light, presented in (c) and showing a sigmoid of ankerite with a swell of automorphic crystals crushed and stretched in the pinches. (e) The altered granite close to the vein showing a completely altered plagioclase and biotite both replaced by illite and oxides and partially altered K-feldspar under optical microscope in polarized–analyzed light. (f) The altered granite away from the vein showing a completely altered plagioclase replaced by illite and kaolinite, biotite partially replaced by illite and oxides, an unaltered K-feldspar, and calcite veinlets under optical microscope in polarized–analyzed light.
Geosciences 11 00433 g014
Figure 15. Plot of selected major element oxides (Na2O, K2O, Al2O3, CaO, MgO, Fe2O3, and SiO2) versus loss on ignition (LOI) of samples from this study in orange and from [19] in grey. The dashed arrows show the different trends observed.
Geosciences 11 00433 g015
Figure 16. NH geological map showing the location and the associated calcite content of samples from this study represented by the white dots and of samples from [19] by the grey dots.
Geosciences 11 00433 g016
Figure 17. Geological map representing the Kübler Index (KI) in air-dried conditions of each sample from this study (dots) and from [19] (triangles) and the corresponding metamorphic zone represented by the different colors indicated in the legend for (a) the fraction <2 µm and (b) the fraction 2–6 µm.
Geosciences 11 00433 g017
Figure 18. (a) Diagrams showing Kübler Index (KI) values versus the Kaolinite Crystallinity Index (KCI) for the clay fractions <2 µm and 2–6 µm. (b) Diagram showing positive correlations between KI and KCI for the clay fractions <2 µm and 2–6 µm, excluding samples NH_6, NH_8, and NH_31_1_2.
Geosciences 11 00433 g018
Figure 19. Synthetic scheme showing, from low to moderate strain, the interaction between the fluid and the granite in the cases of a very low fluid/rock ratio. (a) Open fractures with an incipient alteration of the surrounding rock. (b) Brecciated zones with a carbonated matrix and no change of alteration degree. No scale is given for this scheme, because it can represent fracture zones of several order of magnitude.
Geosciences 11 00433 g019
Figure 20. Synthetic scheme showing, from low to moderate strain, the interaction between the fluid and the granite in the cases of a high fluid/rock ratio observed in the field. (a) An open fracture with an incipient alteration gradient at the border. (b) A sealed fracture with a slight alteration gradient. (c) A brecciated vein induced from fracture reactivation and showing an alteration gradient, but no fracturing gradient. (d) A mylonite made of carbonates and granitic lenses showing an alteration gradient and a fracturing gradient. NH_31 and NH_23 show a similar fracture density (Fd). No scale is given for this scheme, because it can represent fracture zones of several order of magnitude.
Geosciences 11 00433 g020
Table 1. List of samples collected in the field with their mineralogical composition determined after microscopic observations (optical-microscope and SEM-EDS) and XRD analysis (primary minerals and secondary minerals), their degree of microfracturing after [43], and their clay mineral composition for the fractions <2 µm and 2–6 µm. Abbreviations after [56], except for the following: Olg—oligoclase, Ox—oxide, I/S—illite/smectite, C/S—corrensite, n.m.—not measured, n.a.—not analyzed.
Sample NamePrimary MineralsSecondary MineralsClay Fraction < 2 µmClay Fraction 2–6 µmMicrofracturing
Ill/MsKlnC/SI/SVrmBtIll/MsKlnC/SI/SVrmBt
NH_16Qtz, Or, Bt, OlgCal, Clays+--- ++-- Fd2
NH_17Qtz, Or, Ab, ApGp, Claysn.m.+- -- Fd2
NH_18Qtz, Or, Olg, BtClays++-- ++-- Fd2
NH_19Mc, Or, Olg, Bt, Qtz, MsDol, Cal, Clays+ + Fd2–3
NH_20Qtz, Or, Olg, BtCal, Ox, Claysn.a.n.a.Fd2–3
NH_21Qtz, Or, OlgCal, Dol, Sd, Ox, Claysn.a.n.a.Fd3
NH_22Qtz, Or, Bt, OlgCal, Hem, (Dol), Clays+- -+- -Fd3
NH_23Qtz, Or, Olg, BtCal, Ox, Claysn.a.n.a.Fd3
NH_24Qtz, Or, Olg, BtCal, Clays++ -- -+ -- Fd3
NH_25Qtz, Or, Bt, EpCal, Ox, Clays++ ++ Fd3
NH_26Qtz, Or, Bt, Olg, McClays-++ ++-++ ++Fd3
NH_27Qtz, Or, BtAnk, Cal, Clays+++- -+++- -Fd3
NH_28Qtz, Or, Mc, Olg, Bt, MsCal, Ox, (Dol), Clays ++ ++ Fd3
NH_29Qtz, Or, Olg, Ab, BtCal, Dol, Claysn.a.n.a.Fd3
NH_30Qtz, Or, Mc, Olg, Ab, Bt, MsCal, (Ox, Dol), Claysn.a.n.a.Fd3
NH_31_1_2Qtz, Or, Olg, BtClays++ - +++ - Fd3
NH_31_3Qtz, Or, Ab, BtGp, Cal, Claysn.m.++-- Fd3
NH_32Qtz, Or, BtCal, Ox, (Dol), Clays+++- +++- Fd4
NH_33Qtz, Or, Bt, AbCal, Clays--++ -----++ ---Fd4
NH_34Qtz, Or, Mc, Ab, Ap, BtGp, Cal, Hem, Claysn.m.--++ -- Fd4
NH_35Qtz, Or, Mc, BtCal, Claysn.a.n.a.Fd4
NH_36Qtz, Or, Bt, OlgCal, Gp, Hl, Clays + + ++ -Fd4
NH_37Qtz, OrCal, Dol, Ank, Ox, Claysn.a.n.a.Fd4
NH_38Qtz, Or, Mc, Olg, BtCal, Clays ++ ++ Fd4
NH_39Qtz, Or, Mc, Olg, BtCal, Clays ++ ++ Fd4
Table 2. Spatial fractures analysis. Scanline length: total length of each scanline; fracture number, mean spacing, P10, and Cv value by scanline and fracture distribution tendency by scanline.
Sample NameScaleScanline
Name
Scanline
Length (cm)
Fracture NumberMean
Spacing (cm)
P10 (fracs/m)CvFracture
Distribution
NH_31SampleSL1_NH_3213.511110.128290.67Regular—Random
SL2_NH_3216.441440.118820.60Regular—Random
Thin
sections
SL_NH_32_11.60470.0329971.03Random
SL_NH_32_22.21870.0239881.07Random—Clustered
SL_NH_32_32.341180.0250841.11Random—Clustered
NH_36SamplesSL_NH_3615.8530.33421.03Random
Thin
sections
SLH_NH_36_12.871530.0246361.49Clustered
SLV_NH_36_12.061330.0263121.01Random
SLH_NH_36_23.351840.0252311.11Random—Clustered
SLV_NH_36_21.88740.0339300.92Regular—Random
NH_23SampleSL1_NH_2414.331970.0713820.68Regular—Random
SL2_NH_2412.931700.0713220.66Regular—Random
Thin
sections
SL_NH_24_12.481170.0247980.77Regular—Random
SL_NH_24_22.37910.0238791.19Random—Clustered
Table 3. Major elements and loss on ignition (LOI) weight percentage (wt%) for the NH granite.
Sample IDNH_19NH_23NH_27NH_31_3NH_36
SiO267.1860.8456.2669.2966.67
Al2O315.0317.3114.0515.4215.30
Fe2O32.934.613.172.693.65
MgO0.711.060.890.240.97
CaO1.812.839.102.343.80
Na2O2.202.450.272.893.12
K2O5.454.694.484.053.05
TiO20.230.390.290.240.34
P2O50.120.180.140.130.17
MnO0.110.230.230.060.12
LOI4.105.2010.902.502.60
Sum99.9199.8899.9099.8899.87
Table 4. Porosity values, recalculated bulk-rock major element weight percentage, altered rock density/fresh rock density ratio, volume factor (Fv) assuming the immobility of Al2O3 (XAl2O3 = 0).
Sample IDNH_2 1NH_27NH_31_3NH_36
Porosity (%)2.2910.110.111.5
Oxides (weight %)
SiO269.5763.371.1868.6
Al2O314.7215.8115.8415.74
Fe2O34.353.572.763.76
MgO1.1610.251
CaO2.5310.242.43.91
Na2O3.230.32.973.21
K2O3.655.044.163.14
TiO20.470.330.250.35
MnO0.120.260.060.12
Density ratio (dA/dF) 0.930.920.92
Fv (XAl2O3 = 0)1.001.001.011.02
1 Geochemical data recalculated from [19].
Table 5. Results of mass-balance calculations assuming Fv = 1.
Sample IDNH_27NH_31_3NH_36
Absolute mobility (%)
SiO2−10.39−3.54−5.32
Al2O30.06−0.18−0.29
Fe2O3−1.01−1.77−0.82
MgO−0.23−0.92−0.22
CaO7.04−0.301.10
Na2O−2.95−0.47−0.22
K2O1.060.20−0.70
TiO2−0.16−0.24−0.14
MnO0.12−0.06−0.01
Table 6. List of samples with their respective FWHM and Kübler Index (KI) values in air-dried (AD) conditions for the fractions <2 µm and 2–6 µm. n.m.—not measured.
Sample IDIllite Peak (10) <2 µmIllite Peak (10) 2–6 µm
FWHM ADKI ADFWHM ADKI AD
NH_160.620.970.430.65
NH_17n.m.0.801.27
NH_180.410.610.340.49
NH_190.520.750.510.74
NH_220.530.780.580.84
NH_240.831.320.701.11
NH_250.590.590.630.63
NH_270.650.960.550.80
NH_31_1_20.721.140.641.01
NH_31_3n.m.0.340.50
NH_320.290.290.210.21
NH_34n.m.0.280.39
Publisher’s Note: MDPI stays neutral with regard to jurisdictional claims in published maps and institutional affiliations.

