Article

New Catastrophic Gas Blowout and Giant Crater on the Yamal Peninsula in 2020: Results of the Expedition and Data Processing

1
Oil and Gas Research Institute of the Russian Academy of Sciences (OGRI RAS), 3, Gubkina St., 119333 Moscow, Russia
2
Skolkovo Innovation Center, Skolkovo Institute of Science and Technology, 3 Nobel Street, 121205 Moscow, Russia
3
Non-profit partnership “Russian Center of Arctic Development”, 20, Respubliki st., 629007 Salekhard, Russia
*
Author to whom correspondence should be addressed.
Submission received: 22 December 2020 / Revised: 27 January 2021 / Accepted: 29 January 2021 / Published: 8 February 2021
(This article belongs to the Special Issue Gas Emissions and Crater Formation in Arctic Permafrost)

Abstract

:
This article describes the results of an Arctic expedition studying the new giant gas blowout crater in the north of Western Siberia, in the central part of the Yamal Peninsula in 2020. It was named C17 in the geoinformation system “Arctic and the World Ocean” created by the Oil and Gas Research Institute of the Russian Academy of Sciences (OGRI RAS). On the basis of remote sensing, it can be seen that the formation of the crater C17 was preceded by a long-term growth of the perennial heaving mound (PHM) on the surface of the third marine terrace. Based on the interpretation of satellite images, it was substantiated that the crater C17 was formed in the period 15 May–9 June 2020. For the first time, as a result of aerial photography from inside the crater with a UAV, a 3D model of the crater and a giant cavity in the ground ice, formed during its thawing from below, was built. The accumulation of gas, the pressure rise and the development of gas-dynamic processes in the cavity led to the growth of the PHM, and the explosion and formation of the crater.

1. Introduction

In recent years, increasing attention has been paid to the issues of greenhouse gas emissions (mainly carbon dioxide and methane) and continuing global warming, most strongly affecting the Arctic [1,2,3]. Warming in the Arctic is causing the degradation of permafrost, which intensifies gas emissions into the atmosphere facilitating the process of climate change. Intensive gas emissions from permafrost were observed in the Russian Arctic in the north of Western Siberia especially on the Yamal and Gydan Peninsulas, in the north of the Krasnoyarsk region, in the Yakutia and the Chukotka Peninsula. Gas emissions were studied as part of the process of well drilling [4,5,6,7,8,9,10,11,12,13,14,15,16], through gas chemical analyses of the air [17,18,19], during the monitoring of the active layer and water objects (lakes, rivers, seas), field expeditions and with the use of remote sensing (RS) data [5,6,7,8,13,14,15,16,20,21,22,23,24,25,26,27,28,29,30,31,32,33,34,35,36,37,38,39,40,41,42,43,44,45,46,47,48,49,50,51,52,53,54,55,56,57,58,59,60,61,62,63,64,65,66,67,68].
The first data on powerful gas outflows from the bottom of thermokarst lakes in the north of Western Siberia were obtained in the late 1960s–early 1970s [53,54,55]. Despite the fact that these studies were mainly local in nature, it was noted that the distinctive features of these lakes were the transparency of the water to depths of 3–4 m and its greenish blue color in summer [53,54,55].
During the period 2014–2020, in the north of Western Siberia, specialists from the Oil and Gas Research Institute of Russian Academy of Sciences (OGRI RAS) [6,8,21,22,23,24,25,26,27,28,29,30,31,32,33,34,35,36,37,38] carried out comprehensive studies of the onshore and offshore degassing processes (lakes, rivers), including the distribution of thermokarst lakes, at the bottom of which direct signs of degassing were revealed in the form of numerous crater-like objects—pockmarks [69]. A wide complex of geological–geophysical methods and equipment was used in field surveys, including aerial photography from unmanned aerial vehicles (UAVs) [8,29,30,31,32,33,34,35,36,37,38]. As a result of 13 field expeditions and on the basis of the interpretation of ultra-high resolution RS data of the Earth from space, the authors from the OGRI RAS for the first time revealed 1860 zones of active degassing with the formation of craters of gas emissions at the bottom of 1667 thermokarst lakes, four rivers and two bays on the Yamal Peninsula [31,32,33,34,35,36]. In addition, a regional connection was established between the identified degassing zones and the areas of increased methane concentration in the atmosphere, recorded by the TROPOspheric Monitoring Instrument (TROPOMI) spectrometer on European Space Agency (ESA) Sentinel-5p satellite [34]. All received data were loaded into the created and constantly developed OGRI RAS geoinformation system “Arctic and World Ocean” [6,7,8,25,26,27,28,29,30,31,32,33,34,35,36,37].
The first information about the emergence of new geological formations in the Earth’s cryosphere in the north of Western Siberia—giant craters of gas blowouts—appeared in 2014 [6,21,22,23,24,25,50,57,58,63]. The first such crater-like object was discovered in the central part of the Yamal Peninsula in the summer of 2014 by helicopter pilots, 30 km to the south of the unique Bovanenkovo oil and gas condensate field, the development of which began in 2012 by PJSC Gazprom [6]. The inner and outer dimensions of the crater exceeded 26 and 40 m, respectively, and the depth was about 50 m. This crater was widely known as the Yamal Crater, and the authors assigned it the C1 index in the Arctic and World Ocean geoinformation system [6,7,8,25,26,27,28,29,30,31,32,33,34,35,36,37]. Soon, in the north of Western Siberia, several more similar craters were discovered, to which the authors assigned the indices C2, C3, C4, etc. [6,7,8,22,23,24,25,26,27,28,29,30,31,32,33,34,35,36,37].
Studies carried out by the authors during the period 2014–2020 have shown a great potential hazard of the Earth degassing in the regions where the cryolithosphere is spread [6,7,8,21,22,23,24,25,26,27,28,29,30,31,32,33,34,35,36,37]. The C1 crater was formed at only 3.5 km from the Bovanenkovo–Ukhta main high-pressure gas pipeline, and the C9 crater was formed near the railway. The range of the frozen soil and ground ice fragments spread in various cases reached 300–900 m, which is much greater compared to man-made gas emissions that often occur during emergency gushing through the annular space of wells [6,8,70,71]. In each of the three known cases of gas emissions (C3, C11 and C12), as attested by indigenous people, self ignition and gas explosion occurred [8]. This further increases the danger of powerful gas blowouts for the infrastructure of oil and gas fields and human lives.
In the course of studies based on the interpretation of RS data, it was proven that before the blowouts and explosions of gas at the sites of the craters, there were positive relief forms that looked very similar to the perennial heave mounds (PHMs) widely known in various regions of the Arctic [6,8,21,22,23,24,25,26,27,28,29,30,31,32,33,34,35,36,37,38,40,42,43,47,48,49,50,51,52,57,58,60,63,68]. In total, according to RS data, 7185 PHMs were found on Yamal alone [8,31,34]. Classical PHMs, called bulgunnyakhs in Russia, and pingos in other Arctic countries (USA, Canada, Norway, Denmark), have a cryogenic genesis and are usually formed in the low-lying parts in dried lakes basins—khasyreis or in river valleys [31,72,73,74,75]. However, the geomorphological features of the PHMs locations, in the places of which the craters were formed, turned out to be mostly different (mainly uplands). This required research into possible models of the PHMs’ formation, as well as their destruction during the explosion. Various models have been proposed and substantiated in the papers of the OGRI RAS authors [6,8,21,22,23,24,25,26,27,29,30,31,32,33,34,35,36,37,38,68] and other scientists [40,42,43,47,49,50,51,52,57,58,76].
In 2014, a model of the gas blowout formation from gas-saturated cavities in massive ground ice appearing in the process of its local thawing from below was formulated and published in the first articles about the crater [6,21,22]. Moreover, according to this model [21]: “the gas deposit was formed not in a traditional sand reservoir, but in a cavity at the place of gradual thawing of ground ice (massive, vein, bulgunnyakh-hydrolaccolith-pingo core, etc.) with replacement of ice/water space with gas. The existence of the permafrost has led to the accumulation of huge volumes of gas in the upper part of the section, including thermokarst cavities. The pressure of the accumulated gas in a number of places turned out to be sufficient to destroy the permafrost overburden, while the ejection of the destroyed part of the soil occurred due to the action of pneumatic or gas-explosive mechanisms with the formation of parapet”. The gas release was facilitated by the “heating of the lower part of the permafrost zone by deep fluids, which, in addition to the effect of global warming, weakened the strength properties of the permafrost” which could arise through the local fault zones [21]. Note that the Bovanenkovo area and the craters C1, C2, C9, C10, C15 and C17 are located in the anomaly zone of increased heat flow [21].
The PHM model with a gas-saturated thermokarst cavity in the ice mass found additional strong confirmation in many subsequent studies by scientists from the OGRI RAS, including the mathematical modeling of such objects in 2015 [24]. The model is confirmed by the specific features of the craters C1, C2, C3, C4, C5, C10, C11, C12, etc., as well as by the discovered overhanging remnants of the roof vaults of the PHMs and grottoes inside the craters C1, C3, C5, C11 and C12, which can form and will only survive in the presence of underground cavities before the explosion [8,29,33,36]. Several years later, this model began to be recognized by some other scientists working on this topic [52,64].
In addition, a gas-dynamic model of the heaving mounds formation due to a local increase in reservoir pressure in weakly consolidated sediments on land and the bottom of various water bodies, including the Ocean, was formulated and substantiated [8]. In addition, it has been substantiated that even the formation of gas-saturated cavities in the sedimentary stratum is possible when it is ruptured by a ultra-high pressure gas flow (higher than lithostatic) [8]. This model explains the formation of craters (pockmarks) at the bottom of thermokarst lakes and other water bodies, including the Ocean [69].
In the summer of 2020, a new gas blowout crater was discovered in the central part of the Yamal Peninsula, which received the C17 index in the “Arctic and World Ocean” database. In August 2020, an expedition to survey this object was carried out. In addition to the staff of the OGRI RAS, the expedition was attended by specialists from the Skolkovo Institute of Science and Technology, who also have experience in the research of similar objects [12,16,40,41,42,43,76]. The purpose of this article was to report the preliminary results of research on the C17 crater of gas blowout.

2. Description of the Region of Study

The crater was found by the head of the Russian Center of Arctic Development Andrey Umnikov during a helicopter flight in the central part of the Yamal Peninsula (Figure 1). It is located close to a group of the previously found C1, C2, C9, C10 craters situated to the south of the Bovanenkovo oil and gas condensate field, unique in terms of gas reserves (4.9 trillion m3), discovered in 1971 on the northern continuation of the Nurmin megaswell [5,6,77,78,79]. The gas deposits of the field are located in a wide stratigraphic range at depths ranging from 520–700 m (Cenomanian) to 3250–3450 m (Paleozoic). The development of the Bovanenkovo oil and gas condensate field began in 2012 and reached 96.3 billion m3 of gas in 2019. The permafrost thickness in the crater C17 area reaches 250 m, and the average temperature of the permafrost at the depth of Zero Annual Amplitude is about −5 °C [5,79].
On the basis of the C17 crater photographs, only the dome of the PHM exploded, while its vast peripheral part was preserved. This is also confirmed by all subsequent materials. Large fragments of ejected soil were observed on the terrain surface around the crater.
According to the permafrost-parametric drilling data to a depth of 350–550 m, carried out during the period 1991–1997 by the permafrost engineering company “KRIOS” [80], crater C17 is located in the area of continuous permafrost distribution within the third marine terrace with specific tundra moss and shrub vegetation. This terrace consists of Upper Pleistocene fairly homogeneous clay deposits (mIII2-3) up to 30 m thick [79,81]. Clay deposits are characterized by a fairly high gravitational moisture content of 40–80% and more for highly icy layers. The content of organic material in clay deposits is 7–9%. These deposits are saline clay. Their total salinity mainly varies from 0.7 to 1.8%. The minimum salinity values (up to 0.2–0.3) are confined to the ground ice layers. The high salinity of the clay soil of the third marine terrace determines a significant content of unfrozen water up to 15–20 wt.%. The freezing point of investigated clay depends on soil salinity and can reach −2.5 °C. In the lower part of these deposits, formation ice is widely represented. As a rule, it is not saline. They are mainly underlain by sandy and sandy loam marine sediments of the Upper Pleistocene (mIII1). From a depth of about 70 m, sandy and sandy-loam deposits of the Yamal Series (mI-II1-2) occur, and at a depth of about 200 m, they come into contact with clayey deposits of the Paleogene (mP1-2).
The study area is characterized by a high gas saturation in the upper part of the permafrost. In the works by the LLC “KRIOS”, it was proven that “... in some areas the frozen strata has a two- and, possibly, three-layer structure” separated by permeable salt water layers—cryopegs [80]. In some areas, the frozen stratum is heterogeneous, has a different lithological composition and salinity and therefore, it can contain extended horizons of cooled sediments with cryopegs [79,80]. This pattern is also found in other land and water areas of the Russian Arctic. This creates additional possibilities for the sub-horizontal migration of fluids (water and gas), some of which come out to the ground surface and into the atmosphere through numerous taliks that exist below thermokarst lakes and large rivers. During the drilling of many wells, gas was released from the upper permafrost horizons (in the intervals of 20–130 m) with a flow rate of hundreds and even thousands of cubic meters per day, and in some cases, the flow rates reached 10,000–14,000 m3/day [6,10,15,42,77,79,82]. The longest gas emission was observed from the 72–80 m interval with a reservoir pressure of 8 atm in the well No. 64 in the southern part of the Bovanenkovo field—the flare was burning for 550 days [6,16,77,79]. For the first 30 days, the gas flow rate varied from 3000 m3/day to a stable 500 m3/day. In total, about 300,000 m3 of gas burned out in this flare. Reservoir pressures in permafrost gas reservoirs were usually below hydrostatic; only at five sites they exceeded it by 3–14% [79]. The composition of the gas was mostly methane (74.8–99.8%) [10,11,16].

3. Materials and Methods

3.1. Remote Sensing (RS) and Digital Elevation Model (DEM)

RS data from various satellites in space (Table 1) and the results of aerial photography from helicopters and UAVs were used in this study. Obtaining high-quality RS data from space for the Arctic is hampered by a small number of satellite observations and severe weather conditions with frequent clouds. Therefore, we used satellite images of different resolutions (Table 1).
The use of ArcticDEM (version 7) digital elevation models (DEMs), different time strips from 2011 to 2017 [83,84] has been of great benefit. ArcticDEM is the National Geospatial Intelligence Agency and the National Science Foundation (NGA-NSF) initiative to create and distribute a high-resolution digital elevation model of the Arctic surface using optical stereo images processed with photogrammetry software [84]. It covers nearly all the area above 60° north latitude. The latest version 7 of ArcticDEM, available since September 2018, has a spatial resolution of up to 2 m and mainly includes DEMs built on satellite images from WorldView 1, WorldView 2 and WorldView 3 from DigitalGlobe at resolutions up to 0.5 m [83,84]. While all data are automatically generated from high-quality sources, sometimes errors can occur on small steep-walled objects such as crater C1, and also in arranging the DEM data according to the sea level [29,35,36].

3.2. Remote Sensing Using the Helicopter and Unmanned Aerial Vehicle (UAV)

The MI-8 helicopter was used for the regional search and local inspection of degassing objects. Photos and coordinates of the detected objects have been added to the OGRI RAS geoinformation system “Arctic and World Ocean”.
The DJI Mavic Pro (DJI, Shenzhen, China) unmanned aerial vehicle (UAV) was equipped with a 12.3 MP Ultra HD camera “Mavic Pro” with a stabilizer. Satellites used for navigation were GPS (USA) and GLONASS (Russia). UAVs are widely used in the Arctic for solving various tasks, including monitoring geodynamic processes on the Earth’s surface [29,35,36,38,71,85,86]. The main challenges of using UAVs in the high latitudes of the Arctic are frequent strong winds, as well as an insufficient number of GPS satellites in the polar regions.
Processing UAV data in Pix4Dmapper, Agisoft Metashape and ArcGIS software [87,88,89] provides possibilities to create DEMs and 3D spatial data. Pix4Dmapper and Agisoft Metashape implement high-tech algorithms of objects detection and their spatial location determination, as a result of the photogrammetric processing of a series of aerial photographs taken during UAV flights. Based on these data, using ArcGIS software, it is possible to create 3D DEMs and conduct the monitoring of their changes in time [35,38,90]. All mentioned methods were used in our study.

3.3. Thermometric and Other Measurements on the Bottom and Around the Crater

The coordinates of ground objects, including the crater boundary, were measured using a Garmin-64ST GPS, and the geometrical dimensions of the crater were determined using a Leica-Rangemaster CRF 2000-B laser rangefinder.
The temperature at the bottom of the crater was measured with the KIT-1 temperature measurement sensor manufactured by LLC RUSGEOTEKH [91], consisting of a multichannel thermometric cable assembly with 19 digital temperature sensors and a reader operating in automatic mode. The instrumental error of the KIT-1 temperature meter according to the technical characteristics of the device in the range of field measurements does not exceed 0.1 °C.

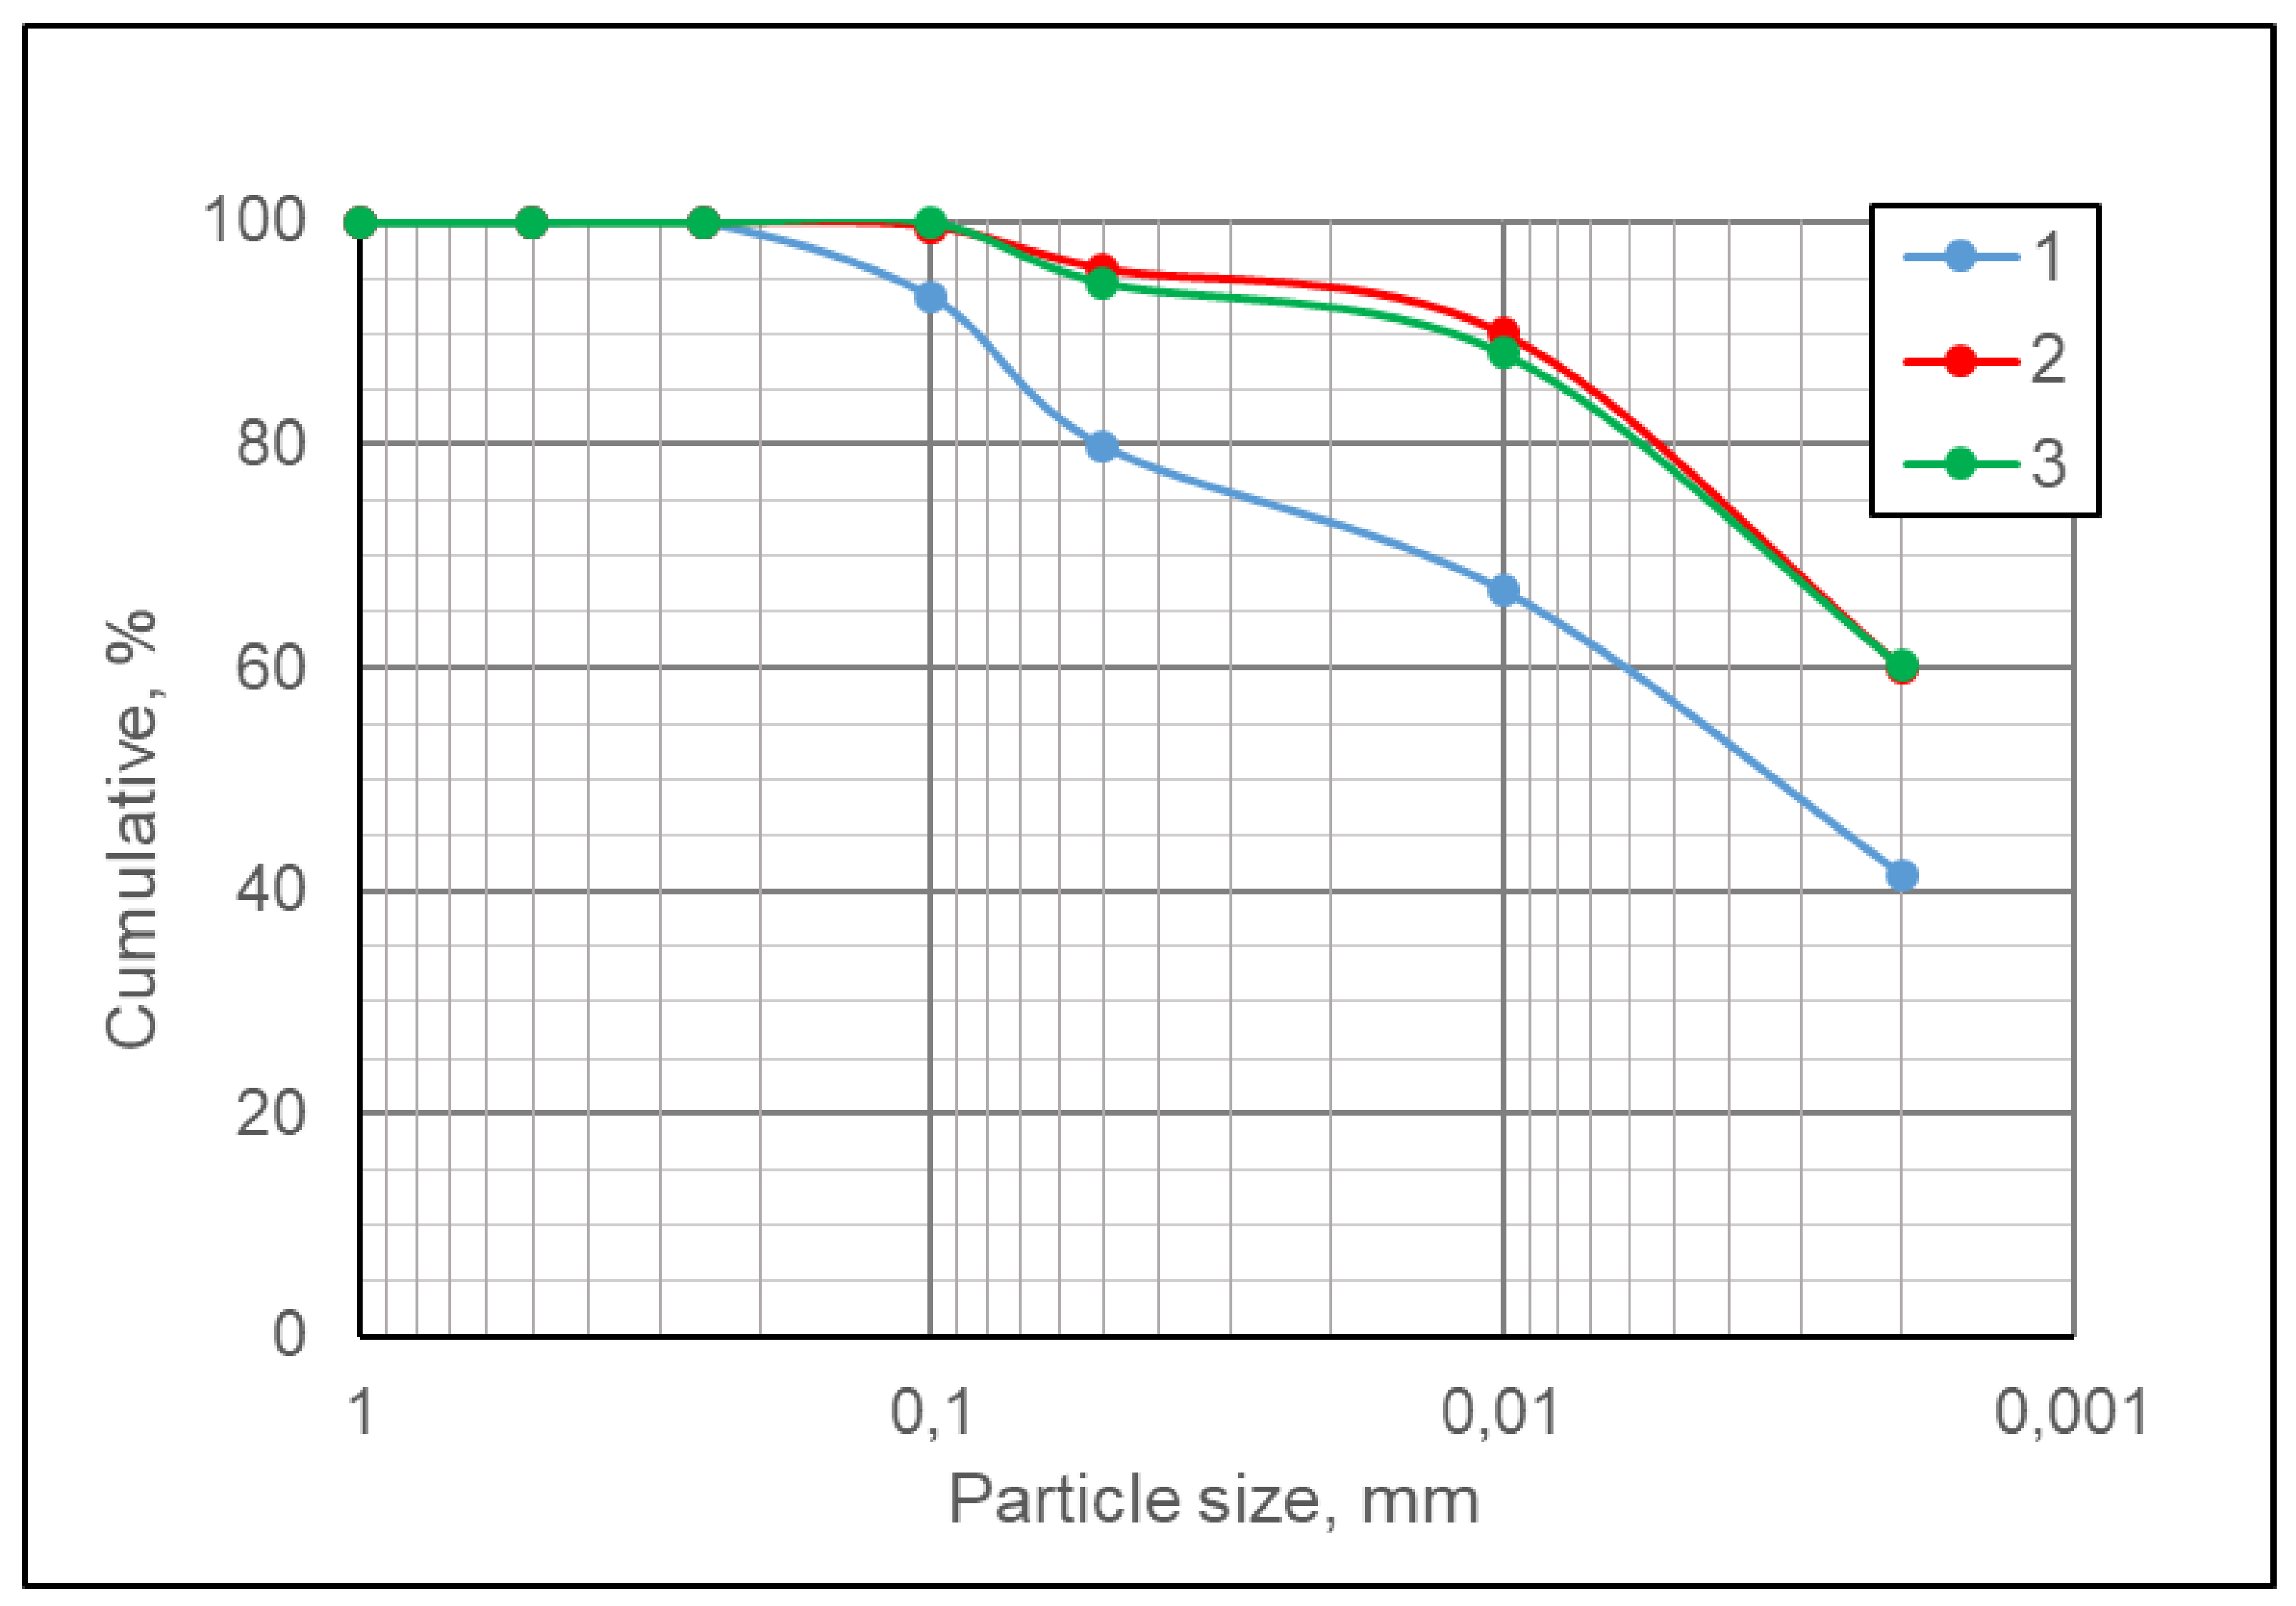
3.4. Geochemical and Physical Properties of Ejected (Exposed) Sediment Samples

The main physical parameters of collected soil samples ejected by the gas explosion during crater formation were determined according to standard methods used in soil science, approved in accordance with Russian state standards (or “GOST” in Russian). Moisture, soil density, soil particle density, as well as the upper and lower limits of soil plasticity were determined in accordance with GOST 5180-2015 [92]. The particle size distribution of soils was determined by the sieve method and the hydrometer method according to GOST 12536-2014 [93]. The determination of the content of water-soluble salts was carried out by the method of water extracts [94]. The total organic content was determined by calcining to constant weight in accordance with GOST 23740-2016 [95].

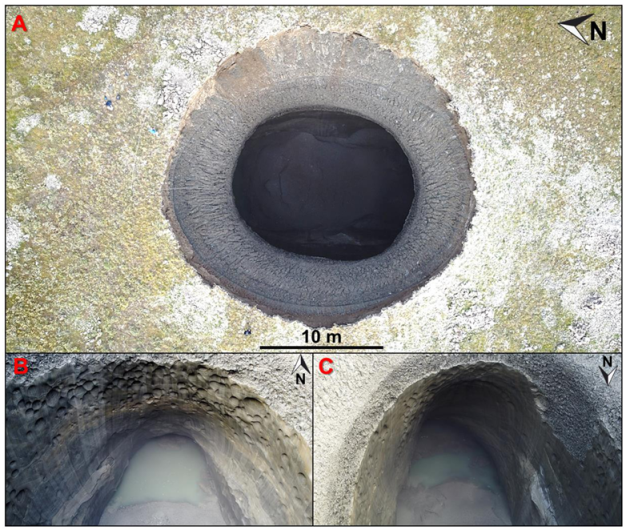
4. Results of the Research

4.1. Field Studies

Expedition studies of the C17 gas blowout crater were carried out by the authors on 26 August 2020. Figure 2 shows a photograph from a helicopter, and Figure 3 shows a panoramic image of crater C17 from the southern edge of the remained PHM base. The remnants of the base of the mound that existed before the explosion, and pieces of frozen soil ejected during the explosion, which thawed in the summer, can be seen around the crater. Over the past 40 days after the day of the crater discovery (16 July), its size slightly increased due to the melting of the walls and the collapse of the rock, which can be seen when comparing Figure 1 and Figure 2. According to direct measurements with the Leica-Rangemaster CRF 2000-B, the depth of the crater in different parts of the bottom varied from 29 to 33 m (minimum in the center of the crater). The average outer diameter of the crater (near the ground surface) was about 25 m.
The upper part of the crater walls in the zone of underground cavity cover rupture (the arch of the mound) have a rounded conical shape (Figure 2, Figure 3 and Figure 4A). The height of the residual walls of the mound in some places exceeded 2 m. Due to the peculiarities of the heating of the mound’s inner exposed part (the crater wall) by solar radiation, a dark strip is noted, which corresponds to the boundary of the permafrost thawing on the crater wall from the surface. The depth of this boundary, depending on the angle of the incoming sun’s radiation of the heating zone, varies from 1.5–2 to 6 m, which is clearly seen in Figure 3 and Figure 4A.
The upper part of the permafrost in the crater is composed of clayey rocks with a characteristic reticulate cryogenic structure with a predominance of subvertical ice veins (almost pure ice) (Figure 4A–D). Icy clayey rocks lie on a layer of massive ground ice with different shades (Figure 4B,D). The crater walls are almost vertical in two opposite directions. In two other directions, large void spaces in the form of grottoes are observed in the ground ice (Figure 4B, Figure 5B,C), deeply going into two opposite sides with a NNW and SSE orientation.
Several characteristic horizons were clearly visible while examining the crater walls. The uppermost soil layer of seasonal thawing with a thickness of about 0.7–1.2 m is distinguished by a brownish color due to the presence of peat and iron (Figure 3 and Figure 4A). Below this layer lie gray clayey rocks that compose the upper part of the permafrost. The clays are ice rich and have a characteristic reticulate cryogenic structure. Visible ice content reaches 35–40% (Figure 4C). Numerous subvertical cracks filled with ice interlayers are especially well distinguished (Figure 4C). In the upper part of the permafrost, the cryogenic structure is medium-netted with fine veins, and below it is medium-netted with medium veins, from a depth of 4–6 m it turns into a medium-large netted with characteristic thick vertical and steeply inclined veins. The contact of frozen clays with massive ground ice is located at a depth from 9.1 to 11.5 m from the parapet. The uppermost part of the ground ice with a thickness of 2.4–2.5 m is broken and differs from the smooth walls of the crater in its characteristic chipped appearance (Figure 4D).
The ground ice layer extends to the very bottom of the crater, i.e., its thickness exceeds 20–23 m. The dirty ice is predominantly gray, and in places brownish and whitish (possibly due to the presence of gas bubbles). It is layered due to inclusions and plastic deformations. In the upper part, the layering emphasizes some dome-like structure of the ice body associated with its formation and transformation during the occurrence of internal gas-dynamic pressures. The ground ice has a melted surface (see Figure 4D), with characteristic oval hollows (cavities) associated with the uneven melting of the ice, apparently during the formation and development of a gas-saturated cavity.
According to visual analysis, at the bottom of the cavity, there is an elevation of wet clay material (Figure 4B), which accumulated due to the fall of most of the exploded mound cover and crumbling of thawing soil from the crater walls. There was little bottom water in the crater. This water was identified only in two lower parts (lateral depressions) associated with two grottoes which protect it from soil shedding of the crater’s walls (Figure 5B,C).
During the field research, a KIT-1 thermometric cable assembly with 19 temperature sensors and a reader was lowered to the bottom of crater C17 on a cable. The cable assembly was placed on the surface of the wet clay soil for 1.5 h and the temperature sensors measured the temperature at the soil–air boundary. When processing the results, temperature changes that occurred during the first 30 min were excluded as interference arising from insufficient temperature stabilization. The remaining data were averaged for each of the sensors. According to the measurements, the temperature at the clay surface of the crater bottom varied from +0.56 °C to +2.26 °C, with the average temperature being about +1.25 °C.
Unique results were obtained using the DJI Mavic Pro UAV. The main part of aerial photography of the C17 crater area for the DEM construction was carried out from the heights of 60–250 m. However, from these heights the lower darkened part of the underground cavity with a depth of about 30 m was not visible without special processing due to the effect of a “black hole”. Figure 5A shows a fragment of a brightened aerial photograph of C17 crater from a flight altitude of 50 m, on which the bottom of the crater with the crumbling rock is visible.
Due to the impossibility of photographing the complex shape of the entire cavity from a height of 50 m, in which two lateral extended underground void spaces were observed, a survey was carried out with a drone flying into the crater at a level of 10–15 m below the ground surface. At the same time, there was a short-term loss of communication between the drone and satellites and the remote control sharply deteriorated. All this could lead to the loss of the apparatus. However, thanks to the previously gained experience in UAV control, “underground aerial photography” inside the crater was successfully performed. Fortunately, more than 80 unique photographs were taken inside the crater using the UAV, providing an opportunity for its detailed examination and digital photogrammetric processing.
Figure 5B,C show photographs of two side hollows (north and south grottoes) located in diametrically opposite NNW and SSE directions at azimuths of 350° and 170°, respectively. The bottom of the underground cavity in the grottoes is deeper than it is in its center, and therefore it is flooded with water. At the same time, above the water, there are spaces extending in the directions indicated above (possibly narrow caves in the ice), the edges of which can only be seen at a close approach.
Coordinates and photographs were taken of more than 50 pieces of ejected soil on the surface around the crater. Note that impact craters in the soil cover (similar to those found near craters C2 and C3) were not found. From this, it was concluded that the gas blowout occurred during the time when the seasonal thawing layer of ground was still frozen (November–June).
Lumps of soil larger than 0.5 m were detected at a distance of up to 60 m from the edge of the crater. The largest ground masses were located near the crater. Individual pieces of ejected soil material up to 10 cm in size were found at distances of up to 200–220 m. In general, the ejected soil materials were presented by homogenous gray clay material. It was often broken up by a network of cracks, partially swollen, which is apparently the result of the melting of ice veins. Samples of the ejected soil were collected from various distances from the crater (15, 30 and 150 m) during the survey of the territory for further investigations in the laboratory.

4.2. Field Data Processing

The particle size distribution by the hydrometer method, the chemical composition of pore water and a few physical characteristics were determined for the selected soil samples. The average results of this study are presented in Table 2 and Figure 6.
The studied samples are characterized by heavy clay and silty clay texture classes (Figure 6), the content of clay particles (sizes less than 0.002 mm) reaches 60%, and in two samples (2 and 3) there are almost no particles larger than 0.1 mm (less than 1%), whilst in one (1) their content is only 6.7%. Depending on the distance from the crater, there is a tendency to an increase in the fineness of the sampled soils, which is confirmed by the data of the particle size distribution, as well as the results of determining the plasticity index. At a large distance from the crater (about 150 m), the soils were more dispersed, more saline (0.68%) with an increased content of organic material up to 5.2%. The chemical composition of the water extracts of the sampled soil was dominated by chlorine (Cl), sulfate (SO4−2) anions and Na++K+, Ca+2, and Mg+2 cations, which indicates the marine type of salinity. The obtained results show good correlation with early investigations [79,81], which is confirmed by the rather homogeneous particle size distribution of sediments of the third marine terrace in the study area.

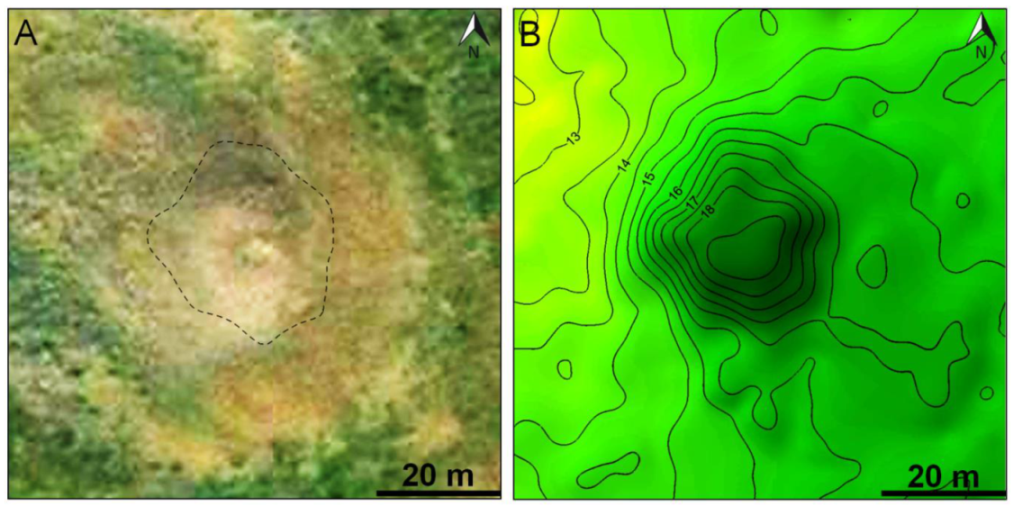
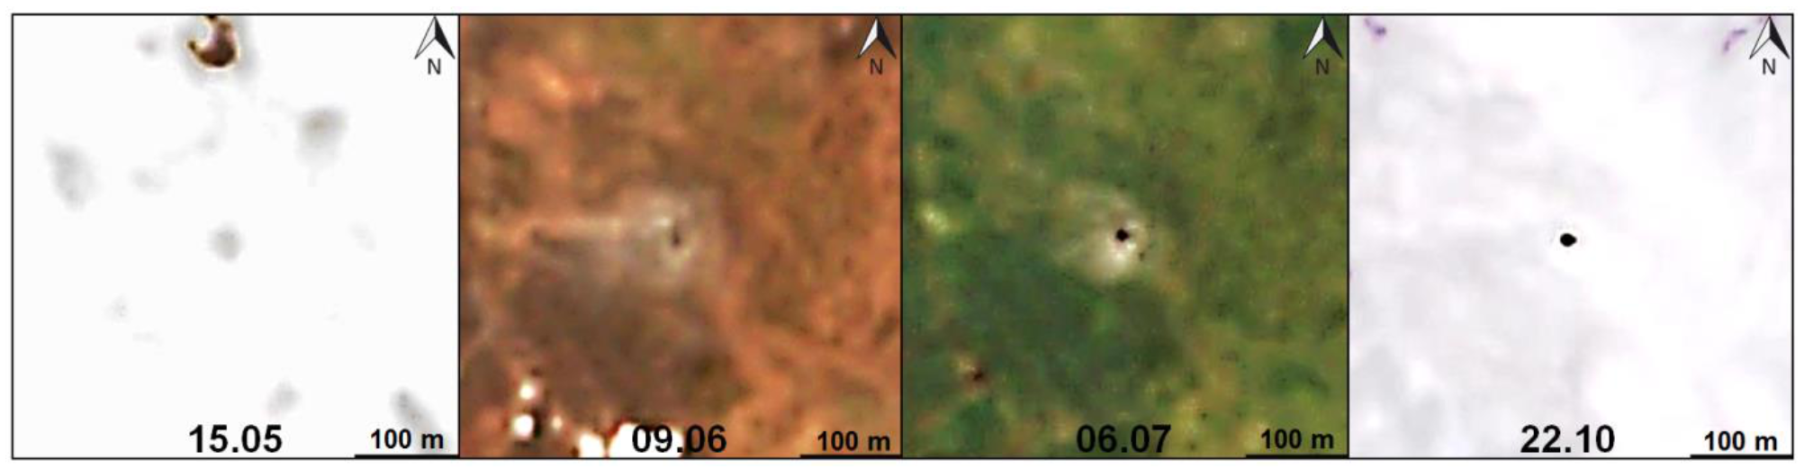
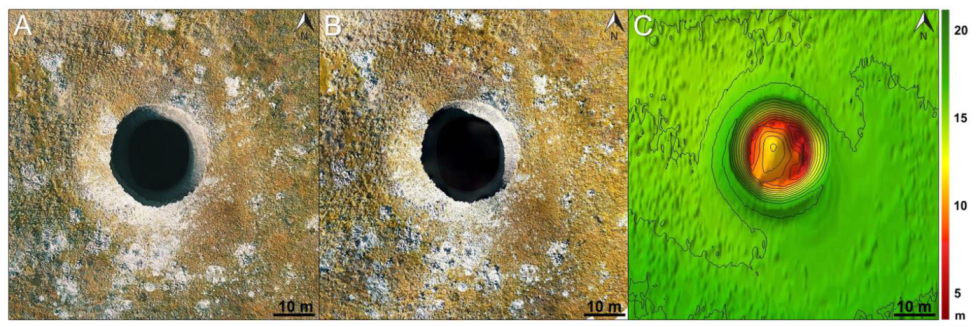
4.3. Remote Sensing Data Processing

The PHM before the explosion (size 80 × 80 m) is shown in the WorldView-2 satellite image from 21.08.2013 (Figure 7A) and ArcticDEM (Figure 7B). According to the analysis of the available data of the ArcticDEM strips as of 2011 and 2017, there was a PHM before the explosion, which existed at the site of the crater, the height of which increased from 3.4 m in 2011 to 4.2 m in 2017. At the same time, the average growth rate of the PHM over 6 years was 13.3 cm per year, which is significantly less than the growth of the mound on the Seyakhinsky object (C11) [8,29,33,36]. For 6 years, the horizontal dimensions along the lower closed contour of the mound of C17 object increased from 36 × 46 m in 2011 to 43 × 58 m in 2017. These sizes were determined by the approximation of the isolines by ellipses by neglecting small undulations (up to 0.2–0.4 m), associated with local changes in the altitudes of the relief, the distorting influence on DEM from shrub vegetation, and possible errors in the calculations of the ArcticDEM. The main axes of the ellipses had NNW orientation at azimuths of approximately 335° in 2011, 338° in 2013 and 343° in 2017. A comprehensive analysis of retrospective RS data and the available topographic maps at a scale of 1:50,000 showed that the PHM existed for at least 20 years before the explosion.
The date of the gas blowout and the formation of the C17 crater was determined by the RS data based on the analysis of available satellite images of 2020, mainly of medium resolution (Table 1). For the period from April to July, there is a very limited number of available high-resolution satellite images. Based on the set of the medium-resolution satellite images from Landsat-8 (15 m), Sentinel-2A and Sentinel-2B (10 m), as well as a limited number of PlanetScope satellite images (3 m), the presence of a crater has been unambiguously determined from 9 June (possibly from 4 June). Figure 8 shows a series of Sentinel-2 satellite images of the studied object (size 440 × 440 m) at different times, including those with snow cover (15 May and 22 October), after the incomplete melting of snow cover (9 June) and in summer with green vegetation (6 July). As a result of the analysis, it was established that the PHM definitely existed until 15 May (the beginning of the snow cover melting). It can be said with less certainty that the PHM still existed on 28 May. Thus, the date of the gas blowout is clearly limited to the period from 15 May to 9 June (possibly from 28 May to 4 June).

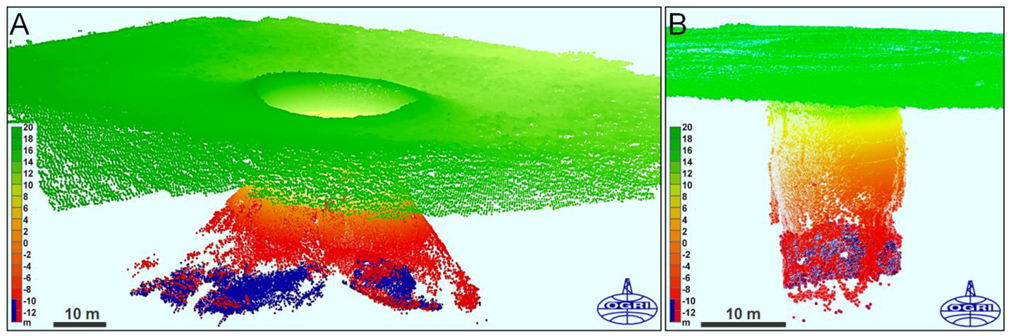
4.4. UAV Field Data Processing: Creating 3D Models Based on Aerial Photography Data

Figure 9A shows a fragment of an aerial photograph in the area of the C17 crater, taken from an UAV at a height of 250 m. The digital photogrammetric processing of the UAV data was performed using Pix4Dmapper and ArcGIS, which allow creating a DEM. At the first stage of processing, 52 aerial photographs were used from a height of 60 m. Figure 9B,C show the orthophotomap of the C17 crater area and the constructed DEM. The terrain relief, including the remaining parts of the mound and the walls of the crater in the upper part, is additionally displayed on the DEM (Figure 9C) in isolines with a step of 1 m. Small objects are visible on the ground surface, corresponding to pieces of ejected soil and vegetation (bush), which are also seen in Figure 9A,B. However, the internal structure of the cavity is not displayed and the depth of the crater turned out to be two times less (Figure 9C) due to the aforementioned “black hole” effect (see Figure 9A,B). The automatic display of the pseudo-bottom of the crater in the ArcGIS software was obtained based on interpolation along the contours of the inclined walls of the upper part of the crater.
Note that at the first stage of processing, the constructed 3D model of the crater (Figure 9C) correctly only displays the DEM with the upper part of the crater to depths of about 14 m and does not display the structure of its lower part (depths from 11, 5–14 to 32 m). This result was predicted by the authors during the field survey. In this regard, 81 aerial photographs were taken at a depth of 15 m below the ground level to correctly display the space of the cavity.
At the second stage, the comprehensive photogrammetric processing of 133 aerial photographs was carried out, including 52 from a height of 60 m above the ground and 81 taken inside the crater, 10–15 m below the ground surface. Note that during the processing, two aerial photographs had to be rejected because there were some mistakes in the coordinates.
Figure 10 shows two screenshots of a complex 3D model, including a DEM of the ground surface and underground space, depicted as a cloud of points with color coding corresponding to the altitude relative to the sea level. The bottom of the underground cavity is shown in Figure 10 in blue, while in Figure 10A one can see the elevation of the bottom in the central part due to the fallen rock. The range of the bottom depths in the crater (vertically) varies from 28 m in the center of the crater to the water level in the distant parts of the grottoes at a depth of 32 m. Taking into account the water layer, it can be assumed that the initial depth of the cavity bottom was about 34–35 m.
According to the constructed 3D model (Figure 10), the size of the crater on the surface of the earth was 24 × 25 m, and the internal size of the elliptical crater vent was from 15 to 18 m (at a depth of 11.5–14 m). The dimensions of the lower part of the underground space at its bottom are 13–15 m wide and 61–62 m long in the direction of the grottoes. The area of the cavity bottom is about 700–720 m2. The approximate volume of the underground space of the crater with the cavity is estimated at about 10,000 m3, including about 7500 m3 of the cavity in the ground ice.

5. Discussion

The explored new C17 gas blowout crater provided a rare opportunity to obtain unique information. It is characterized by minimal water flooding and the uniquely good preservation of a significant part of the arch and a cavity of complex shape formed in the ground ice. The release of the gas at the C17 crater occurred through the central part of the PHM, which formed on the surface of the third marine terrace in the central part of the Yamal Peninsula. In this regard, this PHM cannot be classified as a classic frost heaving mound (bulgunnyakh or pingo).
The crater was discovered on 16 July, no later than two months after its formation (15 May–9 June 2020), approximately 1.5 months after the beginning of active snow melt in spring. Note that according to the nearest weather station in Maresale, Yamal (69.714°N, 66.812°E, 25 m above sea level), in 2020, the lowest temperature in the study region reached −32 °C (1 February), and a stable positive temperature was established starting from 3 June (17 July was about +7 °C) [96]. According to the Sentinel-2 and Landsat-8 satellite images, on 10 June, most of the depressions in the terrain were filled with snow, which still existed on 6 July on the shady walls of the steepest slopes. Taking this into account, it can be claimed that the initial appearance of the crater after the gas blowout and the destruction of the mound arch was close to that shown in the photograph in Figure 1. This figure shows that thawing affected only the uppermost, inner part of the mound remnants (about 1–1.5 m), when landslides of the soil layer falling into the crater began from it. However, the share of the exploded part of the mound volume is clearly small—according to visual assessment, no more than 15–20% (Figure 1, Figure 2 and Figure 3). We believe that part of the ejected soil was ground ice (in some places almost pure ice), which melted in the summer (June–July) 2020. The largest part of the ejected rock, which flew vertically after the explosion, apparently fell back into the crater. A large pile of fallen soil is visible at the bottom of the cavity (Figure 4B and Figure 5). This situation was observed in almost all previously surveyed craters (e.g., C1, C3, C9, C11) [6,8,21,22,23,24,25,26,27,28,29,30,31,32,33,34,35,36].
During the survey on 26 August, the temperature at the bottom of the constantly shaded underground cavity was only +1.25 °C, and on the surface of its ice walls, it was around 0 °C. Therefore, we can assume that the ice walls in the lower half of the underground cavity (Figure 4, Figure 5 and Figure 9) were almost identical to the original ones at the time of the explosion. The bottom of the crater was almost dry with two separate pools of water in local depressions in two diametrically opposite channels—grottoes. It should be noted that earlier small grottoes were found in the bottom parts of craters C1, C3 and C12 [22,64]. However, nowhere were they so large and strongly extending into the lateral spaces of the massive ice. Probably, they were in the crater C1, but its lower part had already been intensively flooded by the time of the first observation.
On the remnant parts of the underground cavity dome and on the cavity walls, numerous caverns are present (Figure 1, Figure 4B,D and Figure 5B,C), which are forming due to the uneven melting of ice. Such caverns occur in the domes and walls of all ice cavities (caves), which form as a result of upward melting of glacial ice and firn. They were also revealed in the ice walls of all the craters, which were observed before their flooding (C1, C3, C5, C4, C12). This indicates that gas-filled cavities existed before the explosions of the PHMs.
The complex shape of the underground space and the "black hole" effect did not allow to construct a 3D model of the C17 crater by traditional aerial photography. In this regard, “underground aerial photography” was carried out, which posed great difficulties associated with the high probability of losing the apparatus with all the photographs. It is also worth noting that the aerial photography of such underground spaces has never been performed before. As a result of the complex photogrammetric processing, a unified digital 3D model was built, including the surface and the walls of the underground space of a complex-shaped cavity with the remaining part of the arch (Figure 10).
The oblong shape of the underground cavity, the bottom of which can be approximated by an ellipse with the main axes of 61.5 and 14 m (compression ratio 0.228), and specific elements in the structure of the ice walls (Figure 4B) suggest that initially not one, but at least two cavities were formed in the massive ice. As their size increased, these cavities merged into a single underground space with an elliptical bottom. The major axis of the ellipse has a NNW orientation at azimuth of 350°. It differs just by 7° from the azimuth of the major axis of the ellipse (343°), approximating the shape of the PHM which existed before the explosion (in 2017). This difference can be explained by the dipping of the area relief in the western direction.
It is worth noting that on the Yamal Peninsula, the main tectonic elements (including the Nurmin megaswell) and faults are oriented in the NW and NNW directions [6,8,77,78,79]. Based on this, it can be concluded that the shape of the underground cavity is interconnected with fault tectonics. It should also be noted that the group of craters C1, C2, C9, C10, C15 and C17 is located in the area of increased heat flow [6,8,21].
The only explanation for the PHM growth and explosion is the gas-dynamic mechanism. The increase in gas pressure in the underground cavity led to the growth of a mound in its arched part, which eventually led to the rupture of the top with the ejection of gas, fragments of ice and frozen soil. The recorded spread of soil material during gas blowout reached 200–220 m.
Taking into account the results of studies of other craters (C1, C3, C11, Lake Otkrytiye) [6,8,27,64], it is suggested that the gas emission can continue, leading to repeated powerful gas blowouts like volcanic type of eruption [8,21,22,27,28,29,33,36].

6. Conclusions

For the first time on the Yamal Peninsula, a well-preserved crater of gas blowout, minimally filled with water, was discovered in the upper horizons of the frozen strata. This made it possible to carry out detailed field research using modern 3D survey methods. For the first time aerial photography from inside the crater with a UAV, a practically unchanged intrapermafrost cavity in the lower part of the crater, where the accumulation of gas under the pressure and the development of gas-dynamic processes took place, was depicted in a digital 3D model. Detailed data on the form of the crater walls and the intrapermafrost cavity in its lower part, formed in the massive ice mass, were obtained.
It was revealed that the occurrence of the crater was preceded by the long-term existence of the PHM on the surface of the third marine terrace. The upper part of the section (up to a depth of 11 m) consisted of clay soils with a high ice content and a reticulate cryogenic structure dominated by subvertical ice veins. Below 9.1–11.5 m, the exposed section to a depth of 32 m was represented by massive ground ice. The ice is layered with traces of deformation and a melted surface with small isometric hollows (caverns). The soil material ejected during the formation of the crater was characterized by a predominance of clay particles, presence of organic matter of about 5% and a weak salinity of up to 0.7%. The spread of soil material from the center of the crater reached 220 m.
According to the digital 3D model, the crater diameter was about 25 m, and the dimensions of its elliptical vent were about 15 × 18 m. The underground space of the cavity in the massive ice mass was about 13–15 m wide, and the length in the direction of the grottoes was over 60 m. In general, the volume of the underground space is about 10,000 m3, including about 7500 m3 of the cavity in ice.
The specific shape of the underground cavity in the massive ice, the structure of which is depicted by a digital 3D model, is of great importance for the factual confirmation of the model of cavity formation. It proves the model of its formation in the massive ground ice, the gas-dynamic mechanism of the PHM formation and powerful gas blowout with the destruction of the arch part of the underground cavity and the PHM itself, for the first time formulated and substantiated in [6,21,22,24]. The repeated gas blowouts are highly probable.
Despite the source of the gas and how it formed the aforementioned cavities and caused blowouts and crater formation remain unclear (it could be gas from gas hydrate dissociation and natural gas deposits in permafrost, gas migrated from deeper horizons or mixed gas), the data obtained can be used as among the elements in calculating the volumes of gas emissions from previously unaccounted sources of powerful methane blowouts in the Arctic under the “Global Carbon Project” [1,2].

Author Contributions

All the authors conducted field investigations. V.B. developed the methodology, supervised the research, collected and processed the 2020 field data, analyzed the data, and wrote the article; I.B. and R.N. collected and processed the field data, worked with the UAV and prepared DEMs; T.K. worked with the RS and DEM data; E.C. and B.B. collected and processed the field soil samples and temperature data, analyzed the geocryological conditions of the study area, participated in writing the article; A.U. discovered C17 crater, obtained the field data. All authors have read and agreed to the published version of the manuscript.

Funding

The reported study was funded by “Rational usage of nature and effective development of oil and gas resources of the Arctic and Subarctic zones of the Earth” basic research program of OGRI RAS (No. AAAAA19-119021590079-6) with the support of field studies by the Russian Foundation for Basic Research (grant No. 18-05-70111). The Skoltech authors are grateful for the support of the Russian Science Foundation (grant No. 18-77-10063).

Institutional Review Board Statement

Not Applicable.

Informed Consent Statement

Not Applicable.

Data Availability Statement

Not Applicable.

Acknowledgments

The authors are grateful to the Government of the Yamal-Nenets Autonomous District and personally to A.V. Mazharov, and the Russian Center of the Arctic Development for their great repeated assistance in conducting the 2020 field studies. The authors thank anonymous reviewers for the insightful comments which helped to improve the manuscript.

Conflicts of Interest

The authors declare no conflict of interest.

References

  1. Saunois, M.; Bousquet, P.; Poulter, B.; Peregon, A.; Ciais, P.; Canadell, J.G.; Dlugokencky, E.J.; Etiope, G.; Bastviken, D.; Houweling, S.; et al. The global methane budget 2000–2012. Earth Syst. Sci. Data 2016, 8, 697–751. [Google Scholar] [CrossRef] [Green Version]
  2. Saunois, M.; Stavert, A.R.; Poulter, B.; Bousquet, P.; Canadell, J.G.; Jackson, R.B.; Raymond, P.A.; Dlugokencky, E.J.; Houweling, S.; Patra, P.K.; et al. The Global Methane Budget 2000–2017. Earth Syst. Sci. Data 2020, 12, 1561–1623. [Google Scholar] [CrossRef]
  3. Dean, J.F. Old methane and modern climate change. Science 2020, 367, 846–848. [Google Scholar] [CrossRef] [PubMed]
  4. Are, F.E. The problem of emission of deep gases into the atmosphere. Cryosphere Earth 1998, 4, 42–50. (In Russian) [Google Scholar]
  5. Badu, Y.B. Cryogenic Strata of Gas-Bearing Structures in Yamal. On the Influence of Gas Deposits on the Formation and Development of Cryogenic Strata; Moscow; Scientific World: Vancouver, BC, Canada, 2018; p. 232. (In Russian) [Google Scholar]
  6. Bogoyavlensky, V.I. Arctic and the World Ocean: Current State, Perspectives and Challenges of Hydrocarbon Production; VEO Russia: Moscow, Russia, 2014; pp. 12–175. (In Russian) [Google Scholar]
  7. Bogoyavlensky, V.; Kishankov, A.; Yanchevskaya, A.; Bogoyavlensky, I. Forecast of Gas Hydrates Distribution Zones in the Arctic Ocean and Adjacent Offshore Areas. MDPI. Geosciences 2018, 8, 453. [Google Scholar] [CrossRef] [Green Version]
  8. Bogoyavlensky, V.I. Natural and technogenic threats in fossil fuels production in the Earth cryolithosphere. Russ. Min. Ind. 2020, 97–118. (In Russian) [Google Scholar] [CrossRef] [Green Version]
  9. Bondarev, V.L.; Mirotvorsky, M.Y.; Gudzenko, V.T.; Oblekov, G.I.; Shaidullin, R.M. Gas-geochemical characteristics of the above-Cenomanian deposits of the Yamal Peninsula. Geol. Geophys. Dev. Oil Gas Fields 2008, 5, 22–34. (In Russian) [Google Scholar]
  10. Chuvilin, E.M.; Yakushev, V.S.; Perlova, U.M.; Kondakov, V.V. Gas component of frozen rock strata within the Bovanenkovo gas condensate field (Yamal Peninsula). Dokl. Ras 1999, 369, 522–524. (In Russian) [Google Scholar]
  11. Buldovicz, S.N.; Khilimonyuk, V.Z.; Bychkov, A.Y.; Ospennikov, E.N.; Vorobyev, S.A.; Gunar, A.Y.; Gorshkov, E.I.; Chuvilin, E.M.; Cherbunina, M.Y.; Kotov, P.I.; et al. Isotopic Composition of Natural Gases in the North of the Western Siberia: Overview; IRTs OAO “Gazprom”: Moscow, Russia, 2000; p. 80. (In Russian) [Google Scholar]
  12. Kraev, G.; Schulze, E.-D.; Kholodov, A.; Chuvilin, E.; Rivkina, E. Cryogenic displacement and accumulation of biogenic methane in frozen soils. Atmosphere 2017, 8, 105. [Google Scholar] [CrossRef] [Green Version]
  13. Kraev, G.; Rivkina, E.; Vishnivetskaya, T.; Belonosov, A.; van Huissteden, J.; Kholodov, A.; Smirnov, A.; Kudryavtsev, A.; Tshebaeva, K.; Zamolodchikov, D. Methane in gas shows from boreholes in epigenetic permafrost of Siberian Arctic. Geosciences 2019, 9, 67. [Google Scholar] [CrossRef] [Green Version]
  14. Yakushev, V.S.; Perlova, E.V.; Chuvilin, E.M.; Kondakov, V.V. Permafrost as a reservoir of gas and gas hydrate accumulations. Gas Ind. 2003, 3, 36–40. (In Russian) [Google Scholar]
  15. Yakushev, V.S. Natural Gas and Gas Hydrates in Cryolithozone; VNIIGAZ: Moscow, Russia, 2009; p. 192. (In Russian) [Google Scholar]
  16. Yakushev, V.S.; Chuvilin, E.M. Natural gas and gas hydrate accumulations within permafrost in Russia. Cold Reg. Sci. Technol. 2000, 31, 189–197. [Google Scholar] [CrossRef]
  17. Glotov, V.E.; Glotova, L.P. Natural sources of atmospheric methane in the Circum-Pacific region of the permafrost (northeastern Russia). Bull. Samara Sci. Cent. Russ. Acad. Sci. 2015, 17, 26–32. (In Russian) [Google Scholar]
  18. Streletskaya, I.D.; Vasiliev, A.A.; Oblogov, G.E.; Streletskiy, D.A. Methane content in ground ice and sediments of the Kara Sea coast. Geosciences 2018, 8, 434. [Google Scholar] [CrossRef] [Green Version]
  19. Yakushev, V.S. Natural Gas Liberations around production wells at Russian Arctic gas fields. Geosciences 2020, 10, 184. [Google Scholar] [CrossRef]
  20. Badu, Y.B. Gas manifestations and the nature of cryolithogenesis of marine sediments of the Yamal Peninsula. Cryosphere Earth 2017, XXI, 42–54. (In Russian) [Google Scholar]
  21. Bogoyavlensky, V.I. The threat of catastrophic gas blowouts form the Arctic permafrost. The Craters of Yamal and Taymyr. Drill. Oil 2014, 9, 13–18. (In Russian) [Google Scholar]
  22. Bogoyavlensky, V.I. The threat of catastrophic gas blowouts form the Arctic permafrost. The Craters of Yamal and Taymyr. Pt. 2. Drill. Oil 2014, 10, 4–8. (In Russian) [Google Scholar]
  23. Bogoyavlensky, V. Gas Blowouts on the Yamal and Gydan Peninsulas. GeoExPro 2015, 12, 74–78. [Google Scholar]
  24. Bogoyavlensky, V.I.; Garagash, I.A. Substantiation of the process of formation of gas emission craters in the Arctic by mathematical modeling. Arct. Ecol. Econ. 2015, 3, 12–17. (In Russian) [Google Scholar]
  25. Bogoyavlensky, V.I.; Sizov, O.S.; Bogoyavlensky, I.V.; Nikonov, R.A. Remote detection of areas of surface gas manifestations and gas emissions in the Arctic: The Yamal Peninsula. Arct. Ecol. Econ. 2016, 3, 4–15. (In Russian) [Google Scholar]
  26. Bogoyavlensky, V.I.; Bogoyavlensky, I.V.; Nikonov, R.A. Results of aerial, space and field investigations of large gas blowouts near Bovanenkovo field on Yamal Peninsula. Arct. Ecol. Econ. 2017, 3, 4–17. (In Russian) [Google Scholar] [CrossRef]
  27. Bogoyavlensky, V.I. Gas-hydrodynamics in the Arctic craters of gas blowout. Arct. Ecology Econ. 2018, 29, 48–55. (In Russian) [Google Scholar] [CrossRef]
  28. Bogoyavlensky, V.I.; Bogoyavlensky, I.V. Natural and man-made threats in the search, exploration and development of hydrocarbon deposits in the Arctic. Miner. Resour. 2018, 2, 60–70. (In Russian) [Google Scholar]
  29. Bogoyavlensky, V.I.; Sizov, O.S.; Mazharov, A.V.; Bogoyavlensky, I.V.; Nikonov, R.A.; Kishankov, A.V.; Kargina, T.N. Earth degassing in the Arctic: Remote and field studies of the Seyakha catastrophic gas emission on the Yamal Peninsula. Arct. Ecol. Econ. 2019, 33, 80–105. (In Russian) [Google Scholar] [CrossRef]
  30. Bogoyavlensky, V.I.; Bogoyavlensky, I.V.; Kargina, T.N.; Nikonov, R.A.; Sizov, O.S. Earth degassing in the Artic: Remote and field studies of the thermokarst lakes gas eruption. Arct. Ecol. Econ. 2019, 34, 31–47. (In Russian) [Google Scholar] [CrossRef]
  31. Bogoyavlensky, V.I.; Sizov, O.S.; Bogoyavlensky, I.V.; Nikonov, R.A.; Kargina, T.N. Earth Degassing in the Arctic: Comprehensive Studies of the Distribution of Frost Mounds and Thermokarst Lakes with Gas Blowout Craters on the Yamal Peninsula. Arct. Ecol. Econ. 2019, 36, 52–68. (In Russian) [Google Scholar] [CrossRef] [Green Version]
  32. Bogoyavlensky, V.I.; Erokhin, G.N.; Nikonov, R.A.; Bogoyavlensky, I.V.; Bryksin, V.M. Study of catastrophic gas blowout zones in the Arctic based on passive microseismic monitoring (on the example of Lake Otkrytiye). Arct. Ecol. Econ. 2020, 37, 93–104. (In Russian) [Google Scholar] [CrossRef]
  33. Bogoyavlensky, V.I.; Sizov, O.S.; Bogoyavlensky, I.V.; Nikonov, R.A.; Kishankov, A.V.; Kargina, T.N. Study of the Seyakha Gas Explosion on the Yamal Peninsula. Geomodel 2019, 2019, 5. [Google Scholar] [CrossRef]
  34. Bogoyavlensky, V.I.; Sizov, O.S.; Nikonov, R.A.; Bogoyavlensky, I.V.; Kargina, T.N. Earth degassing in the Arctic: The genesis of natural and anthropogenic methane emissions. Arct. Ecol. Econ. 2020, 39, 6–22. (In Russian) [Google Scholar] [CrossRef]
  35. Bogoyavlensky, V.I.; Bogoyavlensky, I.V.; Kargina, T.N.; Nikonov, R.A. Digital technologies for remote detection and monitoring of the development of heaving mounds and craters of catastrophic gas blowouts in the Arctic. Arct. Ecol. Econ. 2020, 40, 90–105. (In Russian) [Google Scholar] [CrossRef]
  36. Bogoyavlensky, V.; Bogoyavlensky, I.; Nikonov, R.; Kishankov, A. Complex of geophysical studies of the Seyakha catastrophic gas blowout crater on the Yamal Peninsula, Russian Arctic. MDPI. Geosciences 2020, 10, 215. [Google Scholar] [CrossRef]
  37. Bogoyavlensky, V.I.; Yerokhin, G.N.; Nikonov, R.A.; Bogoyavlensky, I.V.; Bryksin, V.M. Passive seismic monitoring study of the Earth degassing in the Arctic. Eage Geomodel. 2020, 2020, 1–5. [Google Scholar] [CrossRef]
  38. Bogoyavlensky, I.V. Perspectives of Implementing remote methods for Geoecological Tasks with creating 3D models. In Proceedings of the Third International Conference on Geology of the Caspian Sea and Adjacent Areas (Baku, 2019), Baku, Azerbaijan, 16–18 October 2019; pp. 1–5. Available online: https://www.earthdoc.org/content/papers/10.3997/2214-4609.201952014 (accessed on 2 February 2020). [CrossRef]
  39. Bondur, V.G.; Kuznetsova, T.V. Detecting Gas Seeps in Arctic Water Areas Using Remote Sensing Data. Izv. Atmos. Ocean. Phys. 2015, 51, 1060–1072. (In Russian) [Google Scholar] [CrossRef]
  40. Buldovicz, S.N.; Khilimonyuk, V.Z.; Bychkov, A.Y.; Ospennikov, E.N.; Vorobyev, S.A.; Gunar, A.Y.; Gorshkov, E.I.; Chuvilin, E.M.; Cherbunina, M.Y.; Kotov, P.I.; et al. Cryovolcanism on the earth: Origin of a spectacular crater in the Yamal Peninsula (Russia). Sci. Rep. 2018, 8, 13534. [Google Scholar] [CrossRef]
  41. Chuvilin, E.M.; Yakushev, V.S.; Perlova, E.V. Gas and gas hydrates in the permafrost of Bovanenkovo gas field, Yamal Peninsula, West Siberia. Polarforschung 2000, 68, 215–219. [Google Scholar]
  42. Chuvilin, E.; Ekimova, V.; Davletshina, D.; Sokolova, N.; Bukhanov, B. Evidence of gas emissions from permafrost in the Russian Arctic. Geosciences 2020, 10, 383. [Google Scholar] [CrossRef]
  43. Chuvilin, E.; Stanilovskaya, J.; Titovsky, A.; Sinitsky, A.; Sokolova, N.; Bukhanov, B.; Spasennykh, M.; Cheremisin, A.; Grebenkin, S.; Davletshina, D.; et al. A Gas-emission crater in the Erkuta River valley, Yamal Peninsula: Characteristics and potential formation model. Geosciences 2020, 10, 170. [Google Scholar] [CrossRef]
  44. Desyatkin, A.R.; Fedorov, P.P.; Nikolaev, A.N.; Borisov, B.Z.; Desyatkin, R.V. Emission of CH4 with an increase in thermokarst lake in Central Yakutia. Bull. Nefu 2016, 52, 5–14. (In Russian) [Google Scholar]
  45. Dean, J.F.; Middelburg, J.J.; Röckmann, T.; Aerts, R.; Blauw, L.G.; Egger, M.; Jetten, M.S.M.; de Jong, A.E.E.; Meisel, O.H.; Rasigraf, O.; et al. Methane feedbacks to the global climate system in a warmer world. Rev. Geophys. 2018, 56, 207–250. [Google Scholar] [CrossRef]
  46. Dean, J.F.; Meisel, O.H.; Rosco, M.M.; Marchesini, L.B.; Garnett, M.H.; Lenderink, H.; van Logtestijn, R.; Borges, A.V.; Bouillon, S.; Lambert, T.; et al. East Siberian Arctic inland waters emit mostly contemporary carbon. Nat. Commun. 2020, 11, 1627. [Google Scholar] [CrossRef] [Green Version]
  47. Dvornikov, Y.A.; Leibman, M.O.; Khomutov, A.V.; Kizyakov, A.I.; Semenov, P.; Bussmann, I.; Babkin, E.M.; Heim, B.; Portnov, A.; Babkina, E.A.; et al. Gas-emission craters of the Yamal and Gydan peninsulas: Aproposed mechanism for lake genesis and development of permafrost landscapes. Permafr. Periglac. Process. 2019, 30, 146–162. [Google Scholar] [CrossRef] [Green Version]
  48. Heslop, J.K.; Anthony, K.W.; Winkel, M.; Sepulveda-Jauregui, A.; Martinez-Cruz, K.; Bondurant, A.; Grosse, G.; Liebner, S. A synthesis of methane dynamics in thermokarst lake environments. Earth Sci. Rev. 2020. [Google Scholar] [CrossRef]
  49. Khimenkov, A.N.; Sergeev, D.O.; Vlasov, A.N.; Volkov-Bogorodsky, D.B. Explosive processes in the area of permafrost distribution are a new type of permafrost hazard. Geoecol. Eng. Geol. Hydrogeol. Geocryol. 2019, 6, 30–41. [Google Scholar]
  50. Kizyakov, A.I.; Sonyushkin, A.V.; Leibman, M.O.; Zimin, M.V.; Khomutov, A.V. Geomorphological conditions for the formation of a gas outburst funnel and the dynamics of this form in Central Yamal. Cryosphere Earth 2015, 2, 15–25. (In Russian) [Google Scholar]
  51. Kizyakov, A.; Khomutov, A.; Zimin, M.; Khairullin, R.; Babkina, E.; Dvornikov, Y.; Leibman, M. Microrelief associated with gas emission craters: Remote-sensing and field-based study. Remote Sens. 2018, 10, 677. [Google Scholar] [CrossRef] [Green Version]
  52. Kizyakov, A.; Leibman, M.; Zimin, M.; Sonyushkin, A.; Dvornikov, Y.; Khomutov, A.; Dhont, D.; Cauquil, E.; Pushkarev, V.; Stanilovskaya, Y. Gas Emission Craters and Mound-Predecessors in the North of West Siberia, Similarities and Differences. Remote Sens. 2020, 12, 2182. [Google Scholar] [CrossRef]
  53. Kruglikov, N.M.; Kuzin, I.L. Outcrops of deep gas at the Urengoyskoye field. Structural geomorphology and neotectonics of Western Siberia in connection with oil and gas potential. Proc. Zapsibnigni 1973, 3, 96–106. (In Russian) [Google Scholar]
  54. Kuzin, I.L. On the priority in the study of surface gas shows in Western Siberia. Geol. Geophys. 1990, 3, 142–144. (In Russian) [Google Scholar]
  55. Kuzin, I.L. On the nature of anomalous lakes-indicators of hydrocarbon accumulations in deep horizons of the sedimentary cover. In Problems of Assessment of New Zones of Oil and Gas Accumulation in the Main Productive Strata of Western Siberia; VNIGRI: St. Petersburg, Russia, 1992; pp. 129–137. (In Russian) [Google Scholar]
  56. Kuzin, I.L. The scale of natural gas emissions in Western Siberia. Izv. Rgo 1999, 131, 24–35. (In Russian) [Google Scholar]
  57. Leibman, M.O.; Kizyakov, A.I.; Plekhanov, A.V.; Streletskaya, I.D. New permafrost feature-Deep crater in Central Yamal, West Siberia, Russia, as a response to local climate fluctuations. Geogr. Environ. Sustain. 2014, 7, 68–80. [Google Scholar] [CrossRef]
  58. Olenchenko, V.V.; Sinitsky, A.I.; Antonov, E.Y.; Eltsov, I.N.; Kushnarenko, O.N.; Plotnikov, A.E.; Potapov, V.V.; Epov, M.I. Results of geophysical studies of the territory of the geological formation Yamal crater. Cryosphere Earth 2015, 4, 94–106. (In Russian) [Google Scholar]
  59. Rivkin, F.M. Gas content in the upper horizons of frozen rocks. In Geocryological Conditions of the Kharasaveyskoye and Kruzenshternovskoye Gas Condensate Fields (Yamal Peninsula); VNIIgeosystem: Moscow, Russia, 2003; pp. 133–146. (In Russian) [Google Scholar]
  60. Savichev, A.; Leibman, M.; Kadnikov, V.; Kallistova, A.; Pimenov, N.; Ravin, N.; Dvornikov, Y.; Khomutov, A. Microbiological study of Yamal lakes: A key to understanding the evolution of gas emission craters. Geosciences 2018, 8, 478. [Google Scholar] [CrossRef] [Green Version]
  61. Semenov, P.; Portnov, A.; Krylov, A.; Egorov, A.; Vanshtein, B. Geochemical evidence for seabed fluid flow linked to the subsea permafrost outer border in the South Kara Sea. Geochemistry 2019, 80, 125509. [Google Scholar] [CrossRef]
  62. Shakhova, N.; Semiletov, I.; Salyuk, A.; Yusupov, V.; Kosmach, D.; Gustafsson, Ö. Extensive methane venting to the atmosphere from sediments of the East Siberian Arctic Shelf. Science 2010, 327, 1246–1250. [Google Scholar] [CrossRef]
  63. Sizov, O.S. Remote analysis of consequences of surface gas shows in the north of Western Siberia. Geomatika 2015, 1, 53–68. (In Russian) [Google Scholar]
  64. Streletskaya, I.D.; Leibman, M.O.; Kizyakov, A.I.; Oblogov, G.E.; Vasiliev, A.A.; Khomutov, A.V.; Dvornikov, Y.A. Ground ice and its role in the formation of gas-emission crater in the Yamal peninsula. Mosc. Univ. Bull. Ser. 5 Geogr. 2017, 2, 91–99. (In Russian) [Google Scholar]
  65. Walter, K.M.; Zimov, S.; Chanton, J.P.; Verbyla, D.; Chapin, F.S., III. Methane bubbling from Siberian thaw lakes as a positive feedback to climate warming. Nature 2006, 443, 71–75. [Google Scholar] [CrossRef]
  66. Walter, K.M.; Smith, L.C.; Chapin, F.S., III. Methane bubbling from northern lakes: Present and future contributions to the global methane budget. Phil. Trans. R. Soc. A 2007, 365, 1657–1676. [Google Scholar] [CrossRef] [PubMed]
  67. Greene, S.; Walter Anthony, K.M.; Archer, D.; Sepulveda-Jauregui, A.; Martinez-Cruz, K. Modeling the impediment of methane ebullition bubbles by seasonal lake ice. Biogeosciences 2014, 11, 6791–6811. [Google Scholar] [CrossRef] [Green Version]
  68. Yakushev, V.S.; Semenov, A.P.; Bogoyavlensky, V.I.; Medvedev, V.I.; Bogoyavlensky, I.V. Experimental modeling of methane release from intrapermafrost relic gas hydrates when sediment temperature change. Cold Reg. Sci. Technol. 2018. [Google Scholar] [CrossRef]
  69. Judd, A.; Hovland, M. Seabed Fluid Flow. In The Impact on Geology, Biology, and the Marine Environment; Cambridge University Press: Cambridge, UK, 2007; p. 475. [Google Scholar] [CrossRef]
  70. Bogoyavlensky, V.I.; Perekalin, S.O.; Boichuk, V.M.; Bogoyavlensky, I.V.; Kargina, T.N. Kumzhinskoye Gas Condensate Field Disaster: Reasons, results and ways of eliminating the consequences. Arct. Ecol. Econ. 2017, 25, 32–46. (In Russian) [Google Scholar]
  71. Bogoyavlensky, V.I. Innovative Technologies and Results of Studying Processes of Natural and Man-Made Degassing of the Earth in the Lithosphere-Cryosphere-Hydrosphere-Atmosphere System. In Proceedings of the Third International Conference on Geology of the Caspian Sea and Adjacent Areas, Baku, Azerbaijan, 16–18 October 2019; pp. 1–5. Available online: https://www.earthdoc.org/content/papers/10.3997/2214-4609.201952015 (accessed on 2 February 2020). [CrossRef]
  72. Mackay, J.R. Pingos of the Tuktoyaktuk Peninsula Area, Northwest Territories. Géogr. Phys. Quat. 1979, 33, 3–61. [Google Scholar] [CrossRef] [Green Version]
  73. Mackay, J.R. Pingo Growth and collapse, Tuktoyaktuk Peninsula Area, Western Arctic Coast, Canada: A long-term field study. Géographie Phys. Et Quat. 1998, 52, 271–323. [Google Scholar] [CrossRef] [Green Version]
  74. Mackay, J.R. Gas-domed mounds in permafrost, Kendall Island, N.W.T. Geogr. Bull. 1965, 7, 105–115. [Google Scholar]
  75. Yoshikawa, K. Notes on open-system Pingo Ice, Adventdalen, Spitsbergen. Permafr. Periglac. Process. 1993, 4, 327–334. [Google Scholar] [CrossRef]
  76. Chuvilin, E.; Sokolova, N.; Davletshina, D.; Bukhanov, B.; Stanilovskaya, J.; Badetz Ch Spasennykh, M. Conceptual models of gas accumulation in the shallow permafrost of Northern West Siberia and conditions for explosive gas emissions. Geosciences 2020, 10, 195. [Google Scholar] [CrossRef]
  77. Skorobogatov, V.A.; Stroganov, A.V.; Kopeev, V.D. Geological Structure and Oil and Gas Potential of Yamal; Nedra-Business Center: Moscow, Russia, 2003; p. 353. (In Russian) [Google Scholar]
  78. Bogoyavlensky, V.I.; Polyakova, I.D. Prospects for oil and gas content of great depths of the South Kara region. Arct. Ecol. Econ. 2012, 7, 92–103. (In Russian) [Google Scholar]
  79. Badu, Y.V.; Gafarova, N.A.; Podborny, E.E. (Eds.) Cryosphere of Oil and Gas Condensate Fields of the Yamal Peninsula. T. 2. Cryosphere of the Bovanenkovo Oil and Gas Condensate Field; OOO Gazprom Expo: Moscow, Russia, 2013; p. 424. (In Russian) [Google Scholar]
  80. Kondakov, V.V.; Yazinin, O.M.; Kusova, O.V.; Grachev, O.V.; Shidullin, R.M. Composition, structure and properties of rocks in deep horizons of permafrost in the southern part of the Bovanenkovo gas condensate field/Materials of Second conference of geocryologists of Russia. Mosc. State Univ. 2001, 3, 149–155. (In Russian) [Google Scholar]
  81. Chuvilin, E.M.; Perlova, E.V.; Baranov, Y.B.; Kondakov, V.V.; Osokin, A.B.; Yakushev, V.S. The structure and Properties of Rocks in the Permafrost Zone of the Southern Part of the Bovanenkovo Gas Condensate Field; GEOS: Moscow, Russia, 2007; p. 137. (In Russian) [Google Scholar]
  82. Skorobogatov, V.A.; Yakushev, V.S.; Chuvilin, E.M. Sources of natural gas within permafrost North-West Siberia. In Proceedings of the Seventh International Conference on Permafrost, Yellowknife, NT, Canada, 23–27 June 1998; pp. 1001–1007. [Google Scholar]
  83. ArcticDEM. Available online: https://www.pgc.umn.edu/data/arcticdem/ (accessed on 15 September 2019).
  84. Porter, C.; Morin, P.; Howat, I.; Noh, M.; Bates, B.; Peterman, K.; Keesey, S.; Schlenk, M.; Gardiner, J.; Tomko, K.; et al. ArcticDEM. Harv. Dataverse 2018, 1. [Google Scholar] [CrossRef]
  85. Bhardwaj, A.; Sam, L.; Martín-Torres, F.-J.; Kumar, R. UAVs as remote sensing platform in glaciology: Present applications and future prospects. Elsevier Remote Sens. Environ. 2016, 175, 196–204. [Google Scholar] [CrossRef]
  86. Gaffey, C.; Bhardwaj, A. Applications of unmanned aerial vehicles in cryosphere: Latest advances and prospects. Remote Sens. 2020, 12, 948. [Google Scholar] [CrossRef] [Green Version]
  87. Pix4Dmapper. Getting Started Manual; Pix4: Prilly, Switzerland, 2018; p. 25. [Google Scholar]
  88. Agisoft. Discover Intelligent Photogrammetry with Metashape. Available online: https://www.agisoft.com/ (accessed on 2 February 2020).
  89. Agisoft Metashape User Manual Professional Edition; Version 1.6; Agisoft LLC: Saint Petersburg, Russia, 2020; p. 172. Available online: www.agisoft.com/pdf/metashape-pro_1_6_en.pdf (accessed on 2 February 2020).
  90. Bogoyavlensky, I.V. Results of changes monitoring in the Tula karst sinkhole based on remote sensing from an unmanned aerial vehicle. Eage Geomodel. 2020, 2020, 1–5. [Google Scholar] [CrossRef]
  91. Complexes of Temperature Measurement KIT-1. Available online: https://all-pribors.ru/opisanie/72099-18-kit-1 (accessed on 2 February 2020). (In Russian).
  92. GOST 5180-2015. Soils. Laboratory Methods for Determination of Physical Characteristics; Standartinform: Moscow, Russia, 2019. (In Russian) [Google Scholar]
  93. GOST 12536-2014. Soils. Methods of Laboratory Granulometric (Grain-Size) and Microaggregate Content; Standartinform: Moscow, Russia, 2019. (In Russian) [Google Scholar]
  94. Trofimova, V.T.; Queen, V.A. (Eds.) Workshop on Soil Science; MSU: Moscow, Russia, 1993; p. 390. (In Russian) [Google Scholar]
  95. GOST 23740-2016. Soils. Methods of Laboratory Determination of Organic Composition; Standartinform: Moscow, Russia, 2019. (In Russian) [Google Scholar]
  96. Weather in Maresale: Weather Forecast, Weather Archive. Everything You Want to Know about the Weather in Maresale. Available online: http://meteocenter.net/23032_fact.htm (accessed on 2 February 2020). (In Russian).
Figure 1. The first photo of the C17 crater from the helicopter taken by Andrey Umnikov on 16 July 2020.
Geosciences 11 00071 g001
Figure 2. C17 crater (photo by Vasily Bogoyavlensky from the helicopter, 26 August 2020).
Geosciences 11 00071 g002
Figure 3. Panoramic photo of the C17 crater from its southern border (photo by Vasily Bogoyavlensky, 26 August 2020).
Geosciences 11 00071 g003
Figure 4. Features of the structure of the crater walls (photos by Vasily Bogoyavlensky (A,B), Roman Nikonov (C) and Evgeny Chuvilin (D), 26 August 2020).
Geosciences 11 00071 g004
Figure 5. Aerial photographs of the C17 crater from the height of 50 m above sea level (A), its northern (B) and southern (C) grottoes from inside the crater (photo from unmanned aerial vehicle (UAV) taken by certified external pilot Igor Bogoyavlensky, 26 August 2020).
Geosciences 11 00071 g005
Figure 6. Particle size distribution of investigated soils.
Geosciences 11 00071 g006
Figure 7. WorldView-2 satellite image of the perennial heaving mound on the site of the C17 object (ESRI) (A) and ArcticDEM on 21 July 2013 (B).
Geosciences 11 00071 g007
Figure 8. Images of the C17 object from Sentinel-2A (9 June and 6 July) and Sentinel-2B (15 May, 22 October) satellites in 2020.
Geosciences 11 00071 g008
Figure 9. Aerial image from the UAV (A), orthophotomap (B) and digital elevation model (DEM) in the area of the C17 crater (C) (photo by Igor Bogoyavlensky, 26 August 2020).
Geosciences 11 00071 g009
Figure 10. Yamal gas blowout crater C17: 3D model of the ground surface and underground cavity in two orthogonal directions (A,B) according to aerial photography from UAV (field data of 26 August 2020).
Geosciences 11 00071 g010
Table 1. Brief characteristics of the used remote sensing (RS) data from space.
SatelliteResolution, mSourceCountry
Landsat-815USGSUSA
Sentinel-210ESAEU
PlanetScope-Dove/Flock3PlanetUSA
WorldView-1, 2, 30.3–0.5TerraserverUSA-Canada
WorldView-1, 2, 3 2NGA-NCF
(ArcticDEM)
USA
Resurs-P No.10.5–0.6SC “Roskosmos”Russia
Table 2. Selected characteristics of soil ejected during the crater formation.
Sample NumberDistance to the Crater, mDensity of Soil
Particles, g/cm3
Plasticity Index, %Salinity, %Total Organic Content, %
1152.6515.00.284.0
2302.6817.70.285.4
31502.7418.70.685.2
Publisher’s Note: MDPI stays neutral with regard to jurisdictional claims in published maps and institutional affiliations.

