Article

Flume Experiments on Flow Analysis and Energy Reduction through a Compound Tsunami Mitigation System with a Seaward Embankment and Landward Vegetation over a Mound

by
Md Abedur Rahman
1,
Norio Tanaka
1,2,* and
A. H. M. Rashedunnabi
1
1
Graduate School of Science and Engineering, Saitama University, Saitama 338-8570, Japan
2
International Institute for Resilient Society, Saitama University, Saitama 338-8570, Japan
*
Author to whom correspondence should be addressed.
Submission received: 7 December 2020 / Revised: 7 February 2021 / Accepted: 12 February 2021 / Published: 15 February 2021
(This article belongs to the Special Issue Tsunami Science and Future Mitigation Strategies)

Abstract

:
As a countermeasure against tsunami inundation, the present study conducted a series of laboratory experiments using a compound mitigation system in which a seaward embankment (E) followed by landward coastal vegetation (V) over a mound (M) (EMV) was investigated in supercritical flow conditions. The changes of flow around the mitigation system and energy reduction were clarified under varying conditions of mound height and vegetation density. Cases of an embankment followed by only a mound (EMNV) were also considered for comparison. Experimental results showed that three basic types of flow structures were observed within the mitigation system in EMV cases. A water cushion was created within the mitigation system mainly due to the combined effects of the mound and vegetation. It significantly reduced the maximum total energy in EMV cases by approximately 41–66%, whereas in EMNV cases, the maximum energy reduction was found to be 23–65%. Increments in both mound height and vegetation density increased the intensity of the water cushion within the mitigation system by offering more drag and reflecting the flow, and hence, significantly reduced the energy of the flow.

Graphical Abstract

1. Introduction

The 2011 Great East Japan Tsunami (GEJT) significantly exceeded the disaster prevention capability of the present single coastal embankment system and resulted in loss of human lives, and extensive damage to the buildings and coastal forests in the Tohoku and Kanto regions of Japan [1,2]. After this disastrous event, the Ministry of Land, Infrastructure, Transport and Tourism (MLIT) of Japan divided tsunamis into two groups, with level 1 (level of disaster prevention) having a recurrence interval less than hundred years, and level 2 (level of disaster mitigation) having a recurrence interval several hundred to a thousand years [3]. Because natural disasters cannot be predicted, development of mitigation systems to protect the coastline against both the level 1 and level 2 tsunamis is crucial.
After the GEJT in 2011, the mitigation strategy shifted from a single defense system to a compound and/or hybrid mitigation system comprising both artificial and natural measures. Many researchers have introduced different configurations and numerical approaches into physical investigations, such as a combination of a coastal forest and moat [4], double embankment system [5], combination of embankment, moat, and forest [6,7] mangrove forest [8], canal and dune [9], a moat and/or canal behind embankment [10,11,12], multi-defense line strategy [13], and a vertically double layer of vegetation behind a sea embankment [14]. In recent times, more attention has been paid to mitigation systems comprising both natural and artificial measures to resist an extreme tsunami event. When the overtopping flow depth is large, a second embankment constructed of soil will be washed out by the flow directly hitting the ground. In addition, only a coastal forest defense system, and/or a moat combined with a forest defense strategy is not significant enough to mitigate the level 2 tsunami. It is also challenging to implement a mitigation system that comprises a sea embankment, moat, and forest, and multi-defense line system, because such a system requires much space along the coast and has a very high construction cost. In addition, it might be difficult to construct a vertically double layer of vegetation behind a sea embankment because it involves complex forest management, requires a large space, and moreover, short trees do not grow well within a tall vegetation layer, whereas tall trees need enough space to grow. Thus, the literature reveals the necessity of development of a system with a different mitigation capability.
Recently, coastal vegetation has gained more visibility in tsunami mitigation research [15,16]. Due to its wide range of functions, such as reducing the destructive fluid force, entrapment of debris, and providing soft landing places, [17], coastal vegetation is being considered a natural component of mitigation techniques that is not only economically feasible, but also environmentally friendly [18,19]. Many experimental and numerical studies have shown the effectiveness of a coastal forest (including mangrove forest) in tsunami mitigations [2,7,8,15,20]. Despite that, constructing only a coastal forest along the coast would not be sufficient in case of a large tsunami event, because the direct impact of the approaching tsunami flows causes many of the trees to be washed out and produces numerous debris [21]. Pasha and Tanaka [22] reported that a band of densely distributed emergent vegetation provides the maximum energy reduction of the tsunami flow, but it is very difficult to implement a dense coastal forest. An experimental investigation by Anjum and Tanaka [23] clarified the effectiveness of patch-type vertically double-layered vegetation, but, in that case, a large space is required, and space is limited along the shoreline in many areas. Coastal vegetation effectively reduced the energy of an overtopping tsunami flow by posing resistance to the flow when it was implemented behind a seaward embankment [14]. Thus, the resistance imposed by the vegetation changed the flow within the gap region from supercritical to subcritical by forming a hydraulic jump that consequently decreased the tsunami energy. These phenomena can effectively produce a water cushion that is believed to reduce the erosion starting at the embankment toe by preventing the overtopping flow from directly hitting the ground. A recent study by Rashedunnabi and Tanaka [14] clarified that dense vertically double-layered vegetation can effectively produce a submerged hydraulic jump and contribute a significant energy reduction in the downstream region. They also reported that, when the hydraulic jump starts on the downface slope of the embankment, it will be safer for both mitigation structures because it can reduce erosion within the mitigation system. Therefore, in the present study, a mound was introduced with the intention of planting coastal vegetation and creating a hydraulic jump by positioning the hydraulic jump toe on the downward slope of the embankment to reduce the erosion.
When water flows through vegetation, the fluid force becomes lower, which consequently reduces damage just downstream of the vegetation region [8,15,22,24]. An experimental and analytical investigation by Iimura and Tanaka [24] clarified the effects of the density of coastal vegetation and confirmed that both the water level and velocity of the water flowing downstream of the vegetation are decreased considerably by increasing the vegetation density. The same phenomena were observed by Pasha and Tanaka [22]. When the width of the coastal vegetation increases, it can reduce both the hydrodynamic force and the inundation depth downstream of the vegetation [22,25]. A few studies have clarified the effect of vegetation density and its relation to energy reduction [22,24,26], but the effect of vegetation density within a hybrid and/or compound mitigation system is unknown. Hence, in the present study, a series of model scale experiments was conducted to introduce a compound mitigation system comprising a seaward embankment model (E) followed by landward coastal vegetation model (V) over a mound model (M) (EMV) under varying conditions of different mound heights. To differentiate the role of vegetation on the mound, cases of a seaward embankment, followed by mound only models (EMNV) were also considered. Therefore, the objectives of this study were:
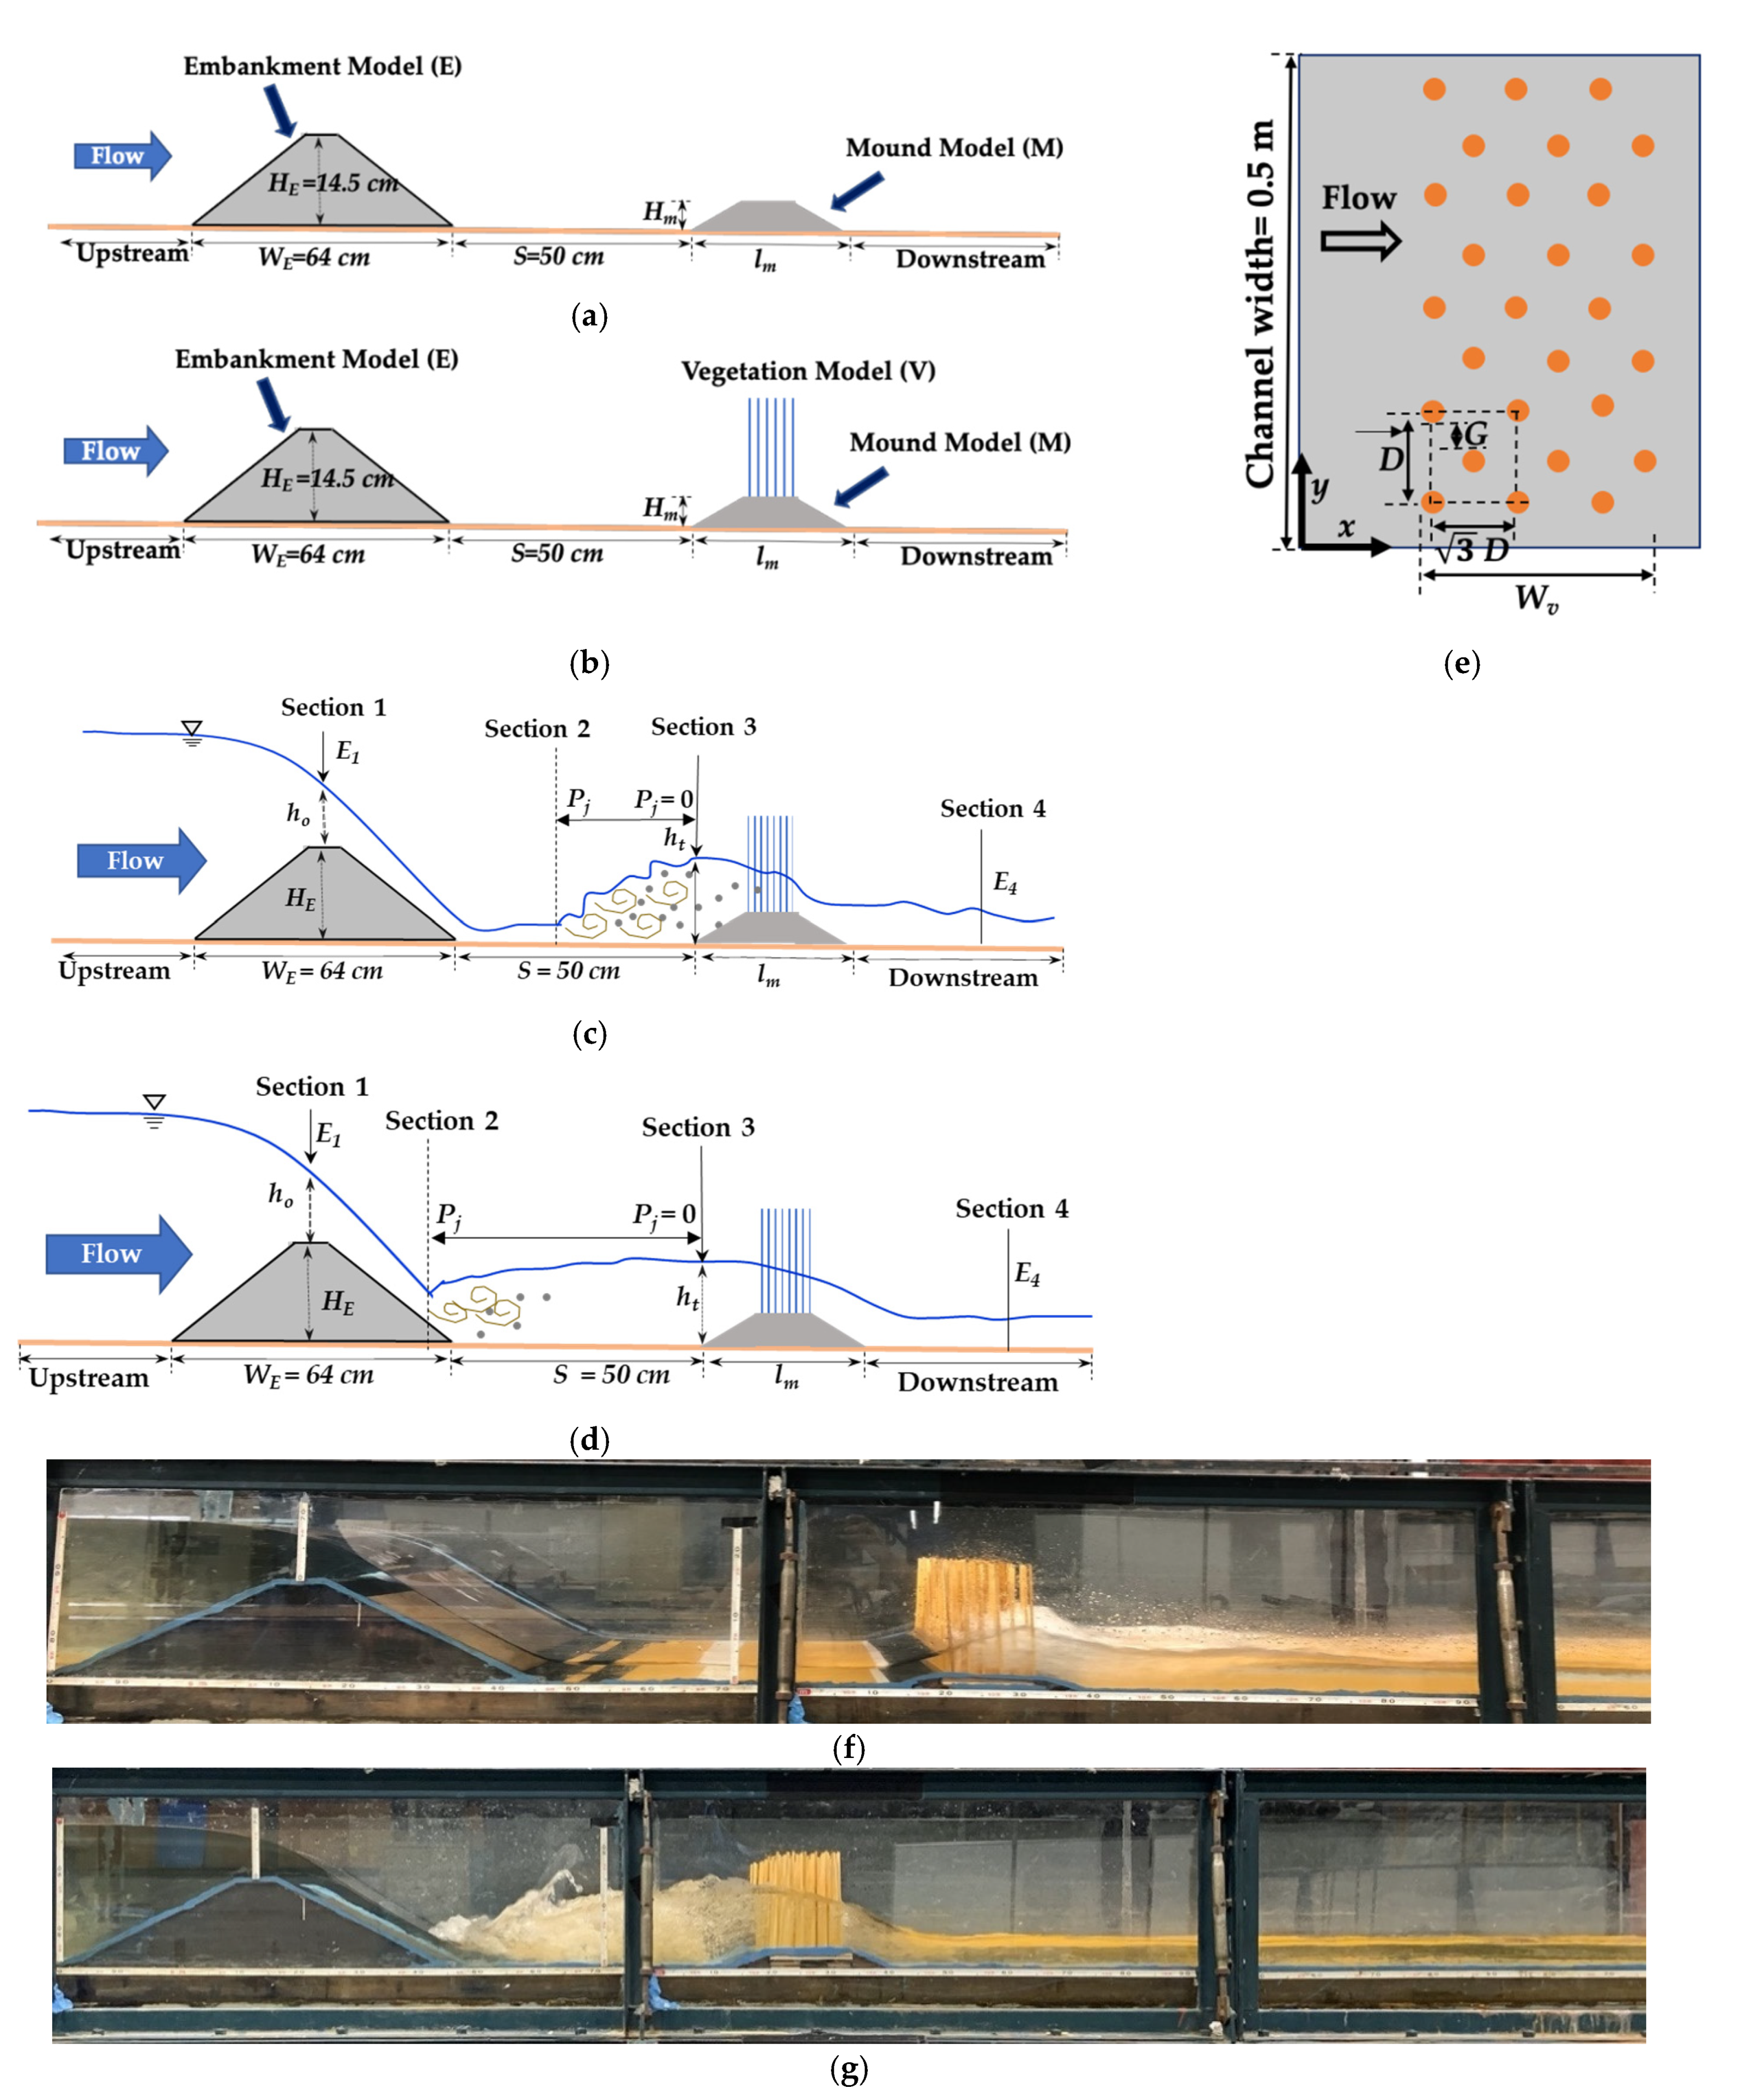
  • To investigate flow variations around the compound mitigation system.
  • To create a water cushion by positioning the start of a hydraulic jump on the embankment slope.
  • To clarify the effects of different densities of single-layer emergent vegetation models over a mound on the formation of a water cushion.
  • To quantify the energy reduction due to the combined effect of vegetation over a mound.
In the materials and methods section, the experimental setup, flow conditions, design and configurations of experimental models, and evaluation techniques are presented. In the results section, fundamental flow structures, i.e., position of the hydraulic jump, variations of tail water depth with Froude numbers, and water surface slope are discussed. In the discussion section, changes in the flow structures related to the water cushion effect and energy reduction are discussed. Finally, the conclusions are presented.

2. Materials and Methods

2.1. Experimental Procedure and Flow Conditions

This study used a glass-sided open flume channel 14 m long × 0.5 m wide × 0.4 m deep at Saitama University, Japan, to perform a series of model scale experiments. The experimental set-up is shown in Figure 1a,b. The steady state is the simplification of a major portion of the inundation event. A very large tsunami usually flows inland with a long period; thus, the tsunami flow can be modeled under the steady-state flow conditions [5,14]. In addition, the tsunami inundation can be produced by pump-driven flow [27]. Thus, for a better understanding and appropriate scaling of the approaching tsunami current, the steady flow was generated by a circulating pump discharge in the present experiment. The discharge of the pump was controlled by a personal computer (PC), which was directly connected to the pump. To represent the actual tsunami flow conditions, a constant bed slope of 1/200 was selected. In the GEJT, the tsunami flow was supercritical in the coastal regions, i.e., Froude numbers were more than 1.0 (Fr = U/(gh)0.5, where U is the depth-averaged velocity (m/s), g is the gravitational acceleration (m/s2), and h is the water depth (m). In the Sendai Plain and on the northwest coast of Iwate prefecture, the Froude number was observed to range from 1.0 to 1.5 [28,29]. Thus, taking those areas as a reference, to simulate the realistic inundating tsunami current in the coasts, the initial Froude numbers were achieved in an empty channel and Froude similarity was applied in each flow conditions. A downward slope was used to create a supercritical flow in this study. Sometimes in sand dunes, an embankment was constructed where the slope of the land is downward [14]. Thus, to simulate supercritical and steady state flow conditions, this study considered six initial water depths having initial Froude numbers of approximately 1.02, 1.29, 1.39, 1.44, 1.52, and 1.56, respectively. To compute the depth-averaged velocity (U (m/s)), a continuity equation, U = Q/(hb) (where Q is the discharge (m3/s), and b is the flume width), was used.
In each flow condition, the water depth was measured along the center of the flume with the help of a rail-mounted point gauge based on variations of the water levels with an interval of 2–10 cm. Because the flow within the hydraulic jump is very complex due to water surface fluctuations, both the maximum and minimum depths were measured at a fixed point and subsequently averaged.

2.2. Model Design and Vegetation Conditions

This study was based on model scale experiments, and a physical model scale of 1/100 was selected for the experimental models. Important parameters, such as embankment height, embankment width, tree trunk height, tree trunk diameter at breast height, mound height, mound width, and water depth were scaled down accordingly to represent the actual case.
Following the GEJT in 2011, the Japanese government planned to increase the height of the embankments on the coastline of Fukushima, Miyagi, and Iwate prefectures to around 7.25–14.7 m [13,14] by raising and/or reconstructing them to mitigate a level 2 tsunami. Thus, the embankment height was scaled down to 14.5 cm with a side slope of 1:2 and modeled in wood. The mound was also modeled in wood, and the side slope was maintained at 1:2, same as the embankment. In this paper, three mound heights (1.8 cm, 2.7 cm, and 3.6 cm), and their corresponding mound lengths against each mound heights 15.6 cm, 22.4 cm, 58.9 cm, 19.2 cm, 25.9 cm, 62.5 cm, 22.8 cm, 29.5 cm, and 67.5 cm, respectively, were selected and are represented as a non-dimensional parameter. The mound lengths varied accordingly with variations in the width of the vegetation (Wv) (5.41 cm, 12.18 cm, and 48.75 cm) and the mound heights. The specifications of the M in both EMV and EMNV cases are presented in Table 1.
To model the vegetation as a replica, the Japanese pine tree found on the Sendai Plain [2] (having an average height of 15 m and diameter at breast height of 0.4 m) was taken as a reference. Hence, each tree was modeled with a circular wooden cylinder having a diameter (d) of 0.4 cm and was placed in a staggered arrangement on a wooden plate. For simplicity, the height of the vegetation was selected as 18 cm considering a 1/100 model scale. In this study, the vegetation thickness was represented as dn values and kept at 90 No. of trees, to represent the real scenario for all three vegetation models (V). The value of dn was estimated as [17]:
d n = 2 3 D 2 W v d
where 2 3 D 2 is the number of cylinders per unit width (density of the cylinder) in which 2 is the cylinder numbers within a rectangular area under the staggered arrangement, and D is the center-to-center distance (D) between trees, respectively (Figure 1e).
Pasha et al. [30] conducted a field investigation after the 2011 GEJT to define the vegetation characteristics of the existing coastal forest and estimate the damages in Ishinomaki City, Sendai City, Iwanuma City, Watari Town, Yamamoto Town, and Souma City of Japan. Focusing on that field investigation they defined, three densities of the coastal forest namely dense, intermediate, and sparse forest with a specific G/d ratio. Since this study focused on the effects of vegetation density, the value G/d (G is the clear space between each cylinder in a cross-stream direction) was adopted to represent the vegetation density. Three vegetation models were considered in this study by varying G/d values and porosity. The vegetation models having G/d values of 1.088, 2.125, and 5.25 represent intermediate, sparse, and sparser coastal forest densities, respectively, which were individually considered as a single-layered emergent forest. The details of configurations of V are shown in Table 1. The porosity (Pr) of the vegetation model [24] is defined as:
P r = 1 n t π d 2 4
where nt is the vegetation density.
Due to the direct hitting, increased energy head, and momentum of the overtopping tsunami flow, Matsuba et al. [21] reported that the trees near to the toe and leeward of the embankment were washed out in the GEJT, and hence, produced much floating debris. In addition, severe erosion occurred behind the embankments due to overtopping tsunami, and the scoured length varied from 4 to 31.78 m [21]. Moreover, to reduce the impact of the turbulent flow (by the formed hydraulic jump) to the downstream structure, a sufficient space is required. For these reasons, the gap (S) between the embankment toe and the mound was kept at 0.5 m in this study. The schematic of the experimental setup is shown in Figure 1.

2.3. Non-Dimensional Parameters Used in This Study

In this paper, five non-dimensional parameters were defined based on both the hydraulic and physical experimental models. Non-dimensional overtopping depth was defined as ho = ho/HE, where ho is the overflowing water depth, and HE is the embankment height. The six ho values selected were 0.07, 0.16, 0.26, 0.34, 0.44, and 0.48. The non-dimensional position of the jump was defined as Pj= Pj/S, where Pj is the position of the hydraulic jump toe within the mitigation system, and S is the space between the embankment toe and the starting point of the mound. The hydraulic jump was formed due to the combined effect of mound and vegetation model. Thus, to locate the jump toe (Pj), the Pj (position of the jump) was defined by a distance in between the upstream toe of the mound and the starting point of hydraulic jump (as shown in Figure 1c,d). The non-dimensional tailwater depth was defined as ht = ht/HE, where ht is the tailwater depth. Non-dimensional mound heights were defined as Hm = Hm/HE, where Hm is the mound height. The three Hm values were set at 0.124, 0.186, and 0.248, respectively. Non-dimensional mound lengths were defined as lm = lm/HE, where lm is the mound length. The details of lm for each case are shown in Table 1.

2.4. Methods for Evaluating the Loss of Tsunami Energy

The loss of flow energy through the experimental models is the difference between the specific energy of two sections, i.e., at the top of the embankment and downstream of the vegetation model (averaged water depth starting from the end of the mound to 1.5 m downstream) (Figure 1c,d). Taking the channel bed as a reference for the energy head, the total energy reduction was calculated according to Chow [31], and is given as:
E = h + α V 2 2 g
Δ E   % = E 1   E 4   E 1 × 100
where E is the specific energy, ΔE is the total energy reduction at the downstream of the compound mitigation system, E1 is the specific energy at Section 1, E4 is the specific energy at Section 4 (as shown in Figure 1c,d), h is the water depth, and α is the coefficient of energy (taken as 1).

3. Results

3.1. Changes of Flow Variations within Hybrid Mitigation System

In this study, three basic flow types were observed within the mitigation system, i.e., in the gap region between the embankment, and the mound model in which both type-A and type-B were the same as described in Rashedunnabi and Tanaka [14] and were defined based on the location of the hydraulic jump toe. When a hydraulic jump was formed within the mitigation system, (i.e., the hydraulic jump toe lay in the gap region) it was classified as a type-A jump [32,33,34]. When a submerged hydraulic jump was formed on the downward slope of the embankment, (i.e., the starting point of the jump lay on the downward slope of the embankment) it was classified as a type-B hydraulic jump [32,33,34]. When no hydraulic jump was formed and the flow passed smoothly, this phenomenon was classified as no jump. For a better understanding, a brief illustration of the classification of flow types is presented in Figure 1c,d.

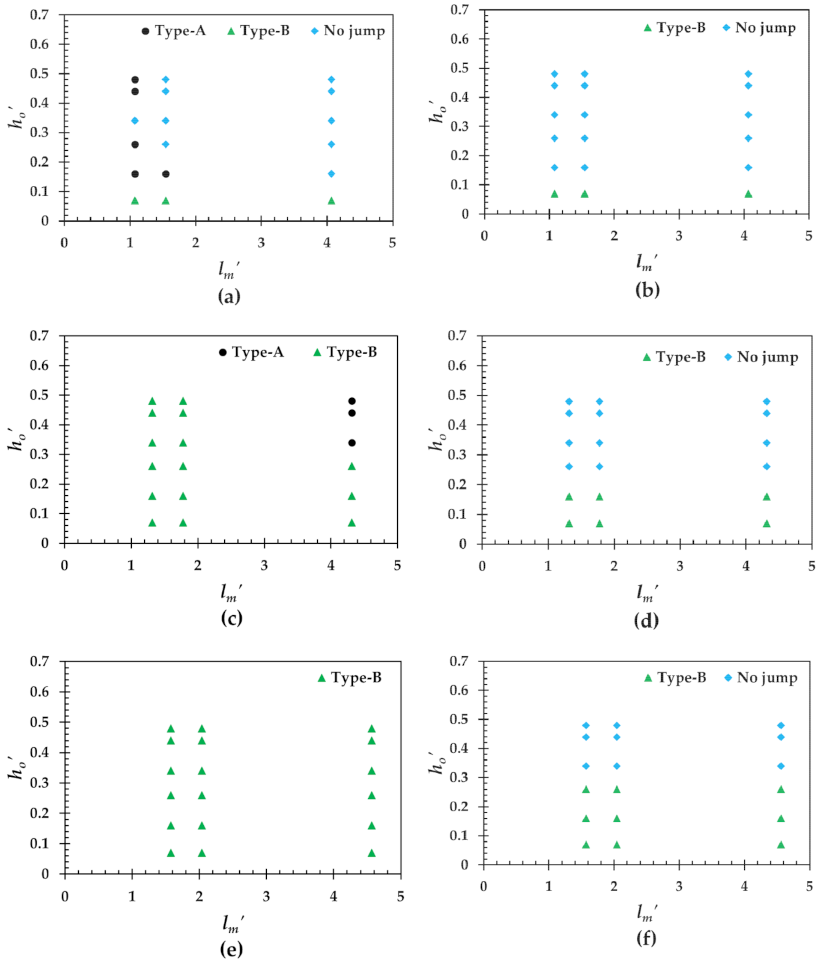
3.1.1. Effect of a Mound on Hydraulic Jump Formation

In the single embankment system (Case 1), the overtopping flow varied gradually on the downward slope of E and remained straight in the downstream regions (Figure 2a). On the contrary, when a mound model was installed behind an embankment model, a submerged hydraulic jump was formed, and the starting position of the hydraulic jump lay on the slope of the E, precisely a type-B (Figure 3b) for the lowest ho(= 0.07), at Hm = 0.124 in Cases 2 to 4. After that, the flow swept out, and no hydraulic jump was formed (Figure 3b) for the remaining five ho. With further increase of Hm, the lower ho experienced a type-B submerged hydraulic jump (Figure 3d, 3f). Hence, a type-B submerged hydraulic jump was formed for the lower three ho (= 0.07, 0.16, and 0.26) and after that, the flow was swept out in Cases 8 to 10, when the mound height was highest (Hm = 0.248) (Figure 3f). Nevertheless, no significant change in the flow type was observed with the change of mound length in all EMNV cases considered (i.e., Cases 2 to 10), at each mound height. The phenomena of formation of a type-B submerged hydraulic jump for the low overtopping flow depths and the sweeping out of the flow for the high overtopping flow depths within the gap region was occurred mainly due to the resistance offered by the mound. Moreover, the lowest overtopping flow depth experienced a type-B hydraulic jump with the increasing of the Hm and then the flow was swept out for the higher ho because the resistance posed by Hm was not significant enough to the overtopping flow depths to form a hydraulic jump.

3.1.2. Effect of Vegetation over Mound on Hydraulic Jump Formation

After the installation of the vegetation models of different configurations over the mound model, a significant variation in the flow structures was observed, and the resulting representative flow structures are shown in Figure 2b–j. In EMV cases (embankment followed by vegetation over the mound), all three basic flow types were developed when the mound height was lowest (Figure 2b–d and Figure 3a). The flow was transformed from type-B > type-A > no-jump with increasing ho at the lowest Hm (= 0.124), in Case 2v to Case 4v (Figure 2b–d and Figure 3a). In Case 2v for ho = 0.34, the flow swept out, but further increasing ho again caused a type-A hydraulic jump because the velocity of ho was much higher than the drag force offered by the intermediate vegetation (G/d = 1.088, Pr = 91%) (Figure 2b and Figure 3a). However, when ho was increased (ho = 0.44), the drag force was increased by the frictional force due to the higher velocity of the increased flow rate caused by the closer spacing of the cylinders (Figure 2b, and Figure 3a), which caused the type-A hydraulic jump to reappear. Consequently, the drag force for the highest ho was increased, and the starting position of the hydraulic jump was shifted towards the embankment toe (Figure 2b). With the increment of Hm, while keeping the vegetation conditions same, transformed the flow from no-jump > type-A > type-B hydraulic jump, and formed a water cushion formed in all of the vegetation configurations. For the highest Hm’, (Hm = 0.248), all of the flow was transformed to a type-B hydraulic jump in Cases 8v to Case 10v for all overtopping depths considered (Figure 2e,f and Figure 3e). The effect of vegetation density on the formation of the hydraulic jump was clearly observed in Case 2v to Case 7v. However, at the highest mound height, the effect of vegetation density was not clearly observed because this is mainly the effect of the mound.

3.2. Properties of the Flow

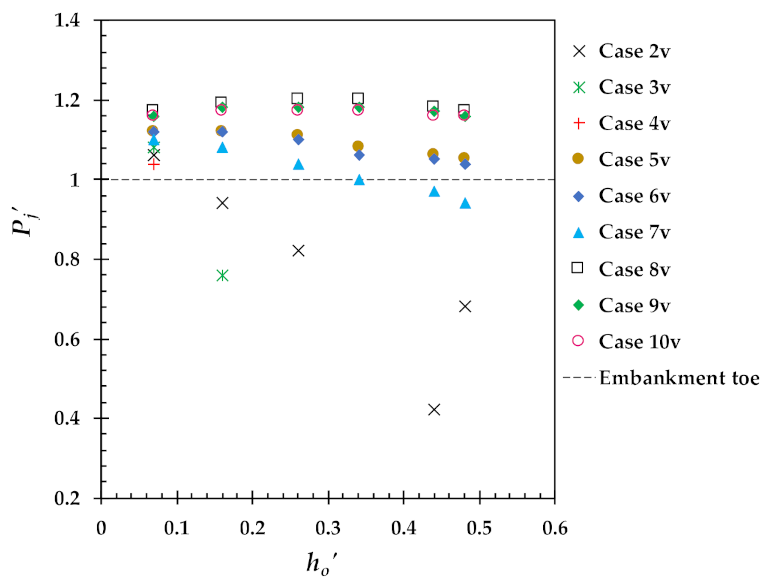
3.2.1. Combined Effect of Vegetation Density and Mound Height on the Position of the Hydraulic Jump

The non-dimensional position of the formed hydraulic jump (Pj) within the mitigation system in EMNV cases is shown in Figure 4. In this paper, three values of Pj were defined based on the position of the hydraulic jump. Pj > 1 represents that the position of the hydraulic jump is lying on the downward slope of the embankment, Pj = 1 represents that the position of the jump is on the embankment toe, and Pj < 1 represents the starting position of the hydraulic jump lying in the gap region. Pj was not calculated when no hydraulic jump was formed in the gap region (S). When a type-A hydraulic jump was formed, Pj was observed to be less than 1, and the lowest value of Pj was found to be approximately Pj = 0.42 in Case 2v for the ho = 0.44 (Figure 4), which means the Pj was much closer to the downstream structure. When the mound height was increased, a significant shift of Pj from the gap region towards the embankment top (opposite to the flow direction) was observed in Case 5v to Case 10v, and the maximum shift of Pj was observed in Case 8v to Case 10v at the highest mound height (Figure 4). The shift of Pj toward the embankment top created a water cushion with greater intensity in which both the effects of mound height and vegetation density can be clearly noticed. In addition, the role of the intermediate vegetation configuration (G/d = 1.088, Pr = 91%) played a more significant role in shifting the Pj due to increased density. Due to the increased density of intermediate vegetation, the resistance, and the drag force was increased because of the frictional forces with the neighboring cylinders and caused a further shifting of Pj.

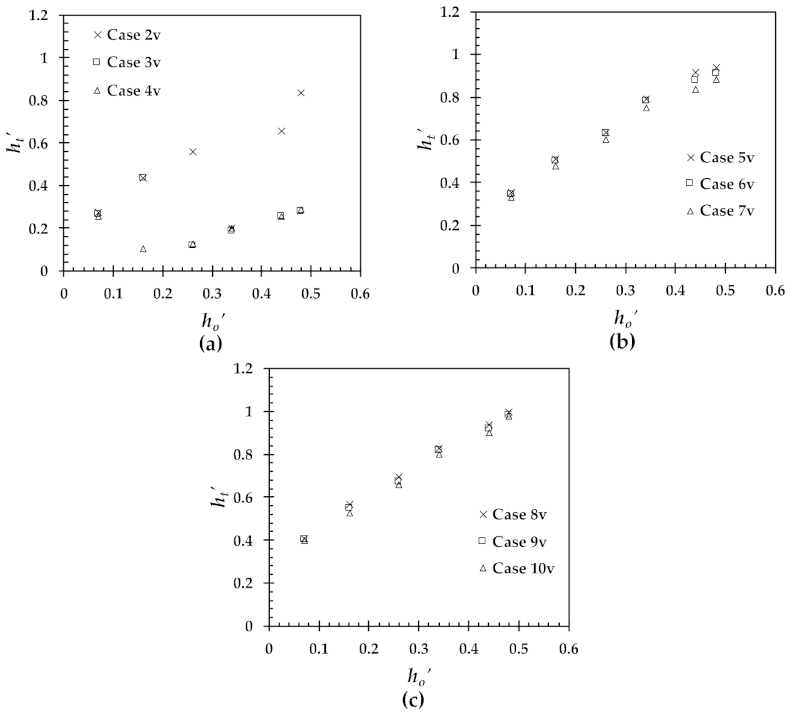
3.2.2. Combined Effect of Vegetation Density and Mound Height on Tailwater Depth

Figure 5 illustrates the resulting tailwater depth in EMV cases under varying conditions of different ho. The tailwater depth was found to be the lowest when no hydraulic jump was formed within the mitigation system, and a gradually increasing trend in ht was observed with the increasing of the overtopping depth in Case 3v and Case 4v (when Hm was the lowest) (Figure 5a). A significant increment in ht was observed when different types of hydraulic jumps were formed. The maximum ht was found in Case 8v to Case 10v when the mound height was maximum (Hm = 0.248) (Figure 5c). The increased ht was mainly the effect of Hm. A further increment in ht was found for the intermediate vegetation configuration (G/d = 1.088, Pr = 91%) compared with the other vegetation cases in every Hm due to increased resistance offered by the vegetation represented as closer spacing of the cylinders.

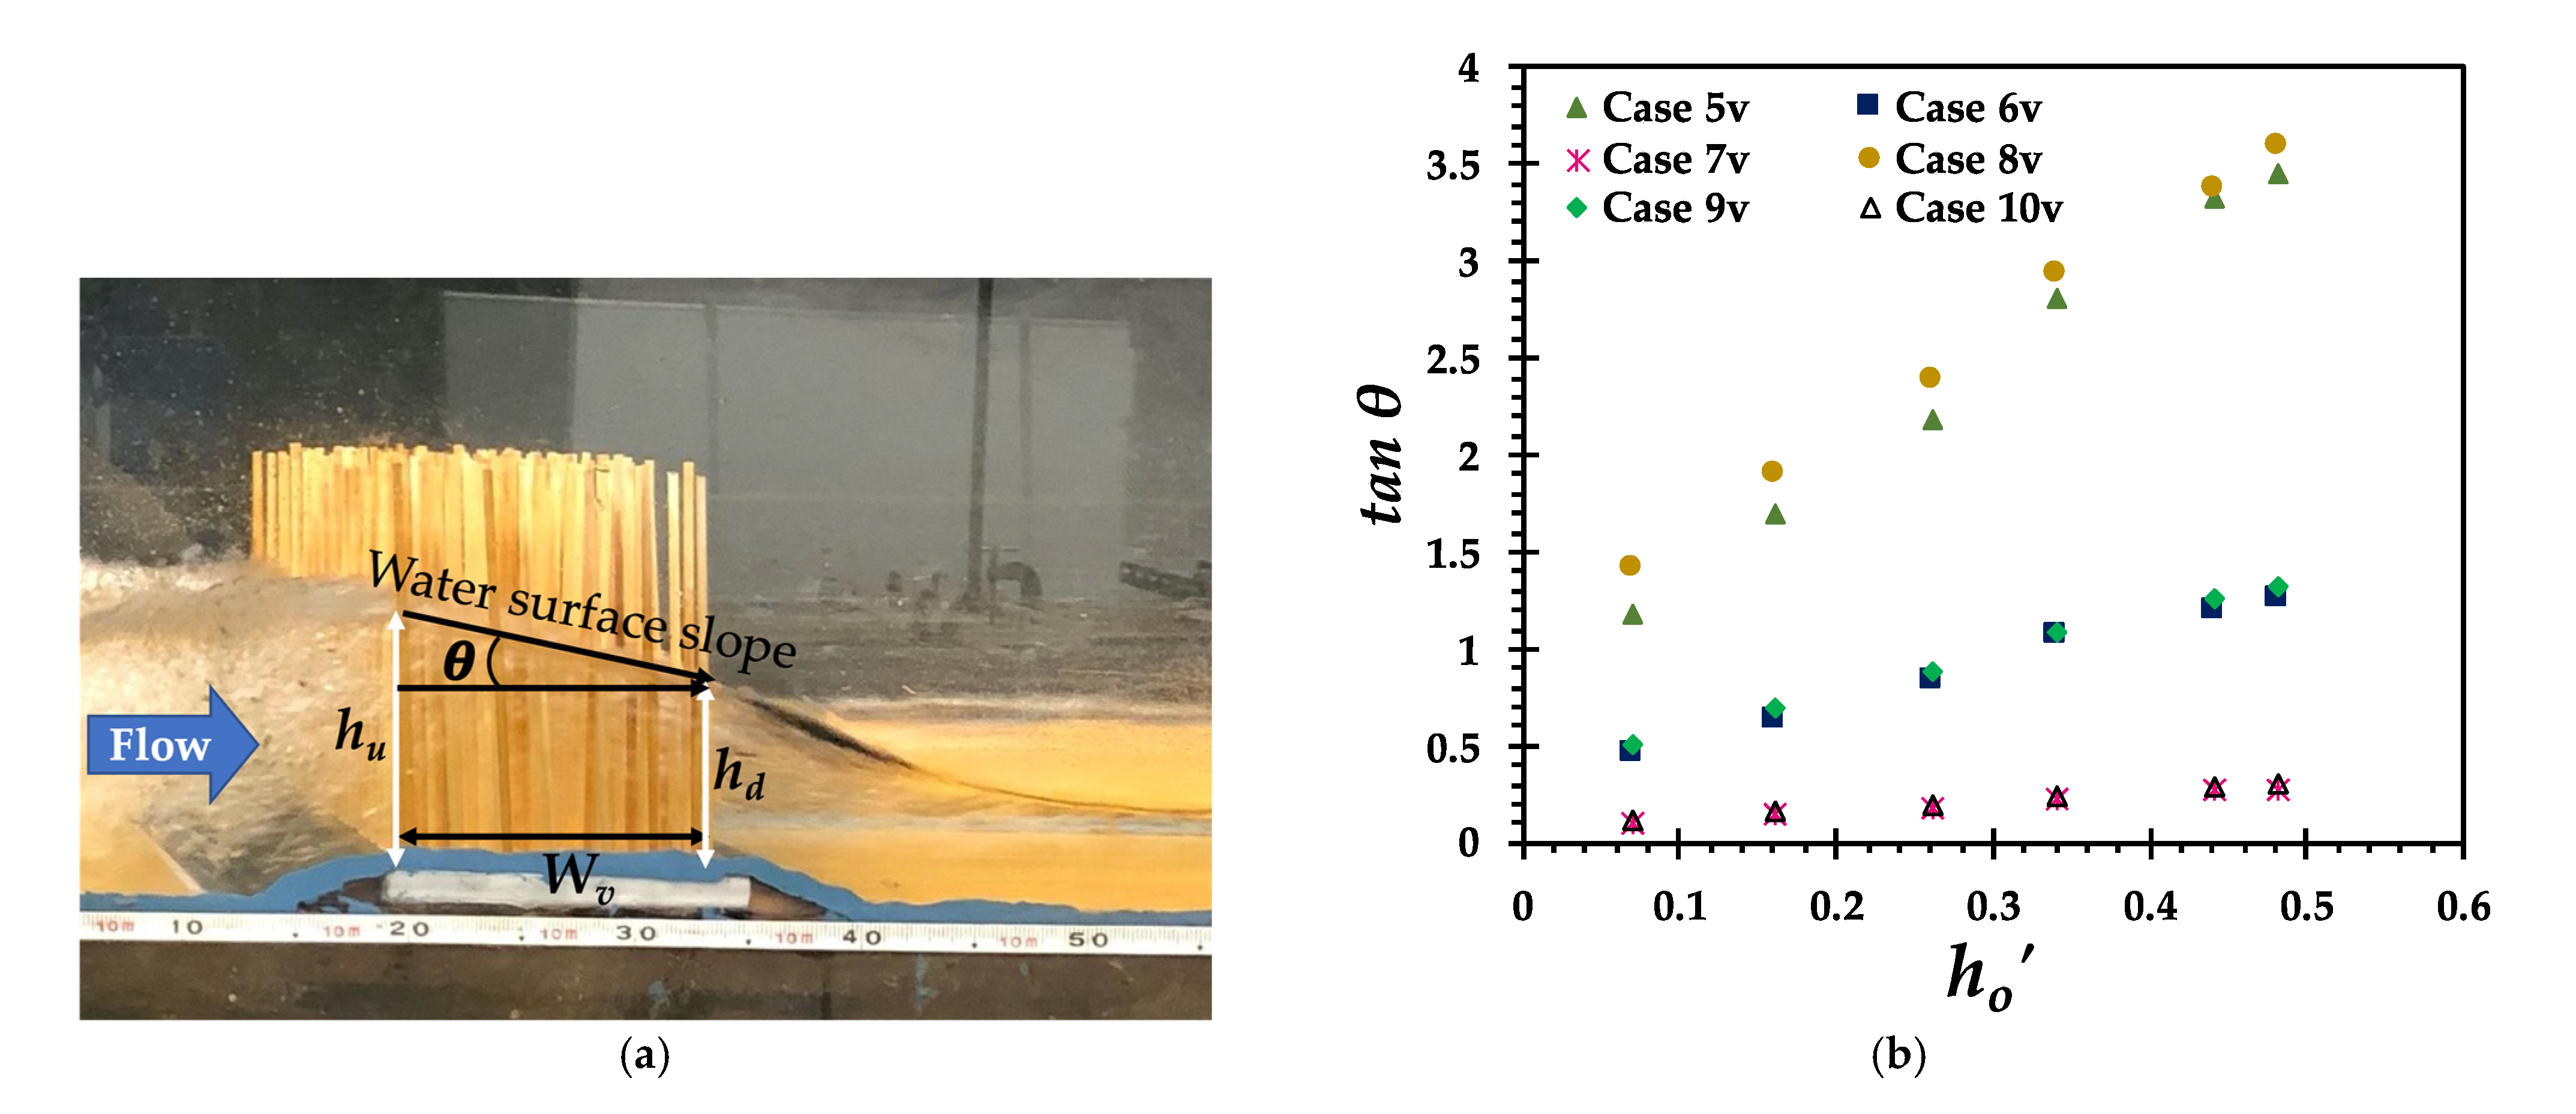
3.2.3. Water Surface Slope within the Vegetation Model

Due to the combined effects of M and V, the water depth in front of the vegetation, i.e., the tailwater depth, was increased, whereas the water depth was decreased in the downstream of the mound. These phenomena caused a water surface slope within the V, and investigation of this water surface slope is necessary to clarify flow structures downstream of the V. The water surface slope (tan θ) within the V is represented and clarified in Figure 6a,b. Due to very complex flow structures in Case 2v to Case 4v (Figure 2b–d) when the Hm was lowest (Hm = 0.124), the water surface slope was not calculated. A sharply increasing trend in the water surface slope was observed in the cases having intermediate vegetation (G/d = 1.088, Pr = 91%), whereas a gradually increasing trend in sparse vegetation (G/d = 2.125, Pr = 98%) cases and a slightly increasing trend in water surface slope in sparser vegetation (G/d = 5.25, Pr = 99%) cases was observed against varying conditions of ho. The steepest slope in the water surface was observed in intermediate vegetation cases, (i.e., Case 5v and Case 8v), whereas the slope of the water surface became mild in sparser vegetation (G/d = 5.25, Pr = 99%) (i.e., Case 7v and Case 10v) (Figure 6b). These results are consistent with previous research (e.g., Rashedunnabi and Tanaka; Pasha and Tanaka) [14,22]. The steepness of water surface slopes is mainly due to Wv, and the increased ht is due to the increment of the density of each V. However, the increment of Hm makes the water surface slopes steeper in all cases considered. The increment in vegetation density and the steeper water slope caused air bubble entrainment within the V, which can play a significant role in energy dissipation (Figure 1f,g) [23,35]. However, due to limitations of the experimental facility, the air bubble entrainment was not quantified, hence, not discussed here.

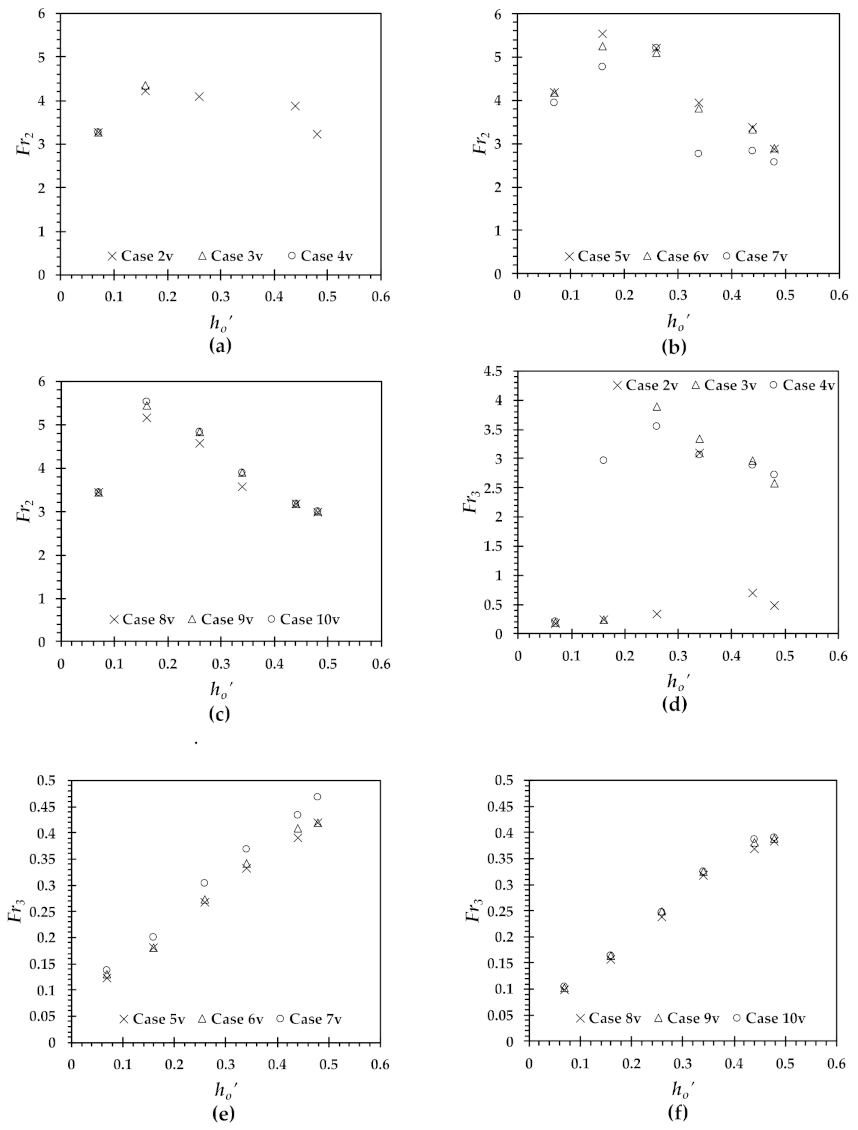
3.2.4. Froude Numbers Resulting from the Combined Effect of Vegetation Density and Mound Height

The variation of the resulting Froude numbers within the mitigation system in two different sections, such as, at the start of the hydraulic jump at Section 2 (Fr2, approach Froude number at Section 2), and before the vegetation (Fr3 at Section 3) against different non-dimensional overtopping flow depth, ho, is shown in Figure 7. Section 2 is the exact location of the hydraulic jump toe (as shown in Figure 1c,d). Since the jump toe moves continuously both in the back-and-forth direction (up to 2 cm), several readings were taken, considering the maximum shifting of the jump toe and consequently averaged. Fr2 was not calculated when no hydraulic jump was formed in the gap region. In all of the cases considered, Fr2 followed an increasing trend when ho is increased to 0.16, then a gradually decreasing trend of Fr2 was observed with the further increase of the ho (Figure 7a–c). The maximum peak value of Fr2 was observed for ho = 0.16, in all cases considered.
In front of the vegetation (at Section 3), the flow became subcritical, and Fr3 varied due to the formation of a hydraulic jump (a water cushion). In some cases, the flow became supercritical when no hydraulic jump was formed in almost all ho in Case 3v, Case 4v, and Case 2v when ho = 0.34 at lowest Hm (Hm = 0.124). This situation may be dangerous, and the vegetation might be washed out because the overtopping flow directly hits the vegetation (Figure 1f and Figure 2b–d). With increasing Hm, all flow became subcritical at Section 3, and a sharply increasing trend of Fr3 was observed in Case 5v to Case 10v (Figure 7e,f). This phenomenon ensures the safety for both the mound and the vegetation because the flow velocity was reduced significantly due to the formation of a water cushion.

3.3. Energy Reduction

3.3.1. Effect of Mound on Energy Reduction

In Case 1 (i.e., a single embankment system), an exponentially decreasing trend in the relative total energy reduction was observed (Figure 8). The maximum reduction of total energy was found to be approximately 53% for the lowest ho’, (= 0.07), due to direct hitting, the frictional loss increases, and the inundation depth was decreased significantly, whereas the minimum energy reduction was found to be around 3.5% for the highest ho (= 0.48). The maximum energy reduction solely depends on the difference of the specific energy head between Section 1 and Section 4. When a mound was installed behind the embankment, a significant effect on the relative total energy reduction was observed. In EMNV cases, the maximum loss of relative energy was observed for the lowest ho (= 0.07). When the ho was increased, the relative total energy reduction followed a sharply decreasing trend in all of the EMNV cases, and finally, the minimum loss of relative total energy was observed for the highest ho (= 0.48) (Figure 8b,d,f). The maximum loss was found to be 65% in Cases 2, 3, and 4, for the lowest ho and the minimum energy reduction was found to be 23% in Case 2. The highest energy reduction was for the lower ho, which was due to the formation of a type-B jump in the gap region, whereas no hydraulic jump was formed for the higher ho. In addition, the increments of both mound height and length resulted in an additional 1% to 4% of energy reduction due to a greater resistance offered by the increased mound height and length of the mound.

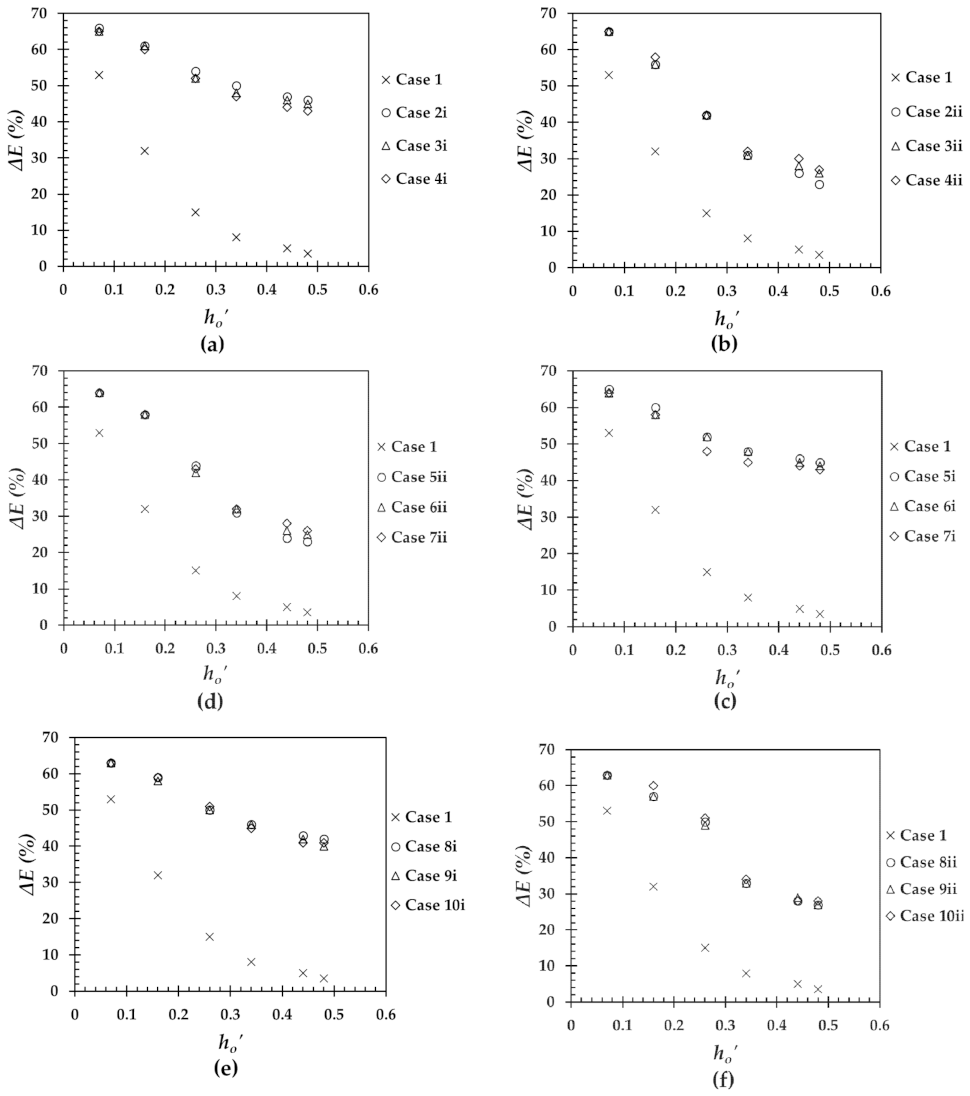
3.3.2. Combined Effect of Vegetation and Mound on Energy Reduction

After vegetation of different configurations was installed over the mound model, a significant loss of total energy was observed. In EMV cases, the maximum energy reduction was found to be 63% to 66% for the lowest ho’, i.e., ho = 0.07. With the increment of ho, a gradually decreasing trend was observed, and finally the energy reduction was reduced to 40% to 46% for the highest ho’ (= 0.48) (Figure 8a,c,e). The effect of the vegetation was observed to be very small, approximately 1% to 2%, for the lower ho due to the effect of the mound. However, at the higher ho, the effect of vegetation on energy reduction was observed to be more significant compared to that of the EMNV cases. Different configurations of vegetation reduced the relative total energy about 1% to 20% in EMV cases compared with the EMNV cases. Moreover, by increasing the density and reducing the porosity of the vegetation from sparser vegetation (G/d = 5.25, Pr = 99%) to intermediate vegetation (G/d = 1.088, Pr = 91%), a further energy reduction of approximately 1% to 4% was found in the corresponding Hm. On the contrary, the energy reduction was found to be almost the same after increasing the Hm while keeping the vegetation configurations nearly identical (Figure 8a,c,e). Compared with Case 1, the EMV cases (Case 2v to Case 10v) showed a significant reduction in the overall energy in every Hm. The EMV cases reduced the relative total energy by approximately 10% to 42.5%, compared with Case 1, i.e., the embankment only case.

4. Discussion

4.1. Changes of Flow and Water Cushion

This study investigated and clarified the effectiveness of a compound mitigation system against varying conditions of overtopping flow depth where a landward coastal forest as vegetation was installed over a mound behind a seaward embankment. In a single embankment system (i.e., no mitigation case (Case 1)), a backwater rise at the upstream was observed due to the resistance by the embankment, and then the flow approached and overtopped the landside with a higher velocity where the embankment worked as a weir. When both the mound and vegetation of different configurations were placed, significant variations in flow structures were observed, and a water cushion developed within the mitigation system that was mainly due to two types of hydraulic jump, i.e., a regular hydraulic jump (type-A) and a submerged hydraulic jump (type-B) (Figure 1c,d). Formation of the water cushion increased the tailwater depth (Figure 5) and resulted a subcritical flow at Section 3 (Figure 7). These phenomena will be safer for the downstream mitigation structure, which will prevent the direct hitting because of the reduced flow velocity. When vertically double-layered vegetation was installed behind a seaward embankment, Rashedunnabi and Tanaka [14] observed both type-A and type-B hydraulic jumps within the defense system; however, they observed the phenomena of sweeping out of the flow within the defense system. They concluded that the flow was transformed from a type-A to a type-B hydraulic jump due to the change of vegetation in the short-submerged layer from an intermediate vegetation configuration to a dense configuration. Whereas in the present study, at the lowest mound height with both sparse and sparser vegetation configurations, the overtopping was swept out, flow became supercritical (Figure 7a,d), and directly hit the vegetation, and hence, no jump was formed (Figure 2a–d and Figure 3a). These phenomena would be dangerous because the vegetation might be washed out due to being directly hit by the overtopping flow to the vegetation. Thus, the cases with a lower mound height (i.e., Case 2v to Case 4v) are not recommended. While increasing the Hm, the flow was transformed to a type-B hydraulic jump (Figure 3). In this study, due to the increment of the Hm’ and vegetation density (G/d), the flow was transformed from no jump to type-A to type-B.
Several studies [36,37] reported that many coastal embankments and seawalls were destroyed by local scouring of the ground by the GEJT in 2011. The local scouring was mainly due to the overtopping flow directly hitting the toe and/or the supportive structure and causing a significant erosion or scouring, which led the structure to fail. However, when a secondary structure is implemented, a hydraulic jump forms due to the resistance offered by the secondary structure [14,38]. Further, when a hydraulic jump is formed, its position needs to be controlled because the high turbulence induced by a hydraulic jump results in scouring at the jump, which might be dangerous for both structures [31,39,40]. Thus, controlling the position of the hydraulic jump is very important [14]. If a type-B jump is formed, it prevents the overtopping flow from directly hitting the ground, which reduces local scouring at the toe, since coastal embankments are made of concrete [14]. These phenomena ensures the safety of both mitigation structures. Thus, this study aimed to create a type-B jump, i.e., a water cushion of greater magnitude. In EMV cases, it was observed that a water cushion, i.e., a type-B jump, formed in almost all of the considered ho in Case 5v to Case 7v, when Hm = 0.186. The water cushion with a greater magnitude (increased water cushion body) was formed at Hm = 0.248 in Case 8v to Case 10v, which resulted in maximum shifting of the Pj’ toward the top of E (Figure 4c) and maximum ht (Figure 5c). Moreover, further shifting of the Pj’ and maximum ht were observed with the intermediate vegetation configuration due to the increased drag force offered by the closer spacing of the cylinders (Figure 4 and Figure 5) compared with the other vegetation configurations. Thus, as an outcome of the present study, the Pj’ is found to be significant in creating a water cushion of greater magnitude.

4.2. Energy Reduction

The effectiveness of the introduced compound mitigation system was evaluated by using Equations (3) and (4). In terms of effectiveness, the basic role of a coastal forest depends mainly on the reduction of damage downstream of it by decreasing the specific energy of the flow. In the multiple defense system, the maximum loss of total energy in EMv cases was found to be 41%–66% (Figure 8a,c,e), whereas Rashedunnabi and Tanaka [14] observed a total energy reduction of 27%–54% in their hybrid defense system. Compared to that of the EMNV cases, the EMv cases significantly reduced the energy with the increasing of the ho (the ho was increased due to the increased flow rate, and hence the flow velocity) and the effect of vegetation over the mound on energy reduction can be clearly noticed. It was also observed that with the increment of Hm while keeping the vegetation configuration constant, the total energy reduction was almost identical. In EMNV cases, changing both the mound height and length produced a slightly increased loss of flow energy of approximately 1%–4%. In all cases considered, a decreasing trend in the energy reduction was observed because the flow hit the ground directly, and the effect of the energy reduction became lower with the increment of the overtopping flow depth (Figure 8). The increased energy reduction occurred when a water cushion was formed (i.e., both type-A and type-B) within the mitigation system due to the resistance offered by the mound and the resistance/drag force of the vegetation. Moreover, a further increase in energy reduction was observed due to the increased vegetation density. In all three considered Hm, the intermediate vegetation density (G/d = 1.088, Pr = 91%) resulted in the maximum overall energy reduction by shifting Pj’ toward the embankment top (Figure 4).
In this study, it was observed that the vegetation with the intermediate configuration at the maximum mound height, i.e., Case 8v, provided the most satisfactory outcomes in creating a water cushion with a greater magnitude within the mitigation system and in terms of overall energy reduction of all of the other vegetation configurations. In addition, this will require less space and less soil to construct the mound. On the other hand, depending on the soil availability to construct the mound and availability of land, Case 9v (i.e., the case with sparse vegetation), could also be considered. Hence, considering the water cushion effect and energy reduction, the introduced compound mitigation system (in this study) could be considered as an effective design to mitigate a level-2 tsunami.

5. Conclusions

The effects of landward vegetation over a mound behind a seaward embankment (in the flow direction) on the overtopping flow and the energy reduction under a steady state supercritical flow were investigated experimentally under the varying conditions of mound height and vegetation density. The findings of the present study are summarized as:
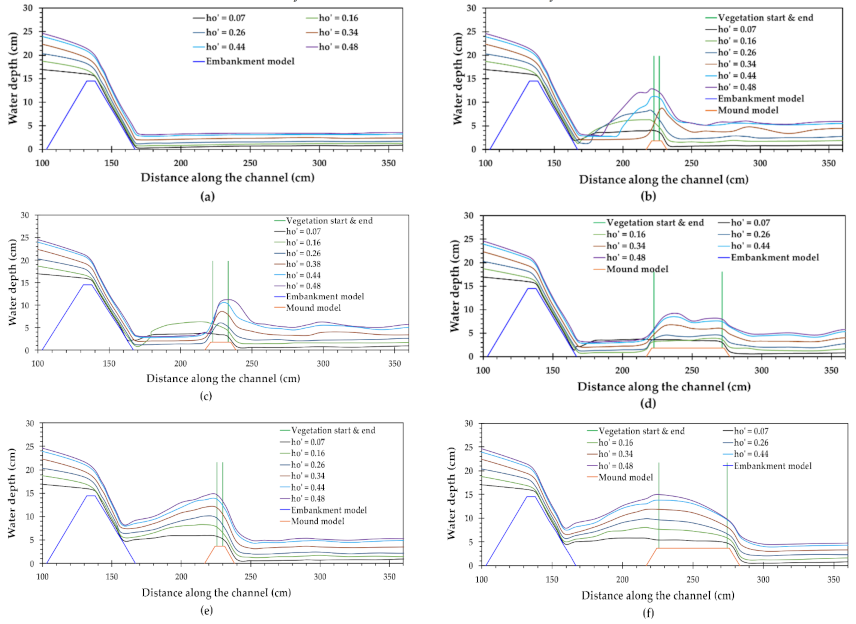
  • After the vegetation is placed on a mound behind an embankment, the flow structures are changed significantly, and a hydraulic jump, i.e., a water cushion phenomenon, is formed within the system, which reduces the impact of the overflowing water by preventing it from directly hitting the downstream structure.
  • In EMV (seaward embankment followed by landward vegetation over a mound) cases, increasing the mound height while keeping the vegetation density the same moved the hydraulic jump to the safer side (i.e., on the downward slope of the embankment) because of the combined effect of mound and vegetation. For the highest mound, the toe of the hydraulic jump remains on the embankment slope, which is much safer because the embankment is protected. However, such flow structures, i.e., water cushions, did not occur in EMNV cases (seaward embankment followed by only a mound) because the mound is not big enough.
  • The position of a hydraulic jump toe (Pj) on the embankment slope was shifted toward the embankment top, and the tailwater depth (ht) was increased due to the combined effect of mound height and vegetation. These phenomena increased the magnitude of the formed water cushion within the mitigation system, which will prevent the overtopping flow from directly hitting the ground, and will consequently reduce scouring at the embankment toe. In addition, increasing both the mound height and the vegetation density offered larger drag and greater resistance to the flow and caused a further shift of Pj toward the embankment slope and increased ht’, which consequently increased the magnitude of the water cushion.
  • The maximum reduction of the flow energy was found to be 41%–66% in EMV cases. Due to the formation of a water cushion within the mitigation system, the vegetation further reduced the flow energy compared with EMNV cases. The increment of the overtopping flow depths caused more energy reduction compared to EMNV cases, which indicates the significance of vegetation. Furthermore, no significant variation in the overall total energy reduction was observed by increasing the mound height while keeping the vegetation configuration the same. Among all of the vegetation configurations, the intermediate case was most effective because it reduced energy more due to closer spacing between the cylinders. In addition, the mound with the intermediate vegetation case could be of short width compared to the other vegetation cases (sparse, and sparser), which would be effective from both an economic point of view and land availability.
For a Level 2 tsunami, the compound mitigation system introduced could be considered an effective design for coastal regions. This study clarified the basic flow structures and effects on energy reduction of a compound mitigation system under a fixed bed condition. In order to clarify the effects of flow on scouring around this type of mitigation system, further investigation is needed under an erodible/movable bed condition. In addition, to optimize this compound mitigation system, further study–by changing the gap conditions and increasing the vegetation width–is required.

Author Contributions

Conceptualization, model design and preparation, experiment, methodology, data analysis and original draft preparation, M.A.R.; conceptualization, supervision, resources, review and editing, N.T.; experiment, methodology, A.H.M.R. All authors have read and agreed to the published version of the manuscript.

Funding

This research received no external funding.

Acknowledgments

The authors acknowledge the support of MEXT scholarships (Md Abedur Rahman and A.H.M. Rashedunnabi) from the Japanese Ministry of Education, Culture, Sports, Science, and Technology (Monbukagakusho). Naveed Anjum is acknowledged for the discussion.

Conflicts of Interest

The authors declare no conflict of interest.

References

  1. Tappin, D.R.; Evans, H.M.; Jordan, C.J.; Richmond, B.; Sugawara, D.; Goto, K. Coastal changes in the Sendai area from the impact of the 2011 Tōhoku-oki tsunami: Interpretations of time series satellite images, helicopter-borne video footage and field observations. Sediment. Geogr. 2012, 282, 151–174. [Google Scholar] [CrossRef]
  2. Tanaka, N. Effectiveness and limitations of coastal forest in large tsunami: Conditions of Japanese pine trees on coastal sand dunes in tsunami caused by Great East Japan Earthquake. J. Jpn. Soc. Civ. Eng. Ser. B1 2012, 68, 7–15. [Google Scholar] [CrossRef] [Green Version]
  3. Okumura, N.; Jonkman, S.N.; Esteban, M.; Hofland, B.; Shibayama, T. A method for tsunami risk assessment: A case study for Kamakura, Japan. Nat. Hazards 2017, 88, 1451–1472. [Google Scholar] [CrossRef] [Green Version]
  4. Fadly, U.; Murakami, K. Study on reducing tsunami inundation energy by the modification of topography based on local wisdom. J. Jpn. Soc. Civ. Eng. Ser. B3 2013, 68, 66–71. [Google Scholar] [CrossRef] [Green Version]
  5. Igarashi, Y.; Tanaka, N. Evaluation of energy reduction by the double embankment system on the change of flow structure after the overtopping of level 2 tsunami from sea embankment. J. Jpn. Soc. Civ. Eng. Ser. B1 2017, 73, 1009–1014. [Google Scholar] [CrossRef]
  6. Zaha, T.; Tanaka, N.; Kimiwada, Y. Flume experiments on optimal arrangement of hybrid defense system comprising an embankment, moat, and emergent vegetation to mitigate inundating tsunami current. Ocean Eng. 2019, 173, 45–57. [Google Scholar] [CrossRef]
  7. Kimiwada, Y.; Tanaka, N.; Zaha, T. Differences in effectiveness of a hybrid tsunami defense system comprising an embankment, moat, and forest in submerged, emergent, or combined conditions. Ocean Eng. 2020, 208, 107457. [Google Scholar] [CrossRef]
  8. Teh, S.Y.; Koh, H.L.; Liu, P.L.F.; Ismail, A.I.M.; Lee, H.L. Analytical and numerical simulation of tsunami mitigation by mangroves in Penang, Malaysia. J. Asian Earth Sci. 2009, 36, 38–46. [Google Scholar] [CrossRef]
  9. Rahman, M.M.; Schaab, C.; Nakaza, E. Experimental and numerical modeling of tsunami mitigation by canals. J. Waterw. Port Coast. Ocean Eng. 2016, 143, 04016012. [Google Scholar] [CrossRef]
  10. Mineura, R.; Tsujimoto, G.; Yamada, F. A Study on scouring by overflow from seawall and application of an artificial trench. J. Jpn. Soc. Civ. Eng. Ser. B2 (Coast. Eng.) 2013, 69, 791–795. [Google Scholar]
  11. Tokida, K.; Tanimoto, R. Lessons for countermeasures using earth structures against tsunami obtained in the 2011 off the Pacific Coast of Tohoku Earthquake. Soils Found. 2014, 54, 523–543. [Google Scholar] [CrossRef]
  12. Tsujimoto, G.; Mineura, R.; Yamada, F.; Kakinoki, T.; Uno, K. Scouring mechanism behind seawall from tsunami overflow and optimum conditions to reduce tsunami energy with an artificial trench. Coast. Eng. Proc. 2015, 1, 38. [Google Scholar] [CrossRef] [Green Version]
  13. Strusi’nska-Correia, A. Tsunami mitigation in Japan after the 2011 Tohoku Tsunami. Int. J. Disaster Risk Reduct. 2017, 22, 397–411. [Google Scholar] [CrossRef]
  14. Rashedunnabi, A.H.M.; Tanaka, N.R. Energy reduction of a tsunami current through a hybrid defense system comprising a sea embankment followed by a coastal forest. Geosciences 2019, 9, 247. [Google Scholar]
  15. Kyprioti, A.P.; Taflanidis, A.A.; Kennedy, A.B. Dissipation Effects of Coastal Vegetation on Nearshore Structures under Wave Runup Loading. J. Struct. Eng. 2021, 147, 06020010. [Google Scholar] [CrossRef]
  16. Marras, S.; Mandli, K.T. Modeling and Simulation of Tsunami Impact: A Short Review of Recent Advances and Future Challenges. Geosciences 2021, 11, 5. [Google Scholar] [CrossRef]
  17. Shuto, N. The effectiveness and limit of tsunami control forests. Coast. Eng. Jpn. 1987, 30, 143–153. [Google Scholar] [CrossRef]
  18. Tanaka, N. Vegetation bioshields for tsunami mitigation: Review of effectiveness, limitations, construction, and sustainable management. Landsc. Ecol. Eng. 2009, 5, 71–79. [Google Scholar] [CrossRef] [Green Version]
  19. Yanagisawa, H.; Koshimura, S.; Goto, K.; Miyagi, T.; Imamura, F.; Ruangrassamee, A.; Tanavud, C. The reduction effects of mangrove forest on a tsunami based on field surveys at Pakarang Cape, Thailand and numerical analysis. Estuar. Coast. Shelf Sci. 2009, 81, 27–37. [Google Scholar] [CrossRef]
  20. Osti, R.; Tanaka, S.; Tokioka, T. The importance of mangrove forest in tsunami disaster mitigation. Disasters 2009, 33, 203–213. [Google Scholar] [CrossRef] [PubMed]
  21. Matsuba, S.; Mikami, T.; Jayaratne, R.; Shibayama, T.; Esteban, M. Analysis of tsunami behavior and the effect of coastal forest in reducing tsunami force around the coastal dikes. Coast. Eng. Proc. 2014, 1, 37. [Google Scholar] [CrossRef] [Green Version]
  22. Pasha, G.A.; Tanaka, N. Undular hydraulic jump formation and energy loss in a flow through emergent vegetation of varying thickness and density. Ocean Eng. 2017, 141, 308–325. [Google Scholar] [CrossRef]
  23. Anjum, N.; Tanaka, N. Experimental study on flow analysis and energy loss around discontinued vertically layered vegetation. Environ. Fluid Mech. 2020, 20, 791–817. [Google Scholar] [CrossRef]
  24. Iimura, K.; Tanaka, N. Numerical simulation estimating effects of tree density distribution in coastal forest on tsunami mitigation. Ocean Eng. 2012, 54, 223–232. [Google Scholar] [CrossRef]
  25. Harada, K.; Imamura, F. Effects of coastal forest on tsunami hazard mitigation—A preliminary investigation. In Tsunamis. Advances in Natural and Technological Hazards Research; Satake, K., Ed.; Springer: Dordrecht, The Netherlands, 2005; Volume 23. [Google Scholar] [CrossRef]
  26. Thuy, N.B.; Nandasena, N.A.K.; Hai Dang, V.; Tanaka, N.; Quoc Viet, H.; Giay, C. Simplified formulae for designing coastal forest against tsunami run-up: One-dimensional approach. Mar. Geophys. Geol. 2018, 92, 327–346. [Google Scholar] [CrossRef]
  27. Aniel-Quiroga, Í.; Vidal, C.; Lara, J.L.; González, M.; Sainz, Á. Stability of rubble-mound breakwaters under tsunami frst impact and overfow based on laboratory experiments. Coast Eng. 2018, 135, 39–54. [Google Scholar] [CrossRef]
  28. Nandasena, N.A.K.; Tanaka, N.; Sasaki, Y.; Osada, M. Boulder transport by the 2011 Great East Japan tsunami: Comprehensive field observations and whither model predictions? Mar. Geol. 2013, 346, 292–309. [Google Scholar] [CrossRef]
  29. Nandasena, N.A.K.; Sasaki, Y.; Tanaka, N. Modeling field observations of the 2011 Great East Japan tsunami: Efficacy of artificial and natural structures on tsunami mitigation. Coast. Eng. 2012, 67, 1–13. [Google Scholar] [CrossRef]
  30. Pasha, G.A.; Tanaka, N.; Yagisawa, J.; Achmad, F.N. Tsunami mitigation by combination of coastal vegetation and a backward-facing step. Coast. Eng. J. 2018, 60, 104–125. [Google Scholar] [CrossRef]
  31. Chow, V.T. Open-Channel Hydraulics; McGraw-Hill: New York, NY, USA, 1959; p. 728. [Google Scholar]
  32. Hager, W.H. B-jump in sloping channel. J. Hydraul. Res. 1988, 26, 539–558. [Google Scholar] [CrossRef]
  33. Chanson, H. The Hydraulics of Open Channel Flow: An Introduction: Basic Principles, Sediment Motion, Hydraulic Modelling, Design of Hydraulic Structures, 2nd ed.; Elsevier Ltd.: Amsterdam, The Netherlands, 2004; ISBN 9780080472973. [Google Scholar]
  34. Peterka, A.J. Hydraulic Design of Stilling Basins and Energy Dissipators; Engineering Monograph Number-25; U.S. Bureau of Reclamation: Denver, CO, USA, 1963. [Google Scholar]
  35. Na, B.; Chang, K.A.; Huang, Z.C.; Lim, H.J. Turbulent flow field and air entrainment in laboratory plunging breaking waves. J. Geophys. Res. Oceans 2016, 121, 2980–3009. [Google Scholar] [CrossRef] [Green Version]
  36. Mikami, T.; Shibayama, T.; Esteban, M. Field Survey of the 2011 Tohoku Earthquake and Tsunami in Miyagi and Fukushima Prefectures. Coast. Eng. J. 2012, 54, 1–26. [Google Scholar] [CrossRef]
  37. Tanaka, N.; Sato, M. Scoured depth and length of pools and ditches generated by overtopping flow from embankments during the 2011 Great East Japan Tsunami. Ocean Eng. 2015, 109, 72–82. [Google Scholar] [CrossRef]
  38. Song, J.; De Risi, R.; Goda, K. Influence of Flow Velocity on Tsunami Loss Estimation. Geosciences 2017, 7, 114. [Google Scholar] [CrossRef] [Green Version]
  39. Adam, A.M.; Ruff, J.F.; AlQaser, G.; Abt, S.R. Characteristics of B-jump with different toe locations. J. Hydraul. Eng. 1993, 119, 938–948. [Google Scholar] [CrossRef]
  40. Kawagoshi, N.; Hager, W.H. B-jump in sloping channel, II. J. Hydraul. Res. 1990, 28, 461–480. [Google Scholar] [CrossRef]
Figure 1. Schematic diagram of experimental setup. (a) EMNV cases, (b) EMV cases and different types of hydraulic jumps, (c) type-A, (d) type-B, (e) plan view of vegetation models with vegetation arrangement and definition, (f) photo of absence of jump in Case 3v against ho = 0.48, (g) photo of formed water cushion within the mitigation system in Case 6v against ho = 0.48.
Geosciences 11 00090 g001
Figure 2. Flow structure around the compound mitigation system against varying non-dimensional overtopping flow depths, ho. (a) Case 1; (b) Case 2v; (c) Case 3v; (d) Case 4v; (e) Case 8v; and (f) Case 10v.
Geosciences 11 00090 g002
Figure 3. Flow types within the mitigation system. (a) Case 2v, Case 3v, and Case 4v (EMV cases) for Hm = 0.124; (b) Case 2, Case 3, and Case 4 (EMNV cases) for Hm = 0.124; (c) Case 5v, Case 6v, and Case 7v (EMV cases) for Hm = 0.186; (d) Case 5, Case 6 and Case 7 (EMNV cases) for Hm = 0.186; (e) Case 8v, Case 9v and Case 10v (EMV cases) for Hm = 0.248; and (f) Case 8, Case 9, and Case 10 (EMNV cases) for Hm = 0.248.
Geosciences 11 00090 g003
Figure 4. Non-dimensional position of the hydraulic jump, Pj’.
Geosciences 11 00090 g004
Figure 5. Non-dimensional tailwater depth (ht) against varying non-dimensional overtopping flow depth, (ho). (a) for Hm = 0.124, (b) for Hm = 0.186, and (c) for Hm = 0.248.
Geosciences 11 00090 g005
Figure 6. (a) Water surface slope and its definition (hu is the water depth just at the front of the vegetation, and hd is the water depth just at the back of the vegetation), (b) water surface slope “tan θ” within the vegetation models against varying condition of the non-dimensional overtopping flow depths, ho’.
Geosciences 11 00090 g006
Figure 7. Froude numbers (Fr2 at Section 2 and Fr3 at Section 3) at the start of the hydraulic jump (approach Froude number) and before vegetation against different non-dimensional overtopping flow depths, ho: (a) Fr2 for Hm = 0.124; (b) Fr2 for Hm = 0.186; and (c) Fr2 for Hm = 0.248; (d) Fr3 for Hm = 0.124; (e) Fr3 for Hm = 0.186; and (f) Fr3 for Hm = 0.248.
Geosciences 11 00090 g007
Figure 8. Overall total energy reduction downstream of the mitigation system against varying non-dimensional overtopping flow depths, ho (a) for Hm = 0.124 (EMV cases); (b) for Hm = 0.124 (EMNV cases); (c) for Hm = 0.186 (EMV cases); (d) for Hm = 0.186 (EMNV cases); (e) for Hm = 0.248 (EMV cases); and (f) for Hm = 0.248 (EMNV cases).
Geosciences 11 00090 g008
Table 1. Experimental Conditions and Vegetation Configuration in EMNV and EMV Cases.
Case No.Mound Followed by E (EMNV)/Forest Type over M Followed by E (EMV)HmlmWV
(cm)
D
(cm)
Porosity
(Pr) %
G/d
1Only Embankment------
2Mound-1 (shallow) 0.1241.076----
3Mound-1 (shallow)0.1241.543----
4Mound-1 (shallow)0.1244.065----
5Mound-2 (medium) 0.1861.325----
6Mound-2 (medium) 0.1861.791----
7Mound-2 (medium) 0.1864.314----
8Mound-3 (high) 0.2481.573----
9Mound-3 (high) 0.2482.04----
10Mound-3 (high) 0.2484.562----
2vIntermediate0.1241.0765.411.67911.088
3vSparse0.1241.54312.182.5982.125
4vSparser0.1244.06548.755995.25
5vIntermediate0.1861.3255.411.67911.088
6vSparse0.1861.79112.182.5982.125
7vSparser0.1864.31448.755995.25
8vIntermediate0.2481.5735.411.67911.088
9vSparse0.2482.0412.182.5982.125
10vSparser0.2484.56248.755995.25
Publisher’s Note: MDPI stays neutral with regard to jurisdictional claims in published maps and institutional affiliations.

