Article

The Monitoring of CO2 Soil Degassing as Indicator of Increasing Volcanic Activity: The Paroxysmal Activity at Stromboli Volcano in 2019–2021

by
Salvatore Inguaggiato
1,*,
Fabio Vita
1,
Marianna Cangemi
2,
Claudio Inguaggiato
3,4 and
Lorenzo Calderone
1
1
Istituto Nazionale di Geofisica e Vulcanologia, Sezione di Palermo, Via Ugo La Malfa, 90146 Palermo, Italy
2
Dipartimento di Scienze della Terra e del Mare, Via Archirafi 36, 90123 Palermo, Italy
3
Departamento de Geología, Centro de Investigación Científica y de Educación Superior de Ensenada, Baja California (CICESE), Carretera Ensenada-Tijuana 3918, 22860 Ensenada, Mexico
4
Istituto Nazionale di Geofisica e Vulcanologia, Sezione di Bologna, Via Donato Creti 12, 40128 Bologna, Italy
*
Author to whom correspondence should be addressed.
Submission received: 27 February 2021 / Revised: 30 March 2021 / Accepted: 30 March 2021 / Published: 8 April 2021

Abstract

:
Since 2016, Stromboli volcano has shown an increase of both frequency and energy of the volcanic activity; two strong paroxysms occurred on 3 July and 28 August 2019. The paroxysms were followed by a series of major explosions, which culminated on January 2021 with magma overflows and lava flows along the Sciara del Fuoco. This activity was monitored by the soil CO2 flux network of Istituto Nazionale di Geofisica e Vulcanologia (INGV), which highlighted significant changes before the paroxysmal activity. The CO2 flux started to increase in 2006, following a long-lasting positive trend, interrupted by short-lived high amplitude transients in 2016–2018 and 2018–2019. This increasing trend was recorded both in the summit and peripheral degassing areas of Stromboli, indicating that the magmatic gas release affected the whole volcanic edifice. These results suggest that Stromboli volcano is in a new critical phase, characterized by a great amount of volatiles exsolved by the shallow plumbing system, which could generate other energetic paroxysms in the future.

1. Introduction

Volatiles degassing from volcanic systems is a peculiar and useful tool to monitoring the volcanic activity to the aims of characterizing the geochemistry of shallow plumbing systems and forecasting and individuating the changes of the volcanic activity level. For this reason, many scientists have carried out investigations on shallow volatile degassing to characterize the normal activity level and for identifying the main active degassing structures that are present on the studied volcanic systems [1,2,3,4,5,6,7,8,9,10,11,12].
Consequently, many volcano observatories have been established thorough the world, including geochemical monitoring networks of extensive parameters, like CO2 and SO2 fluxes from soil and plume [13,14,15,16,17,18,19,20,21].
Such a geochemical tool has been successfully applied to Stromboli volcano, which in the last two decades has been characterized by an increasing frequency and intensity of explosions, paroxysms, and effusive eruptions.
Among the three active volcanoes of the Aeolian archipelago, Stromboli, Panarea and Vulcano, the former is the most active (Figure 1). Stromboli is an open conduit volcano characterized by persistent explosive activity (Strombolian activity). During the last decades, major explosions, paroxysms, and three effusive eruptions interrupted the normal Strombolian activity. The effusive eruptions occurred in 2002–2003, 2007, and 2014; the 2002–2003 eruption affected the stability of the volcanic edifice, generating a tsunami (30 December 2002) with a run-up of 11 m, caused by a sliding mass movement along the Sciara del Fuoco to the sea. Paroxysmal explosions occurred during the 2002–2003 (5 April 2003) [22] and 2007 (15 March) effusive eruptions [23], and twice in 2019 (3 July and 28 August) [24].
The fluid manifestations, useful for a geochemical monitoring program, are present both in the crater area (plume, fumaroles, and soil degassing) and in the peripheral NE area as testified by the presence of many thermal wells and anomalous soil degassing zones linked to the N64 and N41 active faults (Figure 1) [23,25,26].
The recent increase of volcanic activity at Stromboli (since 2016) [20,27,28] has been accompanied by a strong increase of the summit soil degassing, culminating with the 2019 paroxysms [24].
Moreover, the volcanic activity of Stromboli showed a further increase in the 2020–2021 period as shown by major explosions (19 July; 16 August; 10 and 16 November (Figure 1c–e) of 2020; 24 January 2021, and magma overflows in the summit craters (18, 22, and 24 January 2021) with following lava effusions along the Sciara del Fuoco, which occasionally reached the sea (22 January 2021).
The aim of this article is to investigate the strong increase in volcanic activity of Stromboli over the last five years, utilizing the significant geochemical changes observed both in the summit area (2016–2019 period, STR02 station) characterized by a continuous positive long trend of CO2 soil degassing [24,27], and in the NE peripheral anomalous soil CO2 degassing area recorded in the period of 2017–2021 (STR01 station, new data). In this way, we are able to assess the extent of geochemical anomalies and the areas of influence of volatiles throughout the volcanic edifice.

2. Methods: Soil CO2 Fluxes Geochemical Network

A volcano surveillance program was carried out by the INGV of Italy, under the aegis of the Italian civil protection, which developed, installed, and maintained an interdisciplinary monitoring network at Stromboli volcano. In particular, inside of this program a geochemical network to monitoring a soil CO2 outgassing using an automated accumulation chamber system (manufactured by West Systems, Pontedera, Pisa, Italy) [29] was installed in 1999 [22,23,30,31] in the summit and peripheral areas of Stromboli (Figure 1), located in Pizzo Sopra la Fossa and Scari anomalous degassing areas [6,21].
The continuous monitoring of CO2 fluxes is performed on an hourly basis (near real-time measurements), and the data are transmitted to the COA Civil Protection Volcano Observatory at Stromboli via Wi-Fi, from which it is sent to the INGV-Palermo geochemical monitoring center via a virtual private network [21].
The near-real acquisition of these data together with the high performance of this geochemical network and a very long acquired data set (two decades) provided scientific information on the shallow plumbing degassing system useful for the evaluation of the volcanic activity levels of Stromboli.

3. Results

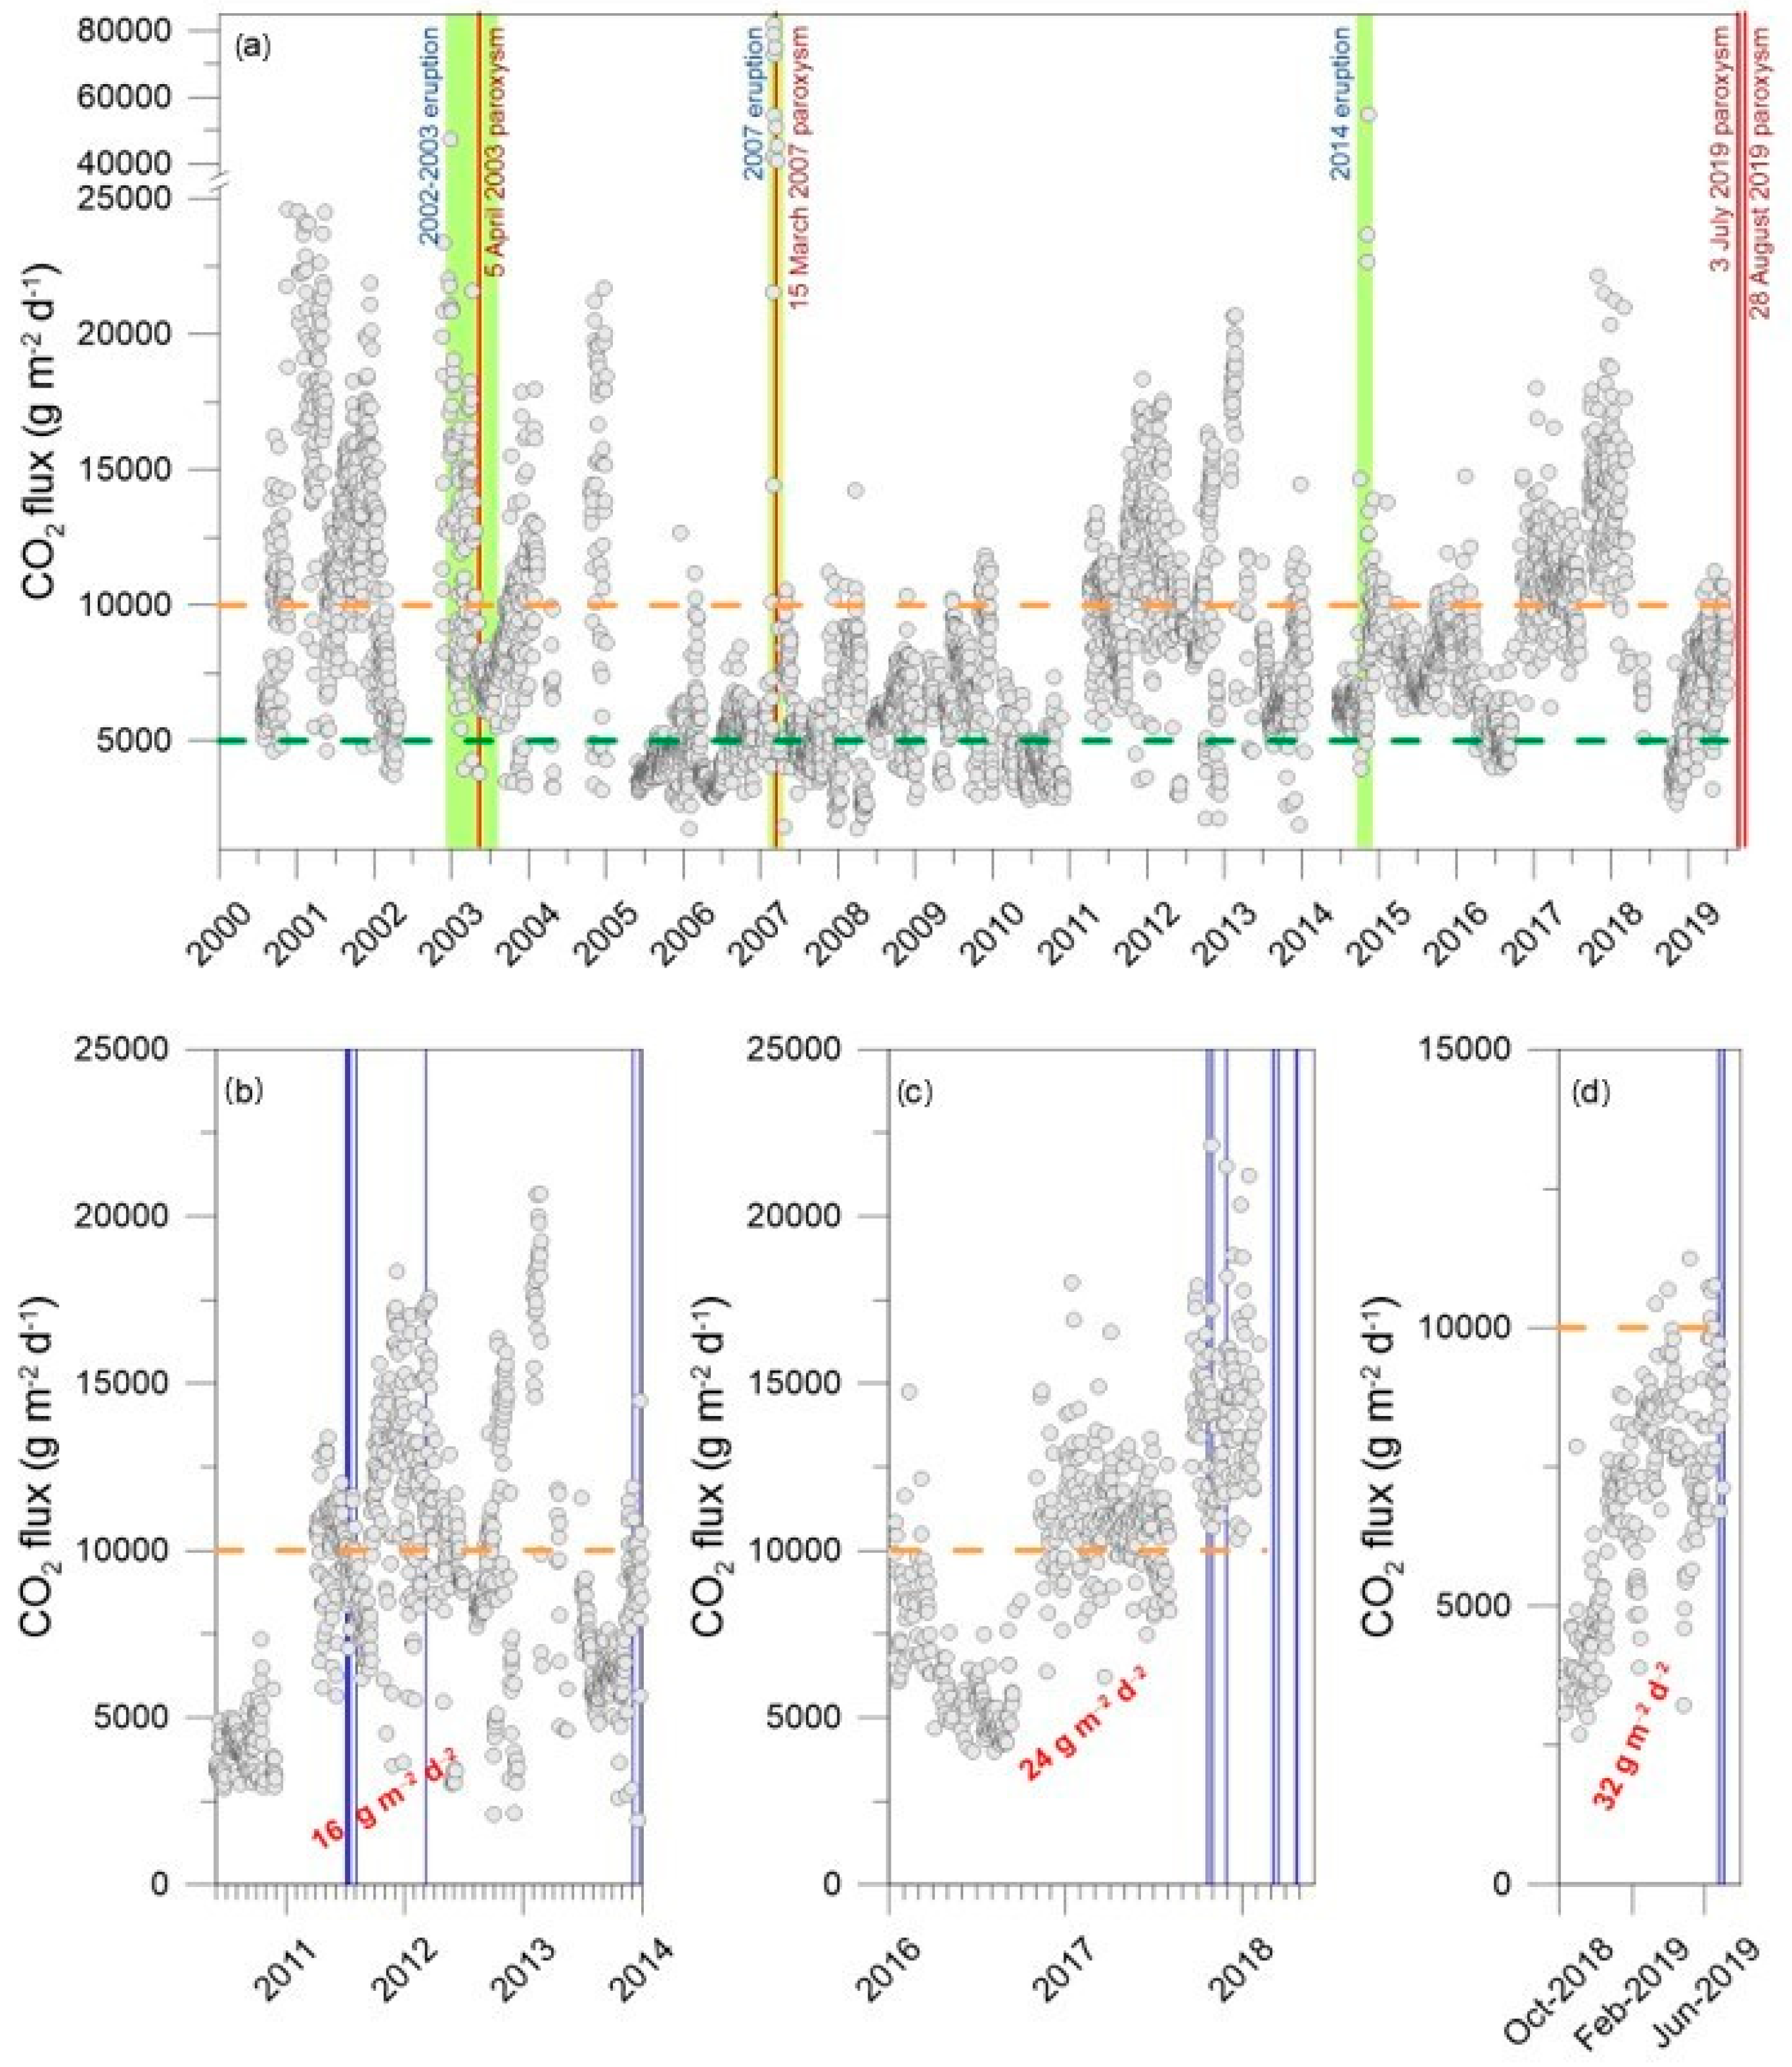
3.1. STR02 Soil CO2 Fluxes

The area of Pizzo Sopra La Fossa, in the summit area of Stromboli Island (Figure 1), is characterized by an anomalous soil degassing with areal CO2 fluxes ranging between 26 and 55 t d−1 [6,20] and represents the higher soil CO2 degassing zone with respect to the entire volcanic edifice [6]. The STR02 soil CO2 flux monitoring station was installed at Pizzo Sopra La Fossa in 1999 and produced a large and unique dataset of continuous soil CO2 degassing. STR02 station worked from July 1999 to July 2019. Unfortunately, the paroxysmal event of 3 July 2019 destroyed the STR02 instrumentation, interrupting the acquisition of CO2 monitoring data from soils after 20 years of hard and productive work [20,24,27], which well supported the geochemical surveillance for the evaluation of the volcanic activity level of Stromboli.
The near real-time measurements of soil CO2 flux carried out at the STR02 station (Figure 2a) showed, after an effusive/paroxysmal period occurred in 2002–2004, a slow and continuous increase in the period from 2005 to 2018 [11], with values ranging from 2000 g m−2 d−1 to 23,000 g m−2 d−1 (Figure 2a), interrupted by several abrupt increases of CO2 linked to the input of magmatic volatiles (Figure 2b,c). This long-lasting modification of CO2 flux (Figure 2a) was explained by the slow but continuous increases of the total volatile pressure in the shallow plumbing system of Stromboli [9,11], due to a continuous refill from the depth.
In the last years of life of the STR02 monitoring station (2016–2019), two new strong and abrupt increases of shallow CO2 soil degassing (up to 23,000 g m−2 d−1), with the highest degassing rate (24 and 32 g m−2 d−2; [24,27]) ever documented, have been recorded (Figure 2b,c).
This strong increase, both in degassing CO2 rate and CO2 fluxes, with values similar to those observed in the 2000–2004 strong effusive period, indicated that in the shallow plumbing system a very high volatile content was restored. This suggests a new critical phase of degassing with a high paroxysmal potential, as already occurred in 2003 [20,24,27,32], and further confirmed by the occurrence of the highest energetic paroxysms recorded in the last 20 years on 3 July and 28 August 2019 [24].
After the 3 July 2019 paroxysm, due to the destruction of the STR02 station, the geochemical monitoring of soil CO2 degassing continued with the STR01 station located in the peripheral area.

3.2. STR01 Soil CO2 fluxes

The area of Scari, in the northeast side of the Stromboli Island [6], is characterized by an anomalous soil degassing well documented in the past [6] with CO2 fluxes ranging from 0.1 to 10 t d−1 [20]; the higher value was reached during the effusive eruption period in 2014.
The soil degassing in this area is driven by the N64 active fault (Figure 1) that receives deeper fluids exsolved by shallow magma. The peripheral soil degassing is controlled by the underlying thermal aquifer that modulates and buffers the fluid inputs linked to the volcanic activity [33]. Moreover, in the shallow portion of the soil the climatic conditions (mainly temperature) influence and modulate the degassing process [33].
The daily average CO2 fluxes recorded in the period of 2017–2021 at STR01, plotted together with the daily air temperature (Figure 3), showed two peculiar behaviors: (i) a cyclic increasing and decreasing of CO2 flux values during summer and winter seasons, respectively, and (ii) a continuous positive degassing trend, with relative yearly maximum values from ~240 to ~400 g m−2 d−1.
The cyclic increasing of CO2 fluxes highlights that the yearly flux maxima were recorded in August, which is characterized by the higher yearly values of temperature (around 30–32 °C), whereas the flux minima values were recorded in February, which is characterized by the lower yearly temperature values (around 11–14 °C).
The daily CO2 fluxes in the STR01 station, measured during this last period of observation (2017–2021), range from about 30 to 400 g m−2 d−1, with an average value around 150 g m−2 d−1.
The cumulated probability plot of log CO2 shows multimodal distribution highlighting three log-normal families of degassing of 30, 100, and 250 g m−2 d−1, respectively named biological soil respiration (B), hydrothermal low degassing (HL), and hydrothermal high degassing (HH) (Figure 4). Family B, representing the lower CO2 flux measured at STR01 during the period of observation, suggests that it represents the background level, mainly controlled by biological CO2 production in the soil. Families HL and HH are related to the highest CO2 fluxes, suggesting and representing the hydrothermal degassing both during normal (hydrothermal low degassing) and high volcanic activity (hydrothermal high degassing).
Figure 5 shows a great positive correlation between air temperature and soil CO2 fluxes with a high positive coefficient of correlation (R2 = 0.88) and a correlation equation equal to:
CO2 fluxes = (11.22 × AirT) − 103.52
To analyze in detail the behavior of CO2 flux and air temperature during the period of 2017–2020, we calculated their yearly cumulated probability (Figure 6a,b). There is a progressive increase of CO2 fluxes (Figure 6a) during the period mentioned above, while the range between winter minima and summer maxima air temperatures (Figure 6b) contemporarily decreases (from 22 to 16 °C), due to both higher winter minima and lower summer maxima air temperatures.
Summer maxima of air temperature exhibit a decreasing trend, in counter tendency with the systematic increase of CO2 flux observed during the last four years, thus excluding its climatic forcing. Conversely, higher soil CO2 flux can be attributed to a higher release of volatiles exsolved from the magmatic plumbing system.

4. Discussion and Conclusions

The dynamic model of degassing at Stromboli volcano is based on the delicate equilibrium between the continuous refilling from the deep of volatiles exsolved by magma and the output from the shallow system [23,27].
During the “normal” Strombolian activity, the deep volatiles interact with the shallow plumbing system and outflow to the atmosphere, preserving the dynamic equilibrium (Volatiles’ pressure IN ≈ Volatiles’ pressure OUT, in Figure 7a).
When the deep input considerably increases (IN >>> OUT in Figure 7b), the dynamic equilibrium is altered, increasing the volatiles’ pressure in the shallow plumbing system. Therefore, the shallow system tries to restore the equilibrium by increasing the output to the atmosphere (soil and plume degassing) and to the aquifer, also through the increase of both frequency and energy of the explosions, overflows of magma confined in the crater terrace, or lava flow along Sciara del Fuoco (Figure 7b).
The above described events have characterized the recent activity (2016–2021) of Stromboli [24,27,28,34].
Based on the above described dynamic degassing model, we founded our observations on the monitoring of soil CO2 fluxes in the summit area, recorded by the STR02 station in the period of 2016–2019. During the abovementioned period, the CO2 fluxes of STR02 showed a clear pressurization process of the shallow plumbing system [27], with a proposed mechanism in three distinct phases: (i) long positive degassing trend of soil CO2 (pressurization); (ii) sharp variations of soil CO2 fluxes (inputs transient); and finally (iii) strong instability degassing process that culminated in the paroxysmal events occurred on 3 July 2021 [24]. This paroxysmal event destroyed the STR02 equipment for the CO2 flux measurements and interrupted the acquisition of this key extensive parameter utilized for monitoring the volcanic activity of Stromboli. Considering the logistical difficulties (use of the helicopter) and the lack of safety to operate in the summit area of Stromboli in this very active period, we were unable to proceed with replacement of the new monitoring station. For the prosecution of the geochemical monitoring of the volcanic activity of Stromboli, we utilize the STR01 station located in the peripheral area of Stromboli using data of soil CO2 fluxes acquired in the period of 2017–2021.
The CO2 fluxes emitted by soils in this peripheral area (STR01) are strongly influenced by environmental factors (mainly air temperature; [33]); thus, we proceeded with a filtering of the raw CO2 flux data to eliminate the influence of temperature and to consider only the variations of CO2 flux due to the changes of the volcanic activity. Based on the correlation equation between the CO2 flux and air temperature (Equation (1)), raw data measured at STR01 station were filtered subtracting the estimated environmental component of the CO2 flux at the measured temperature. Furthermore, we normalized the filtered CO2 flux data (Equation (2)) to the average annual temperature recorded over the last 4 years (approximately 25 °C):
Normalized residual CO2 flux25 °C = (CO2 fluxmeas − ((11.22*AirTmeas) − 103.5)) + CO2 flux25 °C)/CO2 flux25 °C
The filtered and normalized data of daily average CO2 fluxes (residuals) have been plotted in Figure 8, together with the main volcanic events recorded in the last years. It is very interesting to observe the variations of CO2 flux degassing from 2017 to 2021, with its progressive and massive increase that exceeds 100% over the entire period and with a sharp acceleration in 2020–21. In particular, the normalized residual CO2 fluxes vary over the entire period (2017–2021) between 75 and 175 g m−2 d−1, with an average annual increase of degassing rate of 33% and with an abrupt increase in the last year of 75%. The last sharp and substantial increase of CO2 in the 2nd half of 2020 culminated with the magma overflow from the summit craters and with the small and short-time lava effusion (18–24 January 2021) on the Sciara del Fuoco, which reached the sea on 22 January 2021.
In conclusion, we can affirm that the soil CO2 degassing well represents the dynamic equilibrium balance model [23] for monitoring the Strombolian activity and forecasting and highlighting the changes of volcanic activity level recorded in the last years. Moreover, the continuous increase of soil CO2 degassing observed in the peripheral area of Stromboli in the 2017–2021 period, which follows the long-lasting increase observed during the 2006–2019 period in the summit area, suggests that the recharge input of volatiles from the magma did not end with the summer 2019 paroxysms and still continues today affecting the entire volcanic edifice. The volcanic activity level of Stromboli is still very high today with a high volatiles pressure in the shallow plumbing systems, which can lead to new energetic volcanic events in the future. The scientific volcanic community is required to keep a high attention level for further potential signs of impending paroxysm.

Author Contributions

Conceptualization, S.I. and C.I.; data acquisition and methodology, F.V. and L.C.; graphical editing, M.C. and S.I.; data curation, M.C. and L.C.; writing—original draft preparation, S.I., C.I.; M.C.; F.V.; writing—review and editing, S.I. All authors have read and agreed to the published version of the manuscript.

Funding

This research was funded by the INGV-DPCN (Italian National Institute of Geophysics and Volcanology-Italian National Department for Civil Protection) volcanic surveillance program of Stromboli volcano. ObFu 0304.010 and by the Project FIRST-ForecastIng eRuptive activity at Stromboli volcano: Timing, eruptive style, size, intensity, and duration, INGV-Progetto Strategico DipartimentoVulcani 2019, (Delibera n. 144/2020).

Acknowledgments

The authors wish to thank their colleagues at the Istituto Nazionale di Geofisica e Vulcanologia of Palermo for their help in acquiring and processing data.

Conflicts of Interest

The authors declare no conflict of interest.

References

  1. Favara, R.; Giammanco, S.; Inguaggiato, S.; Pecoraino, G. Preliminary estimate of CO2 output from Pantelleria Island volcano (Sicily, Italy): Evidence of active mantle degassing. Appl. Geochem. 2001, 16, 883–894. [Google Scholar] [CrossRef]
  2. Cardellini, C.; Chiodini, G.; Frondini, F. Application of stochastic simulation to CO2 flux from soil: Mapping and quantification of gas release. J. Geophys. Res. 2003, 108, 2425. [Google Scholar] [CrossRef]
  3. Chiodini, G.; Granieri, D.; Avino, R.; Caliro, S.; Costa, A.; Werner, C. Carbon dioxide diffuse degassing and estimation of heat release from volcanic and hydrothermal systems. J. Geophys. Res. Solid Earth 2005, 110. [Google Scholar] [CrossRef]
  4. Giammanco, S.; Inguaggiato, S.; Valenza, M. Soil and fumarole gases of Mount Etna: Geochemistry and relations with volcanic activity. J. Volcanol. Geoth. Res. 1998, 81, 297–310. [Google Scholar] [CrossRef]
  5. Inguaggiato, S.; Mazot, A.; Diliberto, I.S.; Inguaggiato, C.; Madonia, P.; Rouwet, D.; Vita, F. Total CO2 output from Vulcano island (Aeolian Islands, Italy). Geochem. Geophys. Geosyst. 2012, 13, Q02012. [Google Scholar] [CrossRef]
  6. Inguaggiato, S.; Jacome Paz, M.P.; Mazot, A.; Delgado Granados, H.; Inguaggiato, C.; Vita, F. CO2 output discharged from Stromboli Island (Italy). Chem. Geol. 2013. [Google Scholar] [CrossRef] [Green Version]
  7. Inguaggiato, S.; Martin-Del Pozzo, A.L.; Aguayo, A.; Capasso, G.; Favara, R. Isotopic, chemical and dissolved gas constraints on spring water from Popocatepetl (Mexico): Evidence of gas-water interaction magmatic component and shallow fluids. J. Volcanol. Geotherm. Res. 2005, 141, 91–108. [Google Scholar] [CrossRef]
  8. Inguaggiato, S.; Hidalgo, S.; Beate, B.; Bourquin, J. Geochemical and isotopic characterization of volcanic and geothermal fluids discharged from the Ecuadorian volcanic arc. Geofluids 2010, 10, 525–541. [Google Scholar] [CrossRef]
  9. Inguaggiato, S.; Cardellini, C.; Taran, Y.; Kalacheva, E. The CO2 flux from hydrothermal systems of the Karymsky volcanic Centre, Kamchatka. J. Volcanol. Geoth. Res. 2017, 346, 1–9. [Google Scholar] [CrossRef]
  10. Paz, M.P.J.; Inguaggiato, S.; Taran, Y.; Vita, F.; Pecoraino, G. Carbon dioxide emissions from Specchio di Venere, Pantelleria, Italy. Bull. Volcanol. 2016, 78, 29. [Google Scholar] [CrossRef]
  11. Pecoraino, G.; Brusca, L.; D’Alessandro, W.; Giammanco, S.; Inguaggiato, S.; Longo, M. Total CO2 output from Ischia Island volcano (Italy). Geochem. J. 2015, 39, 451–458. [Google Scholar] [CrossRef]
  12. Maldonado, L.F.M.; Inguaggiato, S.; Jaramillo, M.T.; Valencia, G.G.; Mazot, A. Volatiles and Energy released by the Puracé volcano, Colombia Bull. Volcanol. Bull. Volcanol. 2017, 79, 84. [Google Scholar] [CrossRef]
  13. Galle, B.; Oppenheimer, C.M. Automated, high time-resolution measurements of SO2 flux at Soufrière Hills Volcano, Montserrat. Bull. Volcanol. 2003, 65, 578–586. [Google Scholar]
  14. Galle, B.; Oppenheimer, C.; Geyer, A.; McGonigle, A.J.S.; Edmonds, M.; Horrocks, L.A. A miniaturised ultraviolet spectrometer for remote sensing of SO2 fluxes: A new tool for volcano surveillance. J. Volcanol. Geotherm. Res. 2003, 119, 241–254. [Google Scholar] [CrossRef]
  15. Galle, B.; Johansson, M.; Rivera, C.; Zhang, Y.; Kihlman, M.; Kern, C.; Lehmann, T.; Platt, U.; Arellano, S.; Hidalgo, S. Network for Observation of Volcanic and Atmospheric Change (NOVAC)—A global network for volcanic gas monitoring: Network layout and instrument description. J. Geophys. Res. 2010, 115, D05304. [Google Scholar] [CrossRef]
  16. Burton, M.; Caltabiano, T.; Salerno, G.; Mure, F.; Condarelli, D. Automatic measurements of SO2 flux on Stromboli using a network of scanning ultraviolet spectrometers. Geophys. Res. Abstr. 2004, 6, 03970. [Google Scholar]
  17. Burton, M.R.; Caltabiano, T.; Murè, F.; Salerno, G.; Randazzo, D. SO2 flux from Stromboli during the 2007 eruption: Results from the FLAME network and traverse measurements. J. Volcanol. Geotherm. Res. 2009, 182, 214–220. [Google Scholar] [CrossRef]
  18. Kern, C. Spectroscopic Measurements of Volcanic Gas Emissions in the Ultra-violet Wavelength Region. Ph.D. Thesis, University of Heidelberg, Heidelberg, Germany, 2009. [Google Scholar]
  19. Vita, F.; Inguaggiato, S.; Bobrowski, N.; Calderone, L.; Galle, B.; Parello, F. Continuous SO2 flux measurements for Vulcano Island, Italy. Ann. Geophys. 2012, 55, 2012. [Google Scholar] [CrossRef]
  20. Inguaggiato, S.; Vita, F.; Cangemi, M.; Mazot, A.; Sollami, A.; Calderone, L.; Morici, S.; Jacome Paz, M.P. Stromboli volcanic activity variations inferred by fluids geochemistry observations: Sixteen years of continuous soil CO2 fluxes monitoring (2000–2015). Chem. Geol. 2017. [Google Scholar] [CrossRef]
  21. Inguaggiato, S.; Diliberto, I.S.; Federico, C.; Paonita, A.; Vita, F. Review of the evolution of geochemical monitoring, networks and methodologies applied to the volcanoes of the Aeolian Arc (Italy). Earth-Sci. Rev. 2018, 176, 241–276. [Google Scholar] [CrossRef]
  22. Carapezza, M.L.; Inguaggiato, S.; Brusca, L.; Longo, M. Geochemical precursors of the activity of an open-conduit volcano: The Stromboli 2002-2003 eruptive events. Geoph. Res. Lett. 2004, 31, L07620. [Google Scholar] [CrossRef]
  23. Inguaggiato, S.; Vita, F.; Rouwet, D.; Bobrowski, N.; Morici, S.; Sollami, A. Geochemical evidence of the renewal of volcanic activity inferred from CO2 soil and SO2 plume fluxes: The 2007 Stromboli eruption (Italy). Bull. Volcanol. 2011. [Google Scholar] [CrossRef]
  24. Inguaggiato, S.; Vita, F.; Cangemi, M.; Calderone, L. Changes in CO2 Soil Degassing Style as a Possible Precursor to Volcanic Activity: The 2019 Case of Stromboli Paroxysmal Eruptions. Appl. Sci. 2020, 10, 4757. [Google Scholar] [CrossRef]
  25. Finizola, A.; Sortino, F.; Lénat, J.F.; Valenza, M. Fluid circulation at Stromboli volcano (Aeolian Islands, Italy) from self-potential and CO2 surveys. J. Volcanol. Geotherm. Res. 2002, 116, 1–18. [Google Scholar] [CrossRef] [Green Version]
  26. Madonia, P.; Campilongo, G.; Cangemi, M.; Carapezza, M.L.; Inguaggiato, S.; Ranaldi, M.; Vita, F. Hydrogeological and Geochemical Characteristics of the Coastal Aquifer of Stromboli Volcanic Island (Italy). Water 2021, 13, 417. [Google Scholar] [CrossRef]
  27. Inguaggiato, S.; Vita, F.; Cangemi, M.; Calderone, L. Increasing Summit Degassing at the Stromboli Volcano and Relationships with Volcanic Activity (2016–2018). Geosciences 2019, 9, 176. [Google Scholar] [CrossRef] [Green Version]
  28. Giudicepietro, F.; Calvari, S.; Alparone, S.; Bianco, F.; Bonaccorso, A.; Bruno, V.; Caputo, T.; Cristaldi, A.; D’Auria, L.; De Cesare, W.; et al. Integration of Ground-Based Remote-Sensing and In Situ Multidisciplinary Monitoring Data to Analyze the Eruptive Activity of Stromboli Volcano in 2017–2018. Remote Sens. 2019, 11, 1813. [Google Scholar] [CrossRef] [Green Version]
  29. Chiodini, G.; Cioni, R.; Guidi, M.; Raco, B.; Marini, L. Soil CO2 flux measurements in volcanic and thermal areas. Appl. Geochem. 1998, 13, 543–552. [Google Scholar] [CrossRef]
  30. Brusca, L.; Inguaggiato, S.; Longo, M.; Madonia, P.; Maugeri, R. The 2002–2003 eruption of Stromboli (Italy): Evaluation of the volcanic activity by means of continuous monitoring of soil temperature, CO2 flux, and meteorological parameters. Geochem. Geophys. Geosyst. 2004, 5, Q12001. [Google Scholar] [CrossRef]
  31. Madonia, P.; Brusca, L.; Inguaggiato, S.; Longo, M.; Morici, S. Variations of soil temperature, CO2 flux, and meteorological parameters. In Learning from Stromboli and its 2002–2003 eruptive crisis. American Geophysical Union. Wash. DC Am. Geophys. Union Geophys. Monogr. Ser. 2008, 182, 269–277. [Google Scholar]
  32. Capasso, G.; Carapezza, M.L.; Federico, C.; Inguaggiato, S.; Rizzo, A. Geochemical monitoring of the 2002–2003 eruption at Stromboli volcano (Italy): Precursory changes in the carbon and helium isotopic composition of fumarole gases and thermal waters. Bull. Volcanol. 2005, 68, 118–134. [Google Scholar] [CrossRef]
  33. Inguaggiato, C.; Vita, F.; Diliberto, I.S.; Calderone, L. The role of the aquifer in soil CO2 degassing in volcanic peripheral areas: A case study of Stromboli Island (Italy). Chem. Geol. 2016. [Google Scholar] [CrossRef]
  34. Giudicepietro, F.; López, C.; Macedonio, G.; Alparone, S.; Bianco, F.; Calvari, S.; De Cesare, W.; Delle Donne, D.; Di Lieto, B.; Esposito, A.M.; et al. Geophysical precursors of the July-August 2019 paroxysmal eruptive phase and their implications for Stromboli volcano (Italy) monitoring. Sci. Rep. 2020, 10, 10296. [Google Scholar] [CrossRef] [PubMed]
Figure 1. (a) Location of the study area. (b) Map of Stromboli island with location of wells (white circle), Fulco (FUL), Saibbo (SAI), Zurro (ZUR), COA, Limoneto (LIM), Piscità (PIS); soil CO2 monitoring stations STR01 and STR02 (red circles; photos in the insets); main tectonic lineaments of active fault N41° and N64° (red dashed lines). (c,d) Reddish ash deposits from the 16 November 2020 major explosion on Le Schicciole beach and along the streets of the Stromboli village. (e) Eruptive column of the 16 November major explosion. Photos courtesy of the association AttivaStromboli (www.attivastromboli.net, accessed on 30 March 2021).
Geosciences 11 00169 g001
Figure 2. (a) Daily average CO2 fluxes at STR02 station, 2000–2019 period. The effusive eruptions of 2000, 2007, and 2014 have been inserted (vertical green bar) together with the paroxysmal events (vertical red lines) that occurred in 5 April 2003; 15 March 2007; 3 July; and 28 August 2019. Green and orange horizontal dashed lines have been plotted indicating, respectively, the baseline values and threshold value for the CO2 fluxes at STR02 (see [5,21,23]). The insets of the higher degassing rate periods have been plotted together with the major explosions (vertical blue lines) occurred. (b) Daily average CO2 fluxes at STR02 station, June 2010–December 2013 period, with the abrupt CO2 degassing rate of 16 g m−2 d−2 . (c) Daily average CO2 fluxes at STR02 station, 2016–2018 period, with the abrupt CO2 degassing rate of 24 g m−2 d−2. (d) Daily average CO2 fluxes at STR02 station, October 2018–June 2019 period with the abrupt CO2 degassing rate of 32 g m−2 d−2.
Geosciences 11 00169 g002
Figure 3. Daily average STR01 CO2 flux (blue column) vs. time (2017–2021), and STR01 daily average air temperature (red line). The cyclic behavior of CO2 fluxes and air temperature is very clear, with maximum and minimum values recorded for both parameters during the hot and cold season, respectively.
Geosciences 11 00169 g003
Figure 4. (a) Cumulative probability diagram of log CO2 flux; the data distribution highlights three main degassing families with respectively 10 (B), 30 (HL), and 60% (HH) of cumulated frequency representing respectively the biological soil respiration, hydrothermal low degassing, and hydrothermal high degassing. (b) Histogram of log CO2 flux frequency.
Geosciences 11 00169 g004
Figure 5. Correlation graphic between daily CO2 fluxes and air temperatures. A high correlation has been found, with R2 equal to 0.88.
Geosciences 11 00169 g005
Figure 6. (a) Cumulated probability of CO2 fluxes calculated and plotted for each year of acquisition. The increase of the higher and lower family’s values for each year from 2017 to 2020 is visible. (b) The cumulated probability of air temperature plotted for each year shows a clear decrease of higher family’s values (hot temperature) from 2017 to 2021 and an increase of lower family’s values (cold temperature).
Geosciences 11 00169 g006
Figure 7. Sketch of the dynamic equilibrium model, modified from [20,23]. (a) Normal Strombolian activity. Volatiles exsolved from the magma standing in the deeper plumbing system interact with shallow fluids, feeding the shallow hydrothermal activity and diffuse soil degassing, whose output to the atmosphere maintains the dynamic equilibrium. (b) When the deep input considerably increases, the dynamic equilibrium is altered and the shallow system tries to restore it, increasing the outputs.
Geosciences 11 00169 g007
Figure 8. Daily average CO2 fluxes (residuals) filtered and normalized to the average temperature (25 °C) of the 2017–2021 period. The 30 day running average (white line) and the 3rd degree polynomial fit (green line) have been plotted. The main events of volcanic activity (major explosions, paroxysm, and lava flow) have been reported too.
Geosciences 11 00169 g008
Publisher’s Note: MDPI stays neutral with regard to jurisdictional claims in published maps and institutional affiliations.

