Article

Liquefaction Phenomena Induced by the 26 November 2019, Mw = 6.4 Durrës (Albania) Earthquake and Liquefaction Susceptibility Assessment in the Affected Area

by
Spyridon Mavroulis
1,*,
Efthymios Lekkas
1 and
Panayotis Carydis
2
1
Department of Dynamic Tectonic Applied Geology, Faculty of Geology and Geoenvironment, National and Kapodistrian University of Athens, 15784 Athens, Greece
2
European Academy of Sciences and Arts, A-5020 Salzburg, Austria
*
Author to whom correspondence should be addressed.
Submission received: 5 April 2021 / Revised: 7 May 2021 / Accepted: 12 May 2021 / Published: 14 May 2021
(This article belongs to the Section Natural Hazards)

Abstract

:
On 26 November 2019, an Mw = 6.4 earthquake struck the central-western part of Albania. Its impact comprises secondary earthquake environmental effects (EEE) and severe building damage within the Periadriatic and the Tirana Depressions. EEE comprised mainly liquefaction phenomena in coastal, riverine, and lagoonal sites of the earthquake-affected area. From the evaluation of all available earthquake-related data, it is concluded that liquefaction sites are not randomly distributed within the affected area but are structurally and lithologically controlled. The affected areas are distributed within NW–SE striking zones formed in graben-like syncline areas with NW–SE trending fold axes. These graben-like areas are bounded by NW–SE striking marginal thrust faults and are filled with geological formations of Neogene to Quaternary age. These NW–SE striking zones and structures coincide with the NW–SE striking seismogenic thrust fault of the November 2019 earthquake as it is derived from the provided fault plane solutions. An approach for liquefaction susceptibility assessment is applied based on geological and seismological data and on liquefaction inventory. From the comparison of the compiled liquefaction inventory and the susceptibility maps, it is concluded that the majority of the observed liquefaction has been generated in very high and high susceptible areas.

1. Introduction

On 26 November 2019, an Mw = 6.4 earthquake struck the central-western Albania (Figure 1) with impact on the local population, the natural environment, buildings and lifelines [1,2]. Earthquake environmental effects comprising mainly liquefaction phenomena as well as severe structural and non-structural building damage have been observed in the municipalities of Durrës, Tirana, Krujë, Shijak, Kamëz, Kavajë, Kurbin, and Lezhë [1,3,4] (Figure 1).
Few hours after the mainshock on 26 November 2019, the authors visited the earthquake-affected areas in order to assist the local authorities and civil protection agencies and to offer scientific and technical assistance not only to the authorities of the affected country but also to search and rescue teams that have arrived from several countries to assist Albania’s efforts to rescue and recover. Moreover, post-event field surveys were conducted from 26 to 28 November 2019 [1] and again from 14 to 16 December 2019 [3,4]. It comprised integration of geological reconnaissance, field macroseismic survey and Unmanned Aerial Vehicle (UAV) survey in order to detect and map the earthquake-induced ground deformation features and their impact on buildings and infrastructures of the most affected areas including Durrës city.
This paper emphasizes on the liquefaction phenomena induced by the 26 November 2019, Mw = 6.4 Durrës earthquake and comprises their presentation and detailed description of their type and their spatial distribution detected during the aforementioned field reconnaissance along with the liquefaction history and the liquefaction potential of the earthquake-affected area. Moreover, a method for the assessment of the liquefaction susceptibility of the earthquake-affected area is also presented and applied. It is based on geological criteria (age, lithology, and depositional environment), seismological criteria (peak ground acceleration based on the updated seismic hazard maps of Albania), and liquefaction inventory (liquefaction induced by historical and recent earthquakes). The final product is the liquefaction susceptibility map of the 26 November 2019, Mw = 6.4 earthquake-affected area. A comparison of both liquefaction inventory and susceptibility map is also conducted in order to draw conclusions on the spatial distribution of the liquefaction phenomena induced by the earthquake. Additionally, the factors controlling the distribution of the ground deformation features are also studied and discussed.

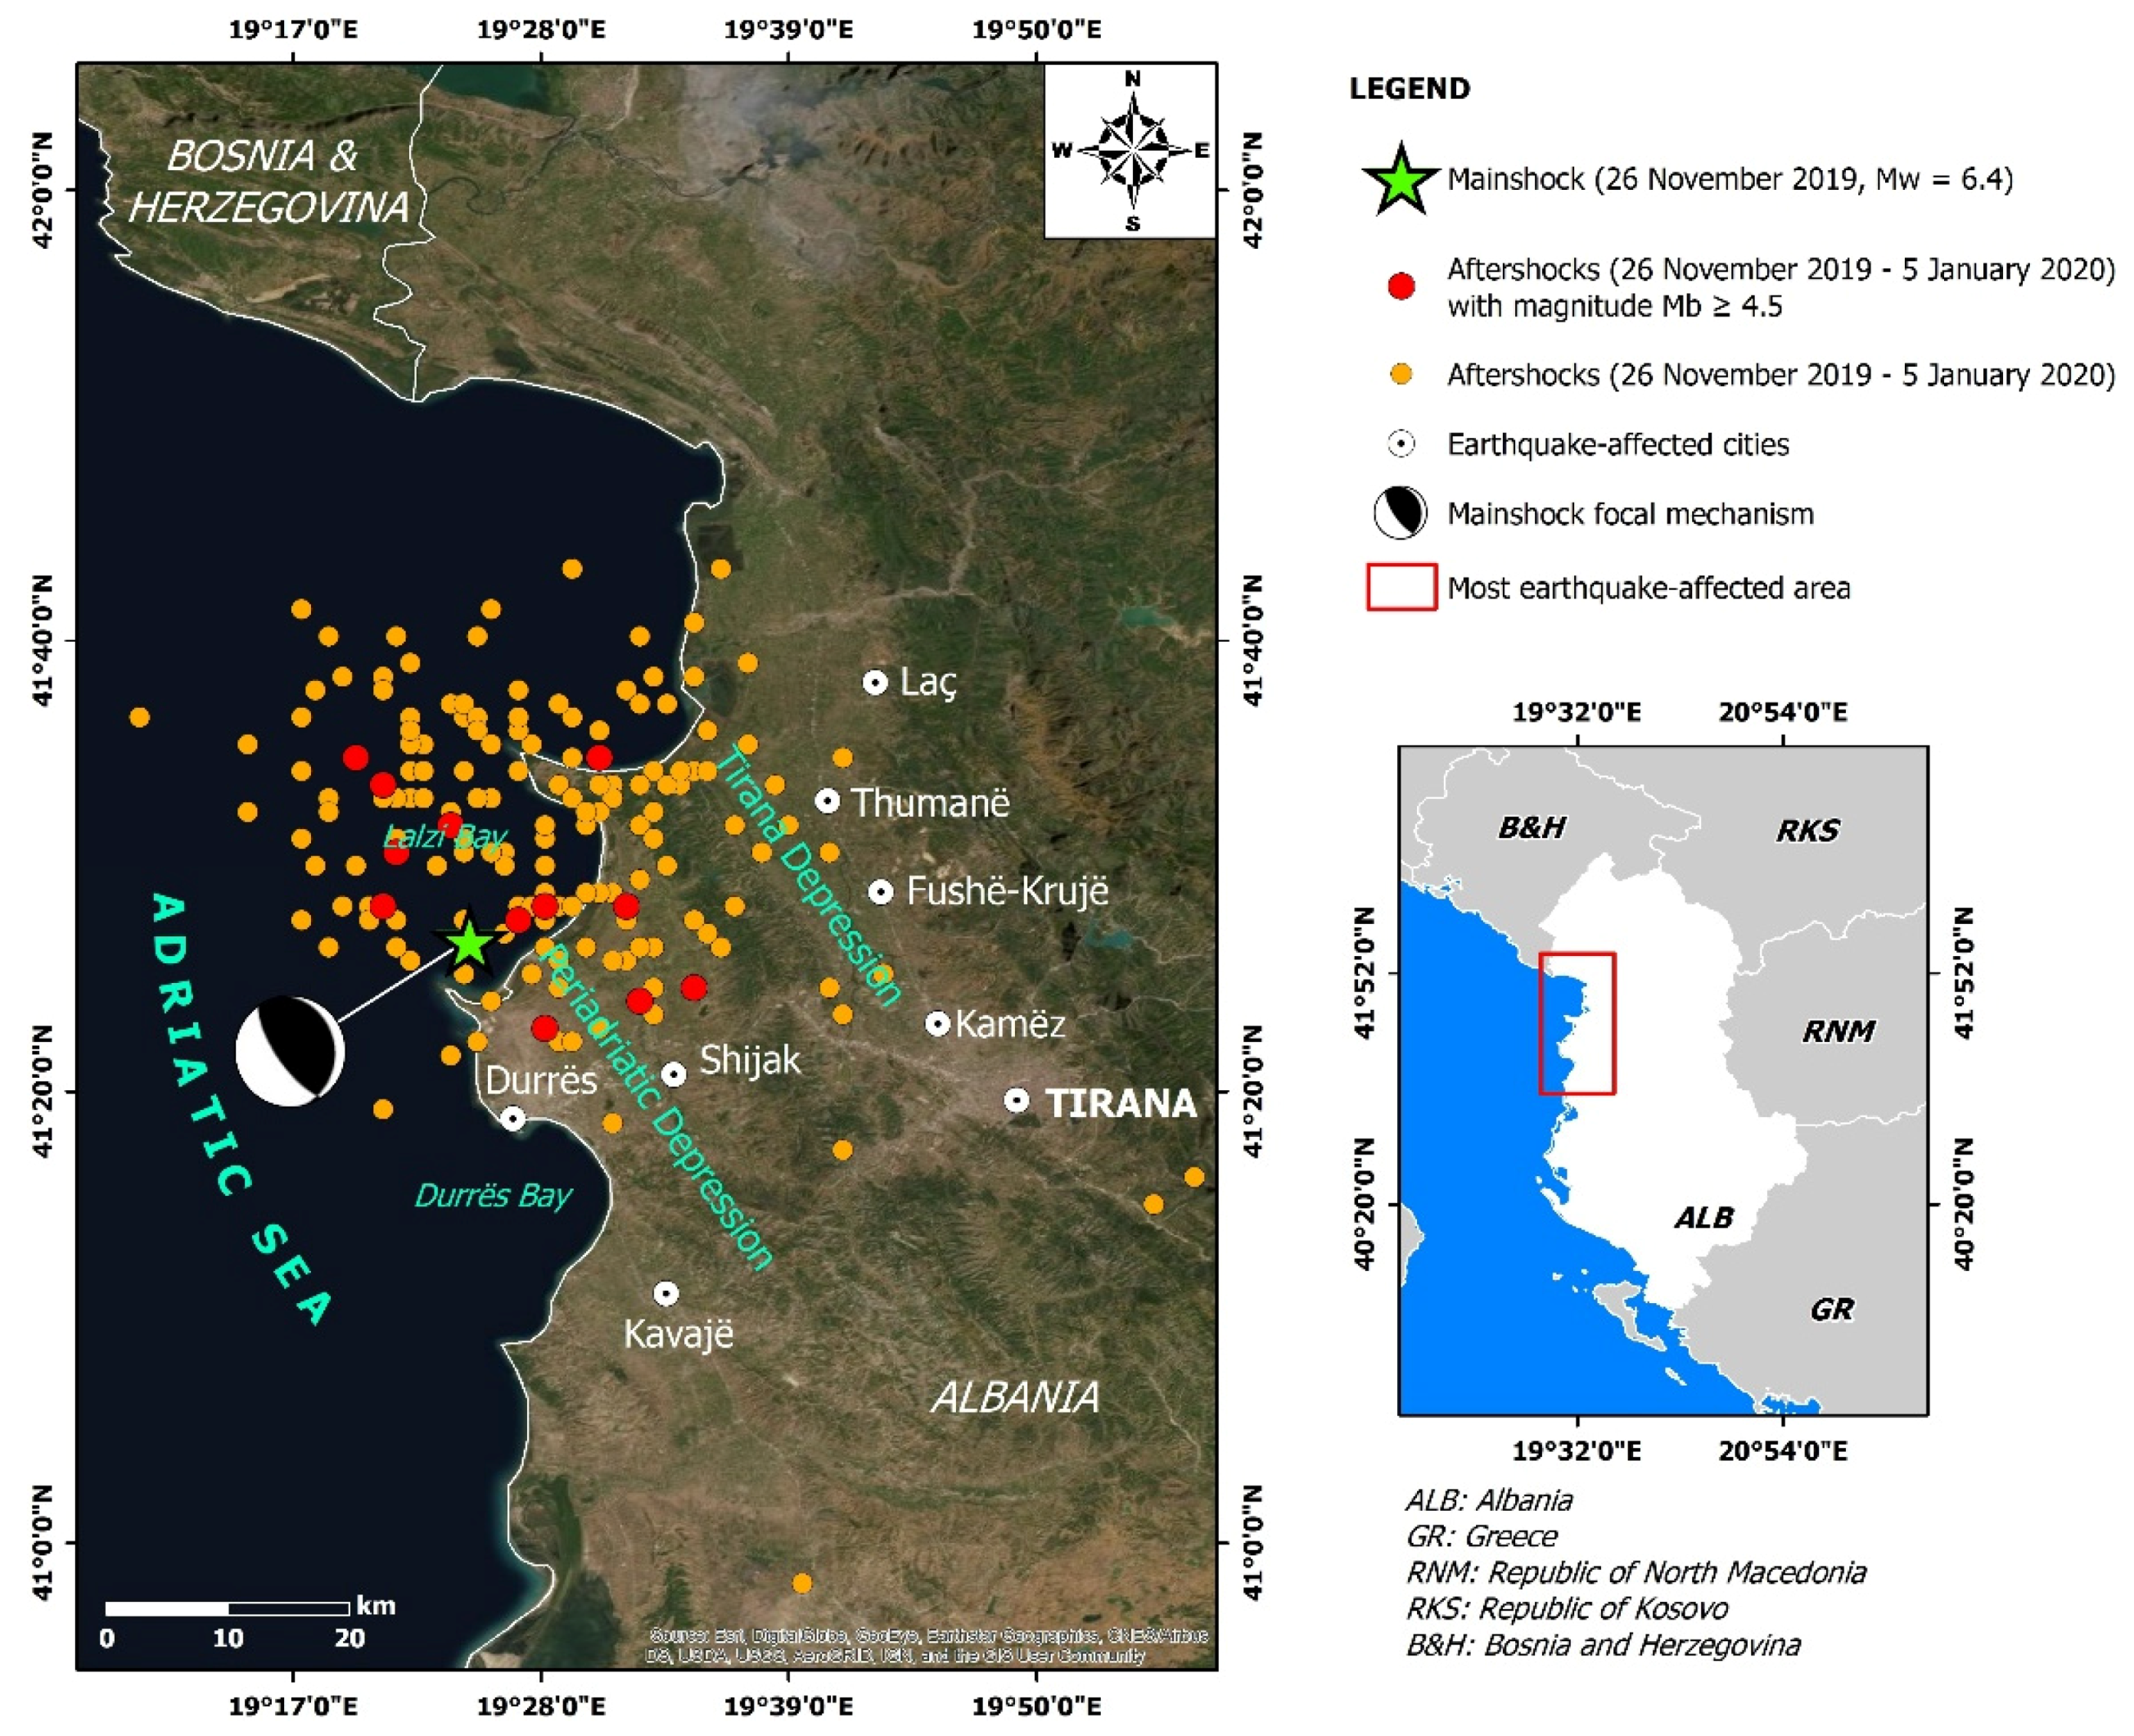
2. The 26 November 2019, Mw = 6.4, Durrës (Albania) Earthquake

On 26 November 2019, at 02:54:12 GMT (03:54:12 CET), an earthquake struck the central western part of Albania (Figure 1). It was assessed as Mw = 6.4 [2]. Based on P and S phases recorded mainly in Greek stations and by using velocity models, Papadopoulos et al. [2] recalculated the hypocenter location and found an epicenter (41.4453° N, 19.4141° E) located offshore, in Lalzi Bay, but close to the coast, at a distance of about 17 km north of Dürres (Figure 1).
From regional tectonics, the causal fault is a NW–SE striking and E–NE dipping reverse fault [2], implying that the affected area is situated at the hangingwall domain of the causative fault. The rupture was complex. One main patch was observed at the south and a second one at the north with maximum slips of ~1.5 and ~1 m, respectively [2]. As regards the prevailing component of the rupture process, the thrust-type component prevailed as the rake vector at the main slip area was 99° [2].
Based on [5], the earthquake occurred deep in the crust on a low-angle (23°) fault dipping towards E, with a centroid at 16.5 km depth, while the best-fitting length and width of the fault are 22 and 13 km, and the reverse slip, 0.55 m. Its geometry coincides with a blind thrust fault that may root on the main basal thrust, along the thrust front that separates Adria–Apulia from Eurasia.
Based on the preliminary report on the 26 November 2019, Mw = 6.4 Durrës earthquake and the analysis of its aftershock sequence conducted by [6], it is concluded that the slow decrease in the number of aftershocks with time is characterized by several repeated gaps, which have been subsequently followed by an increase in the observed magnitude. The aftershock sequence until 5 January 2020, based on the earthquake catalogues provided by the EMSC, included 173 aftershocks with magnitude 3.0 ≤ ML ≤ 4.5 and 8 aftershocks with magnitude ML > 4.5 (Figure 1). Taking into account the focal mechanism solution using the moment tensor inversion applied to all aftershocks with local magnitude ML > 3.8 conducted by [6], it is concluded that the majority of the aftershocks has been generated by rupture of a thrust fault. From the horizontal projection of slip and the distribution of the recorded aftershocks, it is concluded that the deformation area coincides with the area of aftershocks determined by the EMSC [2].
The Albania main shock was felt in the neighboring Bosnia and Herzegovina, Montenegro, Serbia, North Macedonia, and Greece, especially in Corfu Island located at the northern part of the Ionian Islands, fortunately without fatalities and effects on the natural and built environment. In Albania, the most affected areas were the port city of Durrës and the town of Thumanë at the central-western Albania, while damage was also reported in Tirana, Krujë, Shijak, Kamëz, Kavajë, Kurbin, and Lezhë areas [1,3,4] (Figure 1). The destruction has been attributed to the synergy of several factors comprising strong ground motion (maximum peak ground acceleration = 192 cm/s2 in Durrës), soil liquefaction, site amplification, poor building workmanship and construction quality, aging of building materials, impact of the previous 21 September 2019, Mw = 5.6 foreshock on buildings, and pre-existing stress on buildings sustaining differential displacements because of soft soil conditions in their foundations [1,2]. In the most affected areas of Durrës and Thumanë, the estimated maximum seismic intensity was VIII–IX based on the Modified Mercalli Intensity scale and the European Macroseismic Scale 1998 (EMS-98) [2].
Unfortunately, the earthquake claimed the lives of 51 people. The number of injured were large reaching more than 900. More than 900 families have been evacuated from the affected areas and were in post-earthquake shelters and assembly areas for the first days of the emergency phase and later in unaffected hotel facilities in the adjacent Vlora area. Based on the emergency report of the International Federation of Red Cross and Red Crescent Societies, the total number of people affected in terms of damage in property is estimated to be 80,000–100,000.

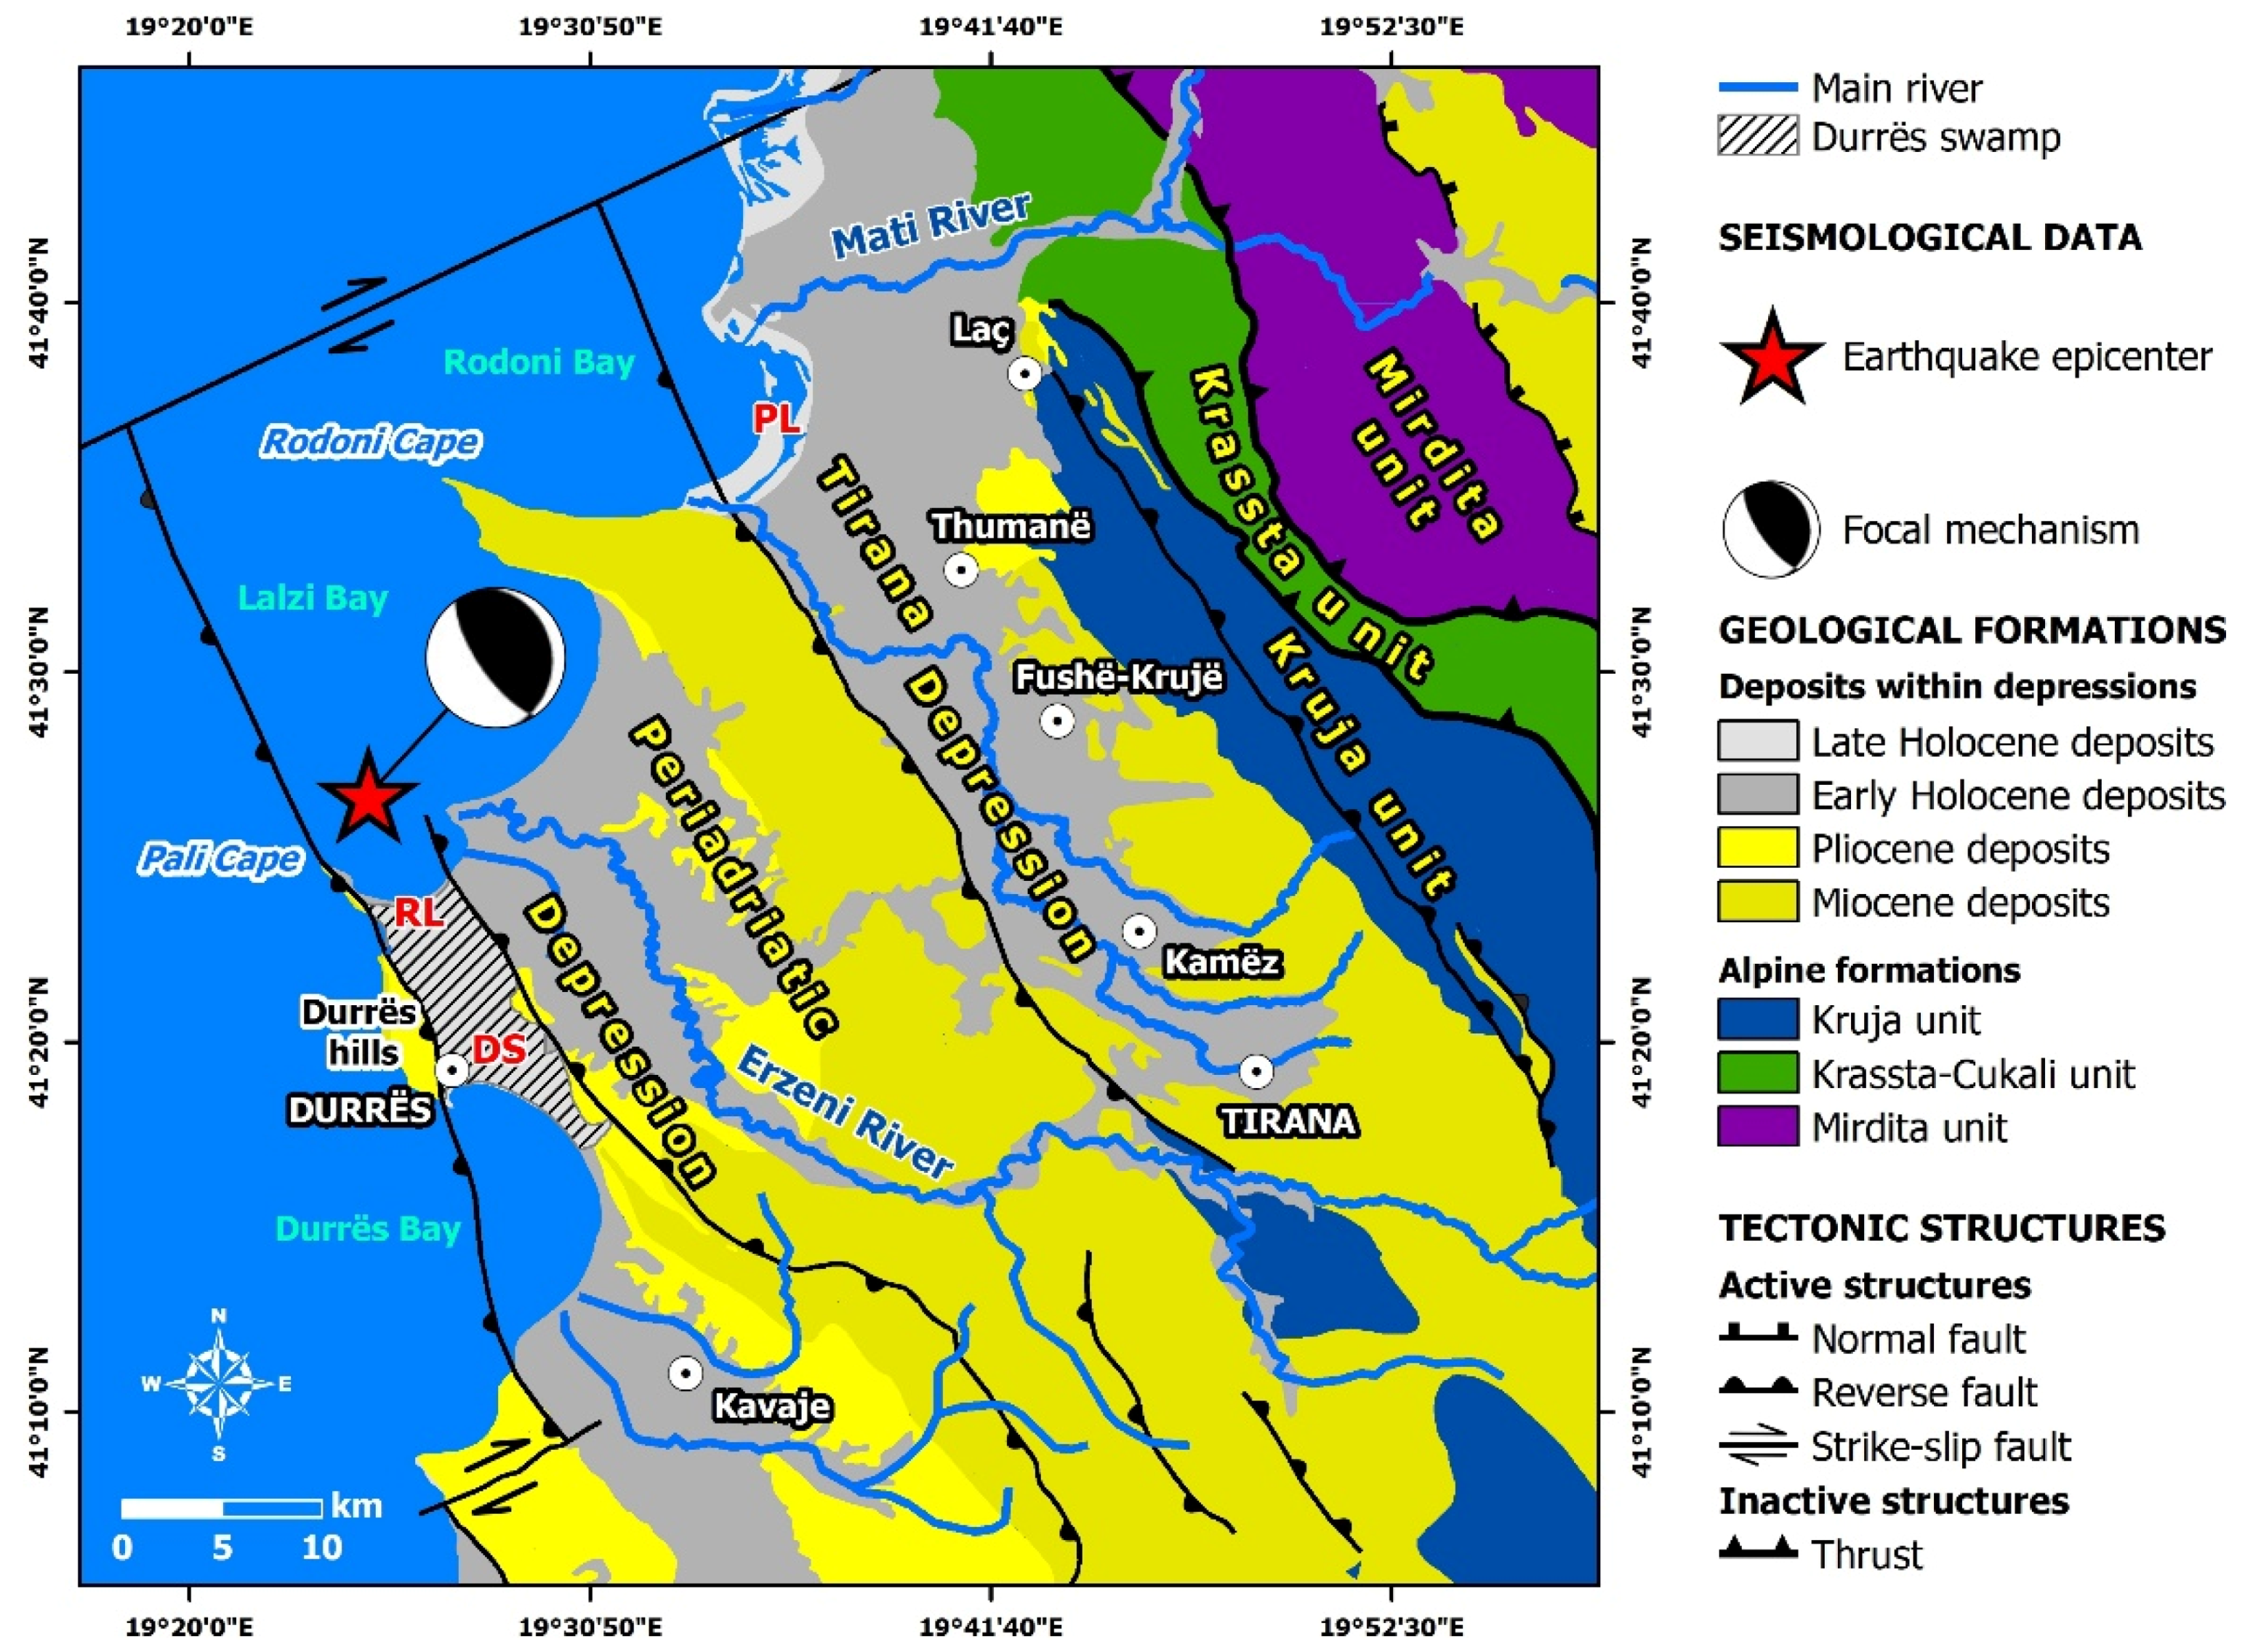
3. Geology of the Earthquake-Affected Areas

3.1. Western Most Affected Area

The alpine basement of Durrës area is composed of formations of the Ionian geotectonic unit (Figure 2). The central and western parts of the Ionian unit constitute the Periadriatic Depression, which is mainly filled with Neogene formations comprising clays, marls, conglomerates and sandstones (Figure 2). One of the main tectonic characteristics of the Periadriatic Depression is the occurrence of the successive linear relatively narrow anticlines and wide synclines of Miocene–Pliocene age [7,8], corresponding to hilly areas and flat lowlands respectively [8]. Two such structures are observed in Durrës city and its surroundings: (i) the Durrës anticline corresponding to Durrës and Bishti i Palles hills located west and north of the city and (ii) the Spitalia syncline corresponding to Durrës plain [7,8] (Figure 2).
The Durrës anticline is composed of Miocene formations and Pliocene deposits (Figure 2). The Miocene formations comprise Messinian molassic formations including clay, siltstone, sandstone and gypsum, with thickness reaching 3 km and dip 60° to 70° to the east. They outcrop along the western side of Durrës hills and Bishti i Palles hills close to Pali Cape at the southern end of Lalzi Bay (Figure 2). The central and eastern part of Durrës hills are composed of Pliocene deposits (Figure 2) including the Helmesi formation, which is composed mainly of sandstones, conglomerates and clays with sandstone lenses, with total thickness of 1200 to 1300 m.
The Durrës hills corresponding to Durrës anticline is separated from the Durrës plain corresponding to Spitalia syncline by an active NW–SE striking thrust fault (Durrës backthrust) (Figure 2), which belongs to the Ionian-Adriatic longitudinal seismogenic zone responsible for the high historical and recent seismicity of the study area [9]. This fault is observed onshore in the eastern side of Durrës hills and it disrupts the formations of the Pali Cape (Figure 2). Its northward and southward offshore extensions within Lalzi Bay and Durrës Bay respectively are displaced by strike-slip faults (Figure 2). More specifically, its northward offshore extension within Lalzi Bay is terminated against a NE–SW striking active strike-slip fault, while its southward offshore extension within Durrës Bay is displaced to the west by a NE–SW striking active strike-slip fault [7] (Figure 2).
The Spitalia syncline, under the Durrës plain area, is filled up with the Pliocene Helmesi formation (Figure 2). This formation represents the basements of the overlain Quaternary deposits. These deposits include alluvial, lagoonal, and coastal marine deposits with a total thickness of 130 m. More specifically, alluvial deposits are composed of intercalations of gravels, sands, clayey sands, and clays with maximum total thickness of about 70 m. Lagoonal deposits are observed above the alluvial ones and represent the marshy deposits of the Durrës plain area, where the Durrës swamp was formed before its artificial draining (Figure 2). The marshy deposits include clay, clayey loam, and sand and they are full of organic material. Their maximum thickness has been measured at the central part of the former swamp and is about 50 m.
The lowlands of Durrës used to be a swamp, which has been temporarily influenced by the Adriatic Sea. This temporary interaction was terminated after the construction of the road leading from Porto Romano to the Bishti i Palles hills (Figure 2), which acted as a barrier. Nowadays, due to the low morphological slope of these lowlands, the water is drained into the sea through artificial drainage channels and pumping stations. A large part of the former swamp has been illegally inhabited due to the fact that the area has suffered from rapid and uncontrolled urbanization and population growth attributed to internal immigration of population from the northern parts of Albania.
The Holocene marine deposits of the Durrës plain occurred along the coastal part of the affected area and especially along the coast of the Lalzi Bay in the northern part of Durrës, along the Porto Romano coastal area and along the coastal area south of the metropolitan area of Durrës (Figure 2). They consist of sands and clayey sands with maximum thickness of about 20 m.
As regards the hydrology of the western earthquake-affected area, it constitutes a part of the Erzeni River basin (Figure 2). The Erzeni River basin in the earthquake affected area is composed of Quaternary alluvial deposits comprising gravels with thickness ranging from 2 to 5 m [10]. As regards its hydrogeological features, it is characterized by the formation of the Rogozhina aquifer. In terms of its water potential, this aquifer is the second most significant in Albania, following the Quaternary alluvial aquifers. It is composed of permeable sandstones, conglomerates, and intercalations of impermeable clays [11,12]. These formations belong to the Pliocene formations of the Periadriatic Depression [11,12]. Its basement is composed of impermeable clays, while its top is covered by semi-permeable Quaternary deposits [11,12]. The semi-permeable Quaternary deposits covering the aquifer comprise alluvial deposits including sandy clays, silts, silty sands, sands, gravels and pebbles, marshy deposits including loam, clays, silts, sands, and organic material in decomposition as well as marine sediments composed mainly of sands [12]. Due to this hydrogeological setting, it constitutes a multilayered aquifer under typically artesian conditions [11]. Unfortunately, this aquifer has been overexploited in Durrës area due to its aforementioned rapid population growth and uncontrolled urban development and expansion [7] especially in the coastal and the littoral zone.

3.2. Eastern Most Affected Area

The Laç, Thumanë, Fushë-Krujë, and Kamëz towns and the Tirana city are founded in the eastern inland part of the Periadriatic Depression. As mentioned above, the Periadriatic Depression is characterized by narrow anticlines and wide synclines [7,8]. In the inland earthquake affected area, such structure is the Tirana syncline [7,8], which is commonly referred as Tirana Depression (Figure 2).
The Tirana Depression is a NW–SE trending basin with length of about 60 km and width ranging from 10 to 20 km. It is located at the front of the west-verging Dinaric thrust belt and it corresponds to an asymmetric syncline, which is considered as a foredeep filled up with a mainly deep-marine sedimentary succession in the offshore Albania. The present Tirana Depression is composed mainly of continental and shallow marine deposits, while its deep marine formations of Oligocene—Early Miocene and Middle—Late Miocene crop out along its western margin [13] (Figure 2). The sedimentary sequence of the Tirana Depression comprises deposits of Aquitanian—Burdigalian—Helvetian—Tortonian age on its western part and of Tortonian age on its eastern part [14]. The deposits of the western part of the Tirana Depression lie unconformably on Oligocene formations. They also present unconformities between Aquitanian and Burdigalian formations and at the base of Tortonian [13]. On the eastern part of the depression the sequence lies unconformably on Oligocene and Cretaceous formations [13].
The Tirana Depression is bounded to the east by an active thrust (Dajti thrust) (Figure 2) and to the west by an active backthrust (Preza backthrust) [7] (Figure 2). These active tectonic structures are clearly discernible and form impressive escarpments. More specifically, the backthrust along the western margin of the Tirana Depression or along the flank of the Tirana plain forms a morphological discontinuity between the Tirana plain with elevation of few meters above sea level and the Preza monocline with elevation of about 300 m above sea level. These active structures constitute a zone responsible for the generation of many earthquakes.
The aforementioned most affected residential areas are located along the eastern margin of the Tirana Depression and close to the morphological discontinuity formed between the Tirana plain area and the adjacent semi-mountainous and mountainous areas of Kruja unit [15] (Figure 2). The alpine basement of the eastern margin comprises Oligocene flysch and Upper Cretaceous limestone, while Miocene formations are overlying the alpine basement. Pliocene and Holocene deposits are overlying Miocene formations. The most affected towns along the eastern margin of the Tirana Depression are founded mainly on Holocene deposits.

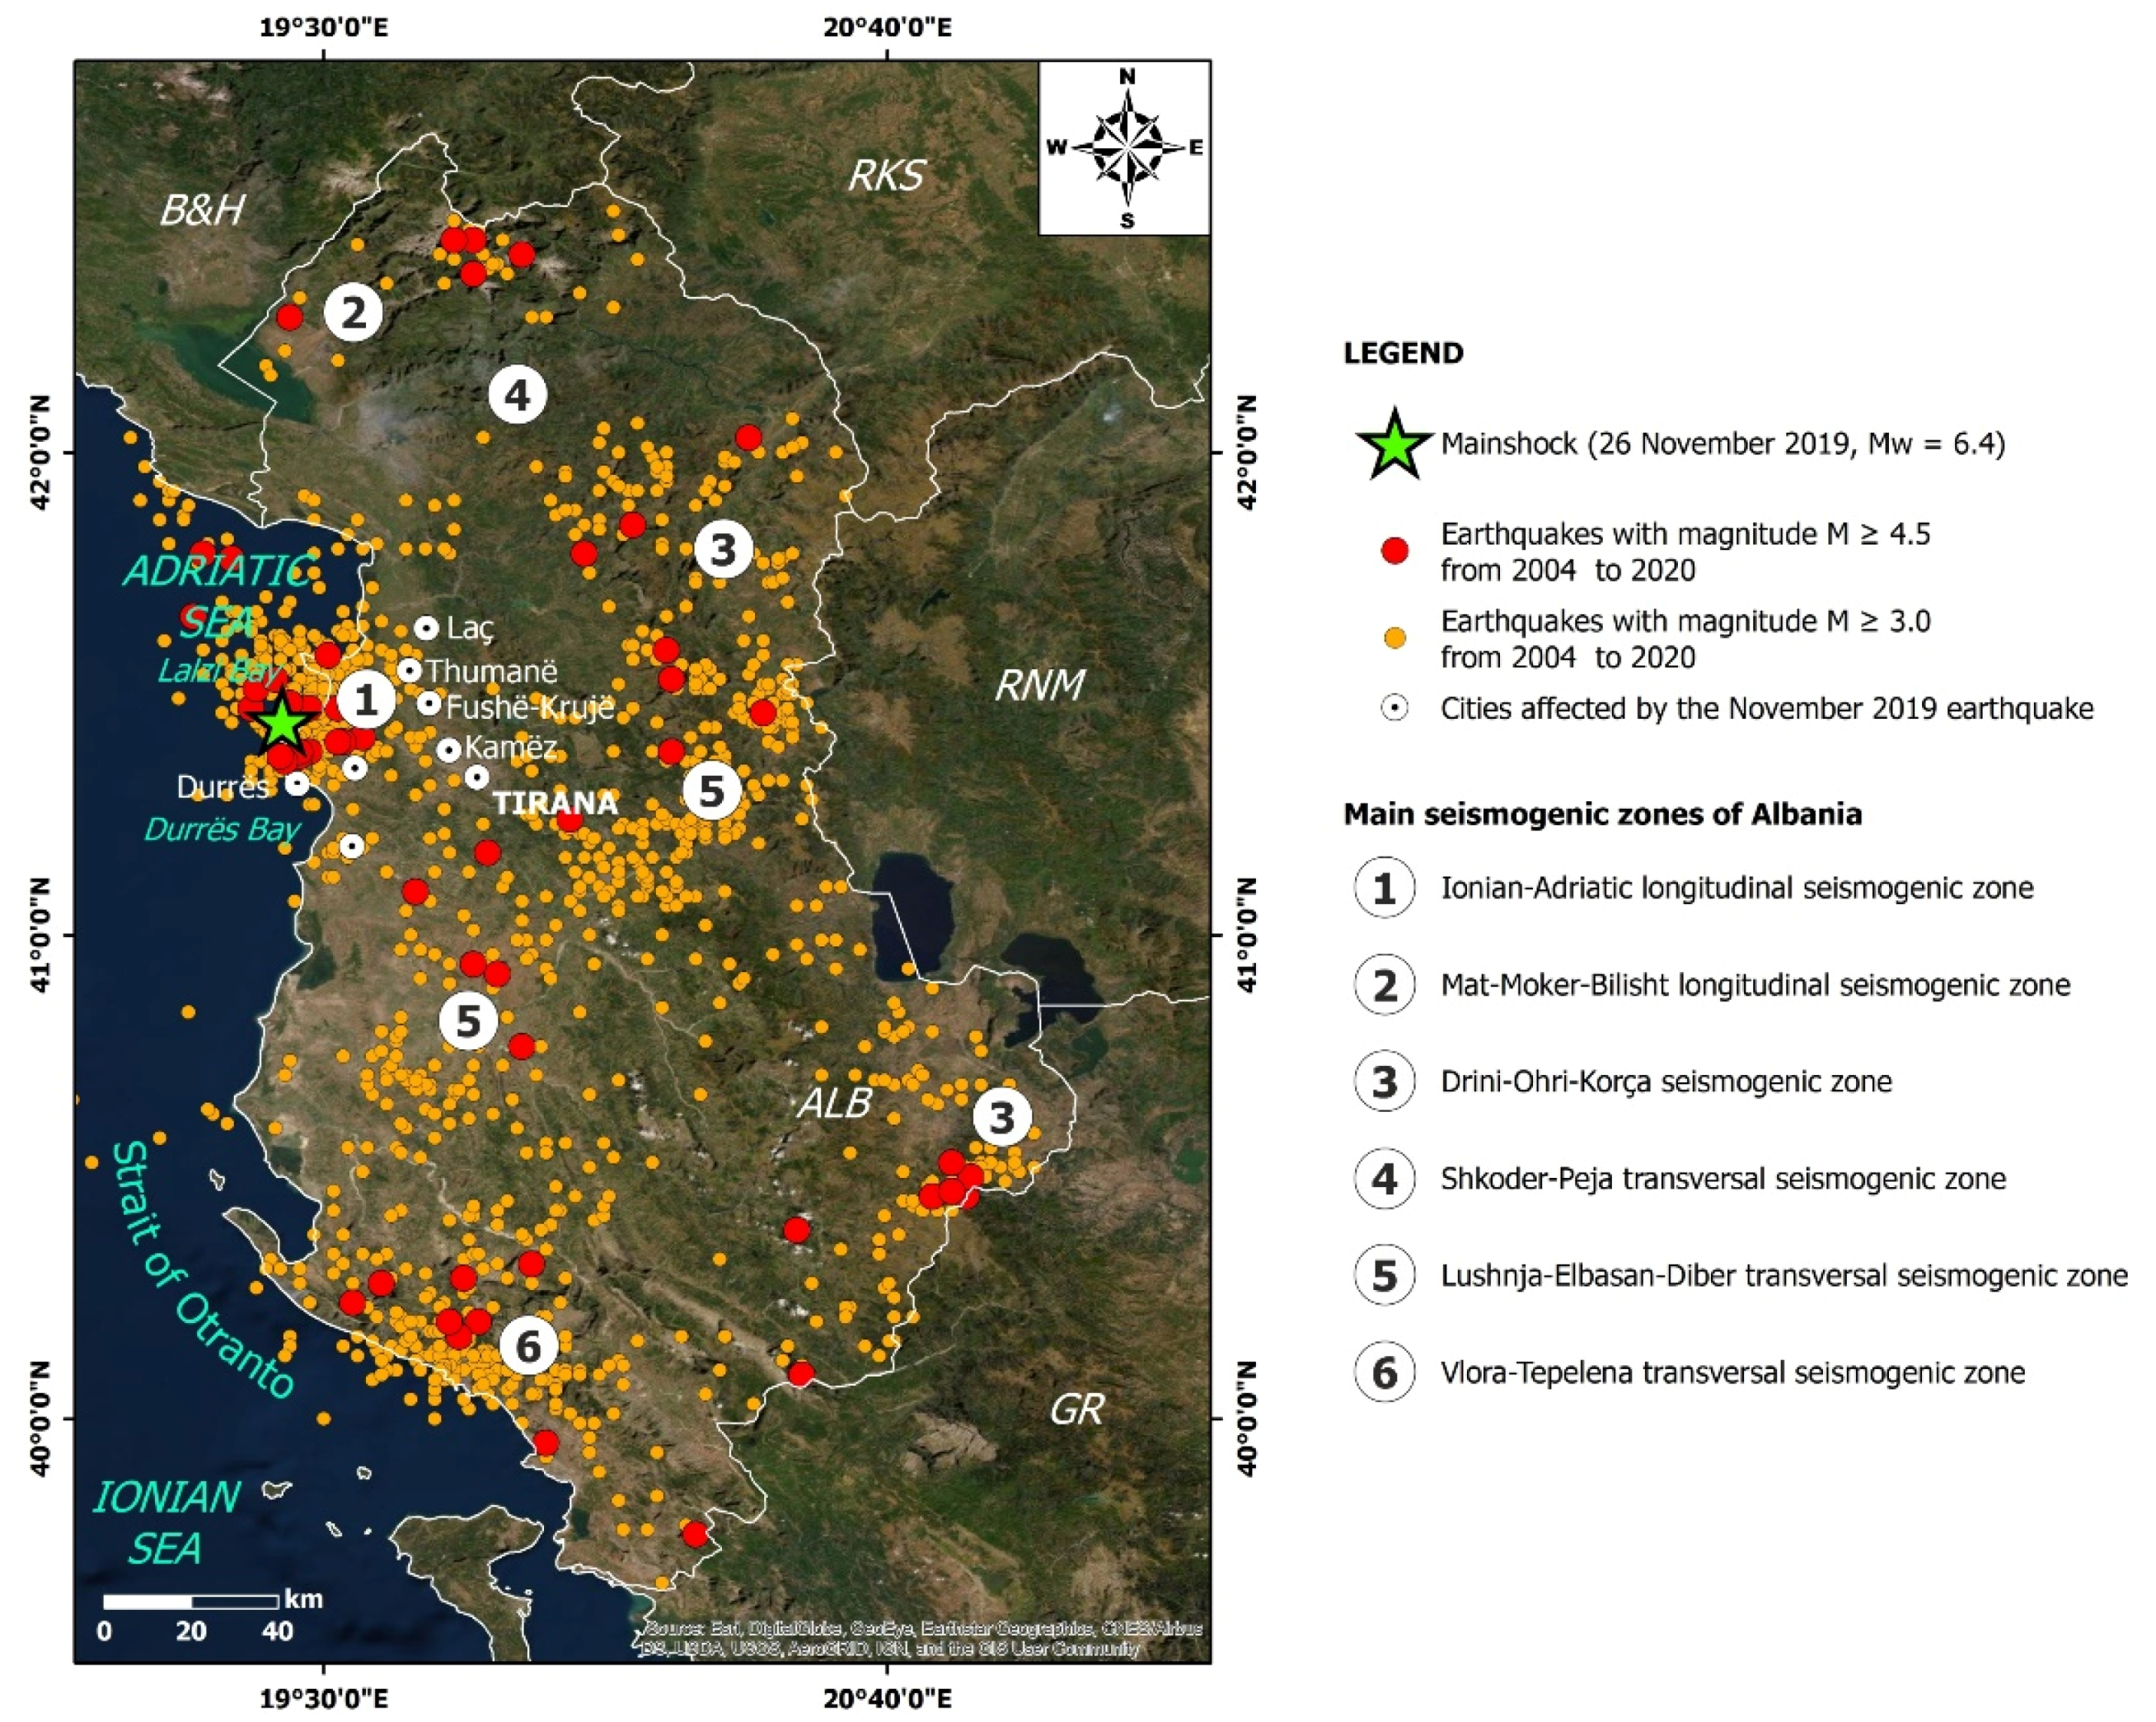
4. Historical and Recent Seismicity of the November 2019 Durrës Earthquake-Affected Area

Albania is one of the most seismic active countries of Europe [16,17,18]. Its seismicity is characterized by an intensive seismic microactivity (1.0 < M ≤ 3.0), many small earthquakes (3.0 < M ≤ 5.0), rare medium-sized earthquakes (5.0 < M ≤ 7), and rare large earthquakes (M > 7.0) [19,20,21]. The majority of the historical and recent seismicity have been generated along well defined seismogenic zones (Figure 3), including the NW–SE trending Ionian-Adriatic longitudinal seismogenic coastal zone in western Albania among others [9,22,23]. The Ionian-Adriatic seismogenic zone marks the boundary between the Adriatic microplate and the Albanian orogen [9] (Figure 3). It extends from the NE-SW trending Shkodra-Peja seismogenic zone located northwards to the Lushnja-Elbasan-Diber transversal seismogenic zone [9]. The maximum expected magnitude along the Ionian-Adriatic zone is M = 6.9, while the seismicity gradually declines from the folded front to the east.
Durrës city is located within the Ionian-Adriatic seismogenic zone (Figure 3). The ancient Durrës city was founded in 627 BC by Greek colonists from Corinth (eastern Central Greece) and Corfu (northern part of the Ionian Islands) and is one of the oldest inhabited areas of Albania. Through the years, Durrës has been affected not only by the beneficial effects of its conquerors, but also by the destructive impact of natural phenomena due to its geomorphological and geological setting described above. These natural phenomena comprise mainly earthquakes and their effects on its natural and built environment [16,18,24,25,26,27,28,29]. Based on the aforementioned sources, Durrës has been almost totally destroyed by earthquakes generated on 177 BC, 58 BC, 334 AD, 346 AD, 506 AD, 521, 1273, 1279, 1869, and 1870 resulting in severe human and economic losses [18,29]. More specifically, the earthquakes of 334, 345 and 506 AD with maximum Medvedev–Sponheuer–Karnik (MSK or MSK-64) intensity IMAX = VIII–IXMSK-64, the 1273 and 1926 earthquakes with IMAX = IXMSK-64 forced the local population to abandon the devastated Durrës [18,29]. Especially for the 1273 earthquake, Durrës with population of 25,000 people has been totally destroyed. Many fatalities were reported and the affected survivors left the town seeking for other places to live. After this earthquake the importance of Durrës as a city port in the Adriatic Sea has been diminished.
Apart from these earthquakes that have razed Durrës to the ground, the city has been also affected by earthquakes with lower macroseismic intensities and slight damage. These events were generated on 26 August 1852, 16 May 1860, 4 February 1934, 19 August 1970, and 9 January 1988 resulting in maximum macroseismic intensities IMAX = VIMSK-64 [30].
The most significant seismic events that have affected the eastern part of Tirana Depression are the 1617 Kruja earthquake with Io = VIIIMSK-64, the 26 August 1852 earthquake in Rodoni Cape with Io = VIIIMSK-64, the 16 May 1860 earthquake in Beshiri Bridge with Io = VIIIMSK-64, the 4 February 1934 Ndroq earthquake with magnitude Ms = 5.6, the 19 August 1970 Vrapi earthquake with magnitude Ms = 5.5 and Io = VIIMSK-64, the 16 September 1975 Rodoni Cape earthquake with magnitude Ms = 5.3, the 22 November 1985 Drini Gulf earthquake with magnitude Ms = 5.5, and the 11 January 1988 Tirana earthquake with magnitude Ms = 5.4 and Io = VII–VIIIMSK-64 [31,32].

5. Liquefaction Induced by the November 2019 Durrës Earthquake

The 26 November 2019, Mw = 6.4 Durrës earthquake induced secondary earthquake environmental effects comprising slope movements and liquefaction phenomena. In this chapter, emphasis is given on the induced liquefaction phenomena along with the liquefaction history, the expected surface deformation and the liquefaction potential of the earthquake-affected areas.

5.1. Liquefaction History of the Area Affected by the November 2019 Earthquake

During strong earthquakes of the 20th century in Albania, earthquake-induced liquefaction phenomena have been observed mainly in the Periadriatic Depression [18,33,34,35,36,37] (Figure 4). The main types of observed liquefaction phenomena from 1905 to 1979 comprise: (i) lateral spreading and ground settlements, (ii) ejection of liquefied material from ground cracks and formation of sand boils and (iii) failure of riverbanks [18,28] (Figure 4). Characteristic earthquakes that have triggered liquefaction along the western part of Albania are the 1905, 1926, 1948, 1959, 1962, and 1979 earthquakes [18,28,34].

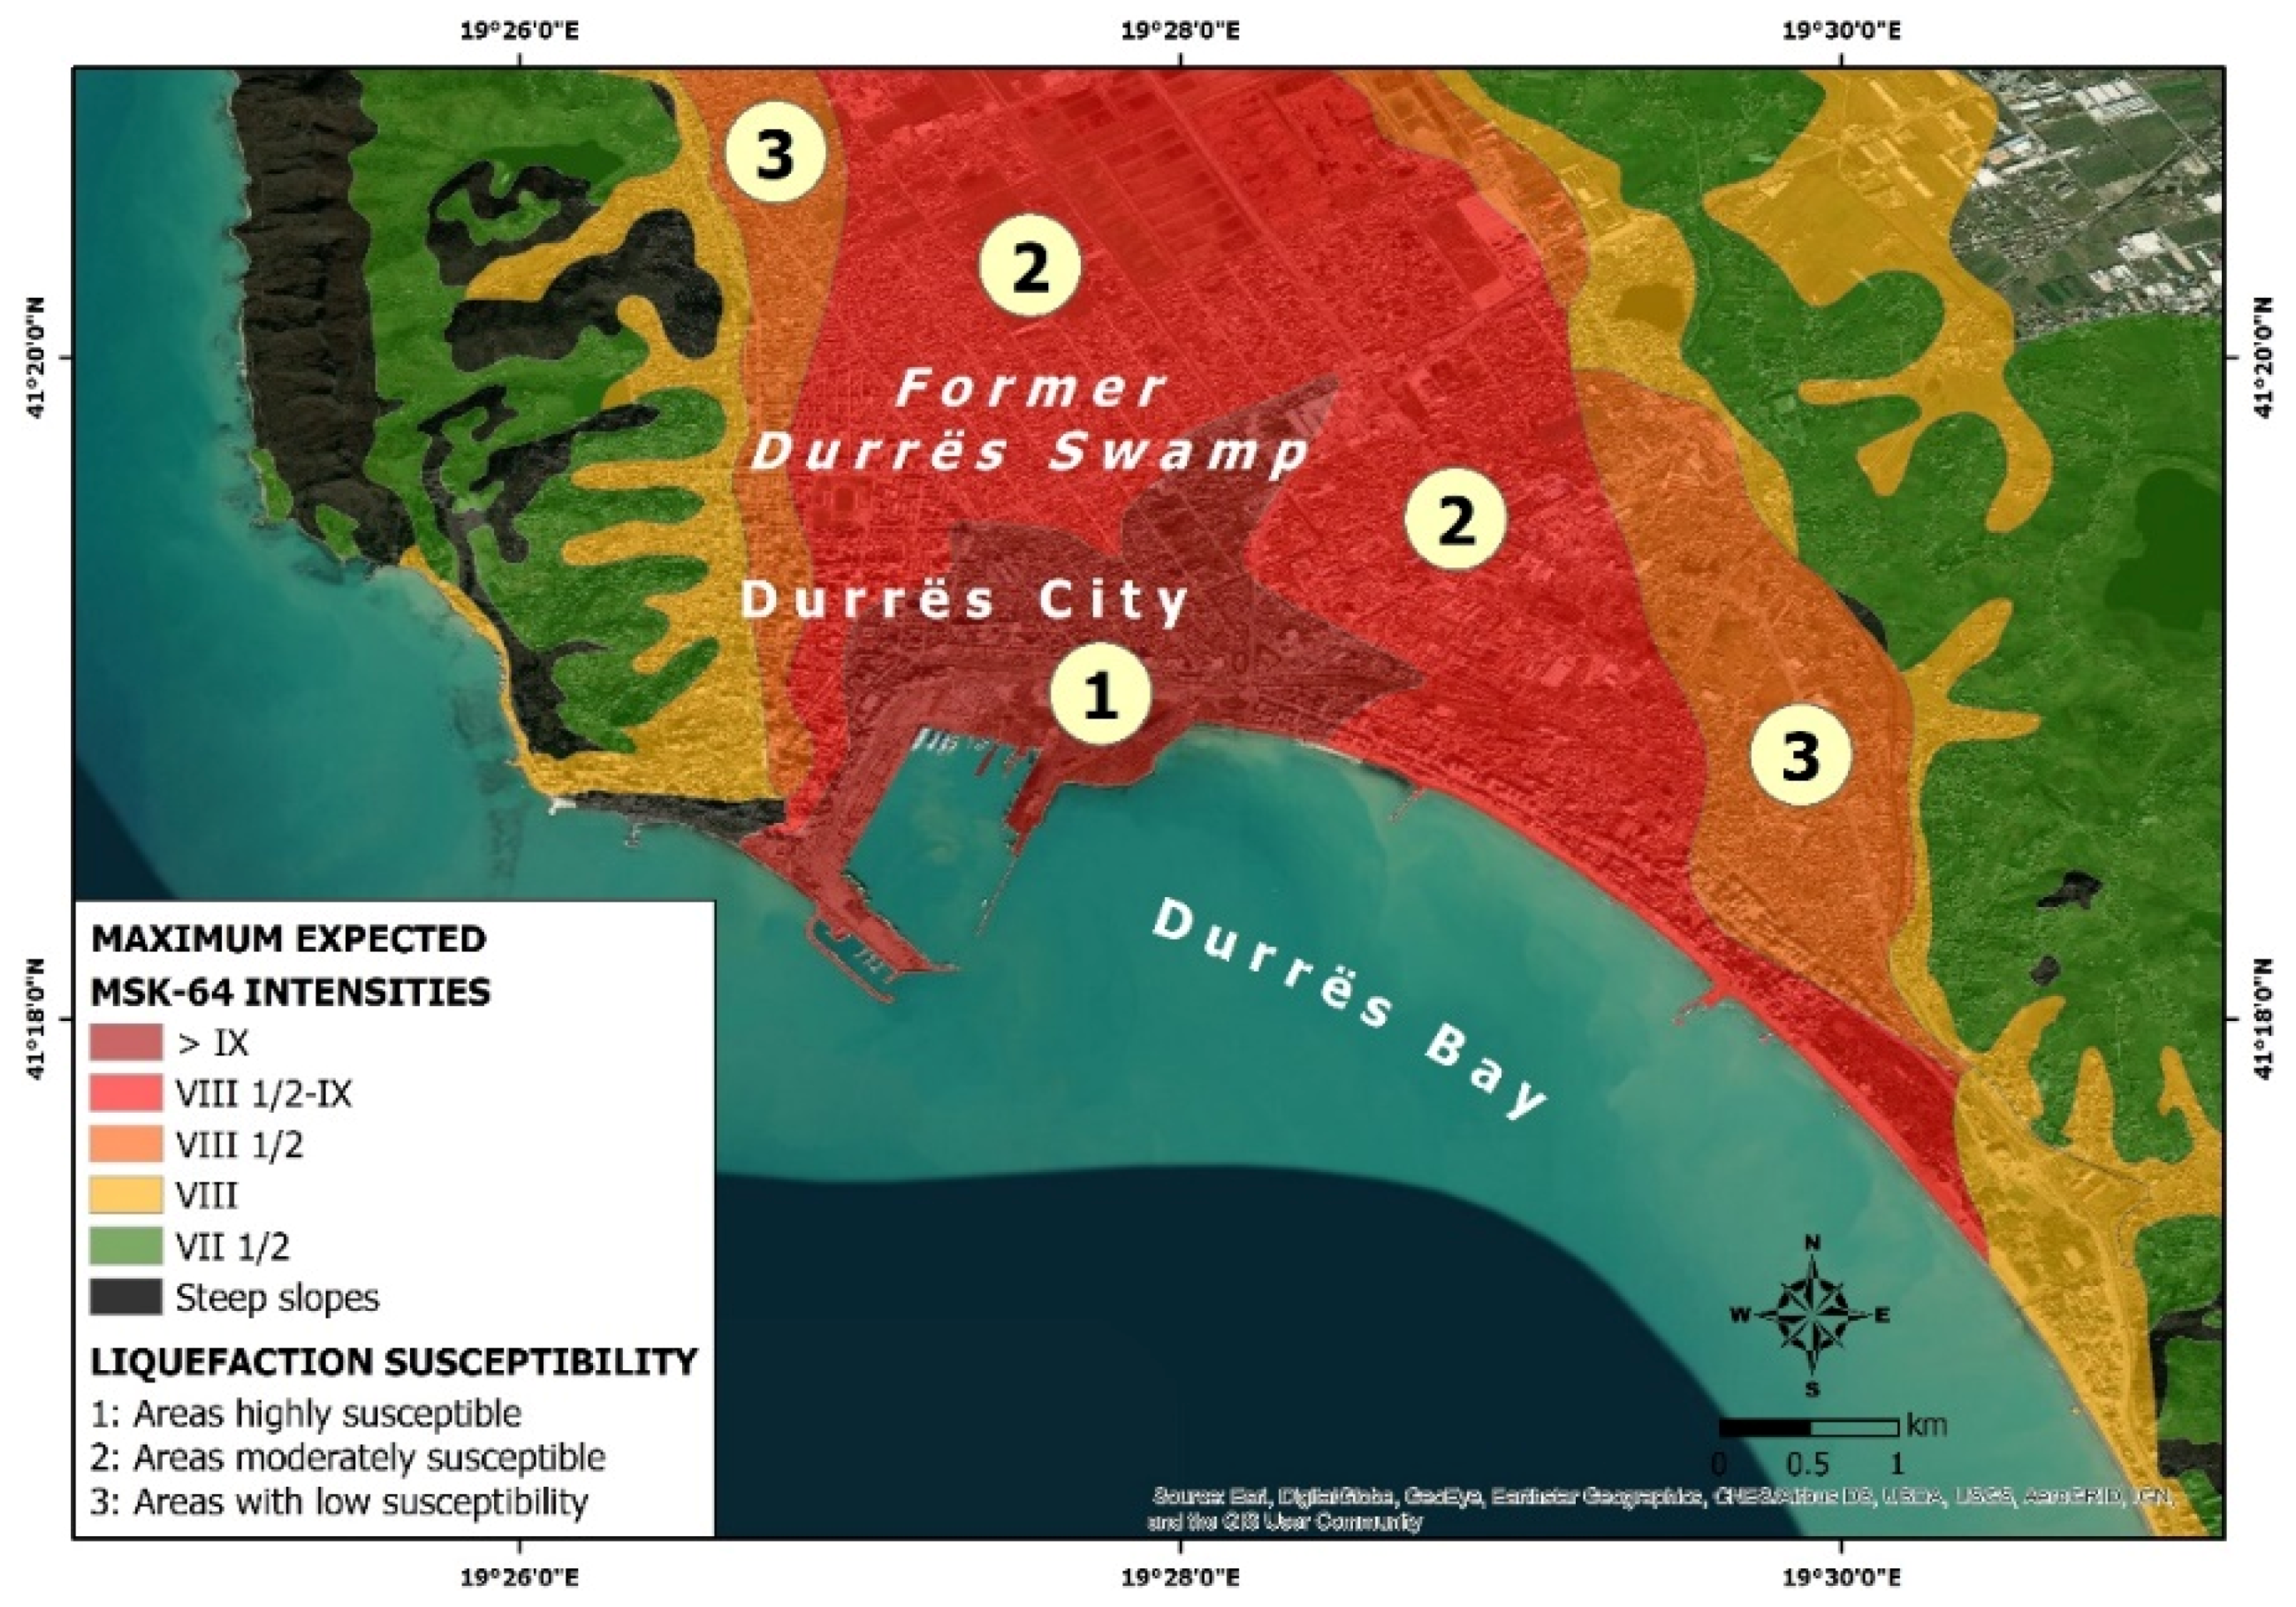
5.2. Deformation Expected in Durrës Affected Area and its Liquefaction Potential

Based on the microzonation map of Durrës city expressed through seismic intensity in degrees of the MSK-64 scale [18], it is concluded that the Durrës city is an area, where big deformations on the free surface are expected in the event of an earthquake including liquefaction phenomena among others. Moreover, three smaller areas within Durrës city are also observed with different predominant periods and expected seismic intensities (Figure 5):
  • Areas of big deformation on free surface, with predominant periods larger than 0.5–0.6 s and seismic intensities larger than IXMSK-64.
  • Areas with predominant periods equal to 0.4–0.5 s and seismic intensities ranging from VIII½MSK-64 to IXMSK-64.
  • Steep slopes more than 15°.
Taking into account the geological and tectonic setting of Durrës area described above, the spatial distribution of the induced liquefaction phenomena along the western coastal part of the Periadriatic Depression [28] and from analytical approaches performed by [28] for the assessment of liquefaction potential in Durrës city, it is concluded that it is an area with high potential for liquefaction (Figure 5). More specifically, three areas with different potential for liquefaction can be distinguished in the city: (i) areas highly susceptible, (ii) areas moderately susceptible, and (iii) areas of low susceptibility to liquefaction [28] (Figure 5). The highly susceptible area is the metropolitan area of Durrës comprising the port and the surrounding areas (Figure 5), which is composed by Holocene marshy deposits. The area with moderate potential to liquefaction consists of Holocene alluvial deposits, while the area with low susceptibility to liquefaction comprises Pliocene deposits with clays and conglomerates [14].

5.3. Liquefaction Phenomena Induced by the November 2019 Earthquake

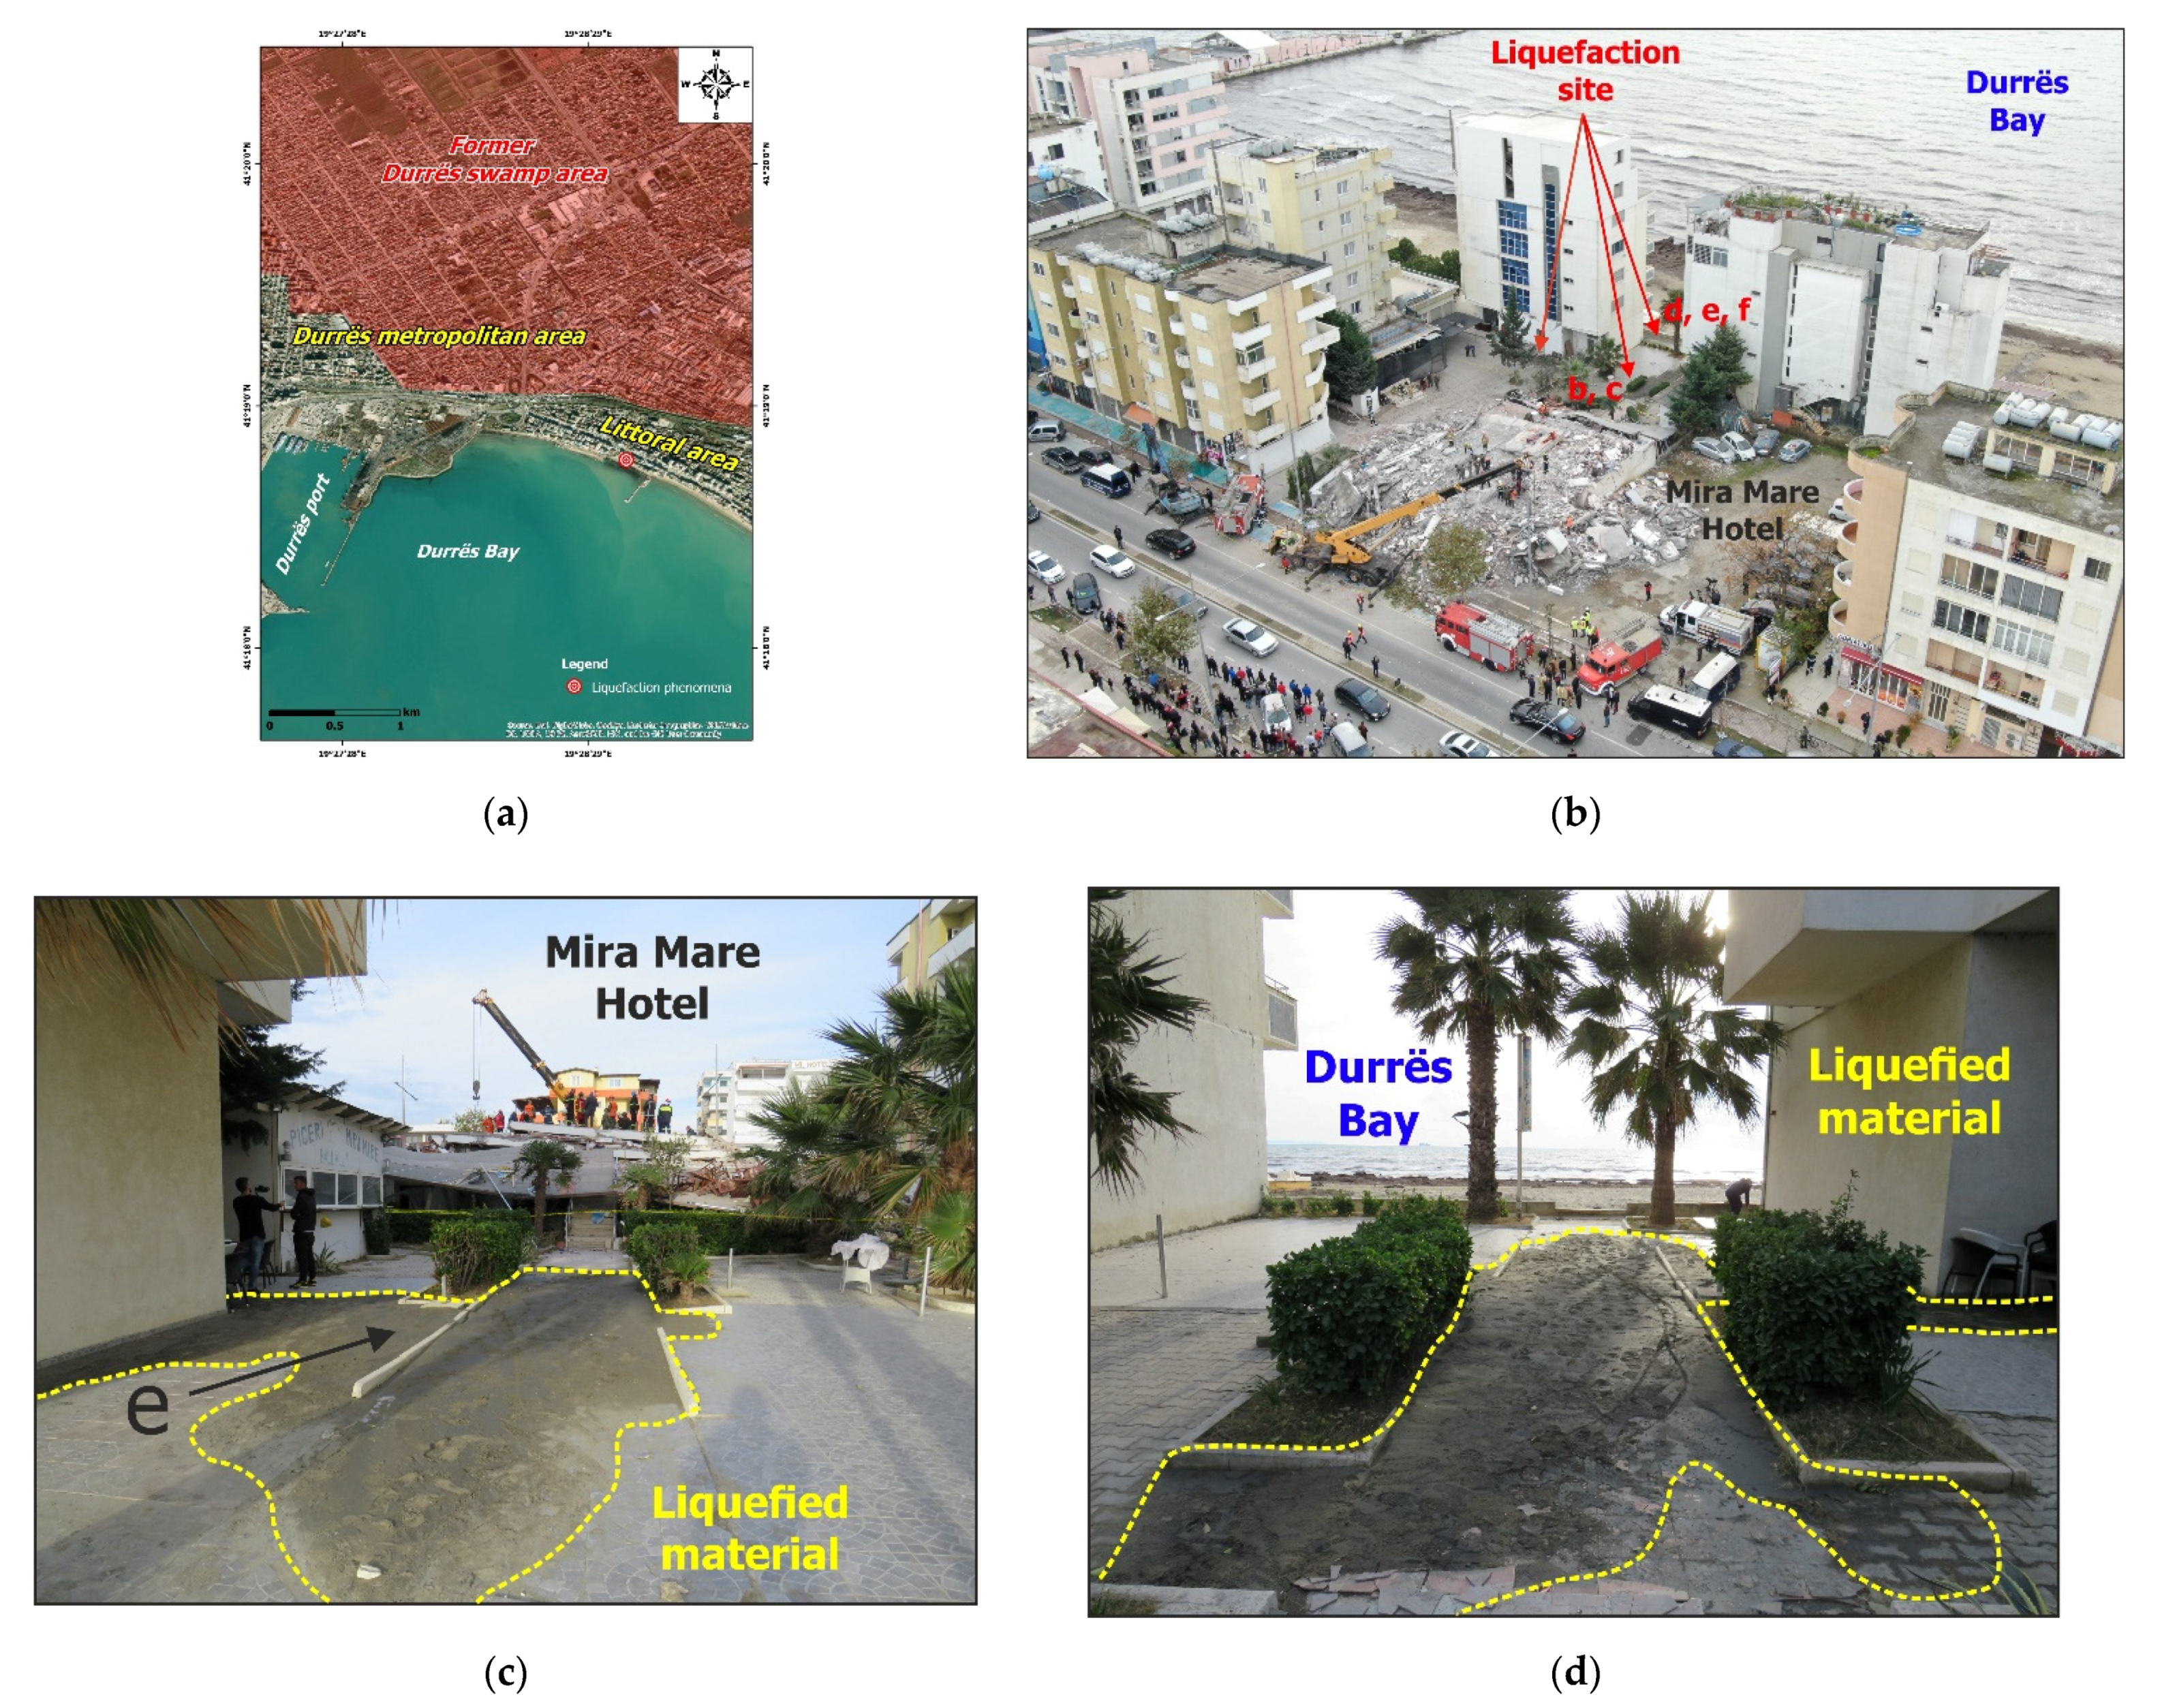
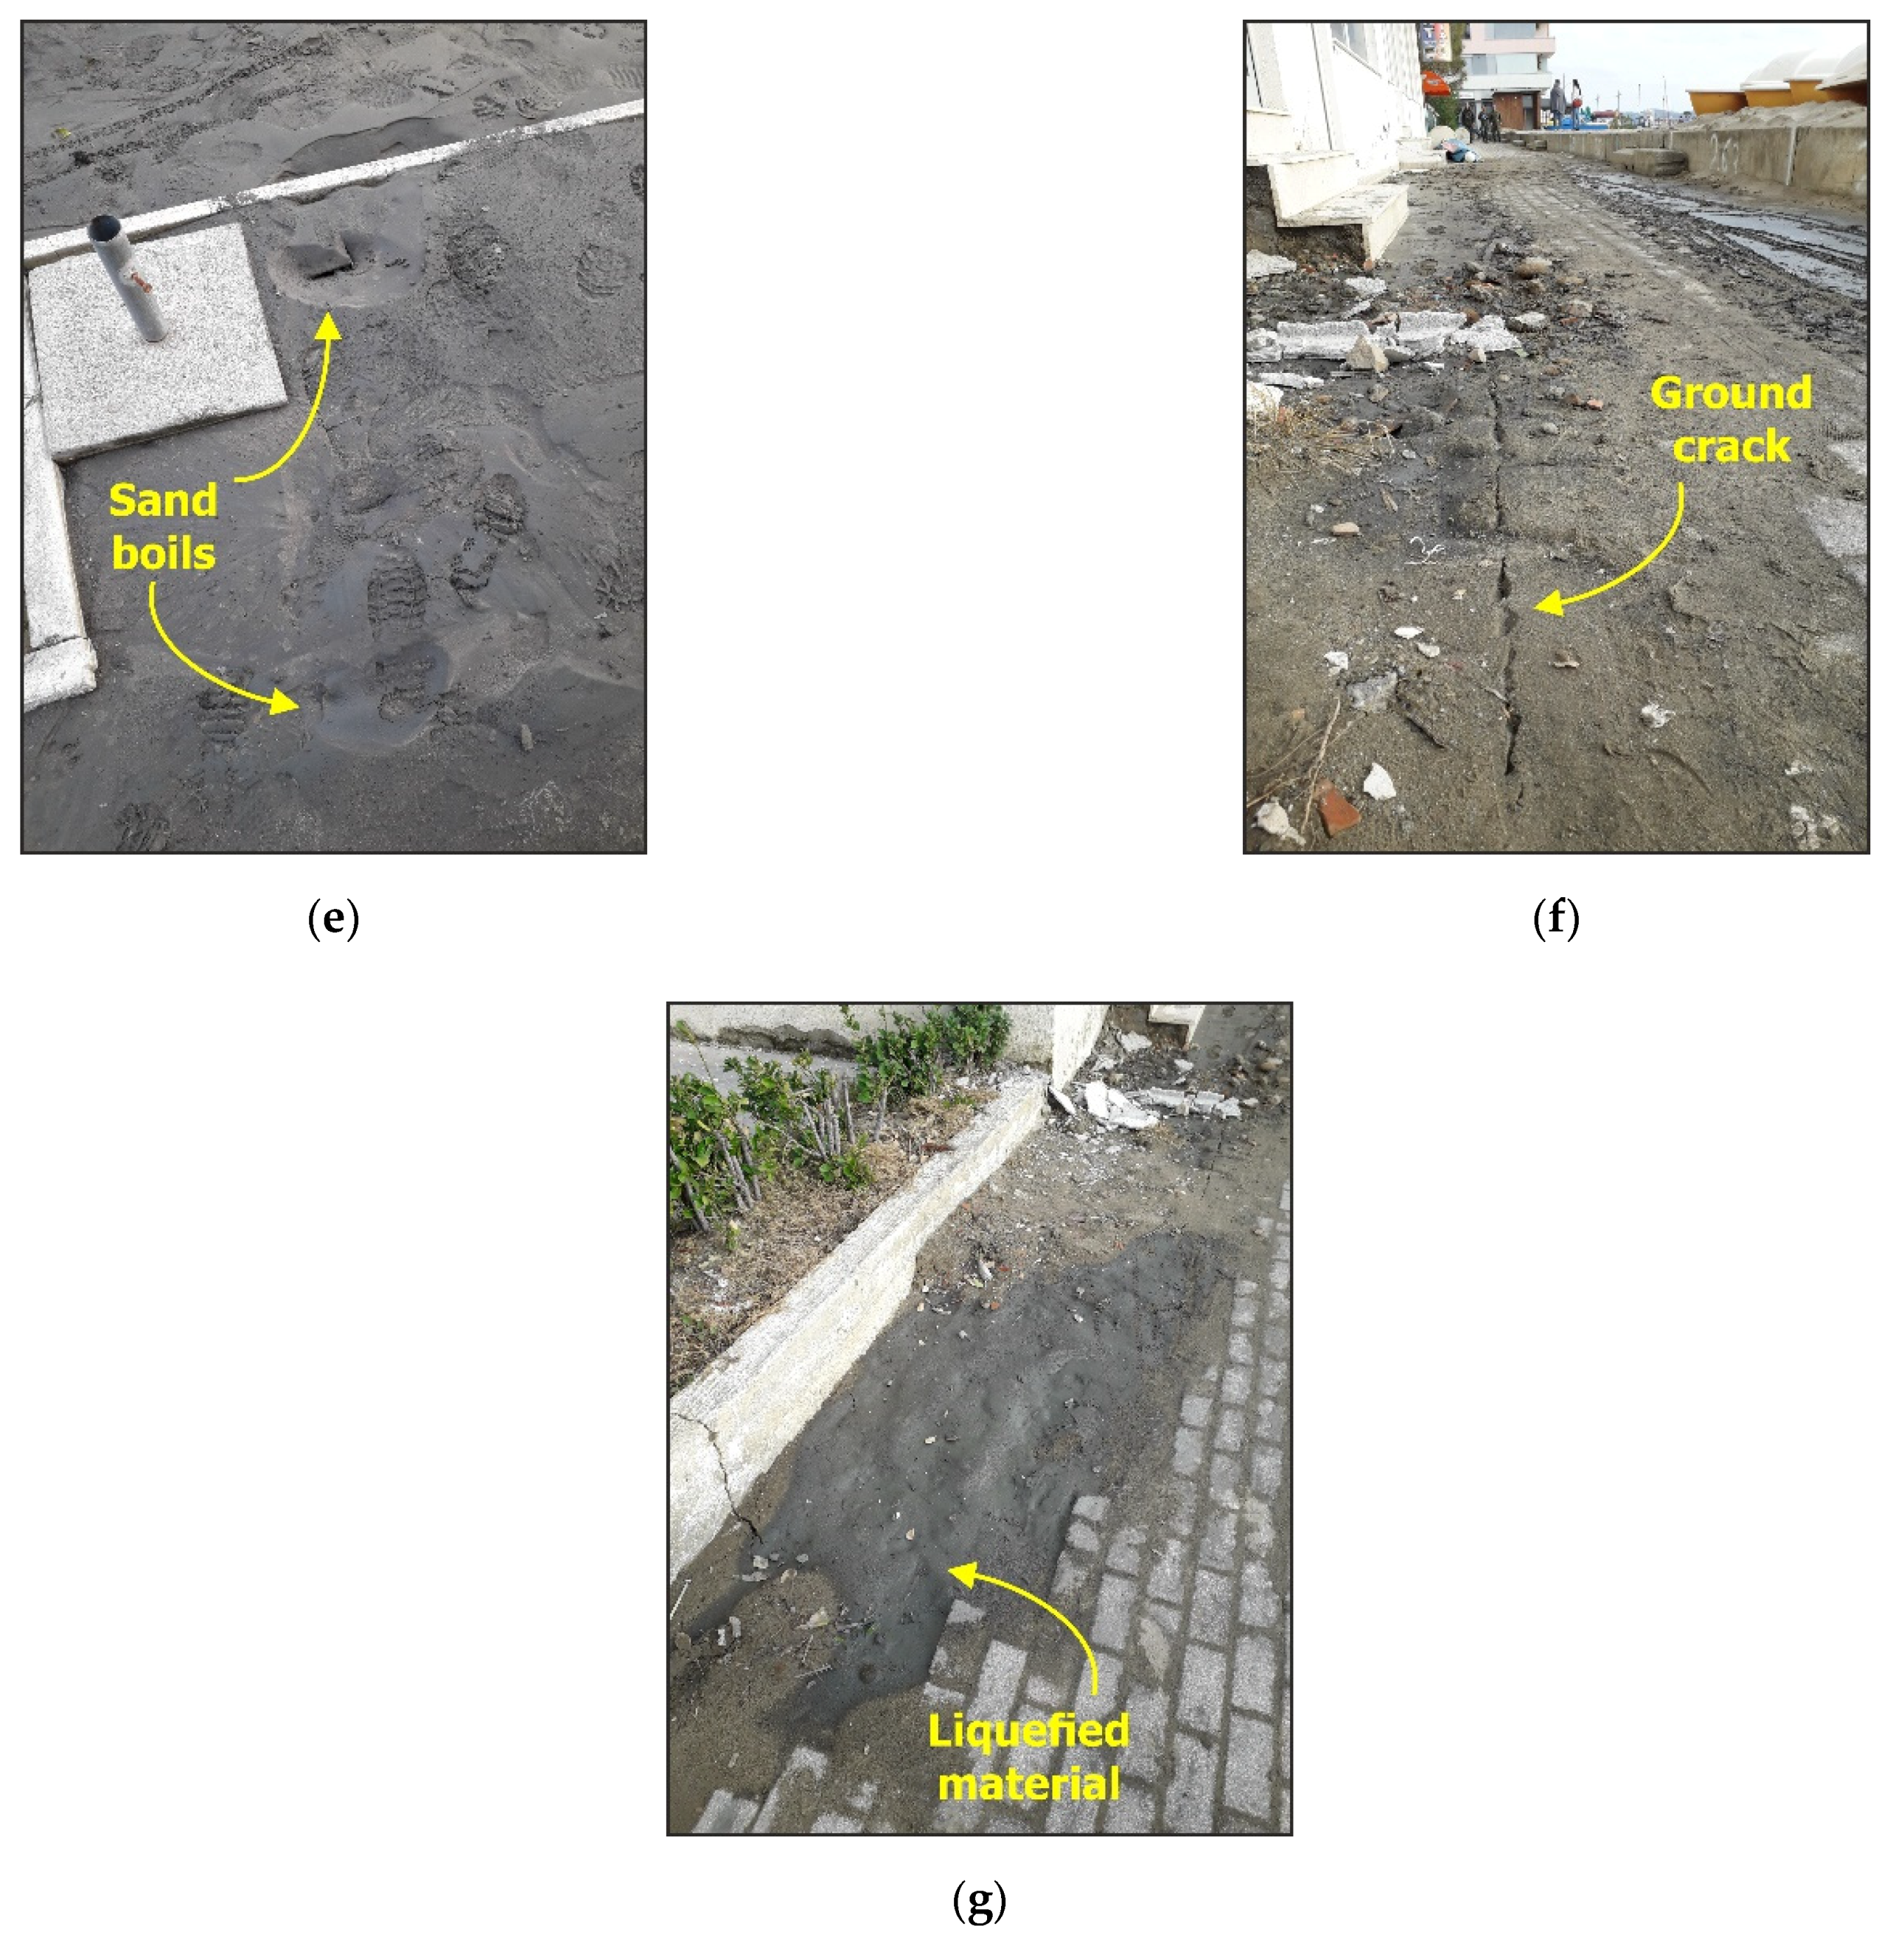
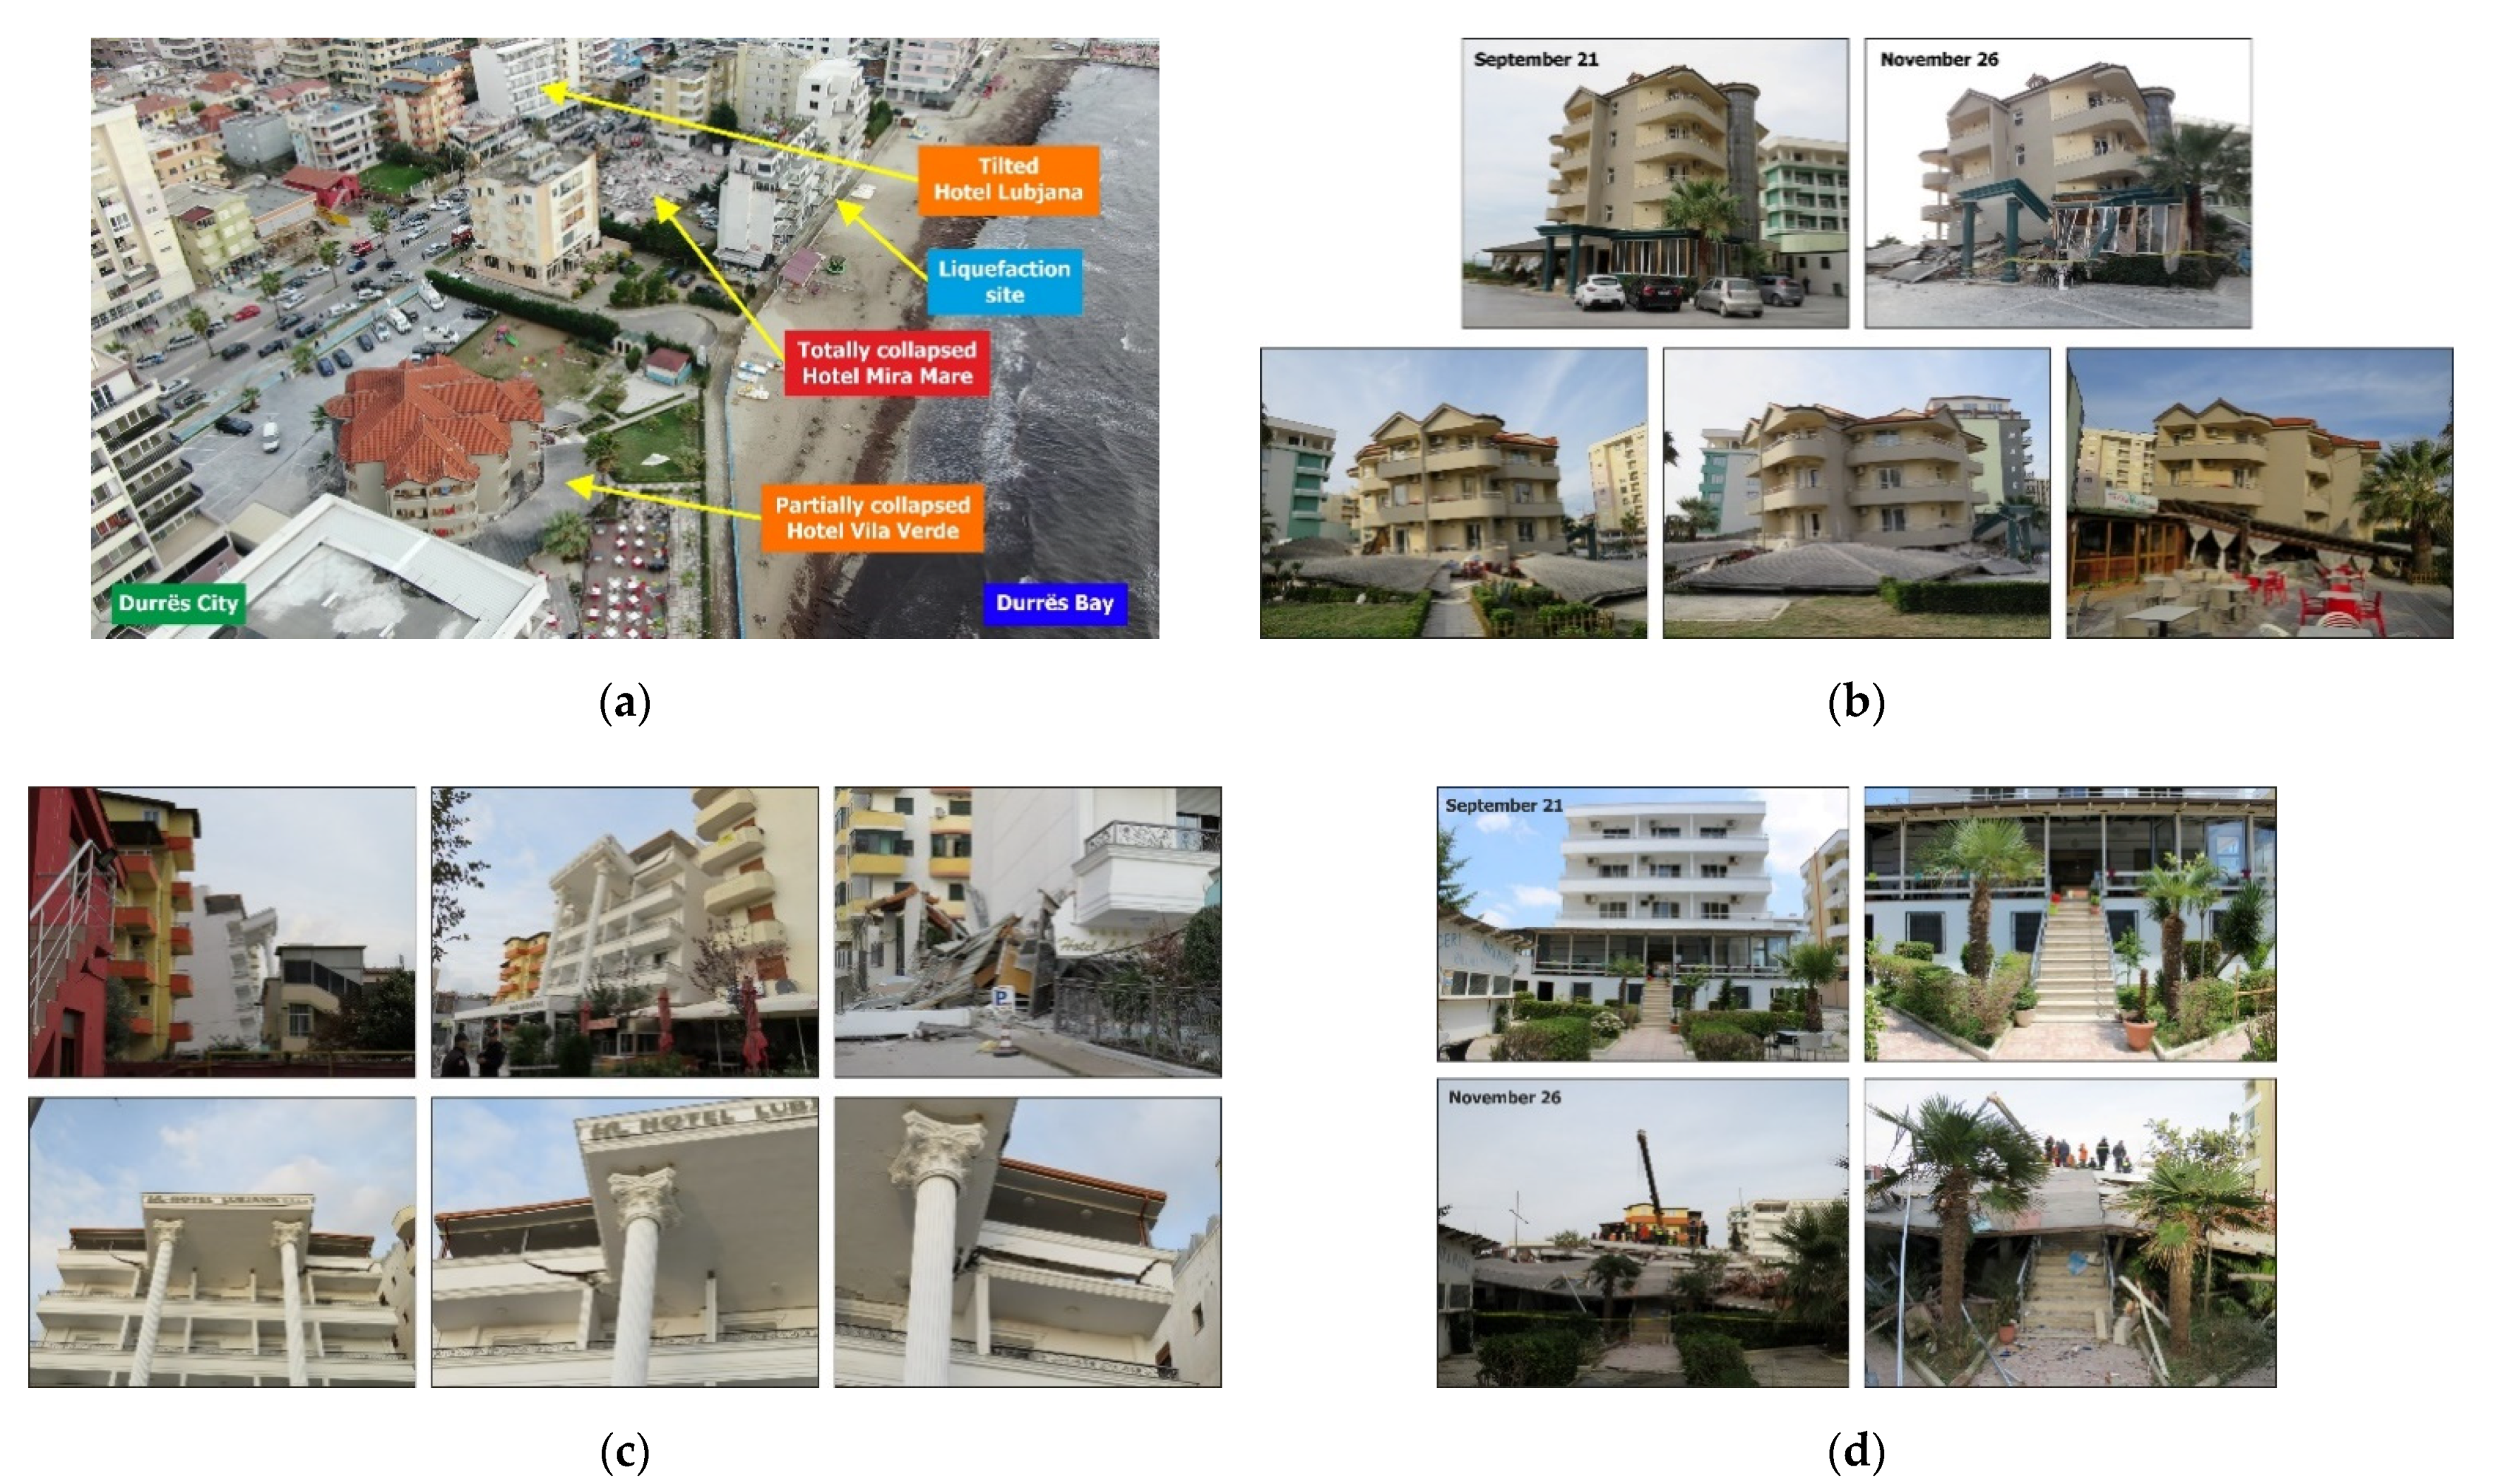
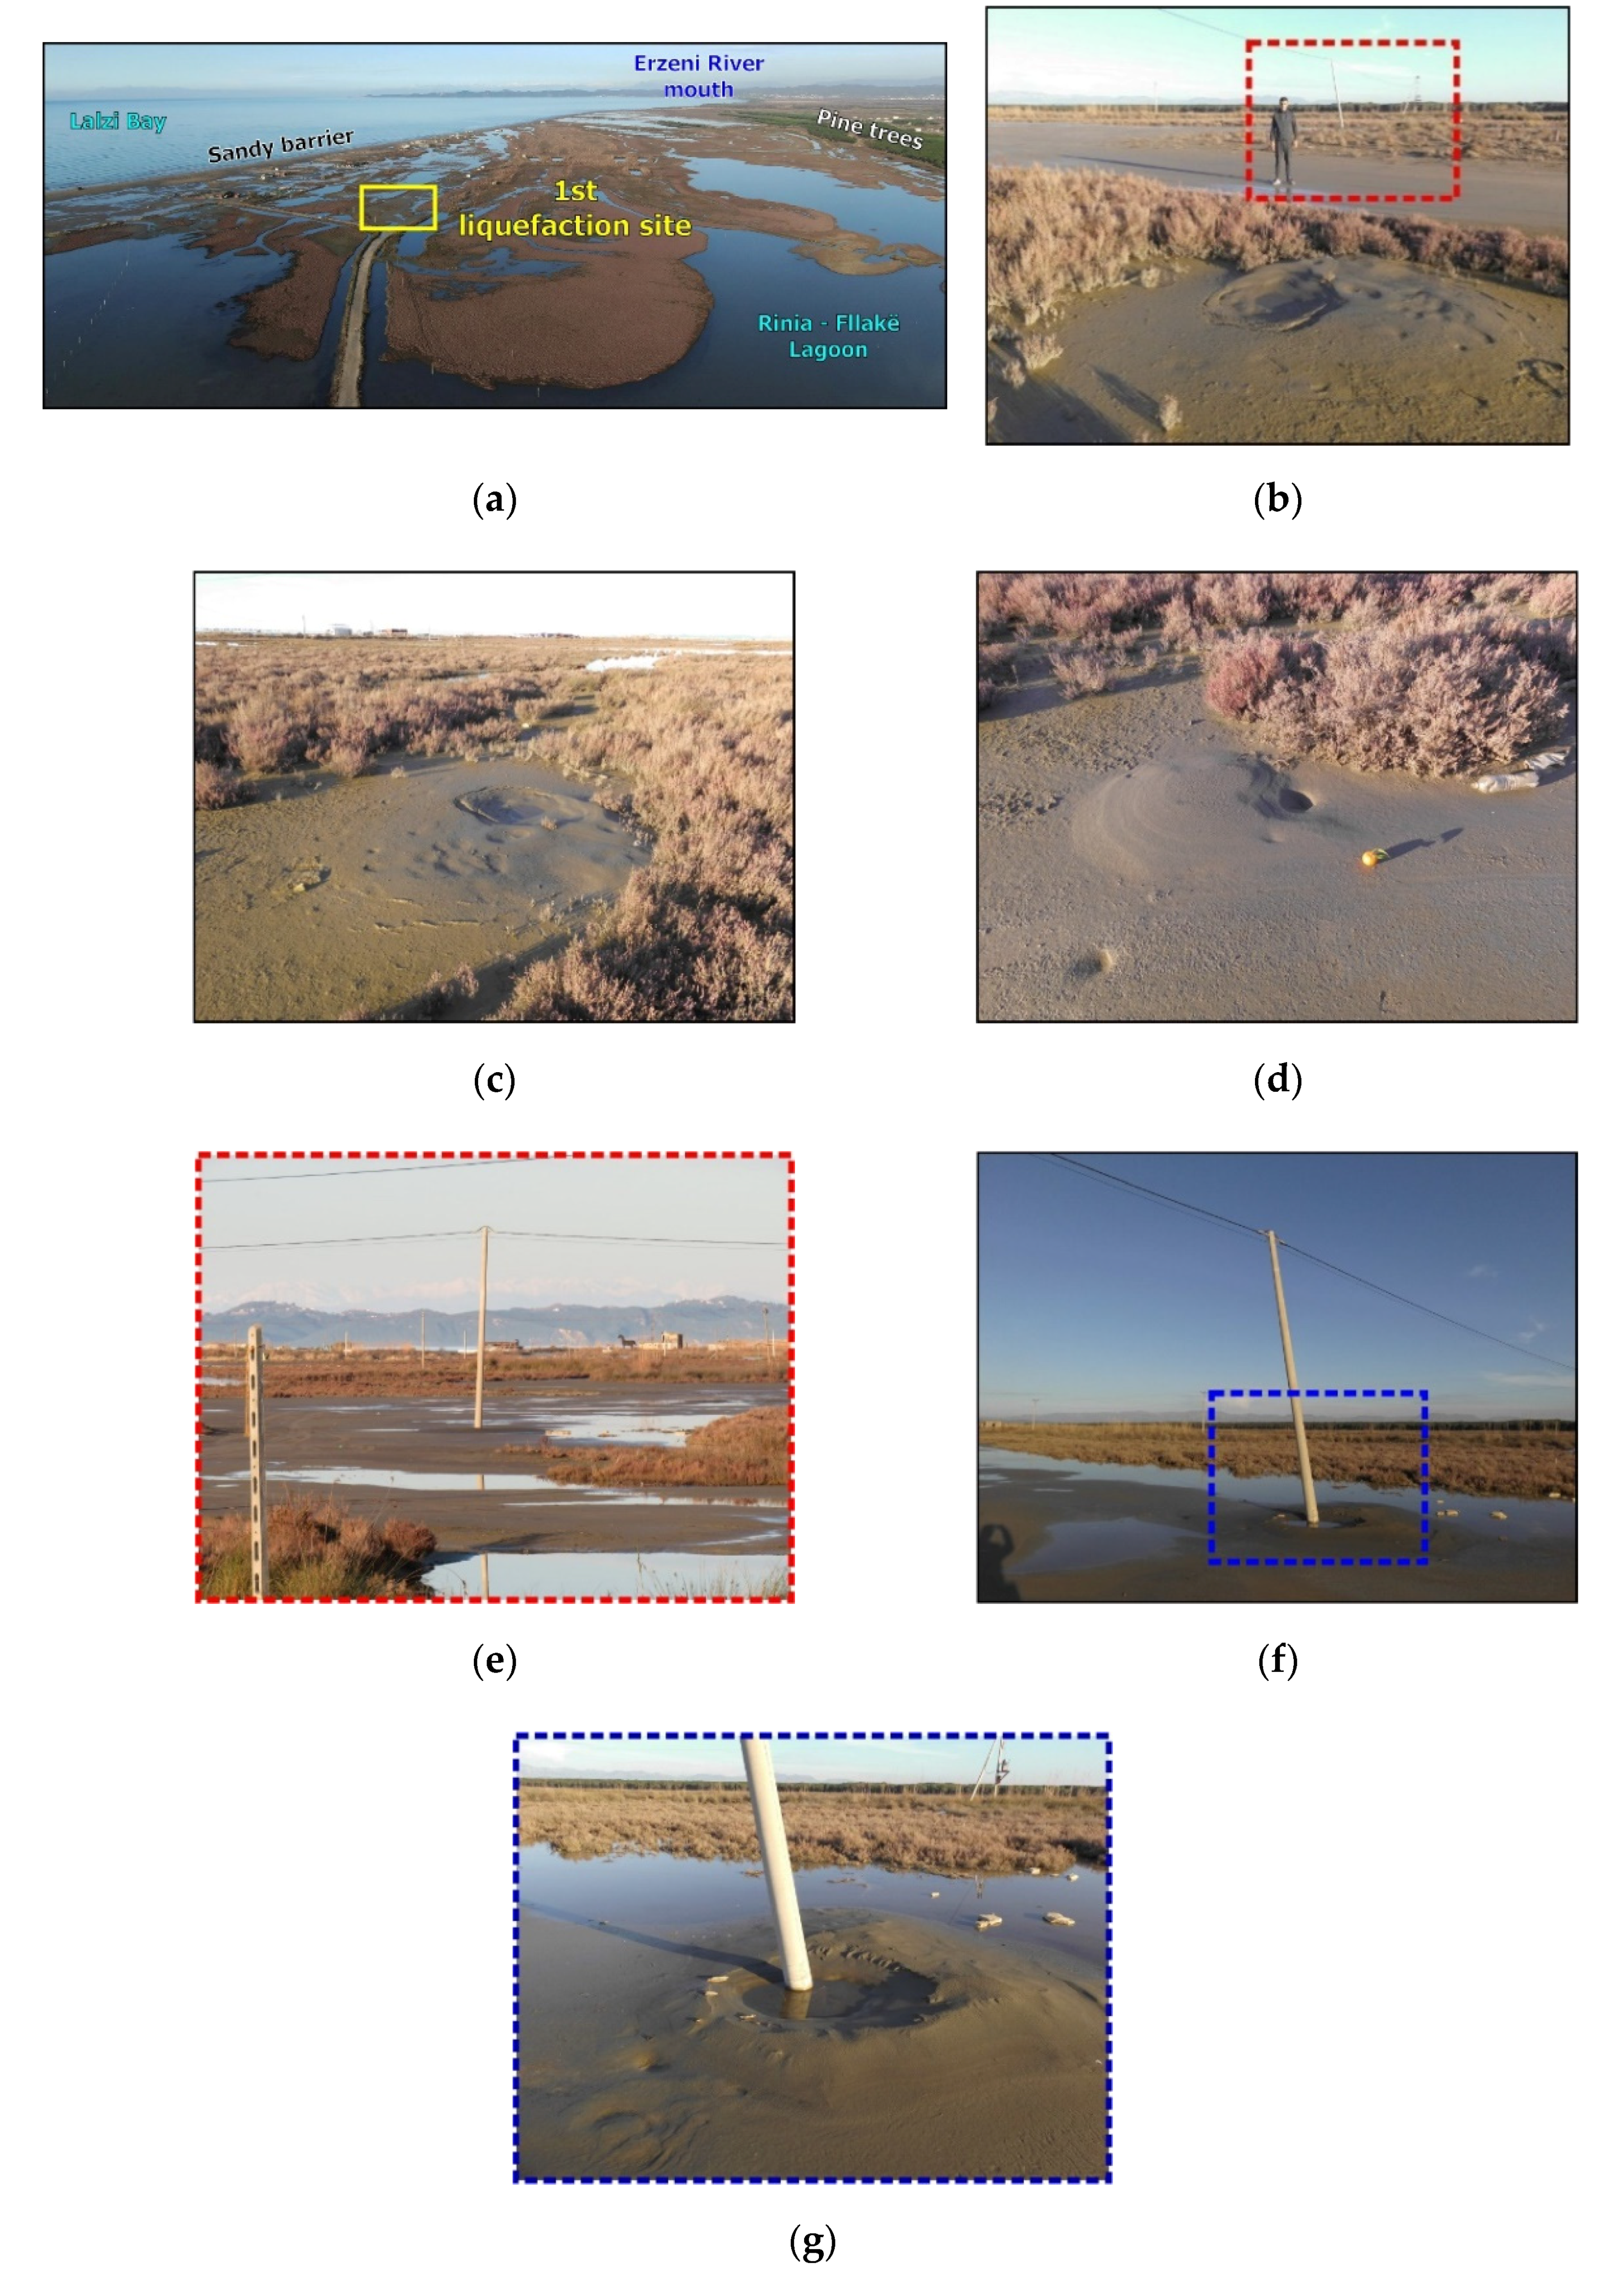
5.3.1. Liquefaction Phenomena in the Coastal Part of Southern Durrës

The fact that the coastal part of Durrës is a dynamic terrain subjected to ongoing changes and processes affecting the natural and built environment was strongly confirmed after the 2019 Mw = 6.4 earthquake by the induced environmental effects and the resulted building damage. Post-earthquake disaster survey was conducted in the field including also the deployment of an Unmanned Aircraft System. The system comprised a DJI Mavic 2 Zoom UAV, a ground controller and a smartphone. The flight plan was designed to cover the wider area of the detected liquefaction phenomena. Thus, the detected phenomena and their impact were observed by using not only field but also aerial information.
Liquefaction phenomena were generated in the southern coastal part of the Durrës city, in a distance of about 2 km east of the port (Figure 6) and almost 16 km south of the epicenter. More specifically, they were observed along the coastal road SH4 leading from Durrës to Shkëmbi I Kavajes (Figure 6). This area is overpopulated. Many structures, including multistorey hotels and residential buildings are built on the littoral zone of the area, in a small distance from the shoreline. These structures have shallow foundations embedded to the upper part of the soil, usually at a depth of 2.0 to 4.0 m.
Liquefied material comprising sand and water was ejected from ground cracks with length of up to 2 m resulting in formation of sand boils with diameter of about 20 cm and pavements covered with liquefied material (Figure 6). The site is located in a distance of only 35 m from the shoreline and is composed mainly of coastal marine deposits of the Durrës Bay. The main lithologies prevailing at this site are sands and silts. As regards the hydrogeology of this area, the groundwater level is shallow. It is significant to note that slight liquefaction phenomena have been observed in this coastal part by the 21 September 2019, Mw = 5.6 Durrës earthquake and comprised small scale subsidence detected along pavements close to the sea shore without any impact on the built environment [38].
These liquefaction phenomena were observed in an area where buildings with reinforced concrete frame and infill brick walls suffered from very heavy structural damage including collapse and tilting, while the adjacent buildings suffered only non-structural damage (Figure 6 and Figure 7). These buildings were the Villa Verde, Mira Mare, and Lubjana hotels (Figure 6 and Figure 7). The Mira Mare hotel was about 30 m from the liquefaction site and entirely collapsed. The liquefaction phenomena observed in this site may contribute to the initial sinking and tilting of the building that led to its final pancake collapse. The two lower floors of the Villa Verde hotel, located about 100 m from the liquefaction site, collapsed during the November earthquake, while the upper floors of the structure remained almost intact (Figure 7). The Lubjana hotel, about 75 m from the liquefaction site, presented tilting due to failure of the ground floor columns in the back of the building (Figure 7). All buildings were demolished few days after the completion of the search and rescue operations and the rubbles were completely removed.
The area with the three heavily damaged hotels is close to the sea and is composed of unconsolidated recent deposits that constitute the soft ground of the area. The soft ground usually suffers differential displacements including subsidence among others [7,39]. The multistorey buildings are constantly trying to adapt to these displacements and restabilize. This adaptation and restabilization of the buildings is putting more strain on their structural and non-structural elements resulting in either slight deformation or failure of these elements. When a strong earthquake occurs in a distance from the soft ground and from the founded multistorey buildings, then the synergy of several factors may result in destruction. The most significant detected factors for this earthquake affected area comprise the earthquake loading along with the local soil conditions, the shallow groundwater table, and its saline conditions due to the sea proximity, the subsidence of the area due to neotectonic activity, aquifer and hydrocarbon exploitation, the construction defects, and the pre-existing stress of the building. These structures suffer also from materials ageing processes more than those founded on hard and consolidated soil.
In this case, the hotels were founded on soft ground in a distance of about 25 km from the earthquake epicenter. The underground water table was shallow due to the proximity to the sea and to the October and November pre-earthquake high precipitation, which is the maximum precipitation of the year in this coastal area of Albania.
As indicated above, this area is characterized by shallow underground water table and variation of the relief of the basement beneath the recent deposits. According to [40], the seismic intensity may increase by two degrees due to the synergy of the shallow underground water level and the variety of the relief (Figure 8).
Similar increase of the seismic intensity could have been generated due to local ground conditions in this coastal part of the Durrës city, as also supported by [18,28]. Moreover, the pre-existing stress of the buildings is attributed to their adaptation on the differential movements of the soft ground and their restabilization resulting in small damage, which is homologous to earthquake-induced damage. Thus, the November earthquake hit structures overstrained not only from these differential movements but also from the 21 September 2019, Mw = 5.6 Durrës foreshock.

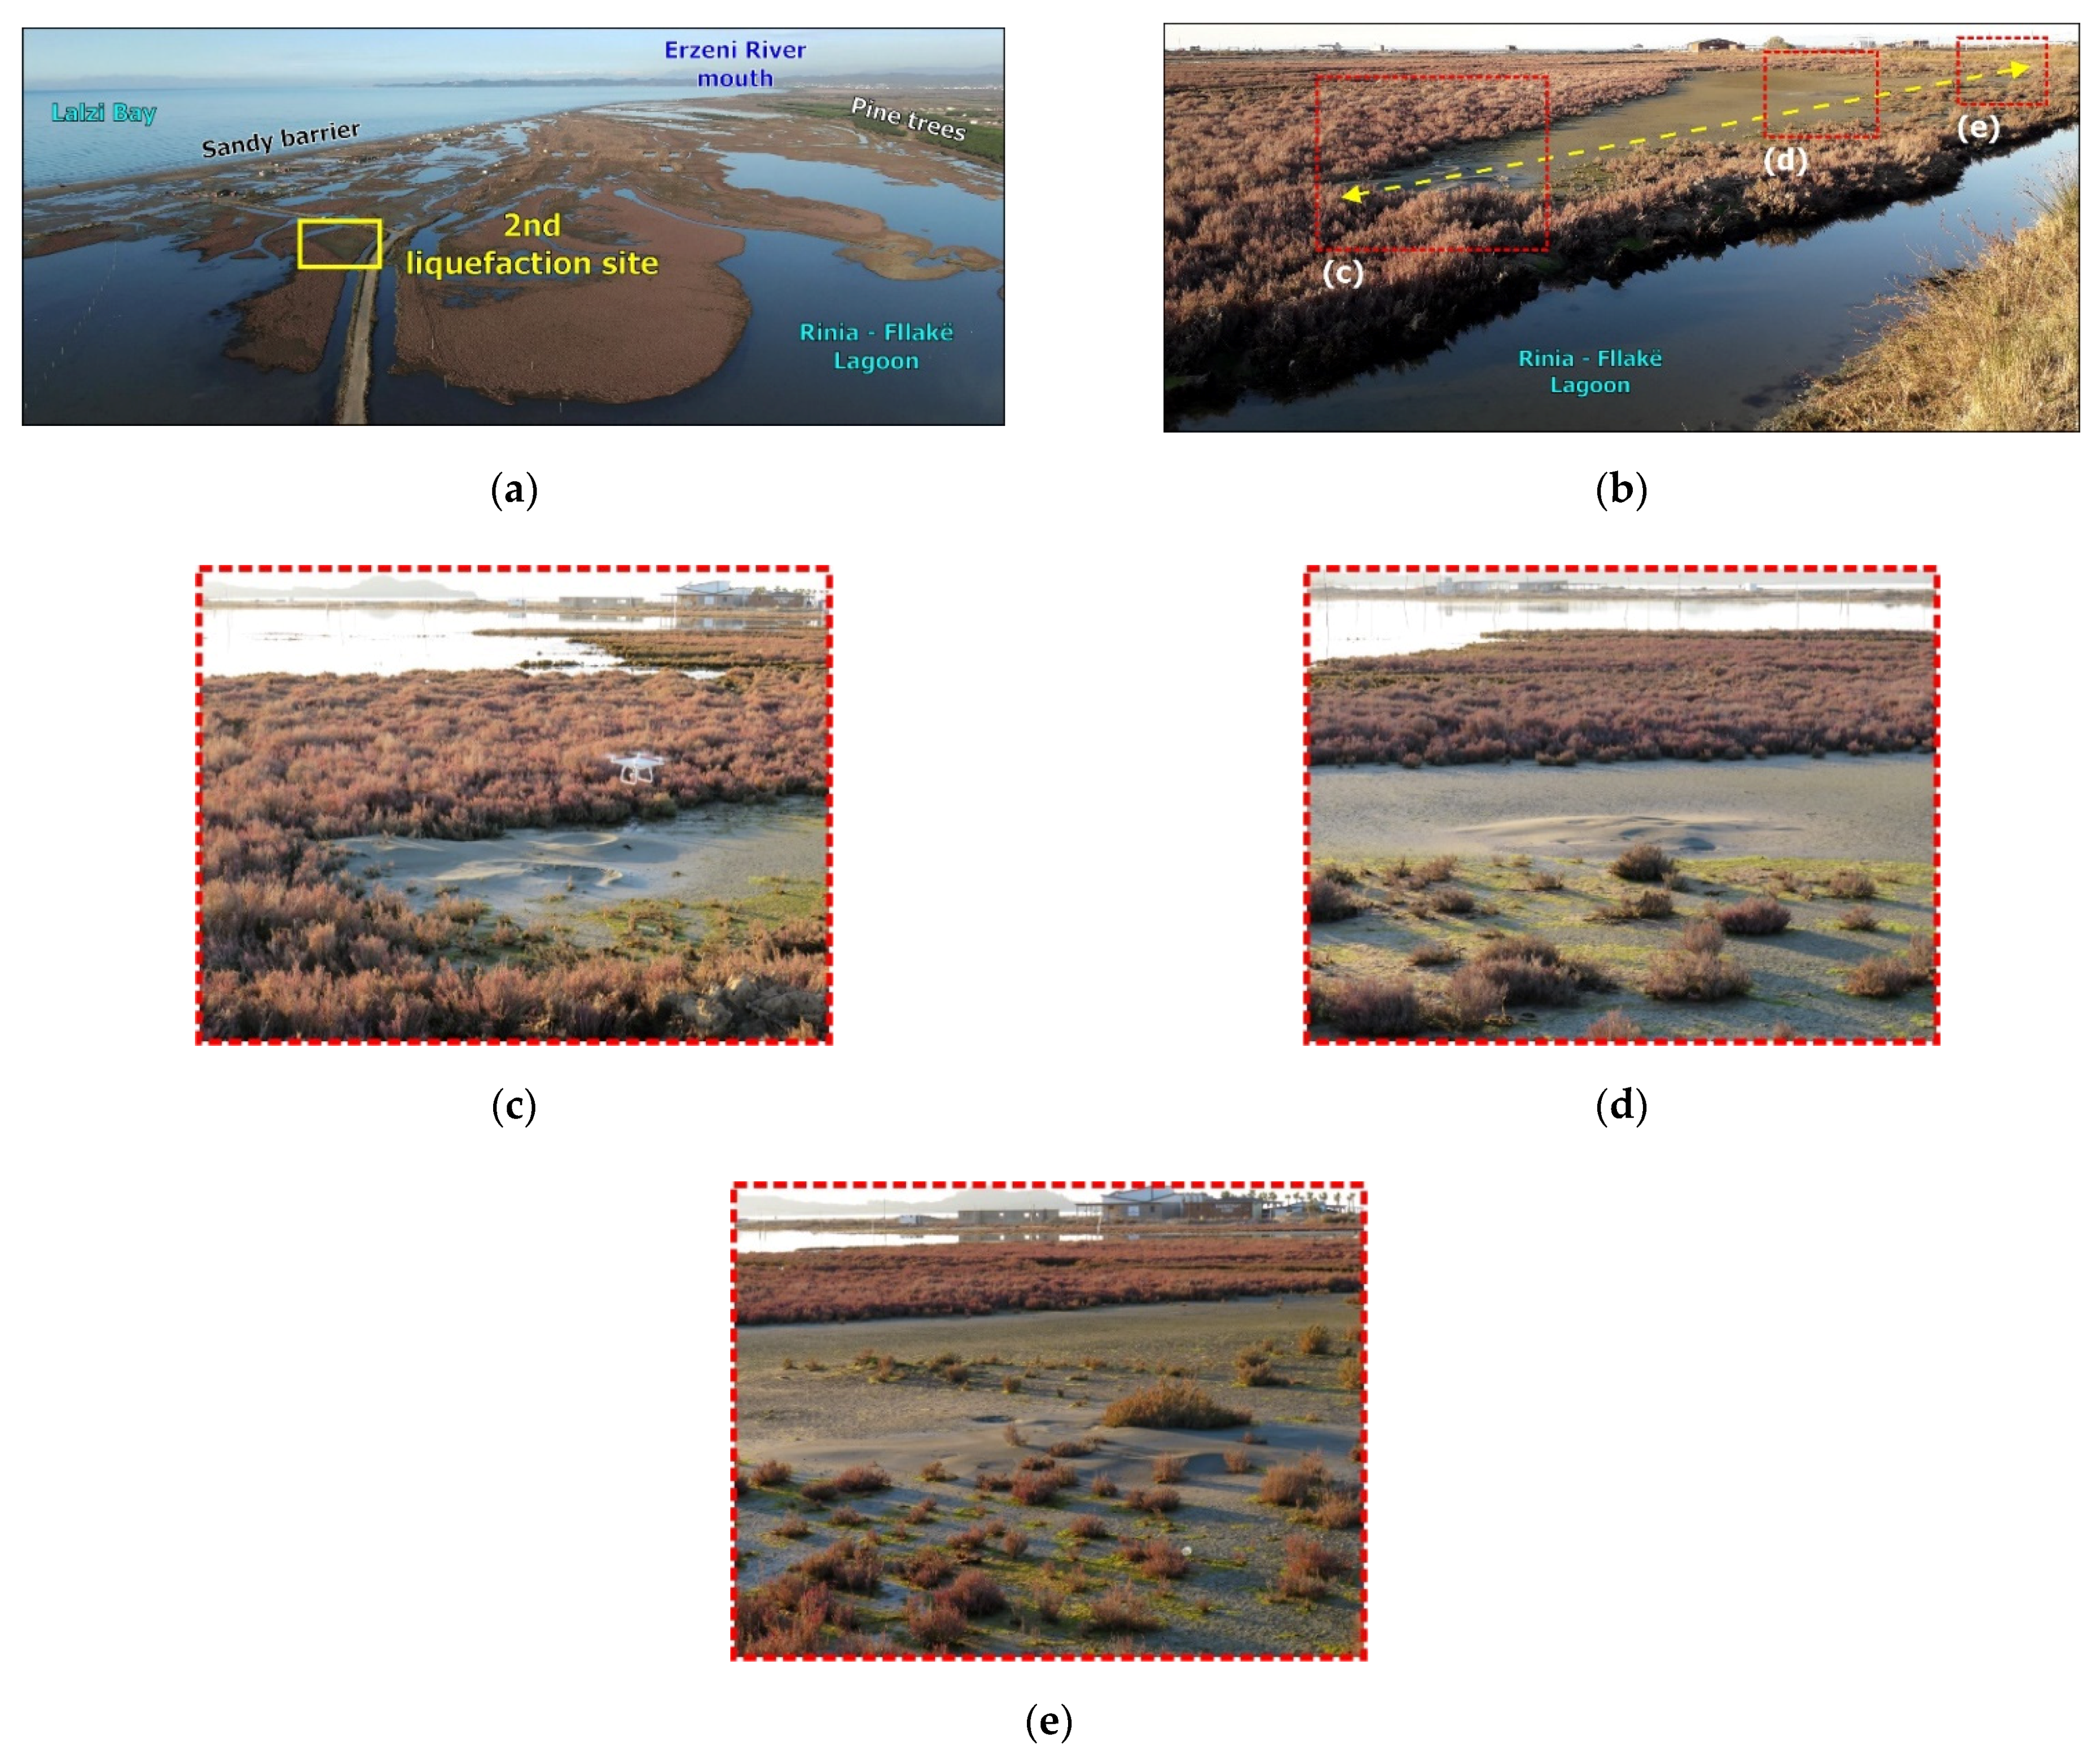
5.3.2. Liquefaction Phenomena in Rinia—Fllakë Lagoon

The Lalzi Bay is located north of the Durrës plain area (Figure 9). Its coastal part extends with a length of about 10 km from the Pali Cape in its southern end to the Rodoni Cape in its northern end. From the geological point of view, the coastal part is composed of Tertiary and Quaternary deposits [14]. More specifically, Pali Cape comprises Messinian molasse including sands, conglomerates, clays, and silts [41]. Moreover, Rodoni Cape is composed mainly of Messinian formations and secondarily of Pliocene formations [41]. As regards the present geomorphology of the coastal part of the Lalzi Bay, the Erzeni River is the main sediment supplier of the coastal zone (Figure 9), and one of the factors controlling the distribution of Quaternary deposits in the area. The Quaternary is represented by Holocene lagoonal and marine deposits in the outer part of the coastal zone and by Holocene alluvial deposits in the inner part. The alluvial deposits include conglomerates, sands and clays, the lagoonal deposits comprise sands, silt, and clays and the marine ones mainly sand [14].
As regards the tectonic setting, the southwestern coastal part of the Lalzi Bay is located at the northern part of the Durrës syncline, which is filled up with Quaternary deposits lying over the folded Miocene—Pliocene formations [7] and bounded by NW–SE striking active thrust faults [7] (Figure 2).
The coastline of the Lalzi Bay is vulnerable to erosion processes and related phenomena resulting in coastal retreat [41,42]. The observed coastal erosion and retreat is attributed mainly to the intense, illegal and uncontrolled aggregate mining taking place along the Erzeni River bed after 1990 [41,42]. This mining is due to the rapidly increasing demand for construction material due to the rapid urbanization and development and significant demographic increase and population growth along the coast during the last 20 years following the fall of the communist era and the related political and socio-economic abrupt changes in Albania in general and in the earthquake-affected area in particular.
Moreover, a significant feature in the morphology of this area, which is also affected by the aforementioned environmental, political, and economic changes is the Rinia–Fllakë Lagoon (Figure 9). This lagoon extends from east of Pali Cape to west of the Erzeni River delta (Figure 9). It is a very shallow lagoon, which is separated from the sea by a narrow sandy beach in its western side and from the adjacent agricultural fields by a wide line of pine trees (Figure 9). Rinia town is located at its southern part, while hotel facilities along the narrow sandy barrier are also accessible through a road leading from Rinia town to the outer barrier of the lagoon.
UAV post-earthquake disaster survey was also conducted in the Rinia–Fllakë Lagoon. This survey contributed not only to observe the total distribution of the induced phenomena, but also to overcome difficulties in approaching inaccessible liquefaction sites of the lagoon.
The liquefaction phenomena included typical forms, such as individual sand boils, alignment of sand boils as well as water and sand fountains (Figure 10, Figure 11, Figure 12 and Figure 13) observed in the central part of the lagoon (Figure 9). Individual sand boils were formed by the ejection of liquefied material comprising mainly sand and water on the surface (Figure 10, Figure 11, Figure 12 and Figure 13). Their diameter was of several tens to hundreds of centimeters varying from 1 to 7 m. The large size of the observed sand boils indicates repeated cycles of liquefaction and the intensity of the observed phenomena. The distances of the liquefaction localities in Rinia–Fllakë Lagoon from the earthquake epicenter extend from 4.64 to 4.90 km.
The observed liquefaction phenomena did not cause structural damage due to the fact that there are no buildings because of the lagoon. They caused only slight damage to infrastructures including tilting of electrical pillars (Figure 10). They were observed not only in dry parts of the lagoon, but also in shallow parts covered by stagnant waters (Figure 12 and Figure 13). The elongated/aligned multiple sand boils were observed in the central part along almost N–S trending ground cracks with length of up to 100 m (Figure 12 and Figure 13). The water and sand fountains in still waters were reported by locals, who have visited the area for fishing and were at the liquefaction affected area at the time of the earthquake.
The main factors controlling these phenomena are the shallow water level and the soft and unconsolidated lagoonal sediments. Moreover, the small distance from the epicenter and the proximity to the active thrust faults bounding the Rinia—Fllakë Lagoon from west and east could adversely contribute to the generation of these phenomena.

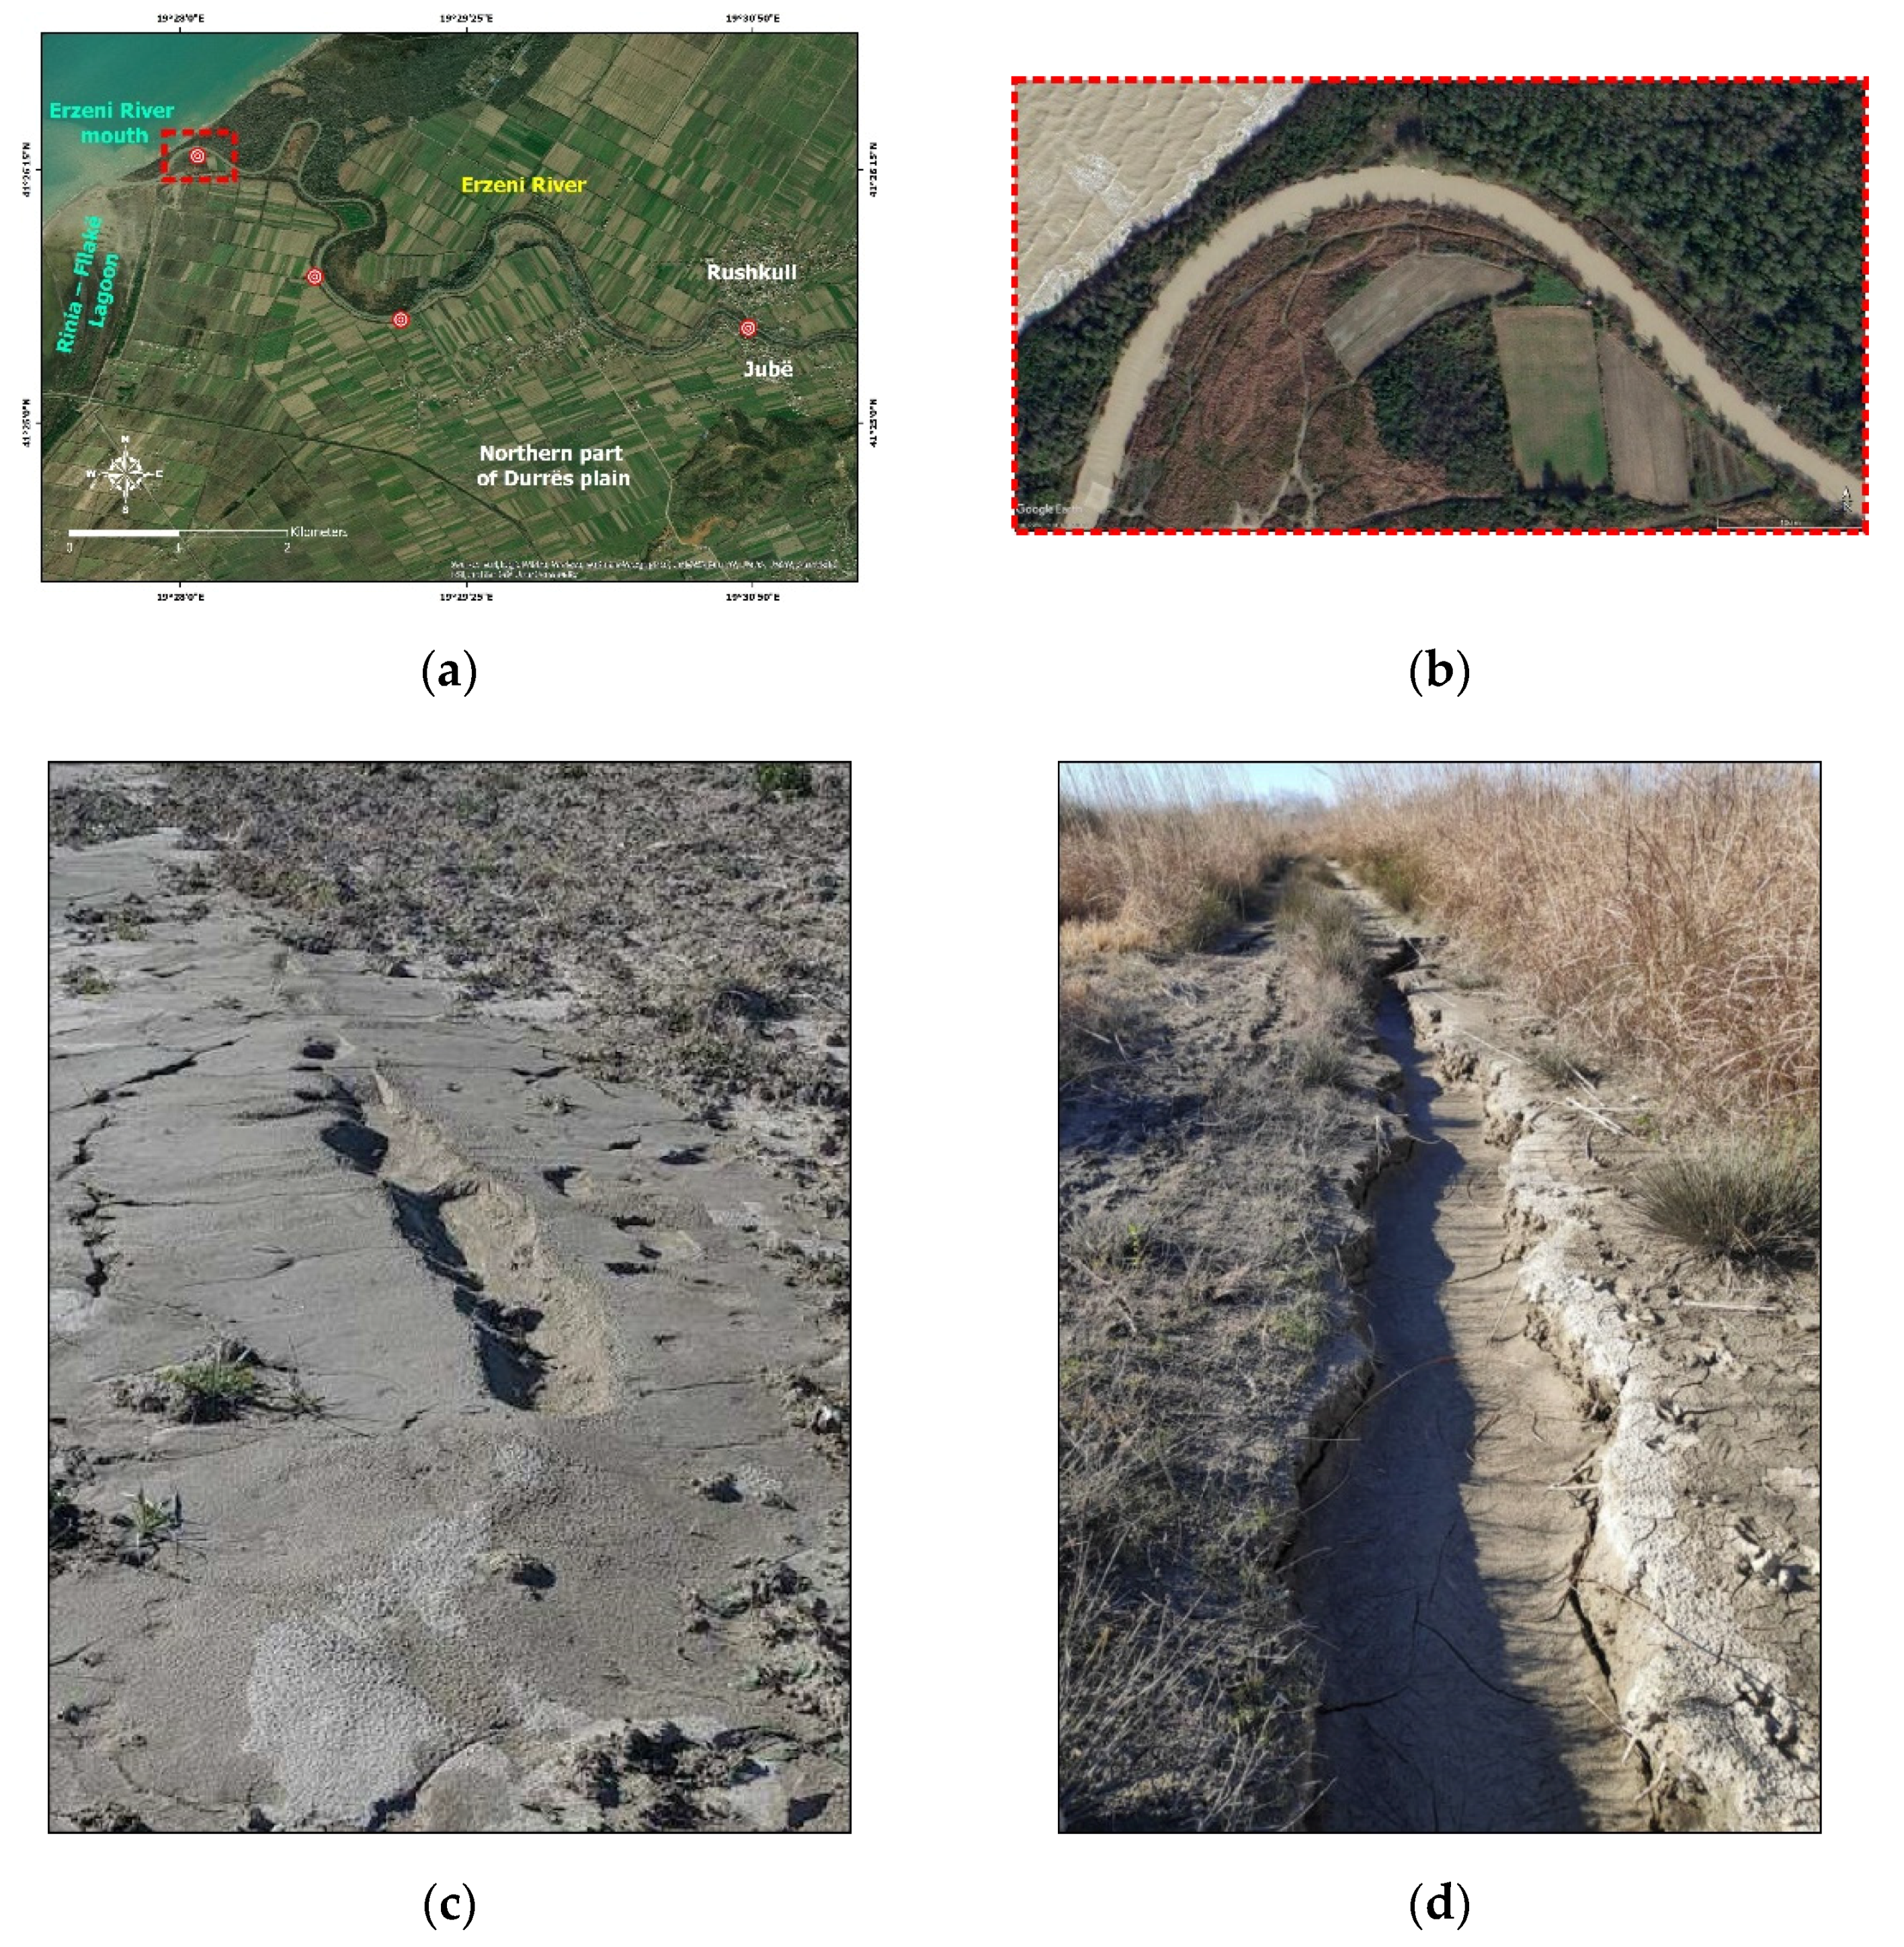
5.3.3. Liquefaction Phenomena in the Lower Course of the Erzeni River

As mentioned above, the Erzeni River flood plain is located at the northeastern end of the Rinia–Fllakë Lagoon. The area is mainly composed from sediments supplied from the Erzeni River, which along with its main tributaries drain a broad NW–SE aligned plain stretching 10–15 km inland from the coast, which correspond to the northern part of NW–SE trending Durrës plain area (Figure 14).
Liquefaction phenomena were generated along the river banks of the Erzeni River at distances varying from 4.57 to 8.63 from the mainshock epicenter and more specifically close to the river mouth. They comprise ejection of liquefied material along NE–SW trending ground cracks with length varying from 10 to 80 m and formation of sand boils along ground cracks in the floodplain of the Erzeni River (Figure 14). ENE–WSW trending ground cracks with length of up to 130 m attributed to lateral spreading were also formed parallel to the Erzeni river bed and resulted vertical offset varying from 5 to 20 cm (Figure 14).
Liquefaction phenomena were also observed in the area of the Rushkull and Jubë villages located at a distance of almost 4.5 km east of the Erzeni River mouth and almost 3 km from the aforementioned liquefaction sites (Figure 14). Rushkull village is located north of the river bed, while Jubë village south of it. This area is mainly composed of water saturated clayey silts lying over alluvial river deposits. Liquefaction comprised ejection of liquefied material from ground cracks, formation of sand boils, and lateral spreading along the Erzeni River banks. It is significant to note that liquefaction started with the ejection of many gravels from the underlying alluvial river deposits and the sandy material followed. The liquefaction phenomena in the observed sites caused slight non-structural damage to buildings. Moreover, they also affected water wells in the same sites.
The main factors controlling these phenomena is the shallow water level, the water saturated river sediments around the river bed and the instability conditions along the river banks. Moreover, the small distance from the mainshock epicenter and the proximity to the active thrust fault below the Erzeni river estuary could adversely contribute to the amplification of these phenomena.

5.3.4. Liquefaction Phenomena Close to the Mati River Estuary

Favorable conditions for the generation of liquefaction phenomena were also detected in the eastern part of the earthquake-affected area located within the Tirana Depression. Characteristic examples are the area around Patok Lagoon and more specifically the Tale and Fushë Kuqe areas located north and south of the Mati River bed. This area present geological conditions similar to the aforementioned Rinia–Fllakë Lagoon. In this case, the Mati River to the north and the Ishem River to the south are the main rivers supplying sediments and controlling the distribution of Quaternary deposits in this area (Figure 2). The Quaternary is represented by Holocene lagoonal deposits within the Patok Lagoon and Holocene alluvial deposits in the surrounding flood plain [14].
Similar to the coastal environment of the Rinia–Fllakë Lagoon, the Mati outlet has drastically changed in recent years due to natural processes and human interventions. The Mati River mouth has moved southwards and the adjacent seashores suffer erosion attributed to dams and uncontrolled aggregate mining from its riverbed. These processes resulted in the enlargement of Patok Lagoon [43].
Liquefaction phenomena were also generated in the Tale area at a distance of about 30 km from the mainshock epicenter. They comprised ejection of liquefied material of sand and water from ground cracks. Based on Google Earth satellite image, it is clearly shown that the distribution of liquefaction in this area coincides with abandoned and filled bends of Mati River. Despite the fact that these phenomena were observed close to residential buildings, warehouses and water supply drilling works, they did not cause any damage.

6. Liquefaction Susceptibility Mapping

6.1. Approach for Liquefaction Susceptibility Assessment in the Earthquake-Affected Area

For the liquefaction susceptibility assessment in the area affected by the 26 November 2019, Mw = 6.4 Durrës earthquake, the used approach combines the main features of the methodologies applied by [44,45,46,47].
Papathanassiou et al. classified Greece in liquefaction susceptibility zones based on geological, geomorphological, and seismological data and historical and recent information on respective liquefaction phenomena [44]. They initially classified the Quaternary deposits in susceptibility categories based on their age, their depositional environment, the peak ground acceleration and the liquefaction inventory of historical and recent earthquakes in Greece as published by [48]. Papathanassiou et al. applied the same methodology not at country, but at local level [45], in particular at the coastal area of Corinth Gulf characterized by medium to high seismicity and related liquefaction phenomena.
Lozios et al. and Mavroulis et al., in the frame of scientific applied research projects in Central Macedonia (Northern Greece) and the Ionian Islands (Western Greece), respectively, applied a methodology for liquefaction susceptibility assessment by using lithological properties of the study areas [46,47]. The alpine formations were considered as solid basement rocks and were excluded from the susceptibility assessment. The Neogene and Quaternary deposits were classified into very low, low, medium, and high susceptible to liquefaction based on the evaluation of their lithology, age, and other physical and mechanical characteristics.
Based on correlation of geotectonic units across several stands between Albania and Greece, it is concluded that fundamental similarities exist in stratigraphy, lithology, and tectonic structure of some geotectonic units, which extend from the southern part of the Hellenides to the Scoutari–Pec fault zone, located in northern Albania. More specifically, the Ionian, Kruja and Krassta-Cukali geotectonic units of the Albanides are equivalent to the Ionian, Gavrovo and Pindos geotectonic units of the external Hellenides respectively. Moreover, the Korabi and Mirdita geotectonic units of the internal Albanides are equivalent to the Pelagonian and Subpelagonian geotectonic units of the internal Hellenides. As regards the recent deposits, the Periadriatic and the Tirana depressions are filled with Neogene and Quaternary deposits comprising various lithologies including mainly clays, marls, conglomerates and sandstones. Taking into account these similarities between geological formations in Albania and Greece, it is concluded that this liquefaction susceptibility assessment applied in national and local level in Greece can be also applied in other areas with similar stratigraphic and lithological properties including Albania (national level) and the area affected by the 26 November 2019, Mw = 6.4 Durrës earthquake (local level).
For the liquefaction susceptibility assessment in the earthquake-affected area, the following maps were used:
  • The geological map of Albania in 1:200000 scale [14] (Figure 15a);
  • The seismic zonation map of Albania from the Earthquake Resistant Design Regulations, issued by [49] (Figure 15b);
  • The probabilistic seismic hazard maps of Albania [50,51,52] (Figure 15c,d); and
  • The liquefaction inventory for the western part of Albania based on data presented by [18,28,33,34,35,36].

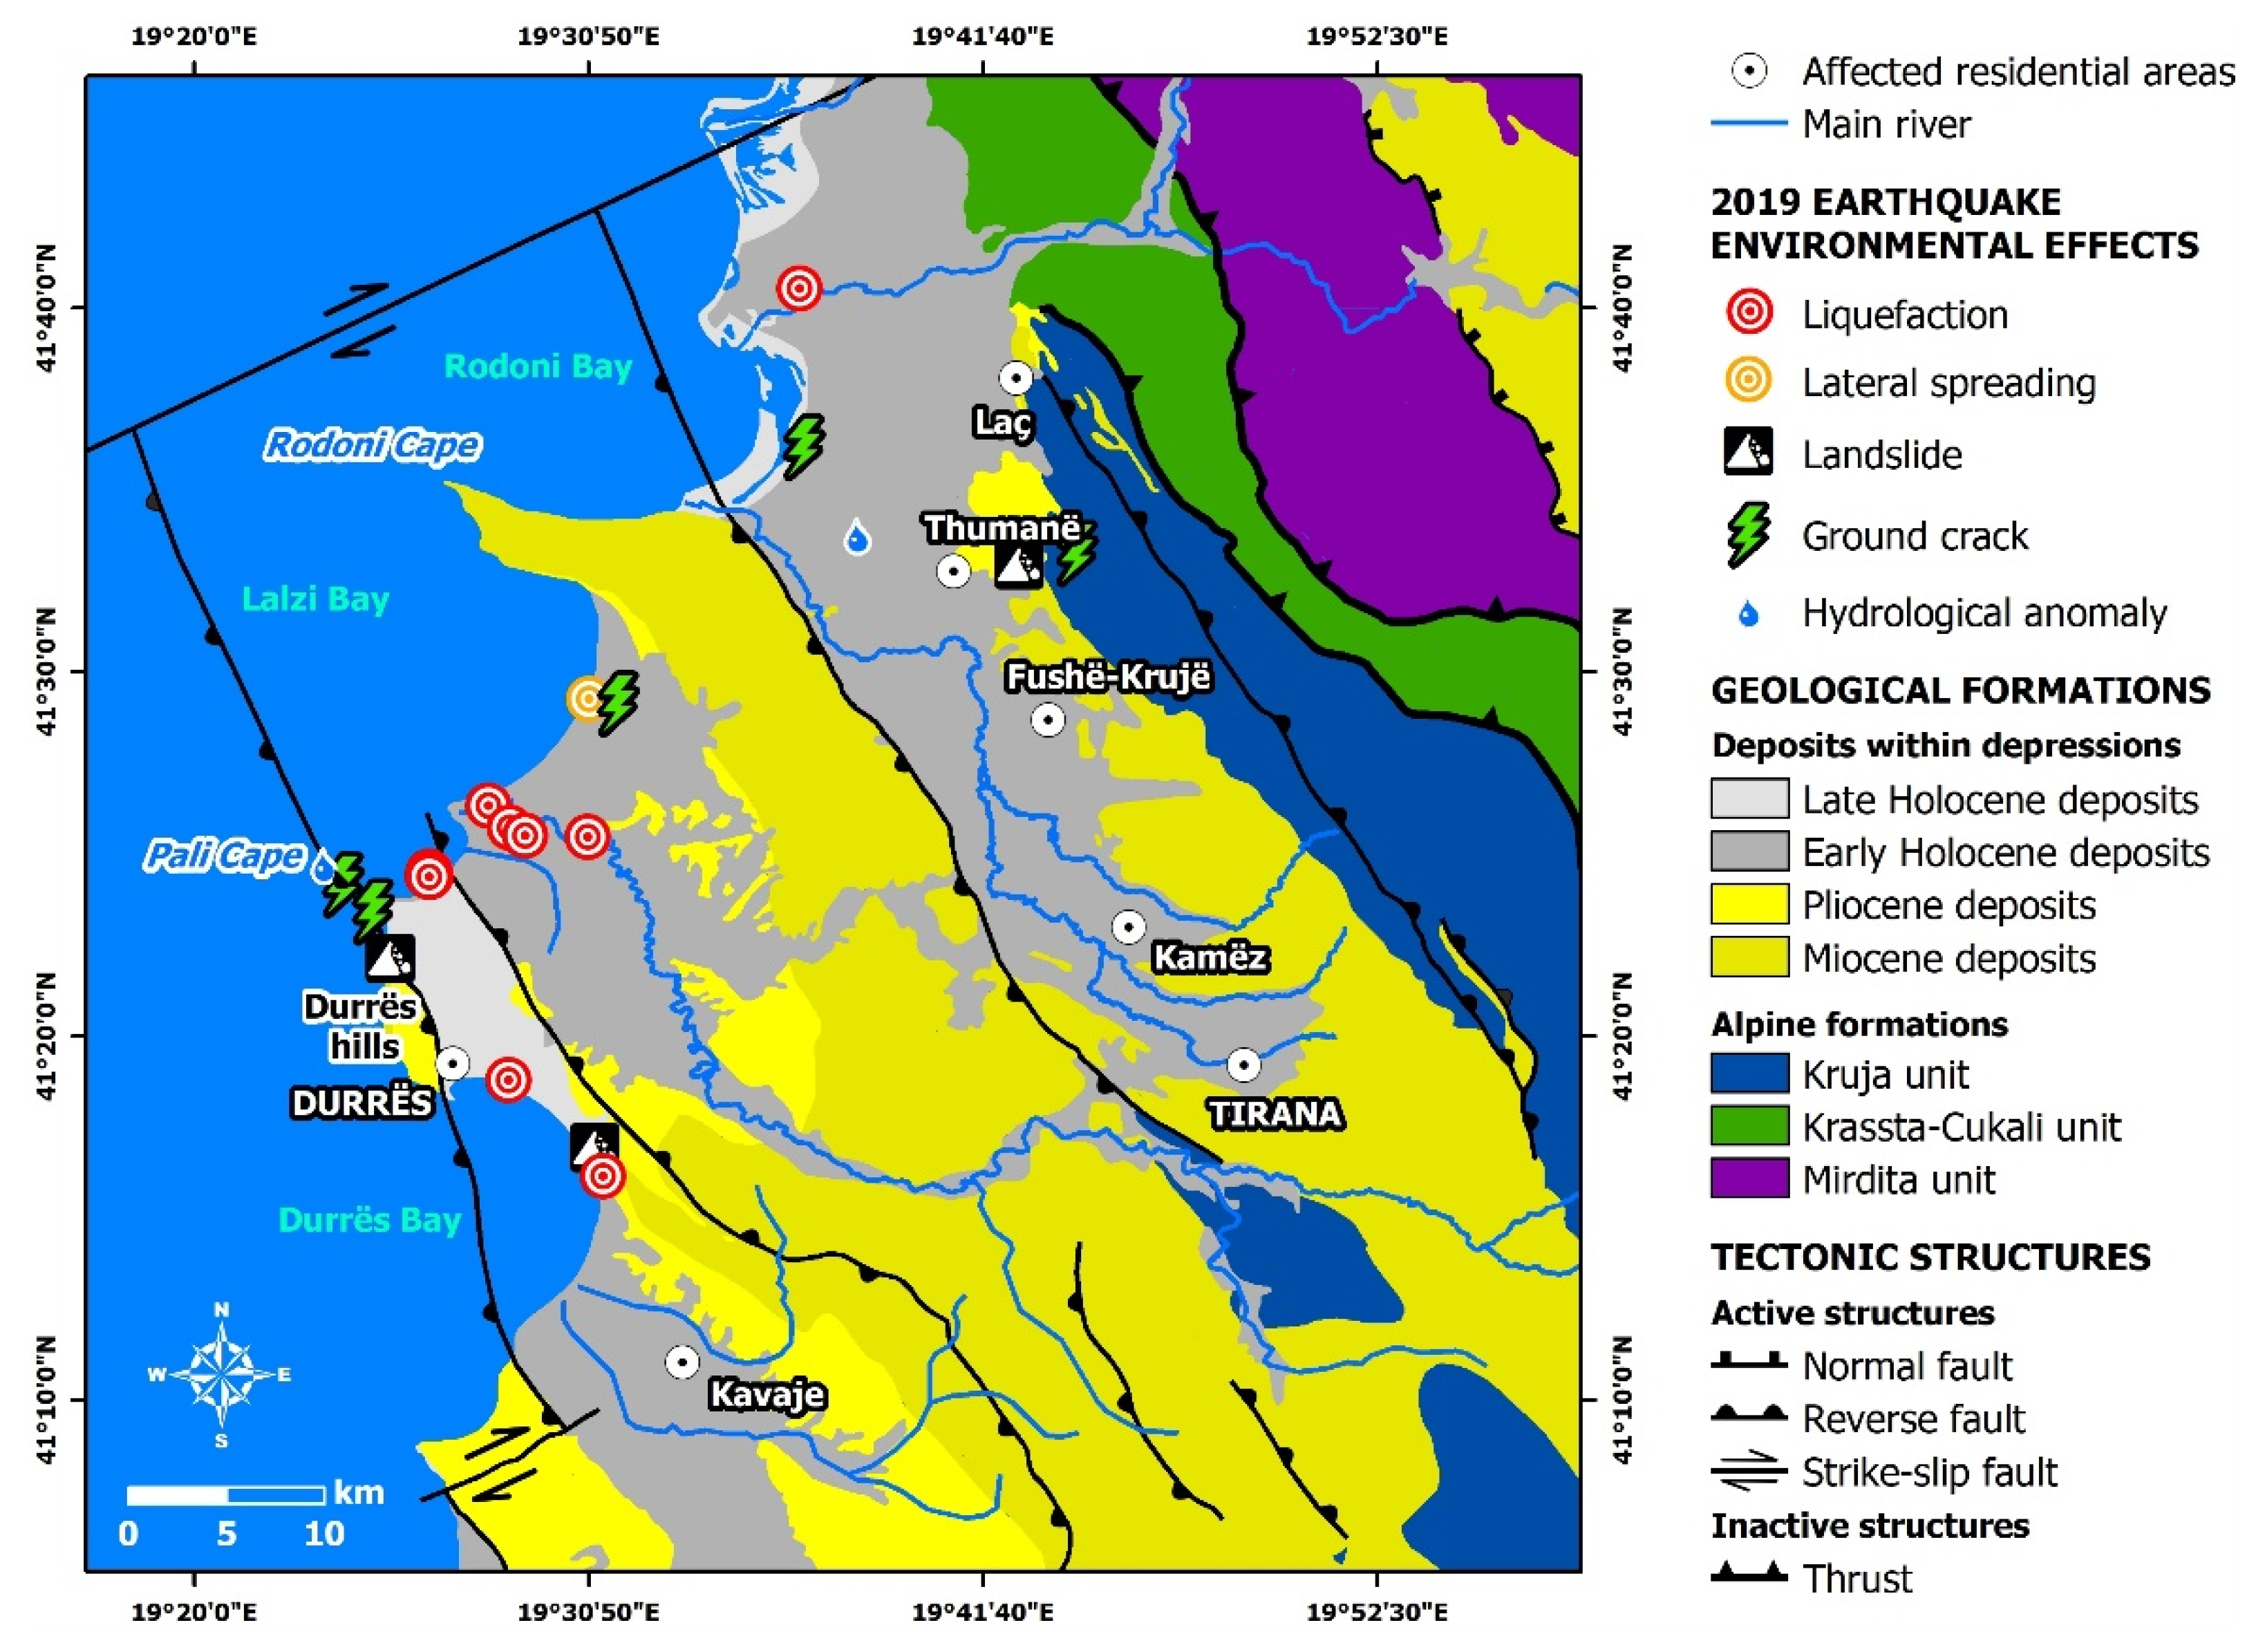
6.1.1. Classification of Geological Formations

Geological formations were digitized and classified into three major categories: (a) the formations belonging to the geotectonic units of the external Albanides (Ionian, Kruja, Krasta–Cukali units), (b) the formations belonging to the geotectonic units of the internal Albanides (Mirdita unit) and (c) the recent deposits of Neogene and Quaternary age. This classification aimed to the analysis of the recent deposits, since geological formations with age older than Pleistocene are little or no susceptible at all to liquefaction [53].
In particular, the Neogene and Quaternary deposits were further classified into (Figure 15a):
  • Late Holocene deposits comprises marshy deposits with sand, gravels and peat and coastal marine deposits with sand and gravels;
  • Early Holocene deposits includes alluvial deposits with sand and gravels and mixed alluvial and marshy deposits;
  • Pleistocene deposits;
  • Pliocene deposits, comprising clays, sandstones, and conglomerates;
  • Miocene deposits comprising Lower Aquitanian marine clays, moraines and coal, Burdigalian marls, clays and limestones, Tortonian sandstones, clays and conglomerates and Messinian sandstones, clays, and sandstones.

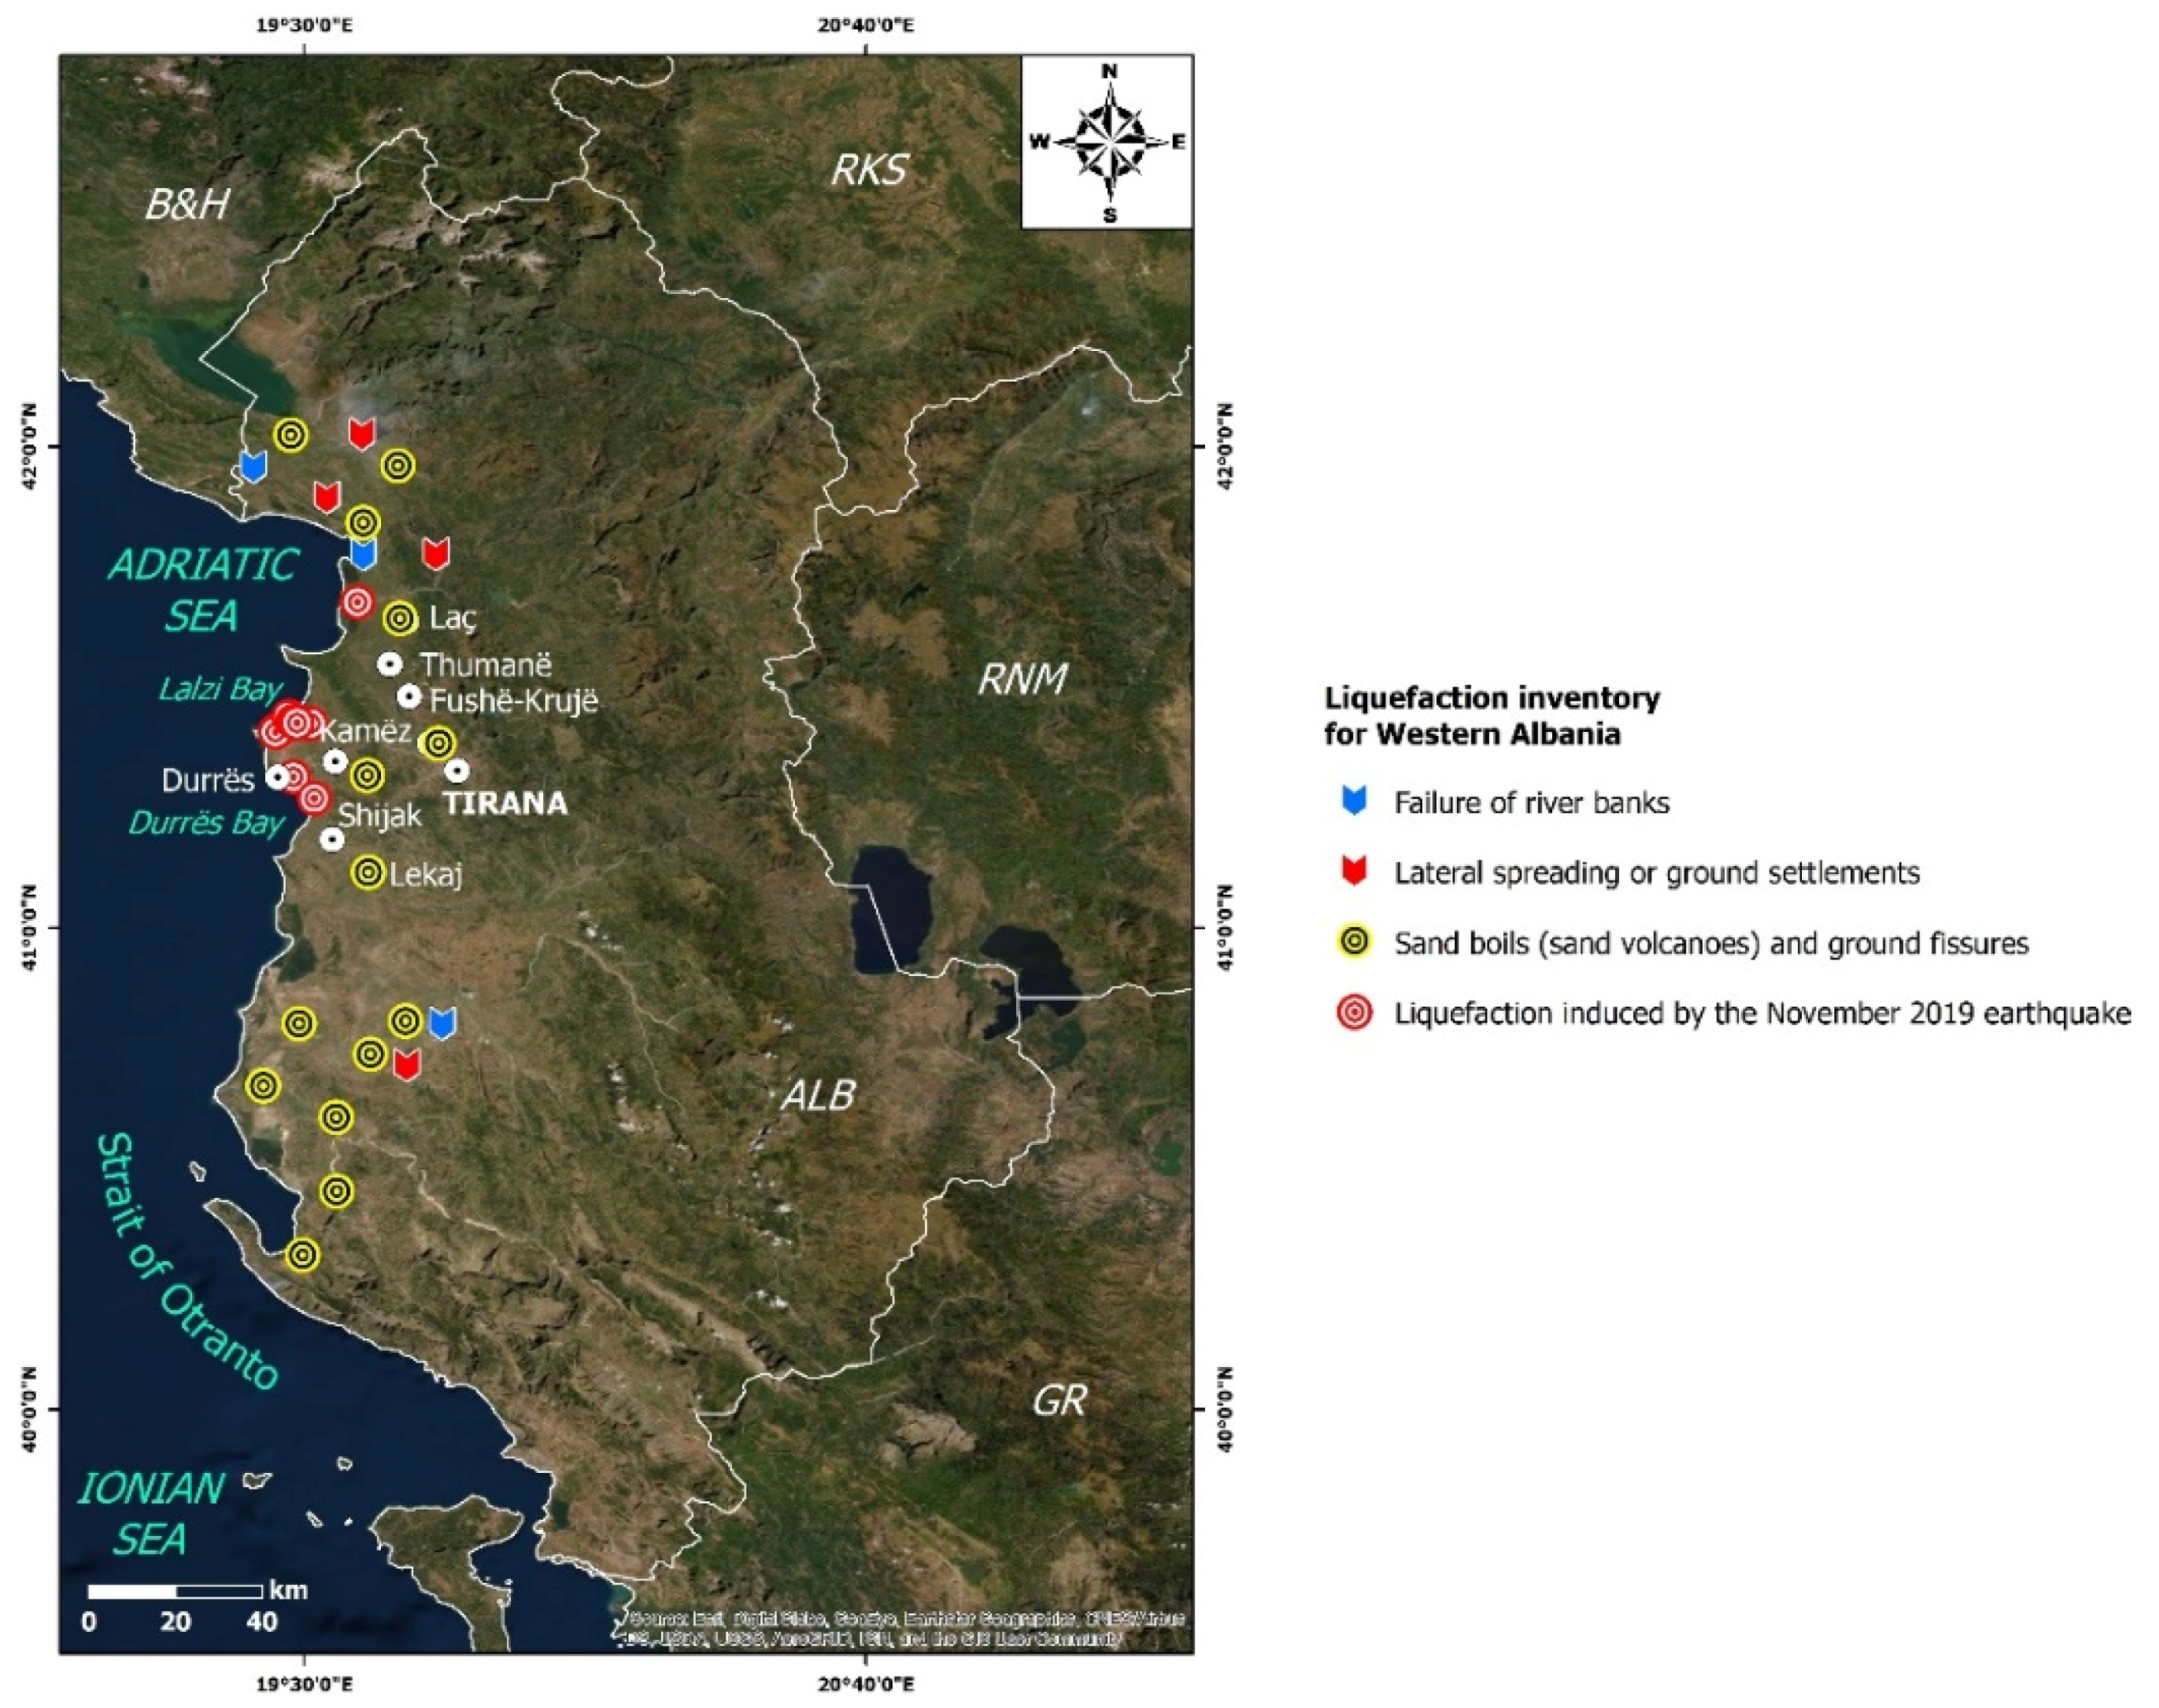
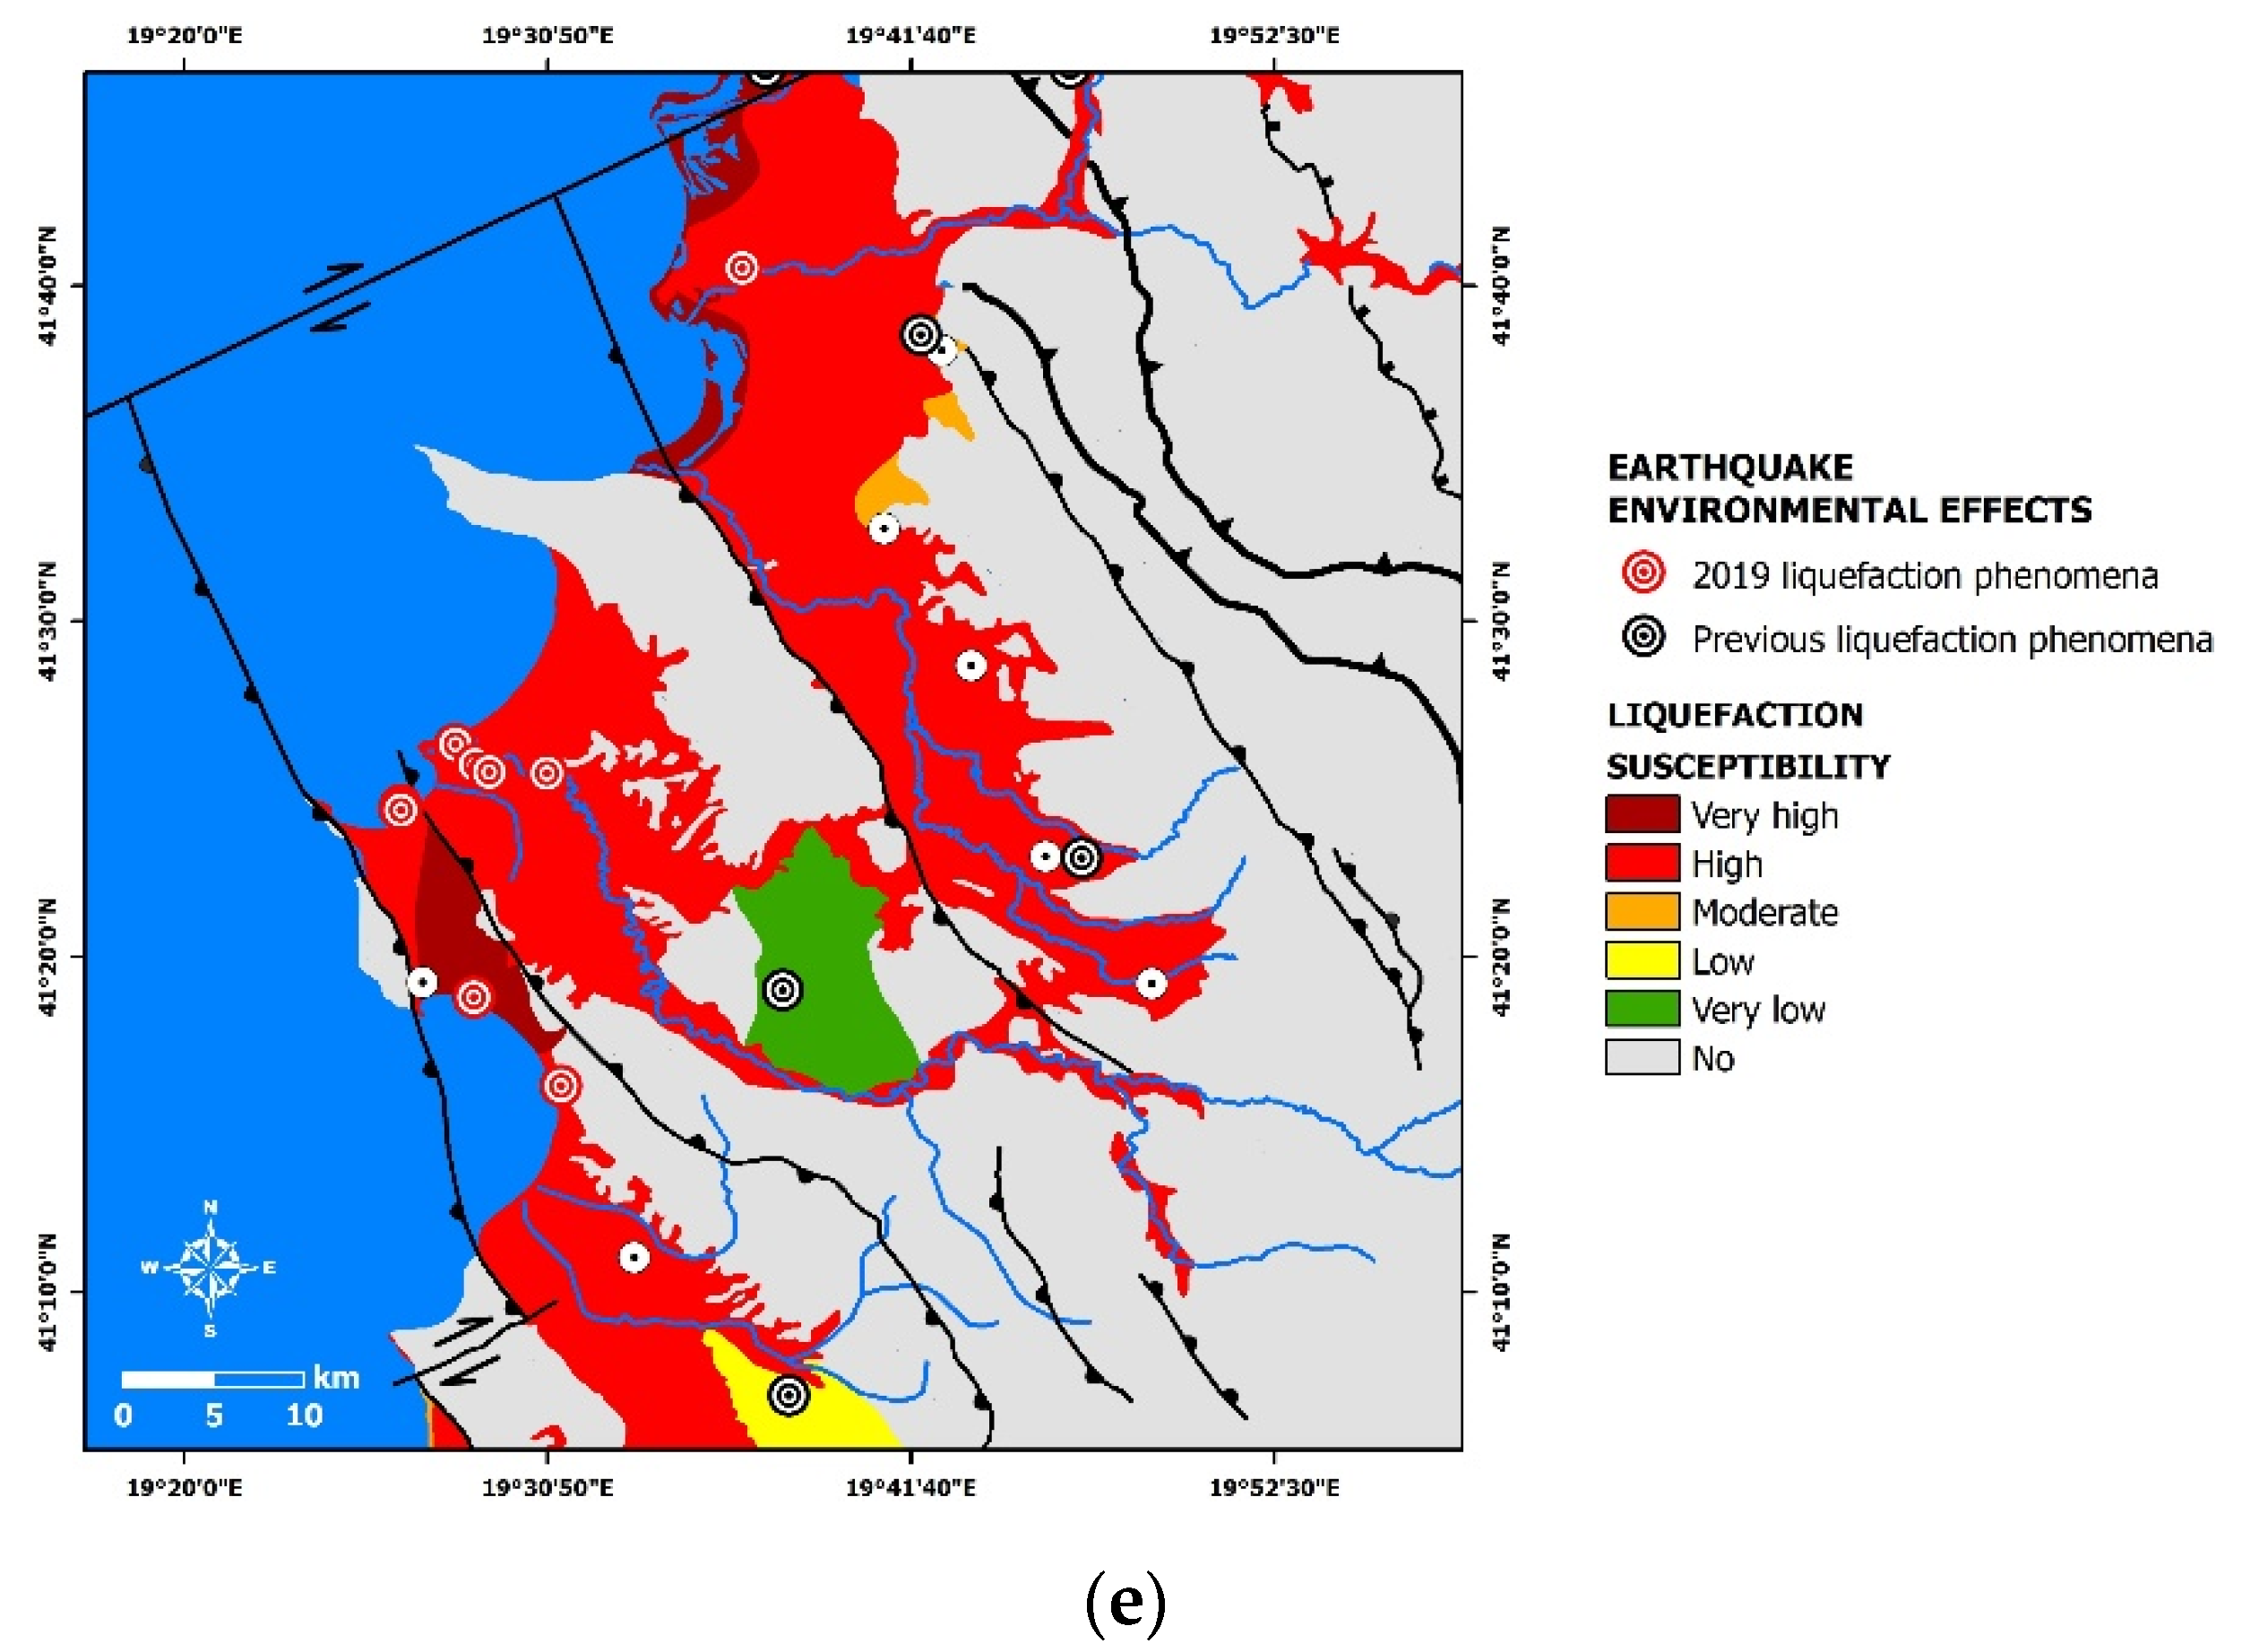
6.1.2. Liquefaction Inventory Map of the 26 November 2019, Mw = 6.4 Earthquake-Affected Area

Liquefaction inventory maps for the earthquake affected area were created using data from the study on the environmental effects induced from historical and recent earthquakes in Western Albania. Data includes liquefaction sites and types induced by historical and recent earthquakes, as well as qualitative and quantitative information related to the resulted geoforms based on [18,28,33,34,35,36]. Earthquake-induced liquefaction phenomena have been mainly observed in the Periadriatic Depression during strong earthquakes of the 20th century [18,28,33,34,35,36] (Figure 15a) as already mentioned in the respective chapters above.

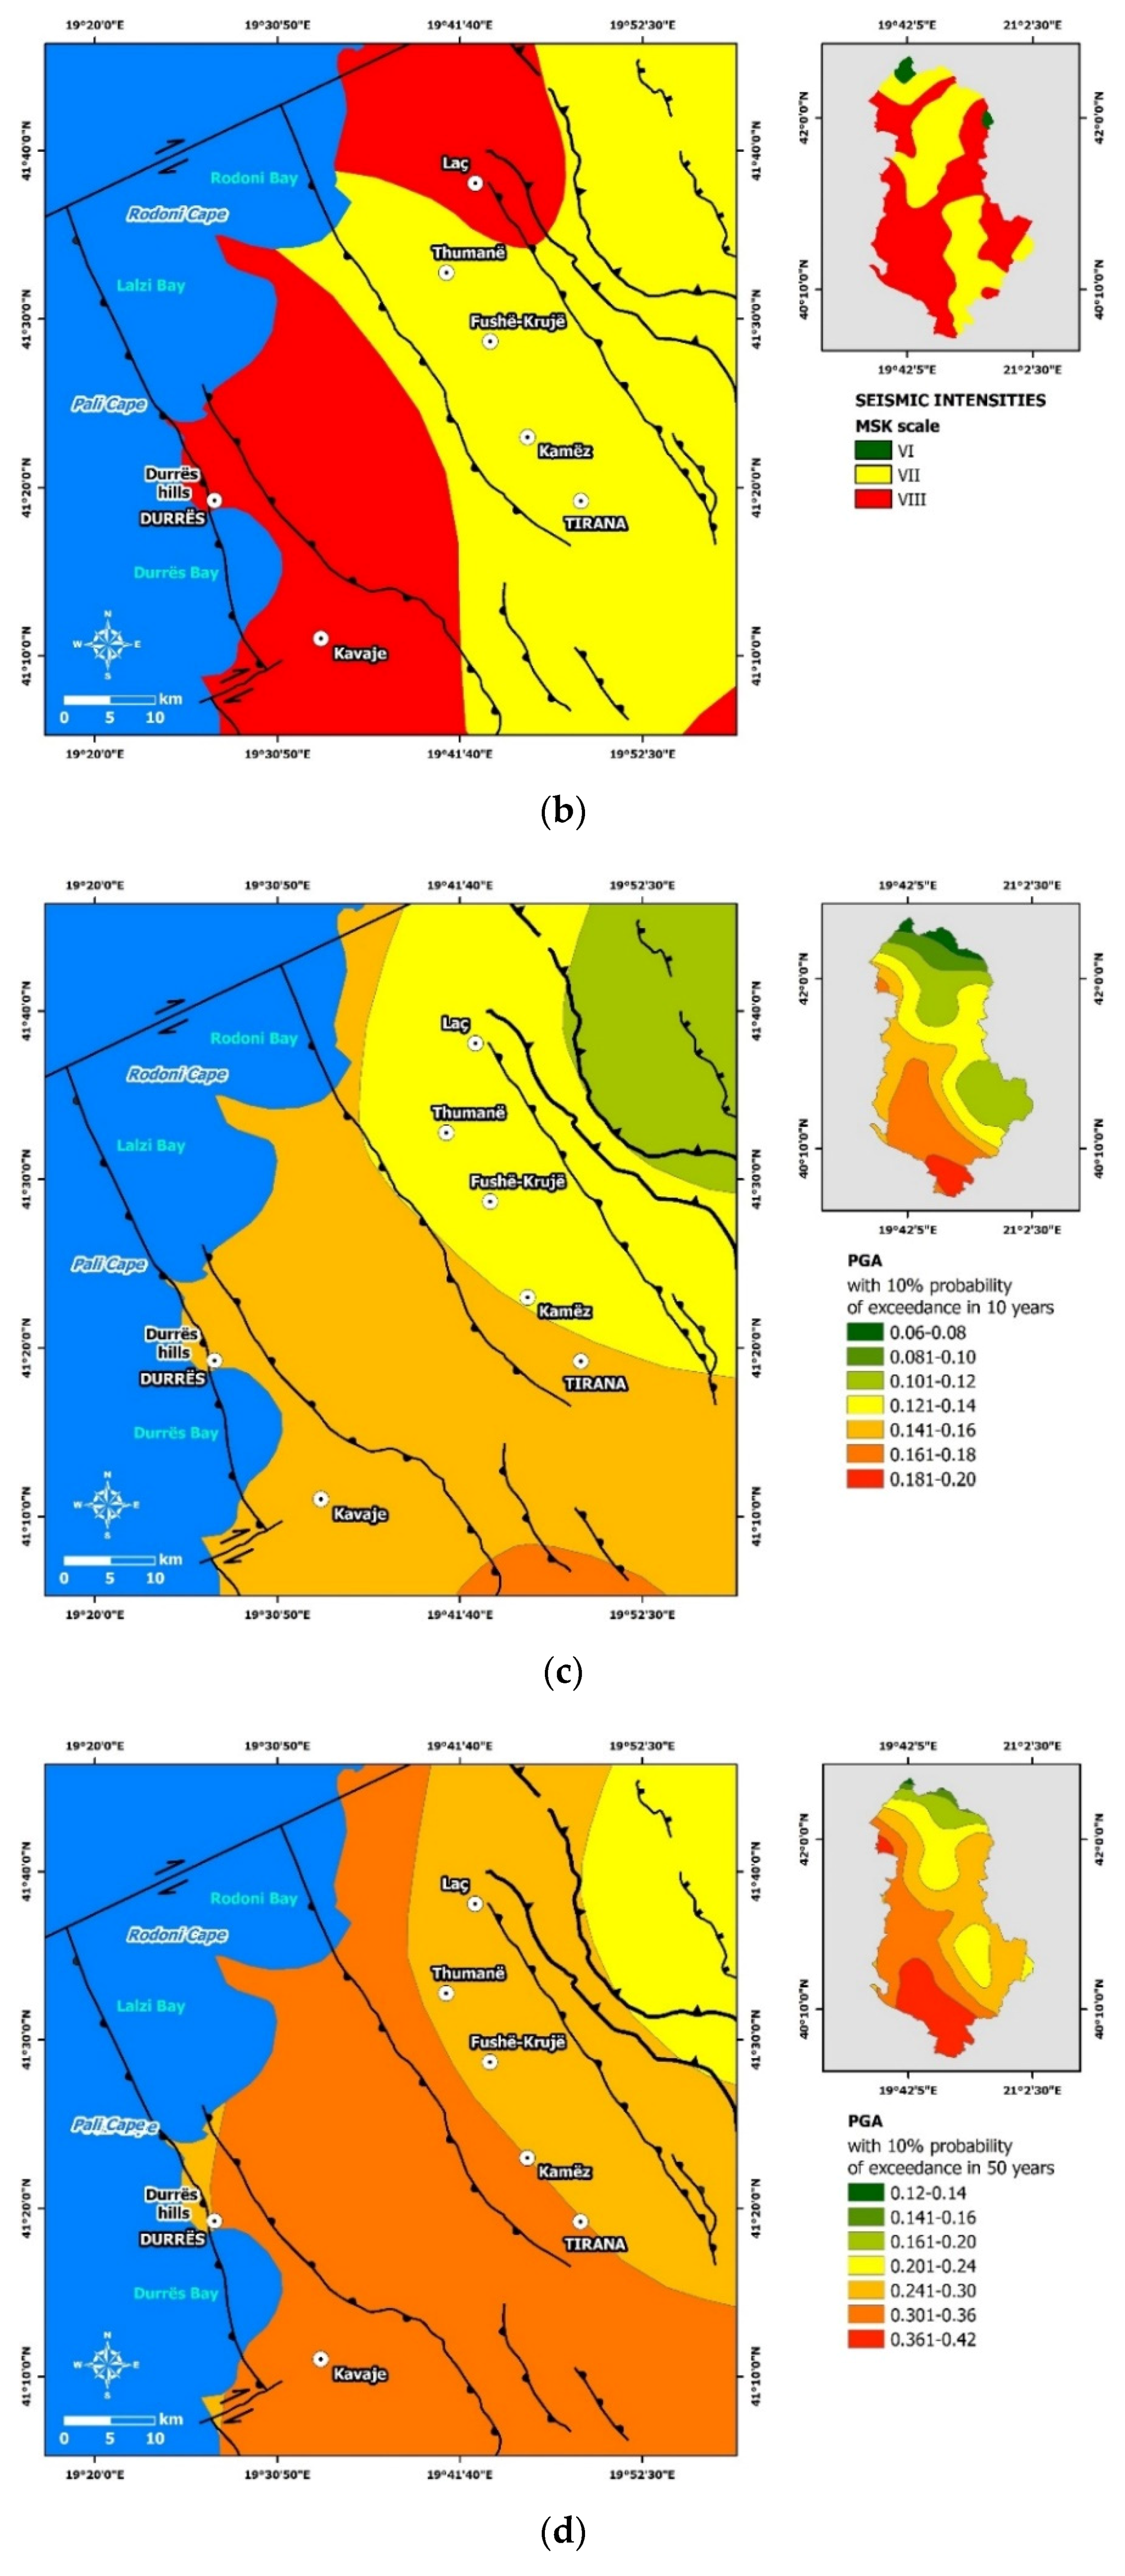
6.1.3. Seismic Hazard and Seismic Zonation of the 26 November 2019, Mw = 6.4 Earthquake-Affected Area

The third examined criterion was the classification of areas based on the seismic zonation and the seismic hazard maps of Albania [49,50,51,52].
In the seismic zonation map of Albania, the country is classified into zones based on seismic intensities and not on design accelerations. In particular, three zones are delineated based on the observed maximum intensities according to the MSK-64 scale: (a) the VIIIMSK-64 zone, (b) the VIIMSK-64 zone, and (c) the VIMSK-64 zone (Figure 15b). The western part of the earthquake affected area belongs to the first zone with VIIIMSK-64, while its eastern part to the second zone with VIIMSK-64 (Figure 15b).
In the probabilistic seismic hazard maps of Albania [50,51,52], the country is classified into zones based on the: (a) the peak ground acceleration for 10-percent probability of exceedance in 10 years (return period of 95 years) (Figure 15c); and (b) peak ground acceleration for 10-percent probability of exceedance in 50 years (return period of 475 years) (Figure 15d). Based on the first seismic hazard map, the western part of the earthquake affected area located in coastal Durrës area is characterized by PGA ranging from 0.12 to 0.14 g, while the eastern part of the earthquake affected area located in Tirana depression is characterized by PGA ranging from 0.14 to 0.16 g for 10-percent probability of exceedance in 10 years (return period of 95 years) (Figure 15c). Based on the second seismic hazard map, the western part of the earthquake affected area is characterized by PGA ranging from 0.24 to 0.30 g, while the eastern part by PGA ranging from 0.30 to 0.36g for 10-percent probability of exceedance in 50 years (return period of 475 years) (Figure 15d).

6.2. Liquefaction Susceptibility Classes

Initially, susceptibility classes were assigned based on geological criteria (age and depositional environment) and seismological criteria (peak ground acceleration based on the updated seismic hazard maps of Albania). In particular:
  • The latest Holocene deposits in the Periadriatic and Tirana depressions (marshy deposits with sand gravel and peat and coastal marine deposits with sand and gravels) are classified into very highly, highly, and moderately susceptible formations, when they are located in areas with expected PGA values of 0.30–0.36 g, 0.24–0.30 g, and 0.16–0.24 g respectively.
  • The early Holocene deposits (alluvial deposits with sand and gravels as well as mixed alluvial and marshy deposits) are classified into highly susceptible formations in seismic zones of 0.30–0.36 g and moderately susceptible formations in seismic zones of 0.24–0.30 g and 0.16–0.24 g, respectively.
  • The Pleistocene deposits are classified into low and very low susceptible formations in areas where the expected peak ground acceleration values are 0.30–0.36 g and 0.24–0.30 g for the low and 0.16–0.24 g for the very low susceptibility.
  • The Pliocene and Miocene deposits are classified into formations with no liquefaction susceptibility.
  • The formations of the Kruja, Krassta, and Mirdita units are considered as solid basement formations and are excluded from the liquefaction susceptibility assessment.
Then, the occurrence of liquefaction phenomena due to historical and recent earthquakes in the earthquake-affected area was studied and the susceptibility to liquefaction was redefined and updated. If liquefaction was induced by a historical or recent earthquake in a site, then the liquefaction susceptibility of the affected deposits is upgraded to the next susceptibility class. For example, liquefaction phenomena were generated in Shijak area in Miocene formations considered as formations with no liquefaction susceptibility. For this reason, the liquefaction susceptibility of the Miocene deposits in this area is upgraded to the next susceptibility class, which is the very low susceptibility. The same case was observed in Lekaj area, located southeast of Kavaje. Liquefaction phenomena were generated in Pliocene deposits and consequently they are classified as deposits with low liquefaction susceptibility.
At the end of the above classification, five categories of liquefaction susceptibility resulted from geological criteria, seismological parameters, and information on historical and recent liquefaction phenomena (Figure 15e):
  • Very high susceptibility in areas comprising latest Holocene deposits in zones of expected PGA with values 0.30–0.36 g.
  • High susceptibility in areas comprising latest Holocene deposits in zones of expected PGA with values 0.24–0.30 g and early Holocene deposits in zones of expected PGA with values 0.30–0.36 g.
  • Moderate susceptibility in areas including latest Holocene deposits in zones of expected PGA with values 0.16–0.24 g and early Holocene deposits in zones of expected PGA with values 0.24–0.30 g and 0.16–0.24 g.
  • Low susceptibility in areas including Pleistocene deposits in zones of expected PGA with values 0.30–0.36 g and 0.24–0.30 g.
  • Very low susceptibility in areas composed of Pleistocene deposits located in zones of expected PGA with values 0.16–0.24 g.
Taking into account the abovementioned classes, a liquefaction susceptibility map of the 26 November 2019, Mw = 6.4 earthquake-affected area was compiled (Figure 15e).

6.3. Liquefaction Phenomena and Susceptible Zones

From the spatial distribution of the liquefaction phenomena induced by the 26 November 2019, Mw = 6.4 Durrës earthquake and the liquefaction susceptibility map, it is concluded that the observed phenomena were generated in zones of very high and high susceptibility to liquefaction (Figure 15e). More specifically, the liquefaction phenomena in the coastal part of Durrës city were generated within zones with very high liquefaction susceptibility, while liquefaction in the Erzeni River estuary, in Rinia–Fllakë Lagoon as well as in Jubë and Tale areas were distributed within zones with high liquefaction susceptibility (Figure 15e).

7. Discussion

Taking into account the spatial distribution of the liquefaction phenomena induced by the 26 November 2019, Mw = 6.4 Durrës earthquake, it is concluded that all liquefaction phenomena were not randomly distributed in the affected areas, but they were lithologically and structurally controlled. This is indicated by the fact that they were generated in localities of the western and the eastern earthquake-affected areas, which present similar geological setting, lithology, macrostructures, and marginal faults (Figure 16).
The western most affected area corresponds to the Spitalia syncline with a NW–SE trending fold axis. It is bounded to the west and east by active NW–SE striking thrust faults. It is composed of soft alluvial, lagoonal and marine coastal deposits of Holocene age overlaying the alpine basement, while swampy soils constitute the lowlands of the plain. This syncline forms a NW–SE trending zone (Figure 16) with orientation similar to the orientation of macrostructures (synclines and anticlines with NW–SE trending fold axis) and active tectonic structures (marginal NW–SE striking backthrusts and thrusts) of the western affected area (Figure 16). Moreover, this NW–SE trending zone have the same trend with the NW–SE striking seismogenic thrust fault of the 26 November 2019 Mw = 6.4 earthquake as it is derived from the provided fault plane solutions. The epicenter of the mainshock is located also within this NW–SE trending zone and in small distances from the liquefied sites.
The liquefaction localities induced in the western most affected area are located within the Spitalia syncline. As regards, the impact of the mainshock in the environment, landslides, ground cracks and hydrological anomalies were also observed in this syncline [1,54]. It is significant to note that the environmental effects induced by the 21 September 2019, Mw = 5.6 Durrës foreshock were also observed on the southward extension of the aforementioned NW–SE trending zone. More specifically, landslides were induced at slopes along the road leading from Durrës to Kavajë (Shkembi i Kavajës), located southeast of Durrës [38] (Figure 16). The landslide affected area comprises steep slopes formed by Pliocene clays. The mobilized material temporarily blocked the road without any other serious effects on the road asphalt surface, vehicles and drivers [38].
Similar conditions from the geological and lithological point of view occur at the eastern most affected area (Figure 16), where environmental effects comprising liquefaction, landslides, ground cracks, and hydrological anomalies were also induced by the November 2019 mainshock. These affected sites are over the Tirana syncline with a NW–SE trending fold axis and active NW–SE striking thrust faults along its margins. It is composed of soft Holocene alluvial deposits and swampy soils in lowlands east of Laç and Thumanë areas. Taking into account the spatial distribution of the liquefaction and the building damage localities in the Tirana Depression [1], it is concluded that they are also arranged within a NW–SE trending zone (Figure 16). The orientation of this zone is similar to the orientation of macrostructures (synclines and anticlines with NW–SE trending fold axis) and active tectonic structures (marginal NW–SE striking backthrusts and thrusts) of the eastern affected area (Figure 16).
All these properties and characteristics give the western and eastern most affected areas a high susceptibility and potential for the generation of liquefaction phenomena with great impact on the highly populated parts, as it clearly shown from the environmental effects induced by historical and recent earthquakes generated in western Albania. Moreover, the liquefaction by the 26 November 2019, Mw = 6.4 Durrës earthquake was generated in areas with heavy structural and non-structural damage to buildings and infrastructures corresponding to maximum intensities of VIII–IXEMS-98. This fact indicates that the Albanian antiseismic building code has to integrate the security factor against liquefaction in its upcoming updates and revisions.

8. Conclusions

As regards the liquefaction phenomena, several factors control their generation, type, and size. These factors are related to the earthquake parameters, to the site conditions and the soil properties [55]. In this paper, the spatial distribution and type of the liquefaction phenomena induced by the 26 November 2019, Mw = 6.4 Durrës earthquake are presented among others and the factors controlling their distribution are discussed.
The main characteristics of liquefaction distribution worldwide is that these phenomena often occur in areas with saturated and loose sandy soils and are distributed near the earthquake epicenter [56]. The saturated ground is a precondition for liquefaction to take place and when the groundwater is close to the surface, liquefaction can easily start [57]. Most liquefaction phenomena are generally observed near rivers, lakes, lagoons, or coastal areas, owing to soil property and groundwater level there [56]. Such liquefaction distribution examples in coastal, riverside and lakeside areas have occurred worldwide [58,59,60,61,62,63]. Taking into account other historical and recent earthquakes and their impact in western Albania, it is concluded that liquefaction phenomena mainly comprising sand boils, ground fissures, lateral spreading, and ground settlements have been distributed along coasts and river banks of the Adriatic coastal part of Albania [28].
Similar liquefaction distributions have been also observed in adjacent earthquake-affected areas and countries surrounding Albania with similar lithological, geological, and seismological characteristics and properties with the November 2019 earthquake-affected area. Characteristic examples have been induced by earthquakes generated in the Central Ionian Islands and the Northwestern Peloponnese, both located in the adjacent western Greece. This area is located in a distance of about 300 to 400 km south of Durrës and it is characterized by similar alpine formations, post-alpine deposits, and lithologies with Western Albania, as it is concluded by the study of the major tectonic and geological units of the western Balkan and the surrounding regions of the Carpathians, Dinarides, and Hellenides presented by [64]. The liquefaction phenomena induced by the 8 June 2008, Mw = 6.4 Andravida earthquake in Northwestern Peloponnese were exclusively observed along coastal areas, river banks, and lake shores [65]. Liquefaction induced by the 26 January and 3 February 2014, Mw = 6.0 earthquakes in Cephalonia Island were exclusively along the coastal parts of the most affected areas [66,67]. Moreover, liquefaction induced by the 17 November 2015, Mw = 6.4 earthquake in Lefkada Island was also observed in waterfront port structures of the affected area [68].
This is also the case for the liquefaction phenomena triggered by the 26 November 2019, Mw = 6.4 Durrës earthquake. Liquefaction phenomena were induced in the western coastal part of the Periadriatic Depression and along the eastern margin of the Tirana Depression. Liquefaction in the first area was generated along the coastal part of Durrës city, in the central part of the Rinia–Fllakë Lagoon and close to the Erzeni River estuary, while in the second area liquefaction was generated in Tale area, close the Mati River estuary. They included typical forms such as individual sand boils, alignment of sand boils along cracks and water and sand fountains. Based on the orientation of the observed ground cracks in the studied sites, it is concluded that there is no preferred trend. The observed phenomena contributed to the generation of very heavy structural damage in the coastal part of Durrës city, slight non-structural damage to buildings close to the Erzeni River estuary and slight damage to lifelines in the Rinia–Fllakë Lagoon.
The farthest liquefaction feature induced by the 26 November 2019, Mw = 6.4 Durrës earthquake was generated in Tale area at a distance of about 31 km away from the earthquake epicenter. This site is far away in relation to the other sites observed in the coastal part of the Periadriatic Depression, whose distances range from 4.5 to 16 km. All recorded distances are clearly smaller than the maximum epicentral distance predicted by empirical relationships between magnitude and distance for liquefaction proposed by [69,70] for earthquakes and induced liquefaction phenomena worldwide.

Author Contributions

Conceptualization, S.M. and E.L.; methodology, S.M.; validation, S.M.; investigation, S.M. and E.L.; data curation, S.M.; writing—original draft preparation, S.M.; writing—review and editing, S.M., E.L. and P.C.; visualization, S.M.; supervision, S.M. and E.L. All authors have read and agreed to the published version of the manuscript.

Funding

This research received no external funding.

Acknowledgments

This paper is a contribution to the Post-Graduate Program “Environmental, Disaster, and Crises Management Strategies”, Department of Dynamic, Tectonic and Applied Geology, Faculty of Geology and Geoenvironment, National and Kapodistrian University of Athens, Greece, which supported the post-event field surveys.

Conflicts of Interest

The authors declare no conflict of interest.

References

  1. Lekkas, E.; Mavroulis, S.; Papa, D.; Carydis, P. The 26 November 2019 Mw = 6.4 Durrës (Albania) earthquake. Newsl. Environ. Disaster Cris. Manag. Strateg. 2019, 15, 80. [Google Scholar] [CrossRef]
  2. Papadopoulos, G.A.; Agalos, A.; Carydis, P.; Lekkas, E.; Mavroulis, S.; Triantafyllou, I. The 26 November 2019 Mw = 6.4 Albania destructive earthquake. Seismol. Res. Lett. 2020, 91, 3129–3138. [Google Scholar] [CrossRef]
  3. Stefanidou, S.; Tsiatas, G.; Baltzopoulos, G.; Giarlelis, C.; Markogiannaki, O.; Skoulidou, D.; Fragiadakis, M.; Lombardi, L.; Mavroulis, S.; Plaka, A.; et al. Structural and Geotechnical damage due to Albania Earthquake (26.11.2019) based on Rapid Visual Screening. In Proceedings of the 2020 International Symposium on Durrës Earthquakes and Eurocodes, Polytechnic University of Tirana, Tirana, Albania, 11 April 2020. [Google Scholar]
  4. Sextos, A.; Lekkas, E.; Stefanidou, S.; Baltzopoulos, G.; Fragkiadakis, M.; Giarlelis, C.; Lombardi, L.; Markogiannaki, O.; Mavroulis, S.; Plaka, A.; et al. Albania Earthquake of 26 November 2019. Report on Structural and Geotechnical Damage; Hellenic Association of Earthquake Engineering: Athens, Greece, 2020; 47p. [Google Scholar] [CrossRef]
  5. Ganas, A.; Elias, P.; Briole, P.; Cannavo, F.; Valkaniotis, S.; Tsironi, V.; Partheniou, E.I. Ground deformation and seismic fault model of the M6.4 Durres (Albania) Nov. 26, 2019 earthquake, based on GNSS/INSAR observations. Geosciences 2020, 10, 210. [Google Scholar] [CrossRef]
  6. Moshou, A.; Dushi, E.; Argyrakis, P. A Preliminary Report on the 26 November 2019, Mw = 6.4 Durres, Albania; European-Mediterranean Seismological Centre: Essonne, France, 2019; 12p. [Google Scholar]
  7. Aliaj, S.; Baldassarre, G.; Shkupi, D. Quaternary subsidence zones in Albania: Some case studies. Bull. Eng. Geol. Environ. 2001, 59, 313–318. [Google Scholar] [CrossRef]
  8. Skrami, J. Structural and neotectonic features of the Periadriatic Depression (Albania) detected by seismic interpretation. Bull. Geol. Soc. Greece 2001, 34, 1601–1609. [Google Scholar] [CrossRef] [Green Version]
  9. Aliaj, S.; Melo, V.; Hyseni, A.; Skrami, J.; Mehillka, L.L.; Muço, B.; Sulstarova, E.; Prifti, K.; Pasko, P.; Prillo, S. Neotectonic Structure of Albania. Final Report; Archive of Seismological Institute of Academy of Sciences: Tirana, Albania, 1996. [Google Scholar]
  10. Puca, N. Scientific Report: Monitoring of Groundwater in the Main Aquifers of Albania-Erzen–Ishmi Aquifer; Archives of Geological Survey of Albania: Tirana, Albania, 2005. [Google Scholar]
  11. Eftimi, R. Permeability features of Rrogozhina suite. Bull. Albanian Geol. Surv. 1984, 3, 57–73. [Google Scholar]
  12. Hyseni, A. Structure and Geodynamic Evaluation of Pliocene Molasses of Pre-Adriatic Depression. Ph.D. Thesis, Polytechnic University of Tirana, Tirana, Albania, 1995. [Google Scholar]
  13. Gelati, R.; Diamanti, F.; Prence, J.; Cane, E.H. The stratigraphic record of Neogene events in the Tirana Depression. Riv. Ital. Paleontol. Stratigr. 1997, 103, 81–100. [Google Scholar]
  14. Institute of Geosciences. Geological Map of Albania in 1:200000 Scale; Institute of Geosciences: Tirana, Albania, 1983. [Google Scholar]
  15. Hysenaj, R.; Naco, P.; Bojaxhiu, M.; Ahmeti, H. Deep subsurface geological phenomena and related processes in the Elbasani-Tirana region, Albania. J. Int. Environ. Appl. Sci. 2009, 4, 191–197. [Google Scholar]
  16. Papazachos, B.C.; Savvaidis, A.S.; Papazachos, C.B.; Papaioannou, C.; Kiratzi, A.A.; Muco, B.; Koçiu, S.; Sulstarova, E. Atlas of Isoseismal Maps for Shallow Earthquakes in Albania and Surrounding Area (1851–1990); Publication No 10; Aristotle University of Thessaloniki, Geophysical Laboratory: Thessaloniki, Greece, 2001. [Google Scholar]
  17. Ambraseys, N. Earthquakes in the Mediterranean and Middle East: A Multidisciplinary Study of Seismicity up to 1900; Cambridge University Press: Cambridge, UK, 2009. [Google Scholar]
  18. Aliaj, S.; Koçiu, S.; Muço, B.; Sulstarova, E. Seismicity, Seismotectonics and Seismic Hazard Assessment in Albania; Academy of Sciences of Albania: Tirana, Albania, 2010. [Google Scholar]
  19. Muço, B.; Kiratzi, A.; Aliaj, S.; Sulstarova, E.; Koçiu, S.; Peçi, V. Seismic hazard assessment of Albania using probabilistic approach. In Proceedings of the 28th General Assembly of European Seismological Society, Book of Abstracts, University of Genoa, Genoa, Italy, 1–6 September 2002. [Google Scholar]
  20. Sulstarova, E.; Koçiaj, S.; Muço, B.; Peci, V. The Albanian Earthquakes Catalogue for Historical and Instrumental Data with Magnitude M ≥ 4.5; Internal Report (on behalf of NATO Project “Seismotectonic and Seismic Hazard Assessment in Albania”, 1999–2002); Seismological Institute: Tirana, Albania, 2003. [Google Scholar]
  21. Fundo, A.; Duni, L.; Kuka, S.; Begu, E.; Kuka, N. Probabilistic seismic hazard assessment of Albania. Acta Geod. Geophys. Hung. 2012, 47, 465–479. [Google Scholar] [CrossRef]
  22. Sulstarova, E.; Koçiaj, S.; Aliaj, A. Seismic Zonation of Albania; Archive of Seismological Institute: Tirana, Albania, 1980. [Google Scholar]
  23. Aliaj, S. Seismic Source Zones in Albania. In Proceedings of the Albanian Seminar, Paris, France, 26–28 June 2003; Archive of Seismological Institute: Tirana, Albania, 2003. [Google Scholar]
  24. Sulstarova, E.; Koçiaj, S. The Dibra (Albania) earthquake of November 30, 1967. Tectonophysics 1980, 67, 333–343. [Google Scholar] [CrossRef]
  25. Carydis, P.G.; Vougioukas, E.A. The Tirana, Albania, Earthquake of January 9, 1988; Special Earthquake Report; Earthquake Engineering Research Institute: Oakland, CA, USA, 1988. [Google Scholar]
  26. Papazachos, B.; Papazachou, C. The Earthquakes of Greece; Ziti Publications: Thessaloniki, Greece, 1997. [Google Scholar]
  27. Sulstarova, E.; Koçiu, S.; Muço, B.; Peçi, V. The Revised Catalogue of Albanian Earthquakes with Ms ≥ 4.5 (Prepared into the Framework of NATO’s ALB-SEIS Project); Institute of Seismology: Tirana, Albania, 2001. [Google Scholar]
  28. Koçiu, S. Induced seismic impacts observed in coastal area of Albania: Case studies. In Proceedings of the 5th International Conference on Case Histories in Geotechnical Engineering, Missouri University of Science and Technology, New York, NY, USA, 13–17 April 2004. [Google Scholar]
  29. Duni, L.L.; Kuka, N. The earthquake of September 5, 2007 (Mw = 4.8) in Albania. Analysis of the accelerographic data recorded in Durresi town. In Proceedings of the 14th World Conference on Earthquake Engineering, Beijing, China, 12–17 October 2008. [Google Scholar]
  30. Sulstarova, E.; Koçiaj, S. The Catalogue of Albanian Earthquakes; Academy of Sciences of Albania: Tirana, Albania, 1975. [Google Scholar]
  31. Koçiu, S.; Pitarka, A. A check-up on seismic hazard assessment: Tirana case study. Nat. Hazards 1990, 3, 293–305. [Google Scholar]
  32. Duni, L.; Bozo, L.; Kuka, N.; Begu, E. An upgrade of the microzonation study of the centre of Tirana city. In Proceedings of the 5th International Conference on Recent Advances in Geotechnical Earthquake Engineering and Soil Dynamics and Symposium in Honor of Professor I.M. Idriss, San Diego, CA, USA, 24–29 May 2010. Paper No. 6.05b. [Google Scholar]
  33. Petrovski, J.; Paskalov, T. The Earthquake of Montenegro-Yugoslavia of April 15, 1979; IEEES: New York, NY, USA, 1980; p. 65. [Google Scholar]
  34. Koçiaj, S.; Sulstarova, E. The earthquake of June 1, 1905, Shkodra, Albania. Tectonophysics 1980, 67, 319–332. [Google Scholar] [CrossRef]
  35. Shehu, V.; Dhima, N. The influence of engineering–geological conditions on the intensity distribution of the April 15, 1979 earthquake in Shkodra-Lezha region. In The Earthquake of April 15, 1979; The ‘‘8 Nentori’’ Publishing House: Tirana, Albania, 1983. [Google Scholar]
  36. Dibra, Z. Some phenomena of the soil liquefaction of the April 15, 1979 earthquake. In The Earthquake of April 15, 1979; The ‘‘8 Nentori’’ Publishing House: Tirana, Albania, 1983. [Google Scholar]
  37. Papathanassiou, G.; Pavlides, S.; Christaras, B.; Pitilakis, K. Liquefaction case histories and empirical relations of earthquake magnitude versus distance from the broader Aegean Region. J. Geodyn. 2005, 40, 257–278. [Google Scholar] [CrossRef]
  38. Lekkas, E.; Mavroulis, S.; Filis, C.; Carydis, P. The September 21, 2019 Mw 5.6 Albania earthquake. Newsl. Environ. Disaster Cris. Manag. Strateg. 2019, 13. [Google Scholar] [CrossRef]
  39. Lamaj, M.; Frashëri, N.; Bushati, S.; Moisiu, L.; Beqiraj, G.; Avxhi, A. Application of differential interferometry for analysis of ground movements in Albania. In Proceedings of the 9th International Workshop Fringe 2015 Advances in the Science and Applications of SAR Interferometry and Sentinel-1 InSAR Workshop, ESA-ESRIN, ESA SP-731, Frascati, Italy, 23–27 March 2015. [Google Scholar]
  40. Medvedev, S.V. Engineering Seismology; Moscow, English Translation; Israel Program for Scientific Translation: Jerusalem, Israel, 1965. [Google Scholar]
  41. Bedini, E.; Naco, P. Automated change detection from remote sensing data. A case study at the Pali Cape—Erzen River Mouth Coastal Sector. In Conference on Water Observation and Information System for Decision Support; Morell, M., Popovska, C., Morell, O., Stojov, V., Kostoski, G., Dimitrov, D., Drobot, R., Radic, Z., Selenica, A., Eds.; BALWOIS: Ohrid, North Macedonia, 2008. [Google Scholar]
  42. De Leo, F.; Besio, G.; Zolezzi, G.; Bezzi, M.; Floqi, T.; Lami, I. Coastal erosion triggered by political and socio-economical abrupt changes: The case of Lalzit Bay, Albania. In Proceedings of the 35th Conference on Coastal Engineering, Antalya, Turkey, 17–20 November 2016. [Google Scholar] [CrossRef] [Green Version]
  43. Bruci, E.; Kay, R.; Adhami, E.; Gjini, J.; Brew, D.; Mucaj, L.; Mullaj, A.; Ndini, M.; Diku, A.; Laci, S.; et al. Identification and Implementation of Adaptation Response Measures in the Drini–Mati River Deltas; Project Synthesis Support; Global Environment Fund (GEF), Albanian Government and United Nations Development Program (UNDP): Tirana, Albania, 2013. [Google Scholar]
  44. Papathanassiou, G.; Valkaniotis, S.; Chaztipetros, A.; Pavlides, S. Liquefaction susceptibility map of Greece. Bull. Geol. Soc. Greece 2010, 43, 1383–1392. [Google Scholar] [CrossRef] [Green Version]
  45. Papathanassiou, G.; Kiratzi, A.; Valkaniotis, S.; Pavlides, S. Scenario liquefaction hazard map of the gulf of Corinth. In Proceedings of the 2nd European Conference on Earthquake and Engineering Seismology, Istanbul, Turkey, 25–29 August 2014; pp. 639–647. [Google Scholar]
  46. Lozios, S.; Lekkas, E.; Mavroulis, S.; Alexoudi, V.; Sretskovits, M. Actions to Reduce Seismic Risk of the Katerini Municipality—Planning, Selection, Definition Organization of Emergency Shelters; Applied Research Program, National and Kapodistrian University of Athens: Athens, Greece, 2016; 285p. [Google Scholar]
  47. Mavroulis, S.; Diakakis, M.; Kotsi, E.; Vassilakis, E.; Lekkas, E. Susceptibility and hazard assessment in the Ionian Islands for highlighting sites of significant earthquake-related hazards. In Proceedings of the 6th International Conference on Civil Protection & New Technologies, Safe Corfu 2019, Corfu, Greece, 6–9 November 2019; pp. 21–24, ISSN 2654-1823. [Google Scholar]
  48. Papathanassiou, G.; Pavlides, S. GIS-based database of historical liquefaction occurrences in the broader Aegean Region, DALO v1.0. Quat. Int. 2011, 242, 115–125. [Google Scholar] [CrossRef]
  49. Ministry of Construction. Earthquake Resistant Design Regulations; Ministry of Construction, Department of Design, Academy of Science of Albania, Seismic Center: Tirana, Albania, 1989.
  50. Glavatović, B.; Akkar, S.; Hoxha, I.; Kuk, V.; Zoranić, A.; Garevski, M.; Kovačević, S. NATO SfP Project Number 983054. Harmonization of Seismic Hazard Maps for the Western Balkan Countries (BSHAP). Final Report. NATO. Available online: http://www.seismo.co.me/documents/NATO%20SfP%20No.983054%20FINAL%20REPORT.pdf (accessed on 30 January 2020).
  51. Gülerce, Z.; Šalić, R.; Kuka, N.; Markušić, S.; Mihaljević, J.; Kovačević, V.; Sandıkkaya, A.; Milutinović, Z.; Duni, L.; Stanko, D.; et al. Seismic hazard maps for the Western Balkan. Inženjerstvo Okoliša 2017, 4, 7–17. [Google Scholar]
  52. Salic, R.; Gülerce, Z.; Kuka, N.; Markusic, S.; Mihaljevic, J.; Kovacevic, V.; Sandikaya, A.; Milutinovic, Z.; Duni, L.; Stanko, D.; et al. Harmonized seismic hazard maps for the western Balkan countries. In Proceedings of the 16th European Conference on Earthquake Engineering, Thessaloniki, Greece, 18–21 June 2018. [Google Scholar]
  53. Youd, T.L. Screening Guide for Rapid Assessment of Liquefaction Hazard at Highway Bridge Site; Technical Report; Multidisciplinary Center for Earthquake Engineering Research (MCEER-98-0005): Buffalo, NY, USA, 1998; 58p. [Google Scholar]
  54. Vittori, E.; Blumetti, A.M.; Comerci, V.; Di Manna, P.; Piccardi, L.; Gega, D.; Hoxha, I. Geological effects and tectonic environment of the 26 November 2019, Mw = 6.4 Durres earthquake (Albania). Geophys. J. Int. 2021, 225, 1174–1191. [Google Scholar] [CrossRef]
  55. Tang, X.-W.; Hu, J.-L.; Qiu, J.-N. Identifying significant influence factors of seismic soil liquefaction and analyzing their structural relationship. KSCE J. Civ. Eng. 2016, 20, 2655–2663. [Google Scholar] [CrossRef]
  56. Huang, Y.; Yu, M. Chapter 2: Macroscopic characteristics of seismic liquefaction. In Hazard Analysis of Seismic Soil Liquefaction; Springer Natural Hazards; Springer: Singapore, 2017. [Google Scholar] [CrossRef]
  57. Faculty of Societal Safety Sciences of Kansai University. Chapter 8—Liquefaction with the Great East Japan Earthquake. In The Fukushima and Tohoku Disaster—A Review of the Five-Year Reconstruction Efforts; Elsevier Science: Amsterdam, The Netherlands, 2018; pp. 147–159. [Google Scholar] [CrossRef]
  58. Cao, Z.; Youd, T.L.; Yuan, X. Gravelly soils that liquefied during 2008 Wenchuan, China earthquake, Ms = 8.0. Soil Dyn. Earthq. Eng. 2011, 31, 1132–1143. [Google Scholar] [CrossRef]
  59. Cubrinovski, M.; Robinson, K.; Taylor, M.; Hughes, M.; Orense, R. Lateral spreading and its impacts in urban areas in the 2010–2011 Christchurch earthquakes. N. Z. J. Geol. Geophys. 2012, 55, 255–269. [Google Scholar] [CrossRef]
  60. Yamaguchi, A.; Mori, T.; Kazama, M.; Yoshida, N. Liquefaction in Tohoku district during the 2011 off the Pacific Coast of Tohoku Earthquake. Soils Found. 2012, 52, 811–829. [Google Scholar] [CrossRef] [Green Version]
  61. Dong, L.; Hu, W.; Cao, Z.; Yuan, X. Comparative analysis of soil liquefaction macro-phenomena in Bachu earthquake. J. Earthq. Eng. Eng. Vib. 2010, 30, 179–187. [Google Scholar]
  62. Shi, Z.; Wang, G.; Wang, C.-Y.; Manga, M.; Liu, C. Comparison of hydrological responses to the Wenchuan and Lushan earthquakes. Earth Planet. Sci. Lett. 2014, 391, 193–200. [Google Scholar] [CrossRef]
  63. Quigley, M.; Hughes, M.; Bradley, B.; van Ballegooy, S.; Reid, C.; Morgenroth, J.; Horton, T.; Duffy, B.; Pettinga, J. The 2010–2011 Canterbury earthquake sequence. Environmental effects, seismic triggering thresholds and geologic legacy. Tectonophysics 2016, 672–673, 228–274. [Google Scholar] [CrossRef] [Green Version]
  64. Schmid, S.M.; Bernoulli, D.; Fügenschuh, B.; Matenco, L.; Schefer, S.; Schuster, R.; Tischler, M.; Ustaszewski, K. The Alpine-Carpathian-Dinaridic orogenic system: Correlation and evolution of tectonic units. Swiss J. Geosci. 2008, 101, 139–183. [Google Scholar] [CrossRef] [Green Version]
  65. Mavroulis, S.D.; Fountoulis, I.G.; Skourtsos, E.N.; Lekkas, E.L.; Papanikolaou, I.D. Seismic intensity assignments for the 2008 Andravida (NW Peloponnese, Greece) strike-slip event (June 8, Mw = 6.4) based on the application of the Environmental Seismic Intensity scale (ESI 2007) and the European Macroseismic scale (EMS-98). Geological structure, active tectonics, earthquake environmental effects and damage pattern. Ann. Geophys. 2013, 56, S0681. [Google Scholar] [CrossRef]
  66. Lekkas, E.L.; Mavroulis, S.D. Earthquake environmental effects and ESI 2007 seismic intensities of the early 2014 Cephalonia (Ionian Sea, Western Greece) earthquakes (January 26 and February 3, Mw 6.0). Nat. Hazards 2015, 78, 1517–1544. [Google Scholar] [CrossRef]
  67. Lekkas, E.L.; Mavroulis, S.D. Fault zones ruptured during the early 2014 Cephalonia Island (Ionian Sea, Western Greece) earthquakes (January 26 and February 3, Mw 6.0) based on the associated co-seismic surface ruptures. J. Seismol. 2016, 20, 63–78. [Google Scholar] [CrossRef]
  68. Lekkas, E.; Mavroulis, S.; Carydis, P.; Alexoudi, V. The 17 November 2015 Mw = 6.4 Lefkas (Ionian Sea, Western Greece) Earthquake: Impact on Environment and Buildings. Geotech. Geol. Eng. 2018, 36, 2109–2142. [Google Scholar] [CrossRef]
  69. Papadopoulos, G.A.; Lefkopoulos, G. Magnitude-distance relations for liquefaction in soil from earthquakes. Bull. Seismol. Soc. Am. 1993, 83, 925–938. [Google Scholar]
  70. Galli, P. New empirical relationships between magnitude and distance for liquefaction. Tectonophysics 2000, 324, 169–187. [Google Scholar] [CrossRef]
Figure 1. The epicenter of the 26 November 2019, Mw = 6.4 earthquake determined by [2], its focal plane solution by USGS and its aftershock sequence from 26 November 2019 to 5 January 2020 based on the earthquake catalogues of the EMSC. Based on the provided fault plane solution, it is concluded that the earthquake has been generated by the rupture of a reverse fault in the coastal part of the central-western Albania. The most affected areas are observed in the coastal part of the Periadriatic Depression (Durrës city) and along the eastern part of the Tirana Depression (Laç, Thumanë, Fushë-Krujë and Kamëz towns, and Tirana city).
Geosciences 11 00215 g001
Figure 2. The geological map of the area affected by the 26 November 2019, Mw = 6.4 Durrës earthquake. The impact on the natural and built environment was observed in Durrës area located in the Periadriatic Depression and in Laç, Thumanë, Fushë-Krujë, Kamëz, and Tirana areas located in the Tirana Depression. Both affected areas are composed of Quaternary deposits comprising marine, alluvial and marshy deposits and of Neogene deposits comprising Miocene deposits. Marshy deposits are observed in swamps of Durrës, Laç, and Thumanë areas where major damage was recorded. The alpine deposits occur along the eastern margin of the Tirana Depression. The main active faults are also presented and comprise mainly reverse faults along the coastal part of the affected area as well as strike-slip and normal faults. The epicenter of the main shock and its fault plane solution are also presented. DS: Durrës syncline, RL: Rinia–Fllakë Lagoon, PL: Patok Lagoon.
Geosciences 11 00215 g002
Figure 3. Earthquakes in Albania from 2004 to 2020 based on the earthquake catalogues of the EMSC. The epicenters are distributed within the main seismogenic zones of Albania. The distribution of the seismogenic zones of Albania is based on [9].
Geosciences 11 00215 g003
Figure 4. Earthquake-induced liquefaction phenomena from 1905 to 1979 in western Albania. They have been observed mainly in the Periadriatic Depression. The 2019 liquefaction phenomena in the area of Durrës are also presented.
Geosciences 11 00215 g004
Figure 5. Durrës city is an area, where big deformations on surface are expected in the event of an earthquake including liquefaction phenomena based on [18,28]. The maximum expected MSK-64 intensities are larger than IX. Based on the liquefaction potential of Durrës, three areas can be distinguished: (1) highly, (2) moderately, and (3) lowly susceptible areas (from [28], modified).
Geosciences 11 00215 g005
Figure 6. Liquefaction phenomena observed in the littoral part east of Durrës port (a). (b) Drone view of the totally collapsed Mira Mare hotel. Liquefaction phenomena were generated close to the collapsed hotel. The observed damage can be attributed partially to liquefaction. (c,d) Pavements close to the collapsed Mira Mare hotel were covered by liquefied material. (e) Sand boils were also observed. Liquefied material was also ejected through NW–SE trending ground cracks (f,g).
Geosciences 11 00215 g006aGeosciences 11 00215 g006b
Figure 7. (a) Drone view of one of the most affected areas by the 26 November 2019, Mw = 6.4 Durrës earthquake. Three hotels suffered very heavy damage. (b) Vila Verde Hotel partially collapsed. (c) Lubjana Hotel tilted after damage of the failure of the columns in the ground floor. (d) Mira Mare Hotel totally collapsed. The adjacent buildings suffered only non-structural damage.
Geosciences 11 00215 g007
Figure 8. Intensity variation depending on ground condition (from [40], modified).
Geosciences 11 00215 g008
Figure 9. Drone view of the Rinia–Fllakë Lagoon. The sites with the detected liquefaction phenomena are also noted along with the main geomorphological features of the lagoon.
Geosciences 11 00215 g009
Figure 10. (a) Drone view of the central part of the Rinia–Fllakë Lagoon with the first liquefaction site. Sand boils (bg) were observed. They caused tilting to electrical pillars (eg).
Geosciences 11 00215 g010
Figure 11. (a) Drone panoramic view of the central part of the Rinia–Fllakë Lagoon with the second liquefaction site (b). Sand boils were generated (ce). They were arranged along an N–S trending line almost parallel to the adjacent lagoon channel (ce).
Geosciences 11 00215 g011
Figure 12. (a) Drone view of the central part of the Rinia–Fllakë Lagoon with the third liquefaction site. (b) Sand boils were generated not only in dry but also in shallow parts of the lagoon. They were arranged along N–S trending ground cracks (c,d). Yellow double arrow lines indicate the N–S direction of the detected ground cracks.
Geosciences 11 00215 g012
Figure 13. Close view of liquefaction phenomena generated along ground cracks in Figure 12. They were observed not only in dry, but also in shallow parts of the Rinia–Fllakë Lagoon.
Geosciences 11 00215 g013
Figure 14. Liquefaction phenomena were also generated in the Erzeni River estuary (a,b). Ejection of liquefied material (c) was generated along ENE–WSW trending ground cracks (c,d) in fields of the area.
Geosciences 11 00215 g014
Figure 15. (a) Geological map with geological formations, tectonic structures and liquefaction phenomena induced by the November 2019 earthquake. (b) The seismic zonation map of Albania from the Earthquake Resistant Design Regulations, issued by [49]. (c) Probabilistic seismic hazard map of the study area based on the respective map of Albania by [50,51,52], modified (PGA with 10% probability of exceedance in 10 years). (d) Probabilistic seismic hazard map of the study area based on the respective map of Albania by [50,51,52], modified (PGA with 10% probability of exceedance in 50 years). (e) Liquefaction susceptibility map of the earthquake-affected area with 5 zones of liquefaction susceptibility: (1) very high, (2) high, (3) moderate, (4) low, (5) very low. The alpine basement (gray areas) were excluded from the assessment.
Geosciences 11 00215 g015aGeosciences 11 00215 g015bGeosciences 11 00215 g015c
Figure 16. Environmental effects induced by the November 2019 earthquake in the central western part of Albania along with the major tectonic structures of the affected area and the areas with considerable building damage. All liquefaction phenomena and building damage (in Durrës, Laç, Thumanë, Fushë-Krujë, Kamëz, and Tirana) were observed in sites composed of resent soft alluvial, marine, lagoonal, and marshy deposits. Moreover, they were observed in zones with the same NW–SE trend with the macrostructures (synclines and anticlines with NW–SE fold axis) and the active thrust faults (NW–SE striking thrusts and backthrusts) in the affected area.
Geosciences 11 00215 g016
Publisher’s Note: MDPI stays neutral with regard to jurisdictional claims in published maps and institutional affiliations.

