
Strength and Microstructural Assessment of Reconstituted and Stabilised Soft Soils with Varying Silt Contents


School of Engineering and Built Environment, Griffith University, Southport, QLD 4215, Australia
*
Author to whom correspondence should be addressed.
Geosciences 2021, 11(8), 302; https://0-doi-org.brum.beds.ac.uk/10.3390/geosciences11080302
Submission received: 18 May 2021
/
Revised: 6 July 2021
/
Accepted: 19 July 2021
/
Published: 21 July 2021
(This article belongs to the Special Issue Soil-Structure Interaction)
Abstract
:The study of the strength of reconstituted and stabilised soft soils is very important in geotechnical engineering. The soil particles, such as clay, sand, and silt play important roles in determining the behaviour of soils. The behaviour of clay and sand particles are unique; however, the behaviour of silt particles lie in a transitional form between sand and clay. Therefore, this paper seeks to investigate (a) the effect of silt contents on the strength of soft soils; (b) the effect of silt content on the strength of cement-stabilised soft soils; and (c) the microstructure of the soft soil specimens stabilised by cement with varying particle size distribution. A series of tests consisting in consolidated, isotropic undrained (CIU) triaxial tests, unconfined compressive strength (UCS) tests, and scanning electron microscope (SEM) images were conducted in this study to achieve these objectives. In conclusion, the relationship between the silt content and critical state behaviour of soft soils (both clay and silt particles) are proposed. For the cement-stabilised specimens, the unconfined compressive strength increases with the increase in silt content when the cement content is 10%. However, the UCS decreases with the increase in silt content when cement content is 30%. With cement content ranging from 15–25%, the UCS increases at first with the increase of silt content but decreases once the silt content reaches a ‘saturation’ point.
1. Introduction
Soft soil deposits, such as mine tailings, hydraulic fills, soft estuarine or marine soils exist globally on the planet. Available land for construction has decreased due to rapid urbanisation and population growth around the globe. It is crucial to develop or reclaim land with poor geotechnical conditions in order to build on it to solve the issue of land shortage. Advancements in construction material science considering sustainability [1,2,3,4,5,6] and the characterisation of soils form the basis of geoenvironmental and geotechnical design but not without challenges faced in laboratory tests [7,8], computer simulations [9,10] and inferior in situ geomaterial conditions requiring conditioning and improvement [11,12,13,14,15,16]. For example, many projects, such as the construction of coastal facilities, such as shipyard [17] and quay walls, deep excavation [18,19,20] or foundations for building basements [21,22], road embankments on flood plains [23,24] and tunnelling [25,26,27,28] require infrastructure to be built on areas with widespread soft soil deposits [29,30,31,32]. In Brisbane, Queensland, Australia, dubbed the ‘river city’, soft estuarine clays can be found in embankments supporting main motorways, the Brisbane airport and the Port of Brisbane. Hence, it is key that the latest understanding of the behaviour of reconstituted and stabilised estuarine soft soil deposits with varying silt contents is developed for future potential, large-scale ground improvement projects.
It is widely recognised that the behaviour of soil in a triaxial compression test is highly related to confining pressures, particle size distribution, and soil minerals, as well as the composition of the soil particles [33]. It is also widely known that the clay and sand phases have dominating influences on the properties and behaviour of soil [34,35]. For example, the friction angle, stiffness, and permeability decrease with increased clay percentage, while these parameters increase with increased sand content. The behaviour of soils with a higher percentage of clay particles shows more stress softening behaviour, while the soils with a higher percentage of sand particles show more stress hardening behaviour [35,36].
Soft marine and estuarine soils commonly exist in many coastal areas. Both have similar weaknesses, such as high water content, low shear strength, and high compressibility. These soils must be stabilised before construction projects are carried out on such soft soils. The behaviour of the soft soils has been extensively investigated by many studies. From previous studies, it can be concluded that the main components of those soils are soft clay or soft silt deposits admixed with some sand particles. Furthermore, soft clay is commonly found in most marine deposits, such as soft marine soils in Bangkok; Shanghai; the coast of Cyprus; the Port of Brisbane, Australia; the Port of Lianyungang, China; the ports of Tokuyama, Mizushima, Hibiki, and Moji, Japan; and Singapore [37,38,39,40,41,42,43,44,45,46]. Meanwhile, soft silt is commonly distributed in most of the estuarine deposits and few of the marine deposits as well, such as Rance estuarine silt; Coode Island silt; Limavady silt (Northern Ireland); Yellow River alluvial silt; Scotland Kinnegar estuarine silt and New South Wales silt [37,38,39,40,41,42,43,44,45,46,47,48,49,50]. Therefore, to investigate the behaviours of soft soils, the study of the behaviour of the clay and silt particles is very significant.
In general, the behaviours of clay and sand particles are unique and easy to identify. However, the behaviour of silt particles lies in between the behaviours of clay and sand particles. It is important that some previous studies found that the behaviour of silt is not in accordance with the critical-state framework adopted for clay and sand [51,52], and suggested that the behaviour of silt is more complex than that of sand and clay, as the behaviour of silts is in a transitional form between clay and sand. Consequently, it is important to understand the physical, mineralogical, strength and microstructural behaviour of silt, as it is presently recognised that gaps in understanding its fundamental behaviour exist.
Many soft soils need to be stabilised by suitable ground improvement techniques before constructing infrastructure on them. Cement is one of the commonly used cementitious materials to treat soft soils. It can increase the strength and decrease the water content of stabilised soil through the hydration of cement and a pozzolanic reaction. The use of cement to stabilise the soft soils and the behaviour of cement-stabilised soils have been extensively investigated in many previous studies [31,37,40,41,42,46,53,54,55]. It has been proven by those previous studies that the addition of cement can efficiently increase the strength of stabilised soft soils, such as sandy-silty soft soil, by significantly reducing the water content and creating a cementation bond amongst soil particles. However, there is limited research that has fully investigated the influence of silt particles on the efficiency of cement stabilisation. For example, [56] conducted a series of experimental tests with soft soils stabilised by cement. To investigate the effect of silt and clay fractions on the reaction between cement and soil, soft clay was admixed with kaolin soil and then stabilised by cement with a cement additive content of 20% in that study. Unconfined compressive strength tests were then conducted on stabilised samples to find out the differences between cement-stabilised soft clay and the cement-stabilised soft clay—kaolin soil mixture. However, that study is limited since only a 20% additive content of cement was taken into consideration [56]. The high moisture content in most of the soft estuarine or marine deposits might result in a required amount of cement, which is likely to exceed 20%. In addition, the mechanism of the reaction between silt, clay particles and cement may result in that the influence of silt particles on the stabilisation may vary with the additive content of cement. Therefore, a broad range of silt and cement contents are necessary to be taken into consideration to further understand the influence and behaviour of cement-stabilised soft soils. Meanwhile, it is essential to study the microstructural development of soil as considerable scientific publications have proven that the macroscopic physical properties of soil are closely related to those microstructural characteristics and can be affected by the soil microstructure to a certain extent [57,58].
To overcome the shortcomings stated above, this study examines: (a) the properties, such as stress-strain behaviour, stress paths, and critical state parameters of reconstituted soft marine clay with varying silt contents based on the experimental results from consolidated undrained triaxial tests (CIU); (b) the influence of silt content on the unconfined compressive strength of cement-stabilised soft soils by performing unconfined compression tests (UCTs) on the specimens with varying silt and cement contents; and (c) the influence of silt content on the micro-structure aspects of cement-stabilised soft soils by conducting scanning electron microscope (SEM) tests for stabilised specimens.
In particular, five types of soft soil samples with different clay and silt fractions, and plasticity indexes, were adopted in this study. The soil samples were prepared by mixing soft soil collected from the Port of Brisbane (PoB) (Southeast Queensland, Australia) with kaolin soil at 5 different mixing ratios. Consolidated isotropic undrained (CIU) tests were then conducted for each group of the PoB soft soil-kaolin soil mixture at varying confining pressures. Consequently, the influence of silt fraction on the properties of soft soil is investigated. Then, each group of soil was stabilised by cement with a wide range of additive contents. Unconfined compressive strength (UCS) and scanning electron microscope (SEM) tests were then conducted on the stabilised specimens. Therefore, the influence of silt fraction in strength and micro-structure behaviour of stabilised and unstabilised soft soils can be further investigated. The effect of the presence and the variation in sand contents can be minimised as both the PoB soft soil and the kaolin soil used in this study have relatively low contents of sand.
2. Materials and Methods
The soils used in this study are summarised in Table 1. Soft marine clay collected from a depth of 1 to 2 m from the Port of Brisbane (PoB) in Southeast Queensland, Australia was used as the base soil. This marine clay was of dark grey in colour and was a mixture of clay and silt. The main source of this soil was the deposit from the Holocene age [59].
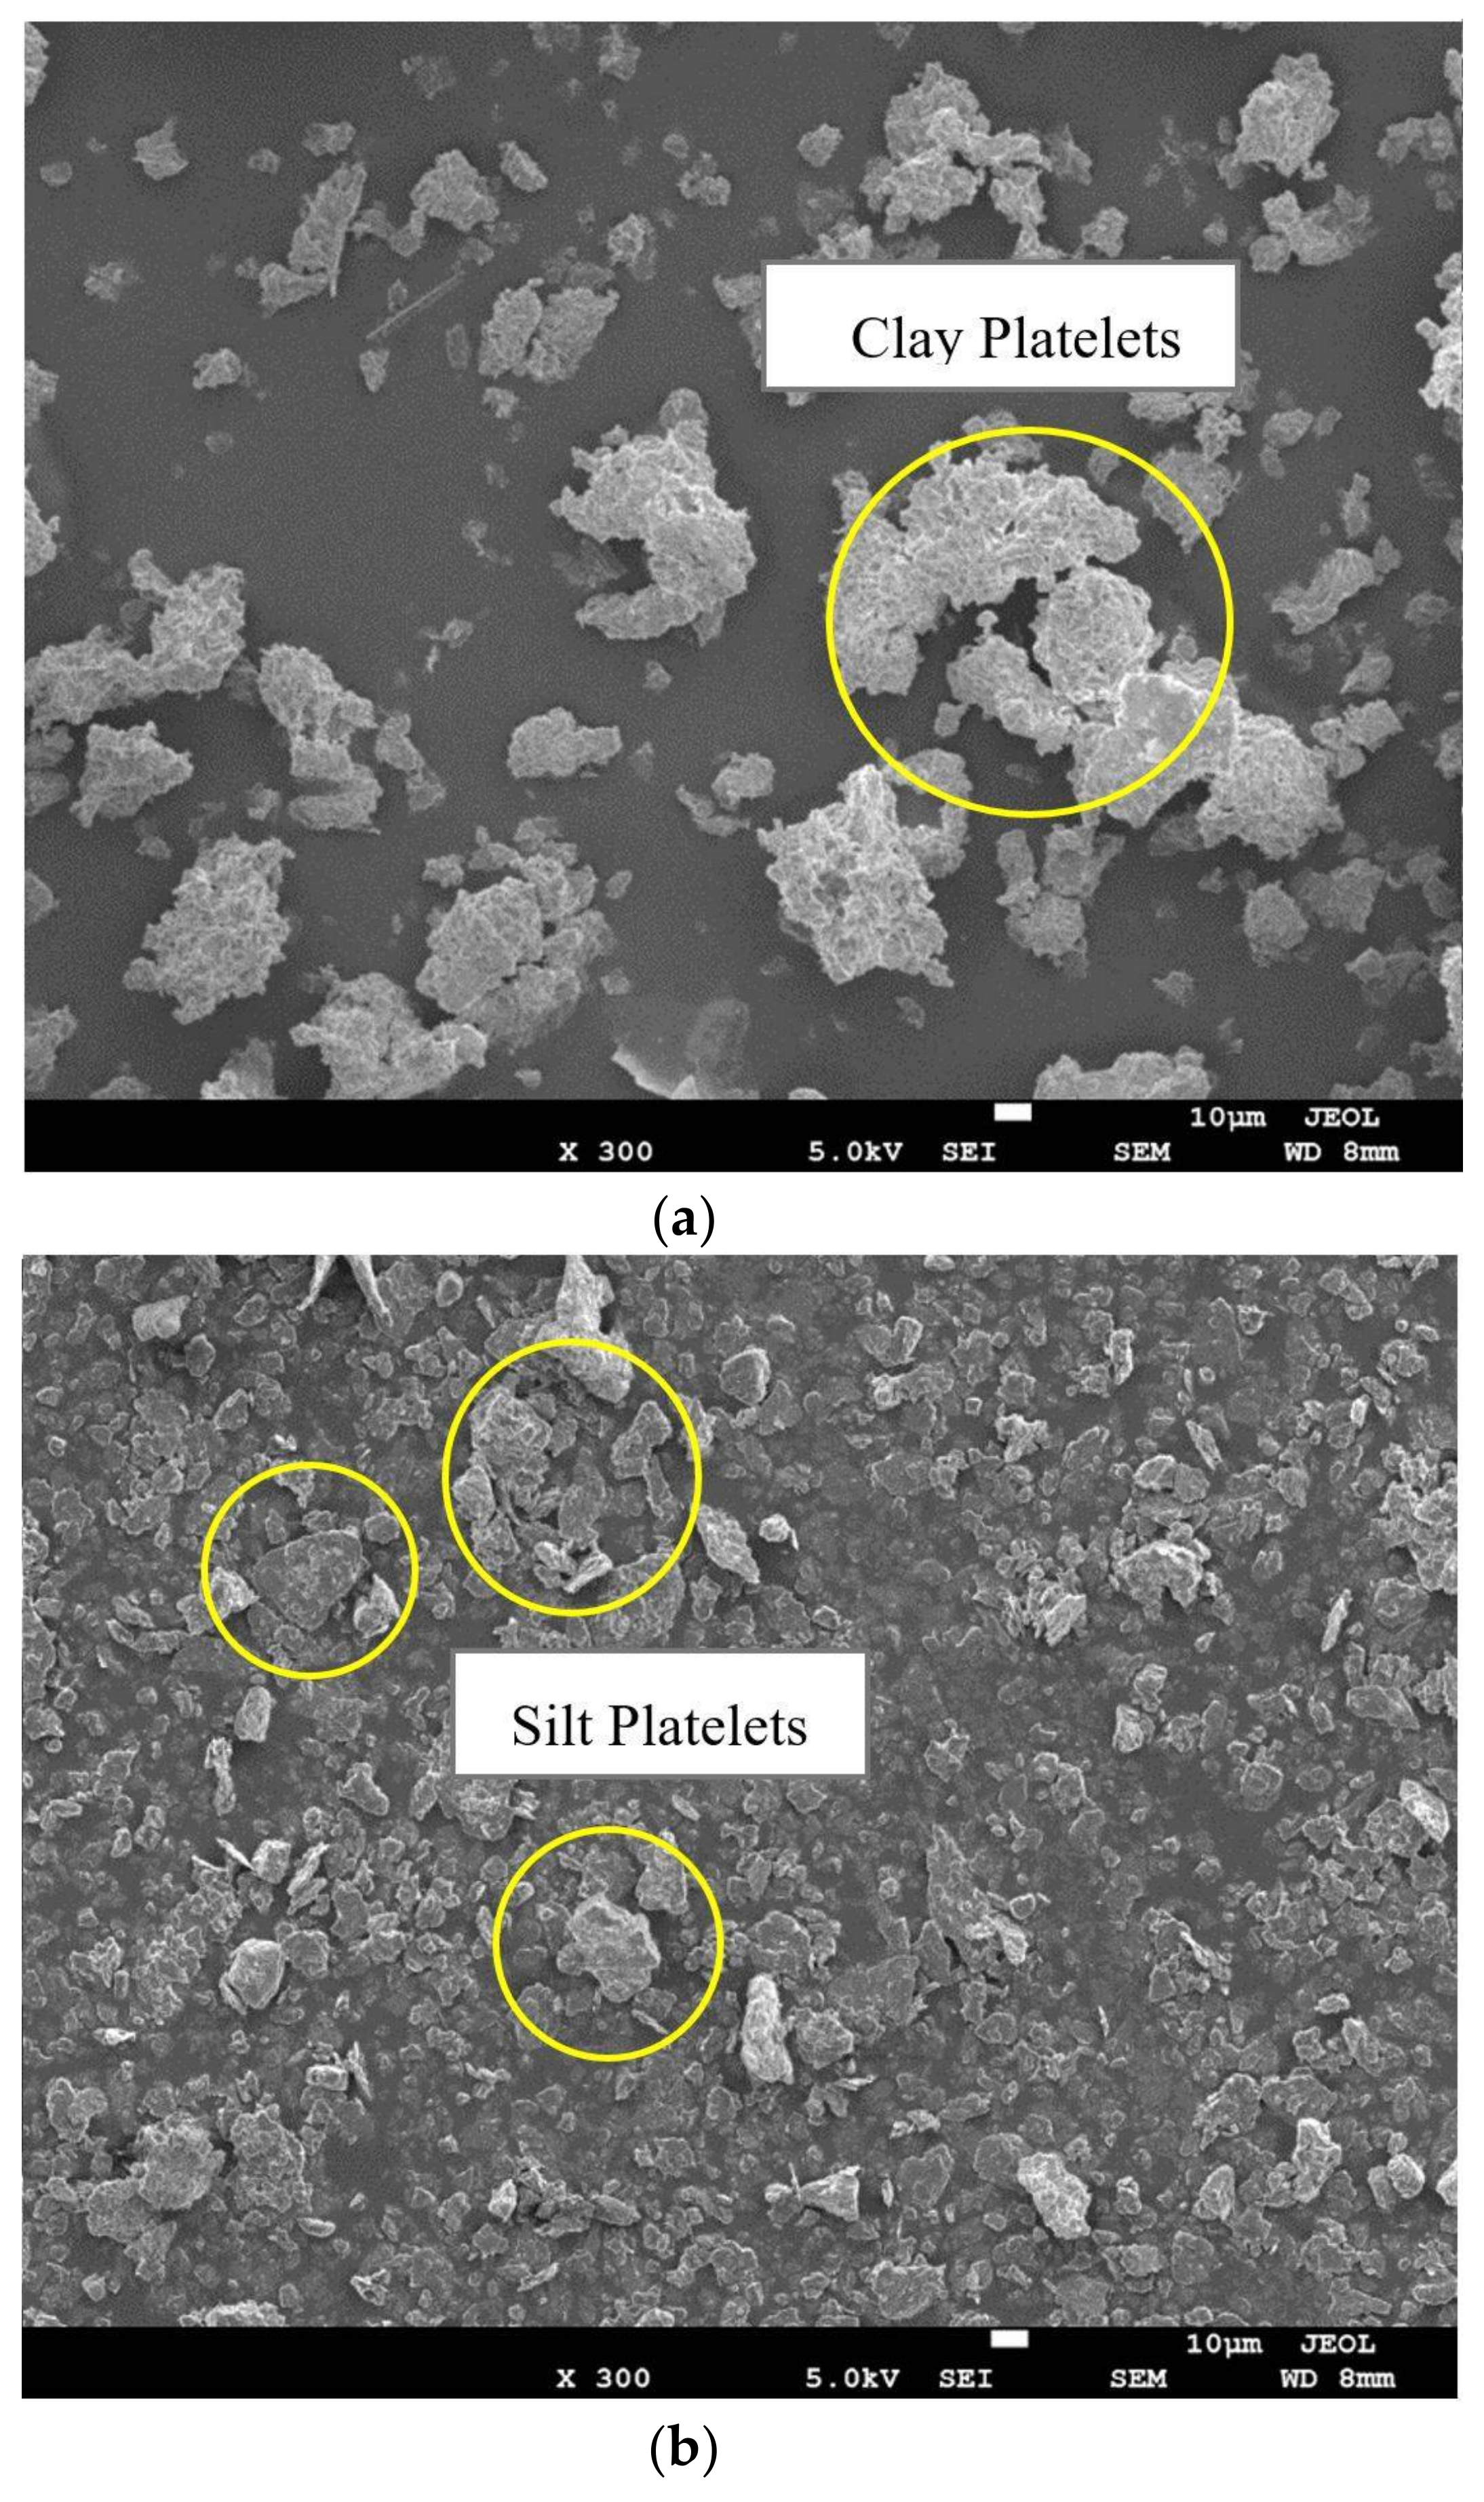
Commercial kaolin soil, which is called KM25 and produced by Kaolin SDN, Selangor, Malaysia, was mixed with the Port of Brisbane soft soil to form 5 types of reconstituted silt- clay samples with varying silt contents. In general, 5 types of soils with varying silt contents were adopted, with 0%, 25%, 50%, 75%, and 100% of Kaolin soil, respectively. Kaolin soil was used in this study due to the main components of kaolin being silt, so it can be mixed with the PoB soft soil to form reconstituted samples with varying silt contents. In a study conducted by [56], a same mixing methodology was adopted, in which 50% of a marine clay was mixed with 50% of kaolin soil. In this study, the 5 types of PoB soft soil-Kaolin soil mixtures are named as S1, S2, S3, S4, and S5, with the following components in particular: S1—100% Port of Brisbane (PoB) soil; S2—75% PoB soil mixed with 25% Kaolin soil (KM25); S3—50% PoB soil mixed with 50% Kaolin soil (KM25); S4—25% PoB soft soil mixed with 75% Kaolin soil (KM25); and S5—100% Kaolin soil (KM25). After the mixing, dead weights were placed gradually on the top plate with a pressure of 20 kPa. The samples were prepared for CIU testing by one-dimensional compression from a slurry to a state where they could be handled without disturbance. Figure 1a–c are the SEM images of the Port of Brisbane (PoB) soft soil, kaolin soil, and Ordinary Portland cement, respectively. The Atterberg limit of 3 groups of mixed soils was also tested (S2, S3, and S4). The Atterberg limit of these 3 groups of soils are as follows: S2: PL is 37.6%, LL is 75.6%; S3: PL is 38.5%, LL is 68.4%; S4: PL is 42.7%, LL is 61.7%.
2.1. Soil Properties
The particle size distribution of each sample was obtained by performing wet sieving analysis and a hydrometer test in accordance with ASTM standards. The initial moisture content, plastic limit, liquid limit, and percentages of clay, silt, and sand in each type of soil are obtained and summarised in Table 1. The chemical composition of the Port of Brisbane (PoB) soft soil, Kaolin soil and cement are shown in Table 2. It shows that both PoB soft soil and Kaolin soil contain very small amounts of sand, which can be eliminated during soil mixing. Kaolin soil has a much higher silt content of 79.6% and PoB soft soil has 79.8% of clay content. The SEM images of two kinds of soil particles and cement are shown in Figure 1. It can be seen that the particles of PoB soft soil are much smaller than those of Kaolin soil and cement, which generally conglutinate together into groups of aggregates and cluster with various sizes. The cement particles are generally irregular in shape. However, clay and silt particle shape usually present as aggregates of platelets with different contact modes in which clay platelets generally contact by surface-surface mode and silt particles usually contact by edge-to-surface and surface-to-surface mode.
2.2. Consolidated Isotropic Undrained Triaxial Tests
The triaxial testing specimens were prepared by following an odometer-based reconstituted clay preparation method as developed and suggested by previous studies [60,61,62,63]. These previous studies tested reconstituted soft clay samples and proposed a reliable preparation method. In particular, water was first added to the soft soils to form a soil slurry ranging from 1.25 to 2 times of its liquid limit. A study conducted by [60,61,62,63] suggested water contents of the reconstitution of clay samples should be 1.25 and 1.5 times of its liquid limit, respectively. In a different work by [64], triaxial compression tests were conducted on both undisturbed and reconstituted specimens prepared by this method. The testing results indicated that the undisturbed and reconstituted specimens behaved similarly in terms of deviator stresses and stress paths. Therefore, this preparation method was adopted in this study to ensure the accuracy of the results of reconstituted specimens.
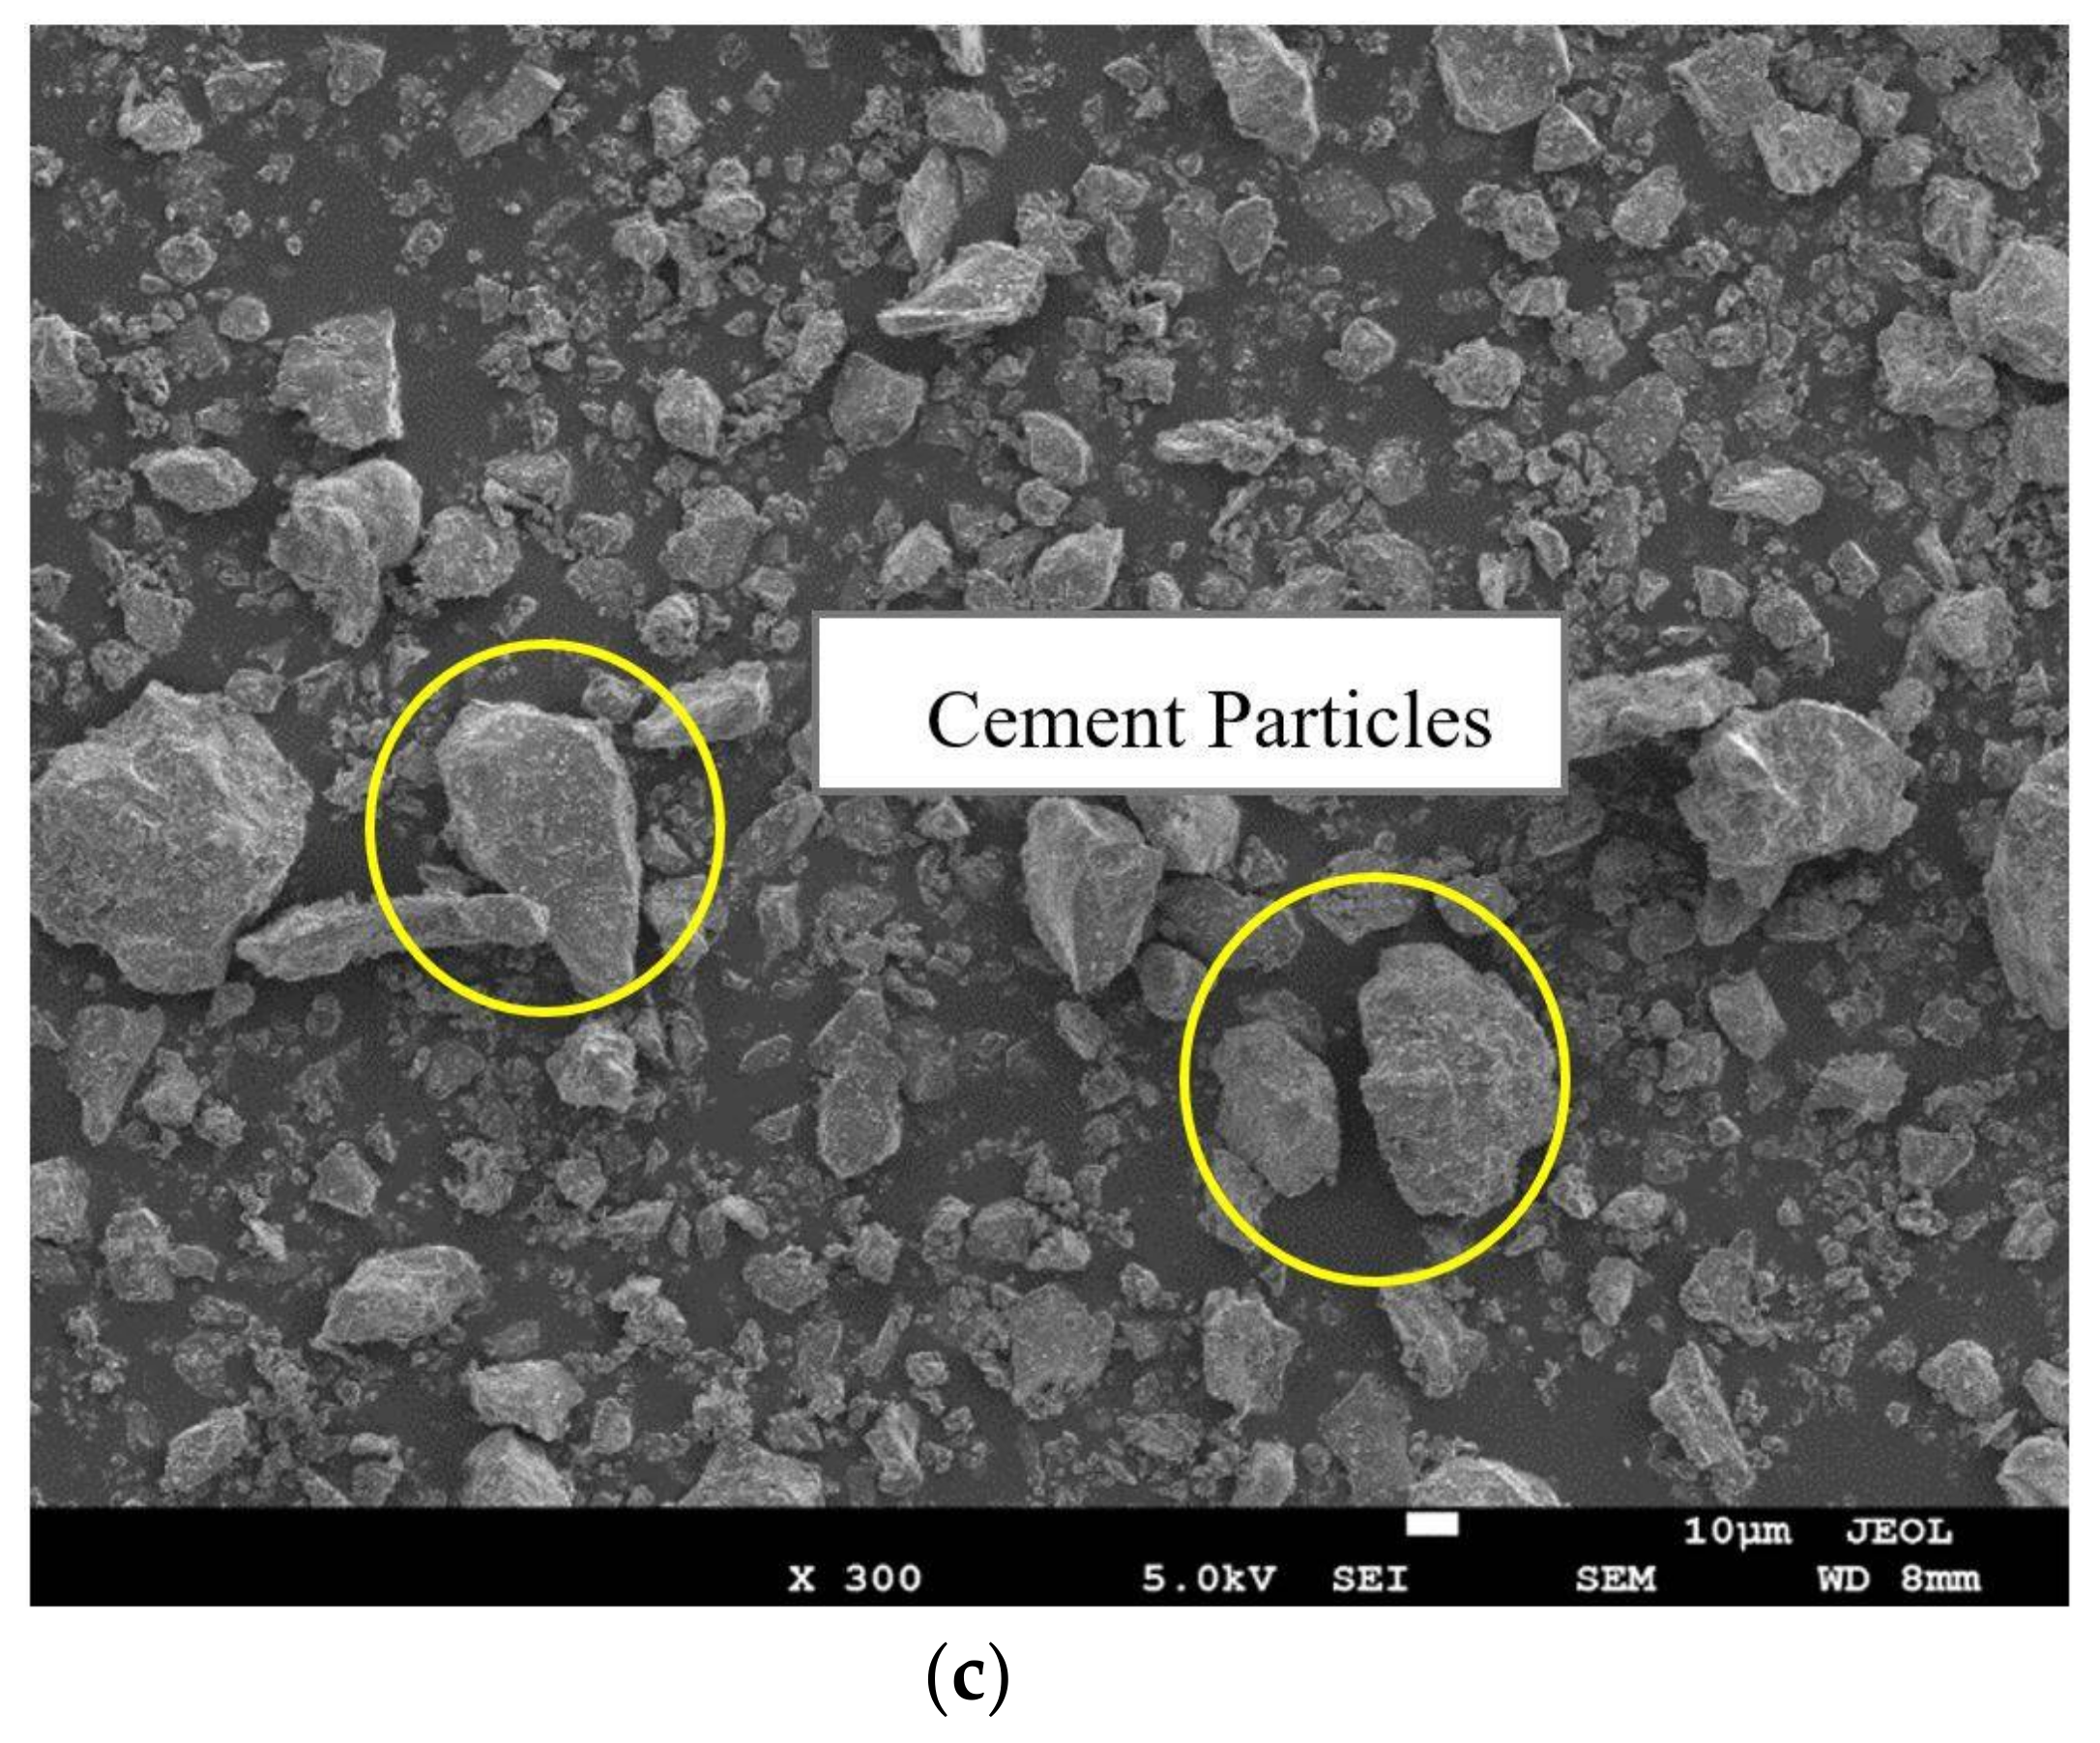
In this study, all the soil samples were prepared by adding water to achieve a water content of 1.5 times its liquid limit to eliminate the air bubbles. The amount of water added to the soil was calculated by the initial moisture content of each sample. The soil slurry was then poured into a preparation mould made of PVC tube with a 50 mm diameter, and 300 mm height. Silicone grease was applied on the inner surfaces of the preparation mould to reduce the friction effect. A dead weight was placed on top of the specimen to provide a vertical pressure on the soil sample through a loading cap and a porous stone. Consequently, all the specimens were consolidated under a preloading pressure of 20 kPa. The preparation mould can provide a double-drainage path during the consolidation process. The settlement of each specimen was recorded every day until the primary consolidation was completed. After the consolidation was completed, the specimen was extruded out from the preparation mould. Figure 2 shows some soft soil specimens after the one-dimension consolidation preparation. These specimens were then trimmed to 50 mm in diameter, and 100 mm in height for triaxial testing. The trimming end cut from each specimen was used to measure the water content of the specimen before the triaxial test. The trimmed specimen was then immediately placed in the triaxial apparatus.
Consolidated isotropic undrained (CIU) triaxial tests for unstabilised soil samples were carried out in accordance with ASTM standards. Filter paper strips were placed around each specimen to provide radical drainage and therefore, to accelerate the consolidation and the saturation phases during the triaxial test. It is necessary to flush water through the drainage path to remove trapped air bubbles. The back pressure saturation method was used to saturate the specimens until the Skempton’s pore pressure parameter (B) value reached 0.98. The specimens were then tested at effective confining pressure of 50, 100, and 200 kPa, respectively. The shear rate of each specimen was calculated based on the time required to achieve t100 consolidation in accordance with the method proposed by [65]. During the shear phase, the specimens were sheared under undrained conditions, and all the tests were stopped when an axial displacement of 20% was achieved. At the end of the test, the specimens were removed from the triaxial cell and the water content of each specimen was then measured. The testing results were calibrated by eliminating the effect of the filter paper strips and membrane stiffness in accordance with the method suggested by [65]. Five types of soil samples with varying ratios between the Port of Brisbane soft soil and Kaolin soil were tested. For each kind of sample, specimens were tested under 3 different effective confining pressures as mentioned above. In total, 15 consolidated undrained triaxial tests were conducted in this study, as summarised in Table 3. Figure 2a–e presents some of the tested specimens under consolidated undrained condition.
2.3. Unconfined Compressive Strength Tests
Four types of soil slurry were prepared by mixing the Port of Brisbane soft soil and kaolin soil at different mixing ratio stated above. The cement additive content was 10, 15, 20, 25, and 30%. As mentioned in previous, the study conducted by [56] considered one mixing ratio between kaolin soil and marine clay, and a cement additive content of 20%. This study considered a more comprehensive range of cement additive content to further develop the effect of silt particle on the stabilisation of soft soil.
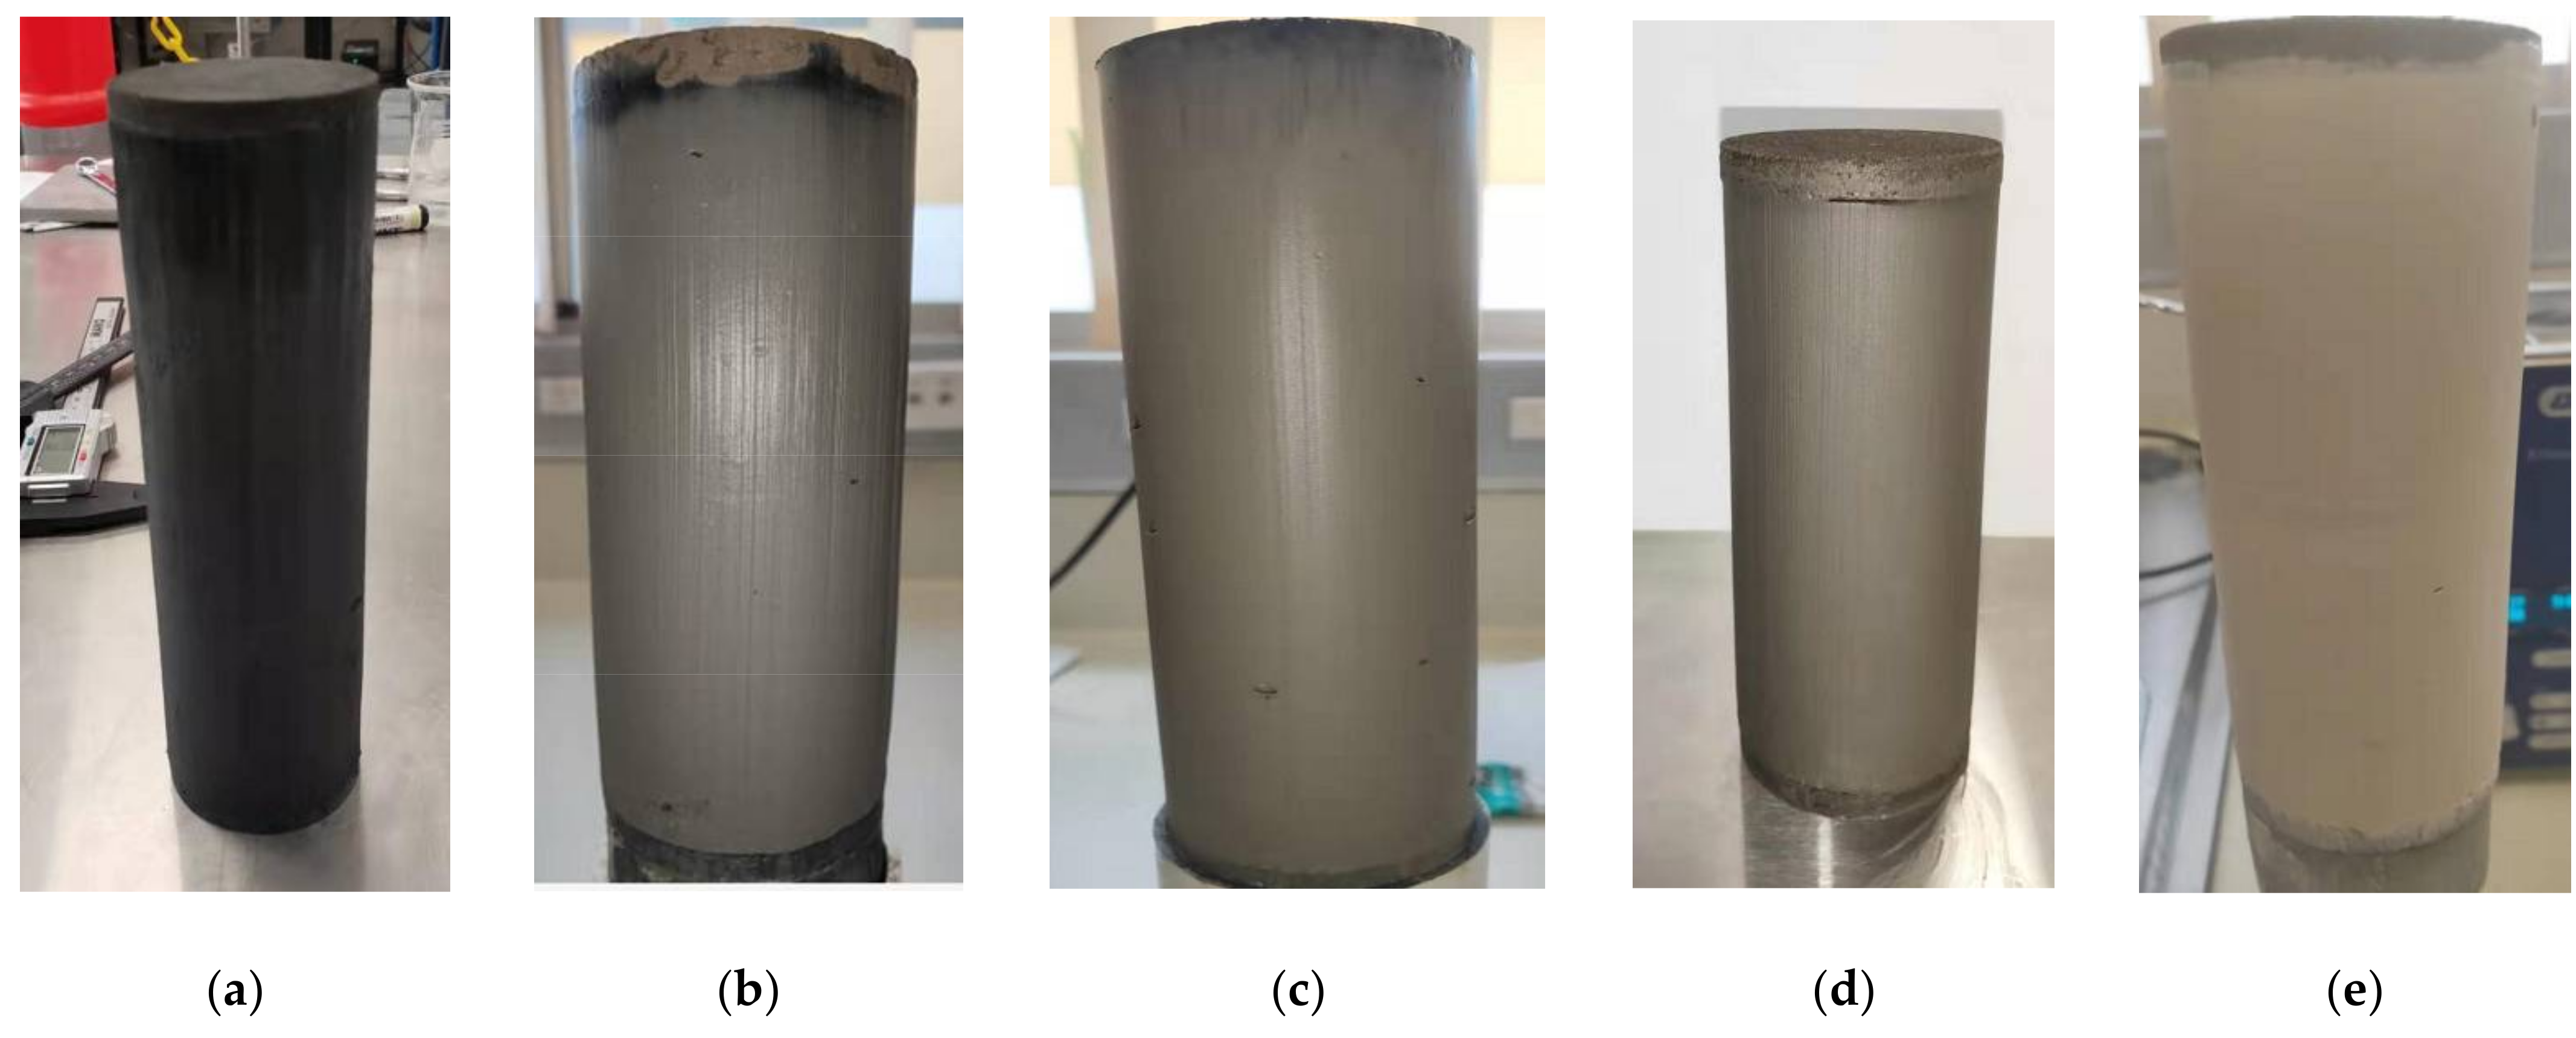
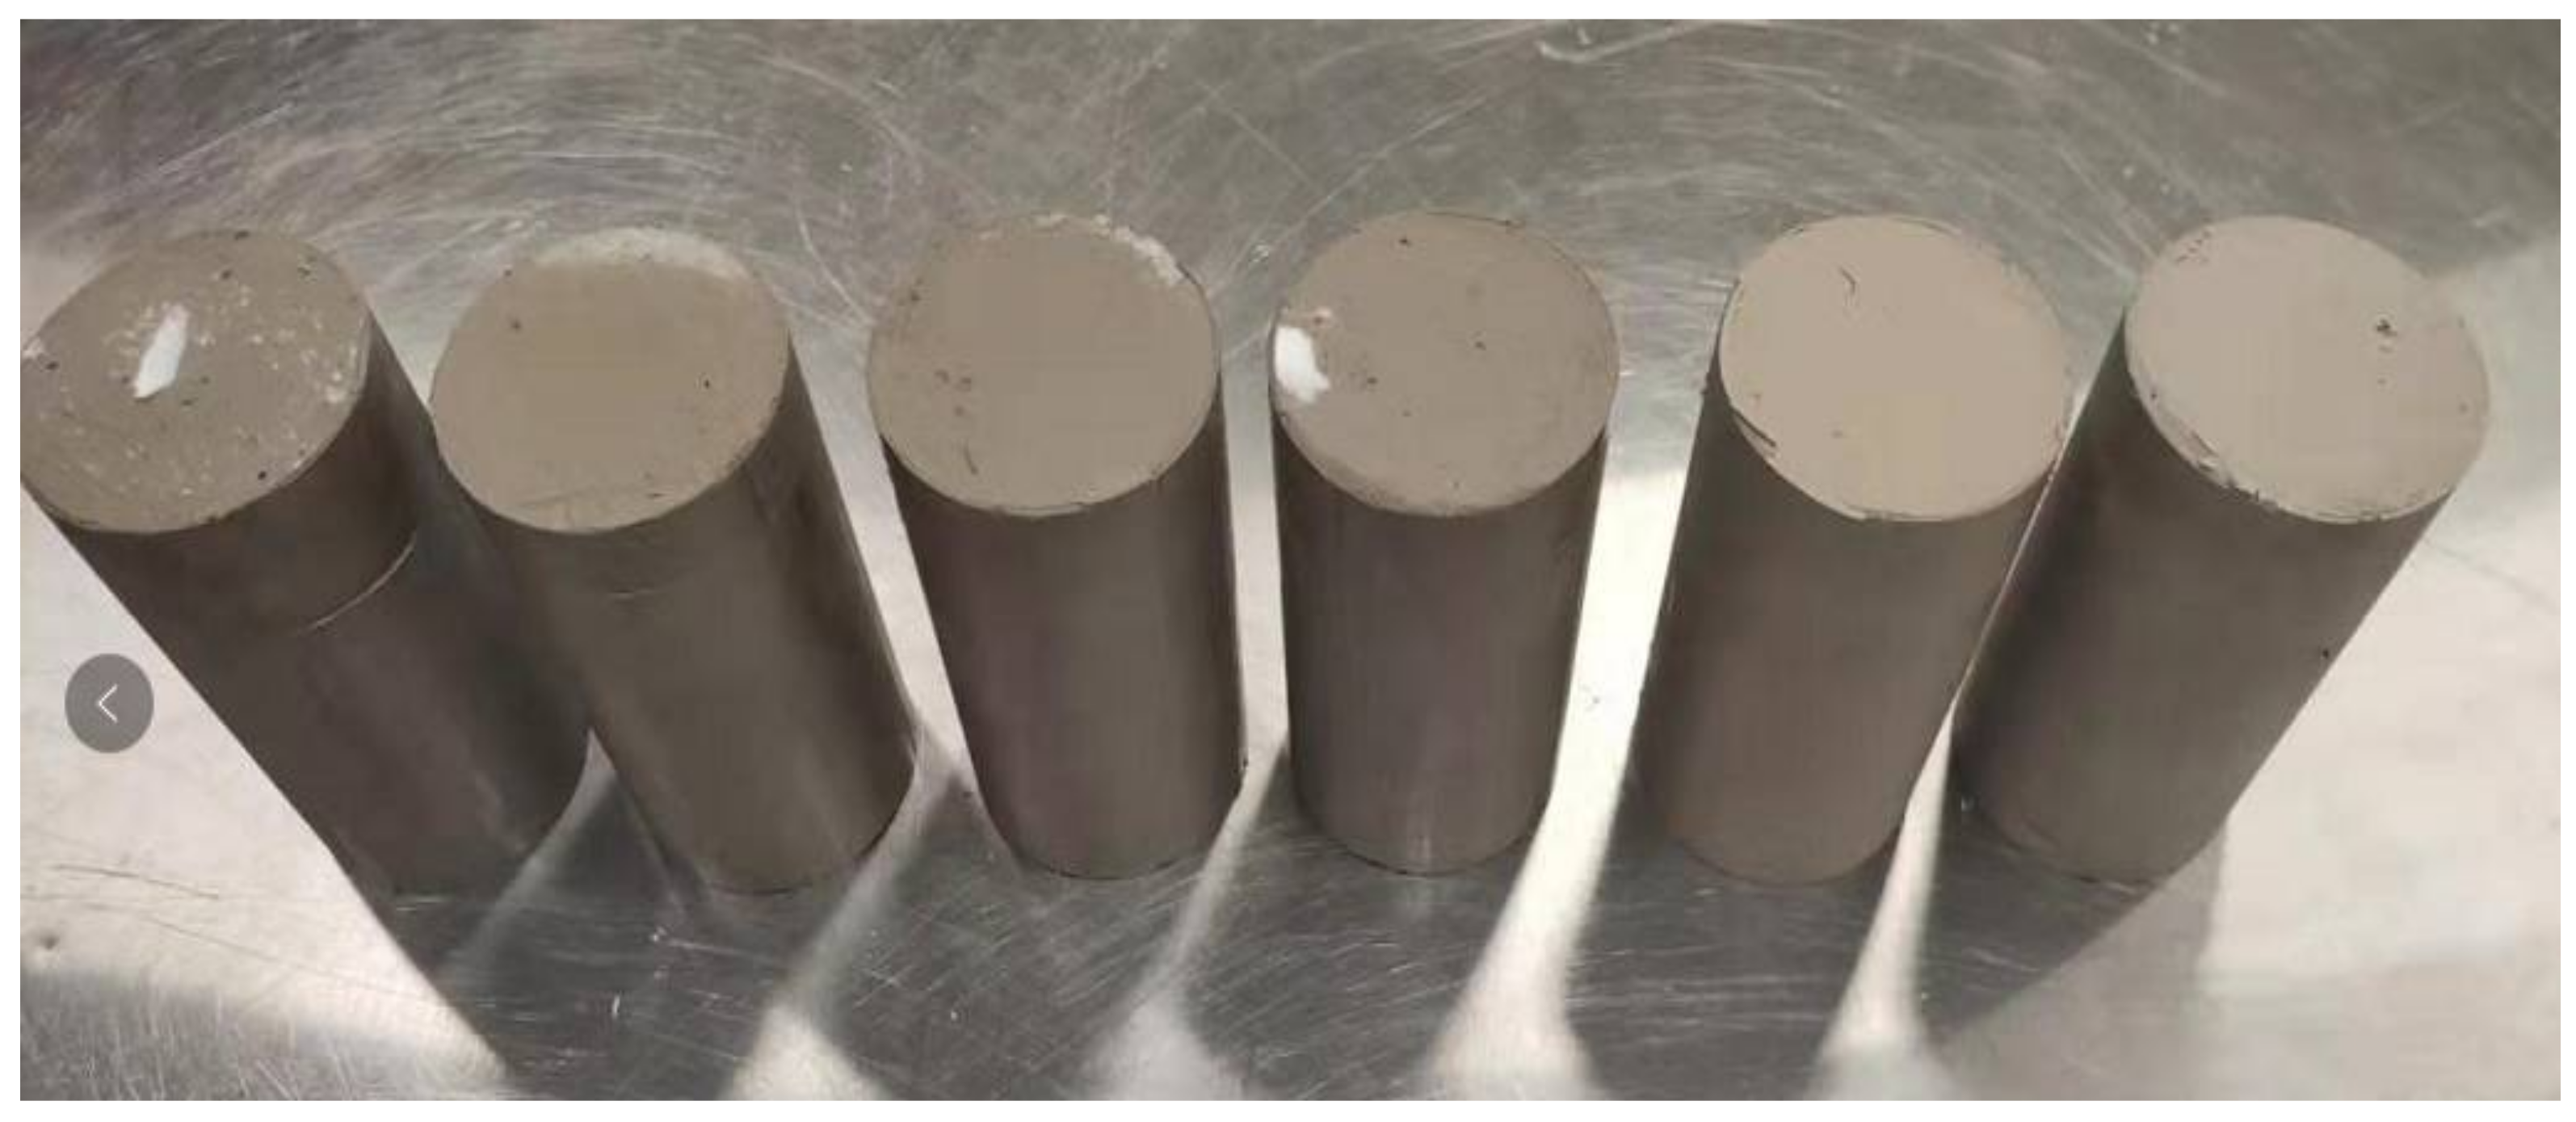
The amount of cement was calculated to achieve each targeting additive content for each type of soil. The additive content of cement is defined as the mass ratio of dry cement powder (Mc): dry soil solid (Ms). De-aired distilled water was added into the cement powder to form cement slurry. The slurry was then mixed with the soil slurry for approximately 10 min. The soil-cement mixture was then placed into a cylindrical PVC with 50 mm in diameter and 100 mm in height. The specimens were vibrated to get rid of the air bubbles trapped in the specimens. Each PVC mould was sealed by wax in both ends. All of the specimens were cured in a curing room with a constant temperature of 22 °C. After reaching the targeting 28-day curing period, the specimens were extruded from the PVC moulds for testing. The specimens were weighed and checked for consistency to within +3 g of the mass of the matrix. Figure 3 presents the photos of some of the stabilised specimens for unconfined compressive strength test.
The Unconfined Compressive Strength tests for all the stabilised specimens were carried out in accordance with ASTM D-2166 [66]. A shearing rate of 1.00 mm/min was adopted as suggested by the standard. All the tests were terminated when a 15% axial strain was achieved, or when a peak deviator stress was observed, whichever one came first. All the specimens for UCS tests have a 50 mm height and 100 mm diameter.
2.4. Scanning Electron Microscope (SEM) Tests
Scanning Electron Microscope Tests were performed to investigate the change of the microstructure of the cement-stabilised PoB soft soil with different kaolin soil replacement ratio (0%, 25%, 50%, 75%) and cement additive content (10%, 15%, 20%, 25%, 30%). The SEM samples used in this study were obtained from the sheared specimens of the Unconfined Compression Test. Firstly, the tested UCS specimens were cut into columns of approximately 10 × 10 × 30 mm and then immersed in liquid nitrogen (−196 °C) for quick freezing. Afterwards, the vacuum freeze dryer produced by John Morris Scientific Pty Ltd. was utilised to sublimate and evacuate the solid-state water in the specimen at −100 °C to −50 °C for 5 days, and then the freeze-dried specimens were broken gloved hands at the middle part to ensure the fresh cross-sections are not out of shape or contaminated. Finally, 10 nm of gold were coated on the sample surface to ensure a good electrical conductivity. The SEM images of stabilised samples are acquired by means of JEOL JSM-7001f in Central Analytical Research Facility at Queensland University of Technology, QLD, Australia, which is a Field Emission Scanning Electron Microscope (FE-SEM) with a wide range of magnification up to 1,000,000 times.
3. Results and Discussion
The experimental results obtained from the experimental tests mentioned previously are presented and discussed in this chapter.
3.1. Consolidated Undrained Triaxial Tests
The CIU testing results of all the specimens are summarised in this chapter. For clarity, the component and confining pressure of each tested specimen are summarised in Table 3. For example, S1—50 refers to the specimen with 100% Port of Brisbane soft soil and tested under 50 kPa confining pressure, and S3—100 refers to the specimen with 50% Port of Brisbane soft soil admixed with 50% kaolin soil and tested under a confining pressure of 100 kpa.
3.1.1. Stress-Strain Behaviour
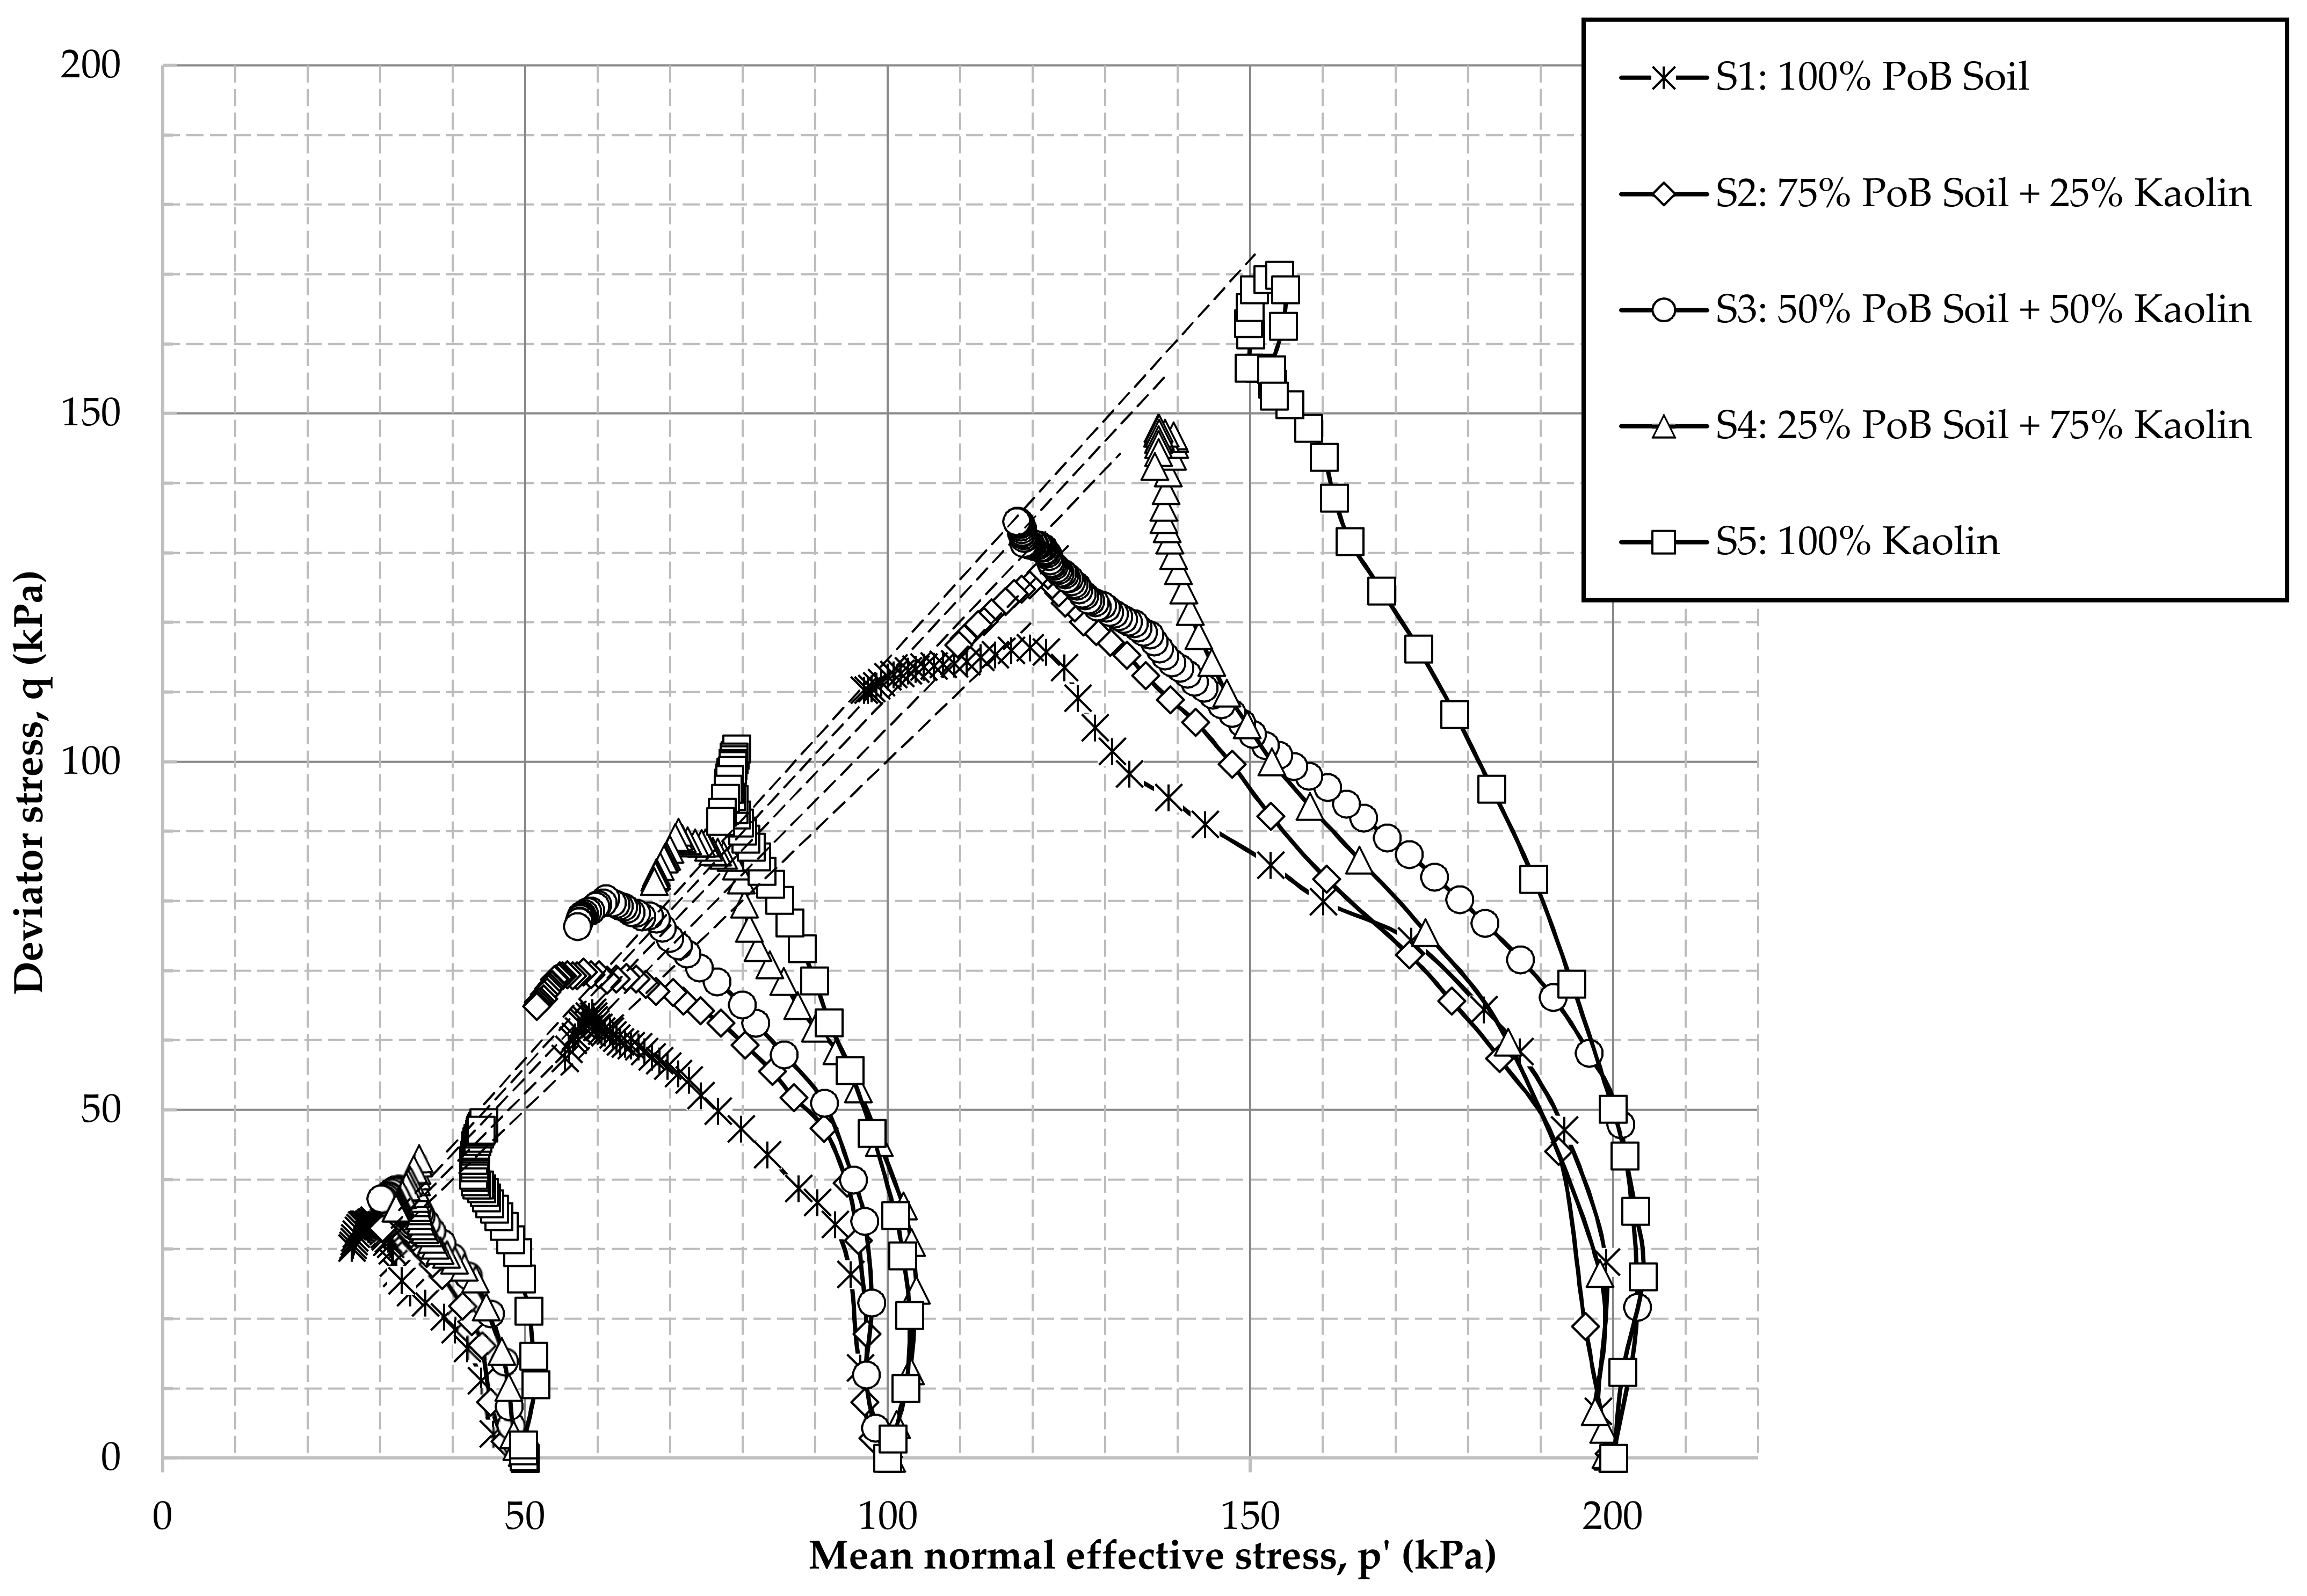
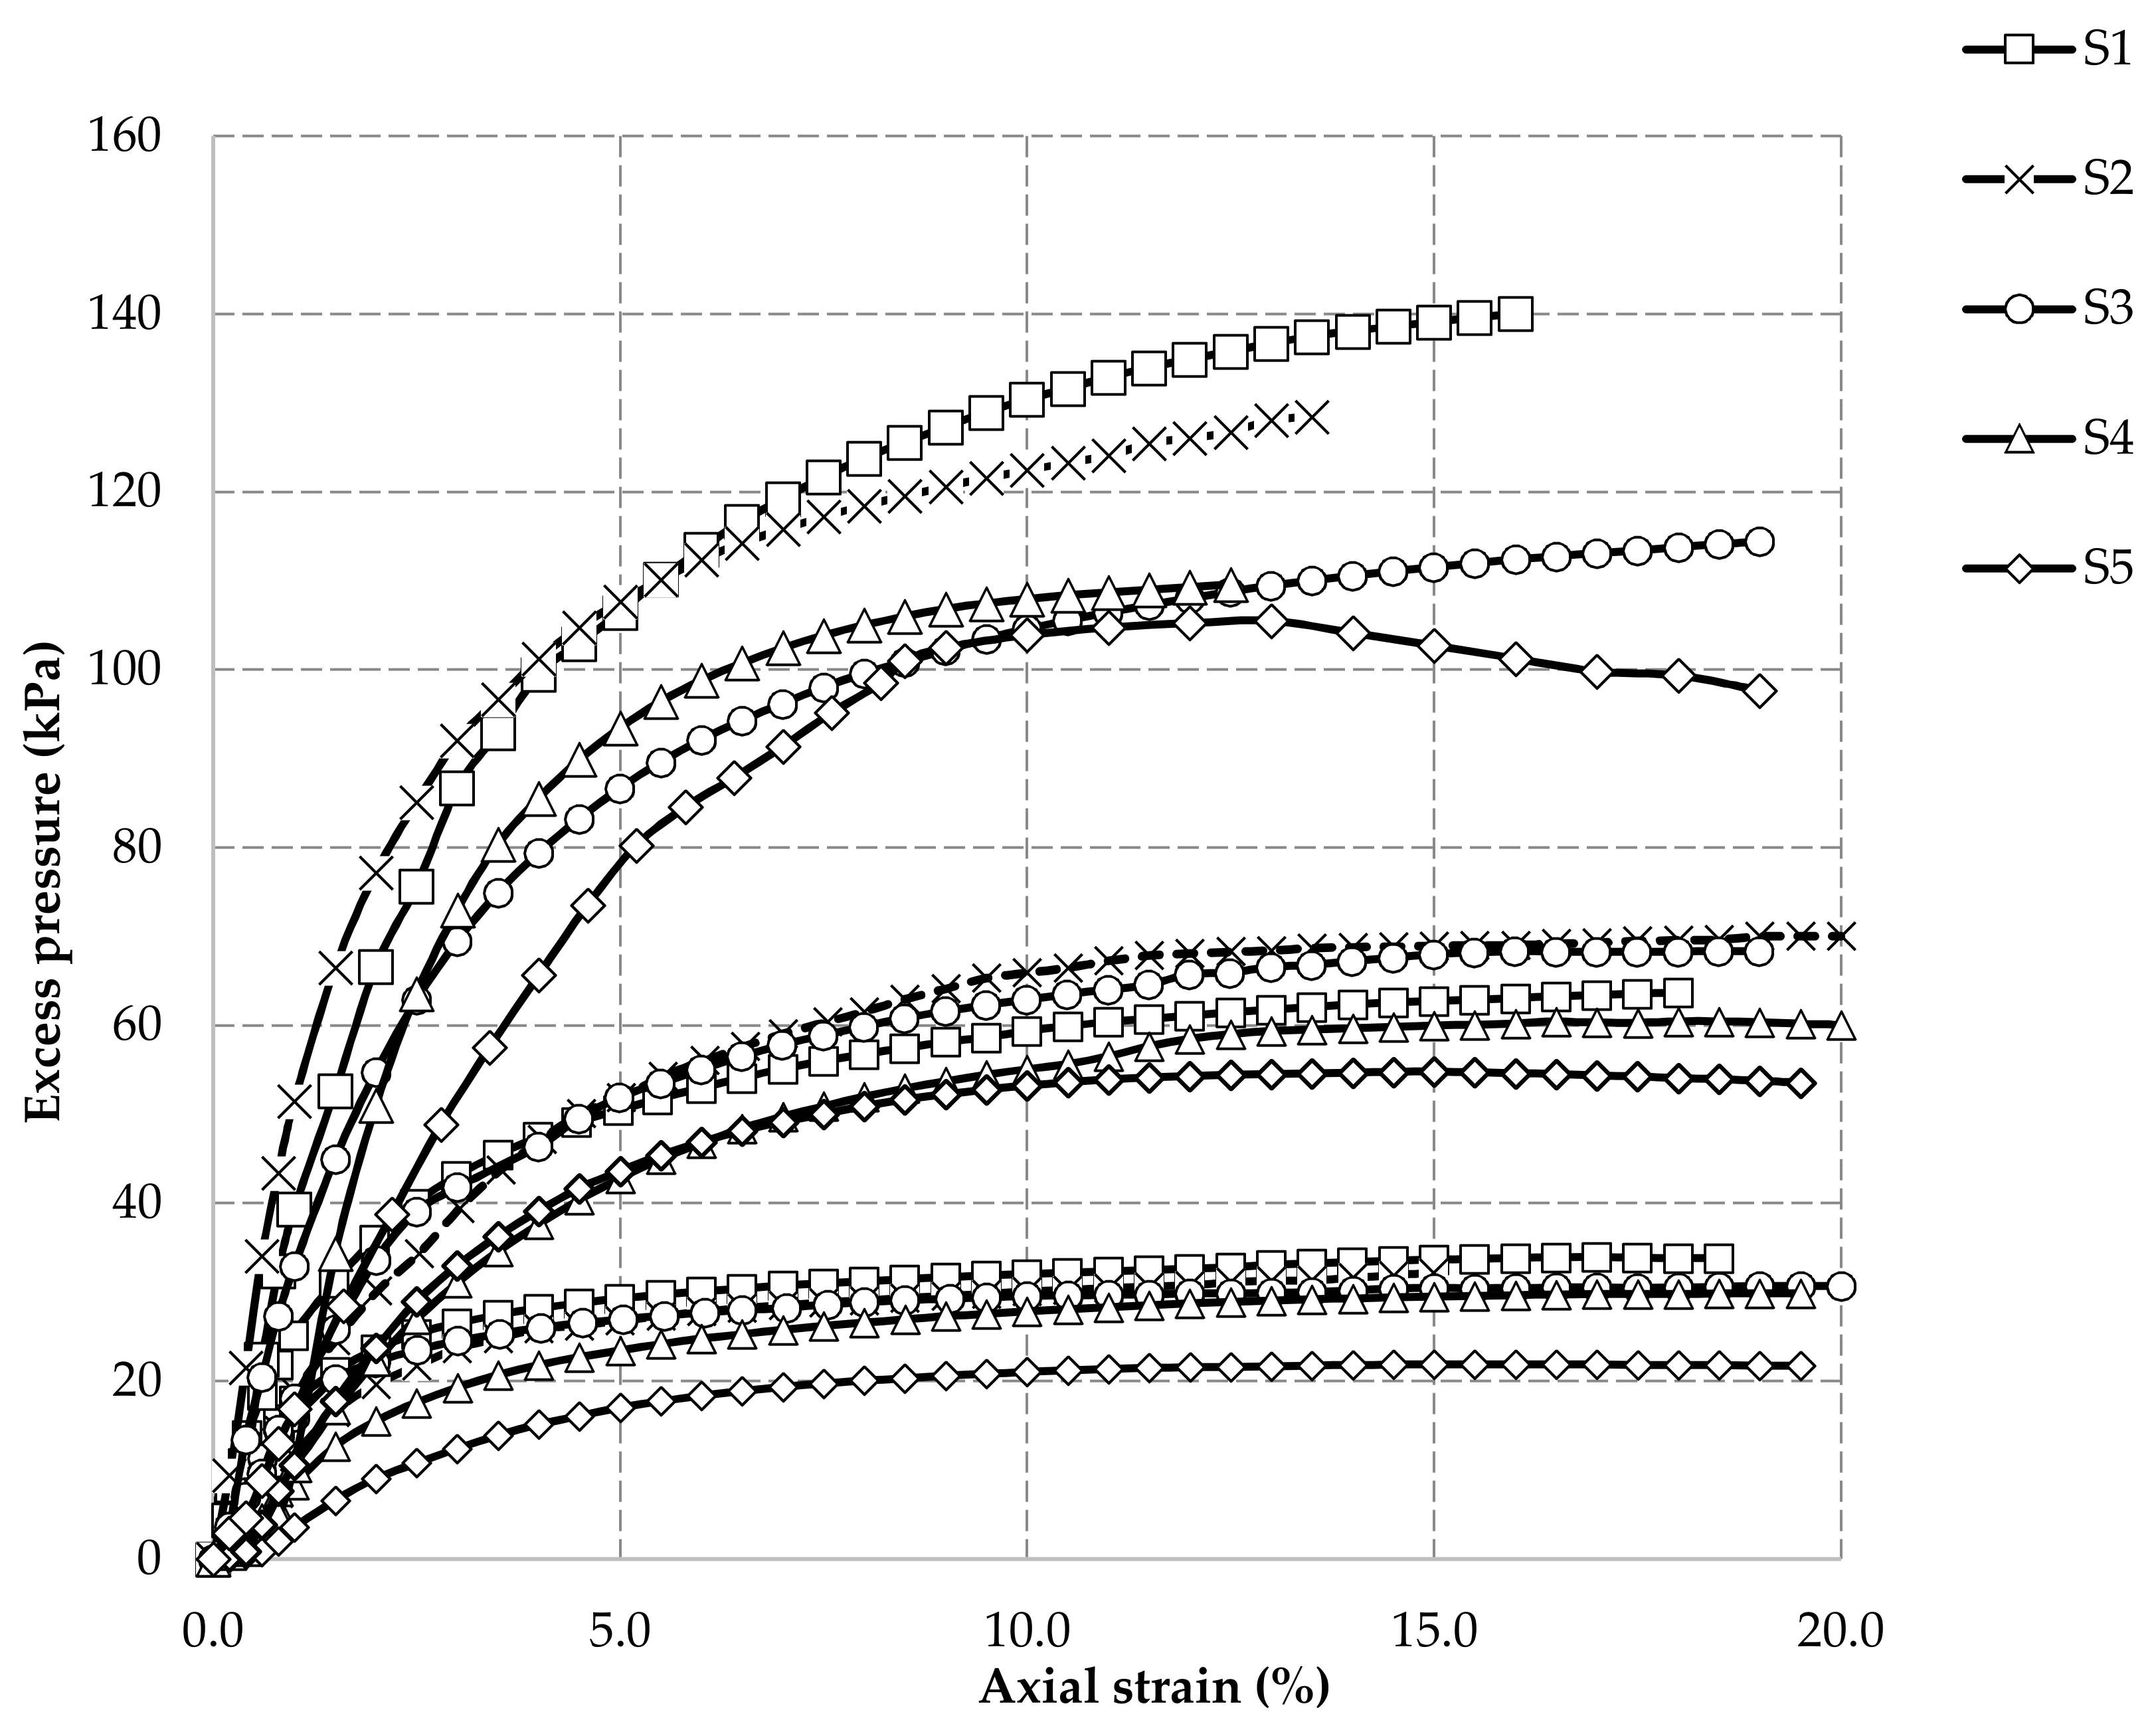
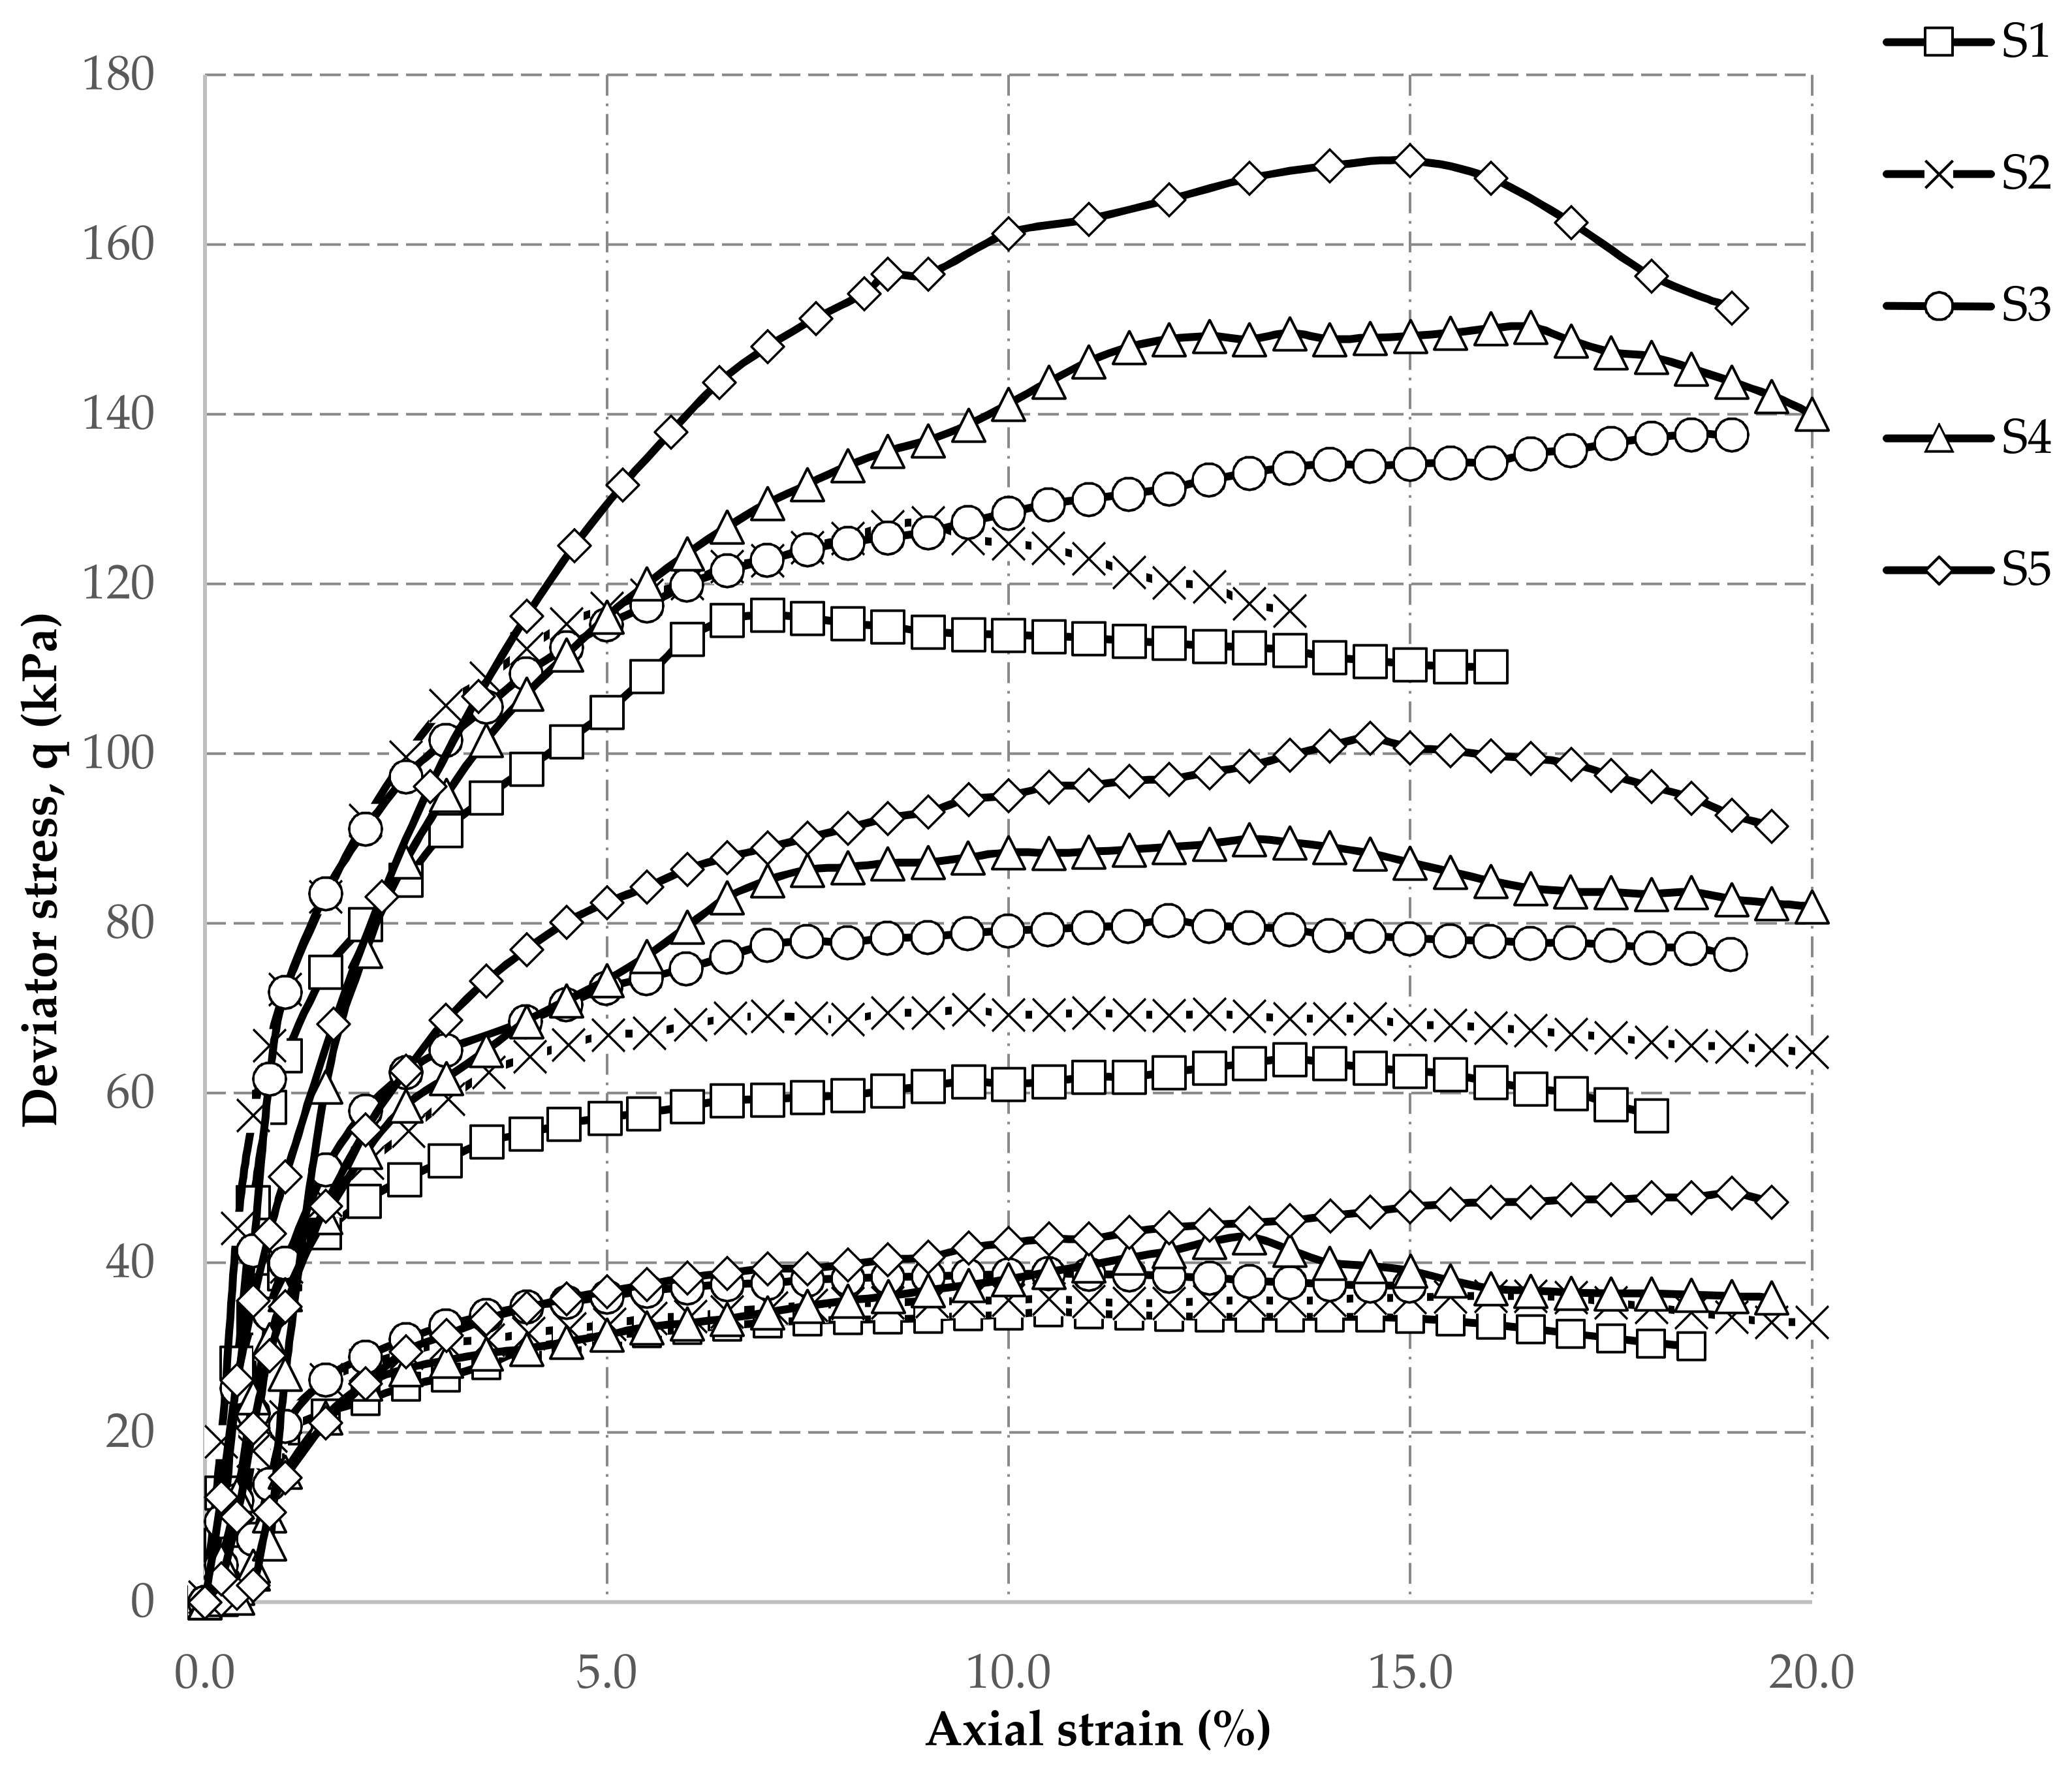
The effective stress paths, excess pore pressure-axial strain behaviour, and stress-axial strain behaviour of each specimen is illustrated in Figure 4, Figure 5 and Figure 6, respectively. The mean effective stress and deviator stress are defined by the following two equations:
p′ = (σ1′ + 2σ3′)/3
q = σ1′ − σ3′
From Figure 4, it can be noted that stress-strain behaviour shows strain-softening for all the specimens, because the changes in mean effective stress were all negative values for all the specimens. However, the effective stress path shifts to the right as the silt content increases under the same confining pressure. This can be verified from the effective stress paths and deviator stress-strain behaviour of these specimens. For specimens in groups S1, S2 and S3, the mean effective stress decreased during the shear phase. For specimens in groups S5, and S4—50, S4—200, the mean effective stress decreased at the beginning of the shear phase, but then increases in mean effective stress were observed from those specimens.
Dilation or slight dilation behaviour can also be found for specimens S5—50, S5—100, S5—200, and S4—100, with negative values in the change of excess pore pressure as shown in Figure 5. Consequently, this resulted in the stress paths of those specimens turning direction in the p-q space. Based on these observations, for the S1, S2, and S3 specimens (100% Port of Brisbane soft soil), the effective stress paths are typical of normally consolidated clay. For the S5 specimens (100% kaolin soil), the effective stress paths are typical of loose to medium-dense silty sand. Behaviour of the specimens in the S4 group show transitional form, as the stress paths of S4—50, and S4—100 show normal consolidated clay behaviour, however, that of the S4—200 shows slight loose to medium-dense sand behaviour. Silt content is also a key factor determining the maximum deviator stress of the specimens. Figure 6 shows the relationship between stress and axial strain of the specimens under each confining pressure. Figure 5 summarises the change in excess pore pressure for each group of specimens. Most of the testing results show that the maximum deviator stress of the specimens and the silt content increased simultaneously, with the same confining pressure. The maximum excess pore pressure, however, decreased as the silt content increased, as shown in Figure 5.
3.1.2. Critical State Behaviour
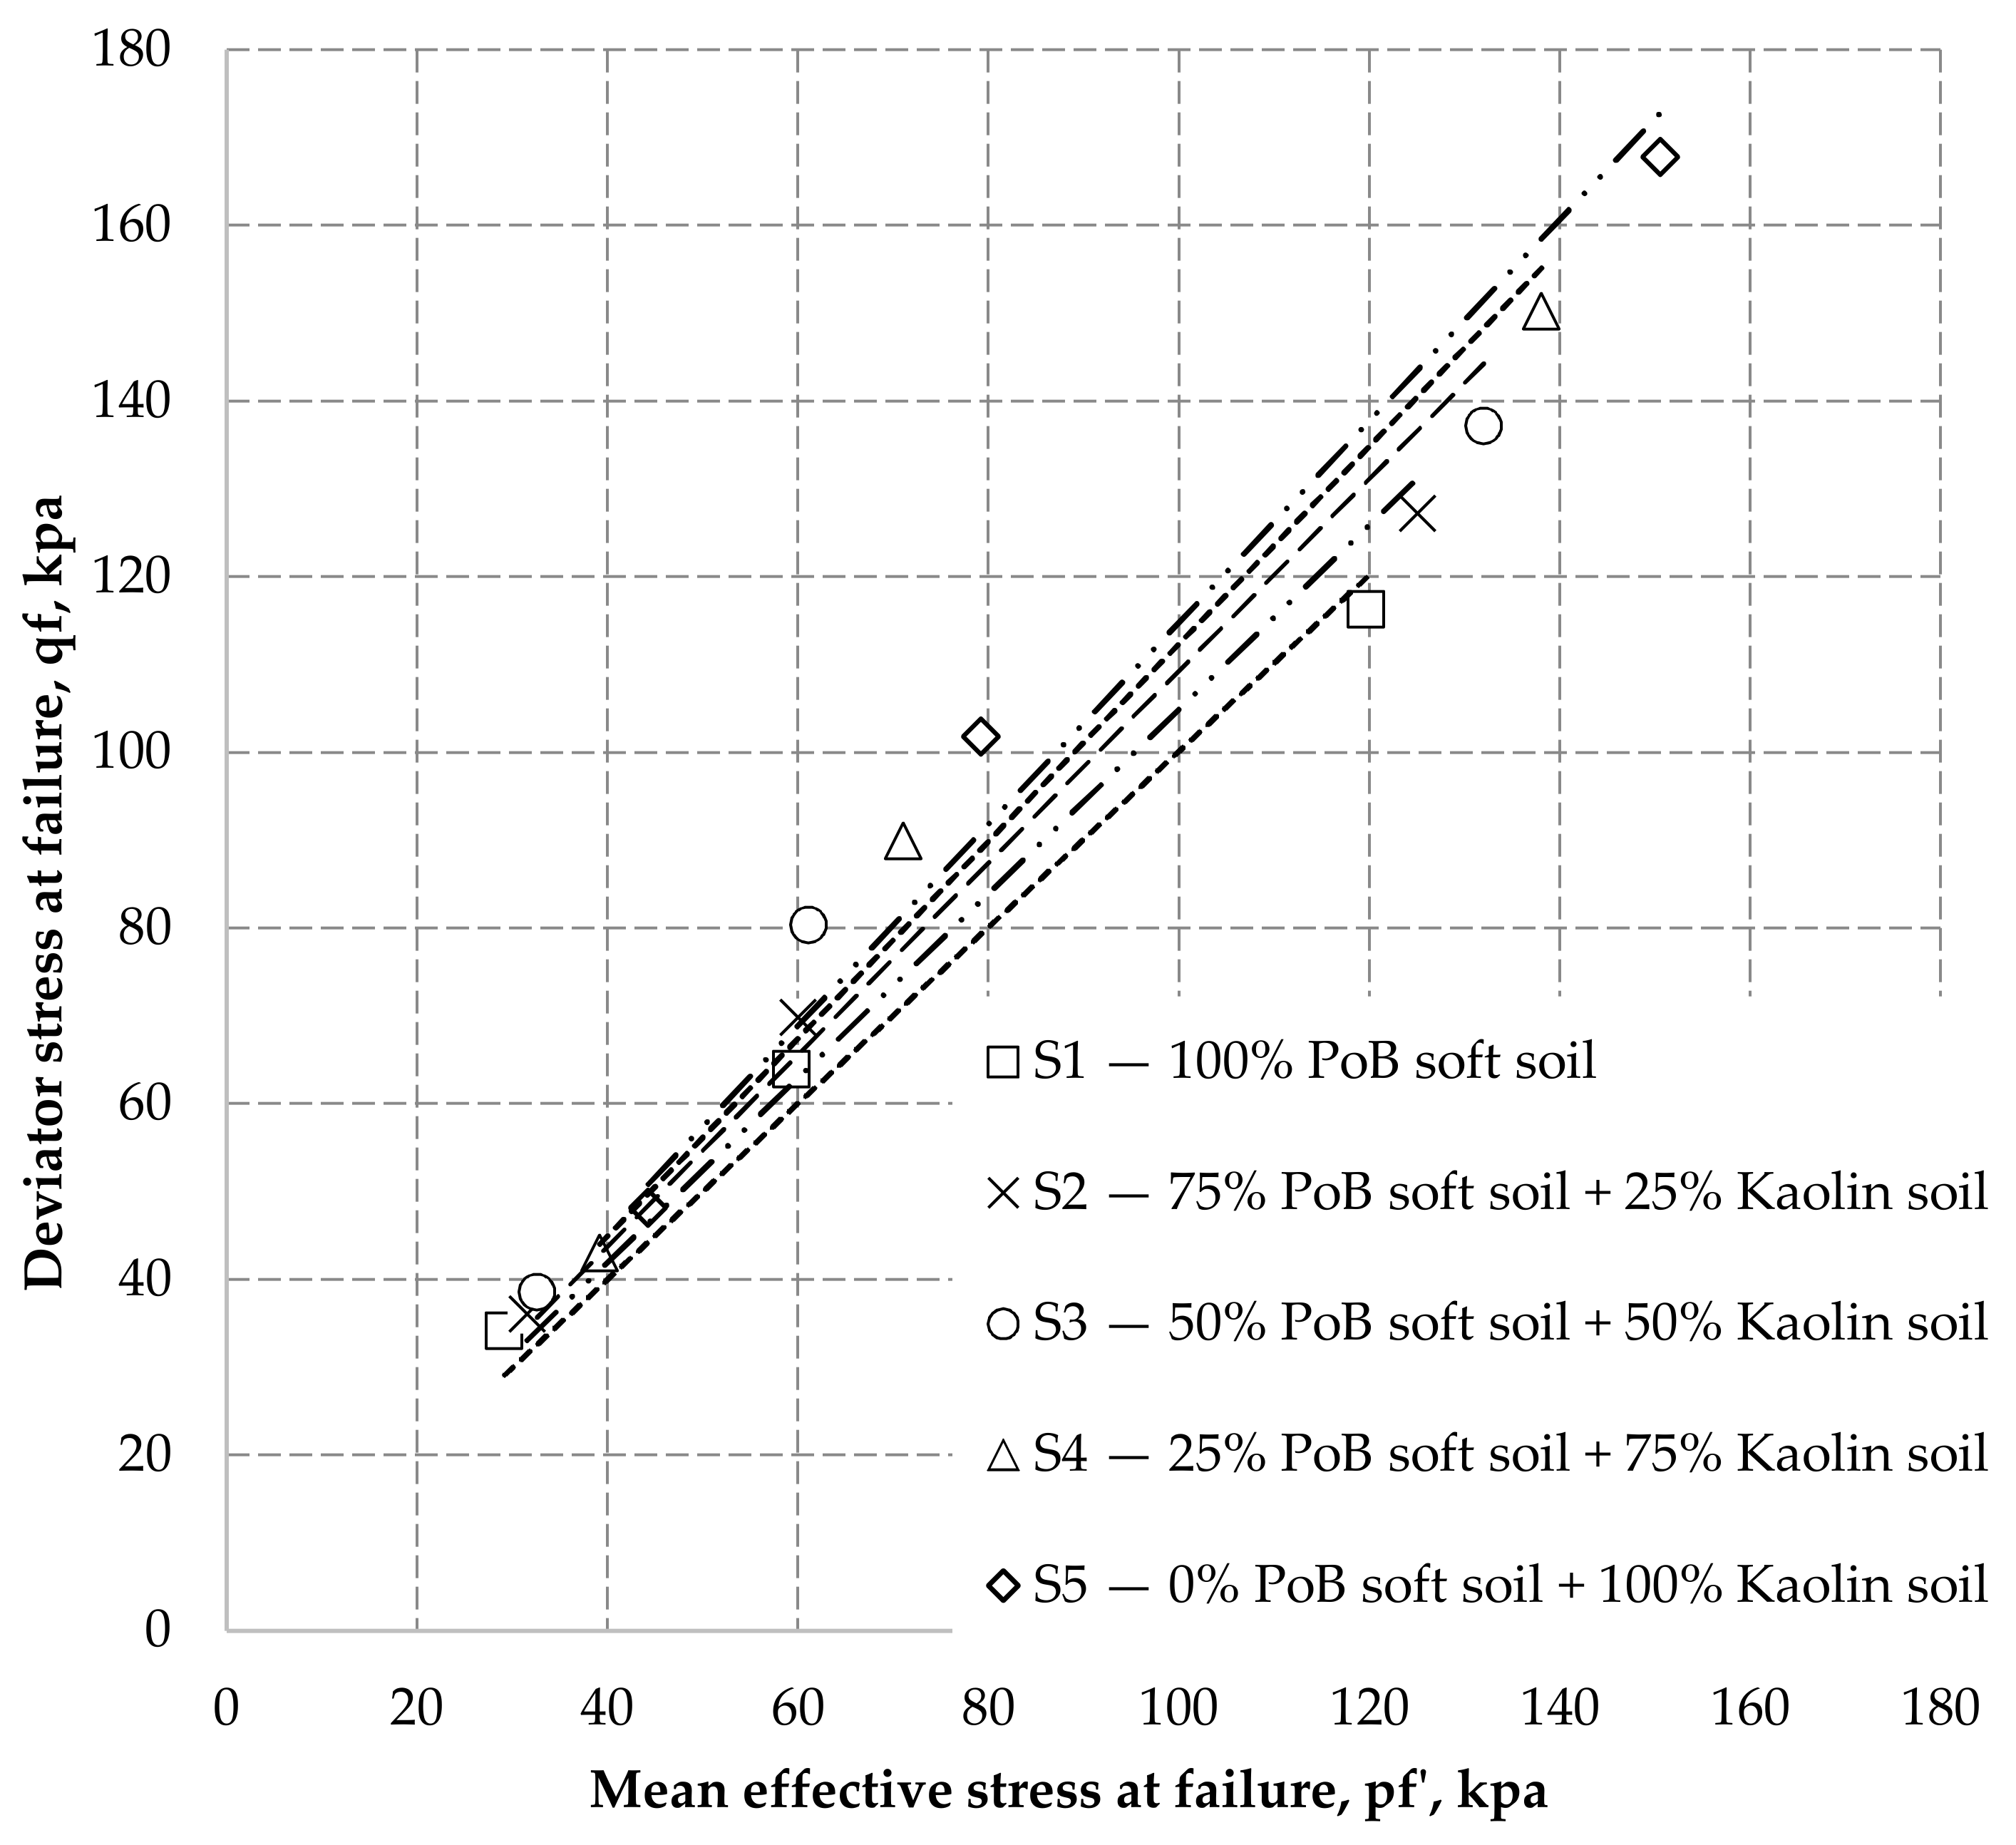
Figure 7 is plotted based on the deviator stress and mean effective stress of each specimen at failure condition. According to the published literature [65], the deviator stress at failure can be determined when either of the following conditions are achieved: (a) maximum principal stress, and (b) constant deviator stress and pore pressure. The corresponding values of strain and pore pressure are axial strain at failure and pore pressure at failure, respectively [65]. In this study, the maximum principal stress ratio method has been adopted to identify deviator stress at failure. Hence, the mean effective stress and deviator stress at failure refer to the mean effective stress and deviator stress at the condition when the maximum principal ratio was observed.
The slope M has been used as a fitting parameter to indicate the critical state behaviour of soils. It can also be used to calculate the effective friction angles of the soil. The fitting parameter M was determined by the gradient of CSL for each group of specimens. Then the effective friction angle for each group of soil was back calculated by the following equation proposed by [67]:
A summary of the fitting factors M and the effective internal friction angle of the tested specimens are summarised in Table 4. It can be observed that the CSL of S5 group specimens shows the highest M value of 1.15, in which the specimens are 100% kaolin soil without any Port of Brisbane soft soil added into the specimen. On the other hand, the S1 group specimens shows the lowest M value of 1.01, where the specimens are 100% Port of Brisbane soft soil without any addition of kaolin soil. In general, M of the fitting line increases as the silt content increases or the clay content decreases.
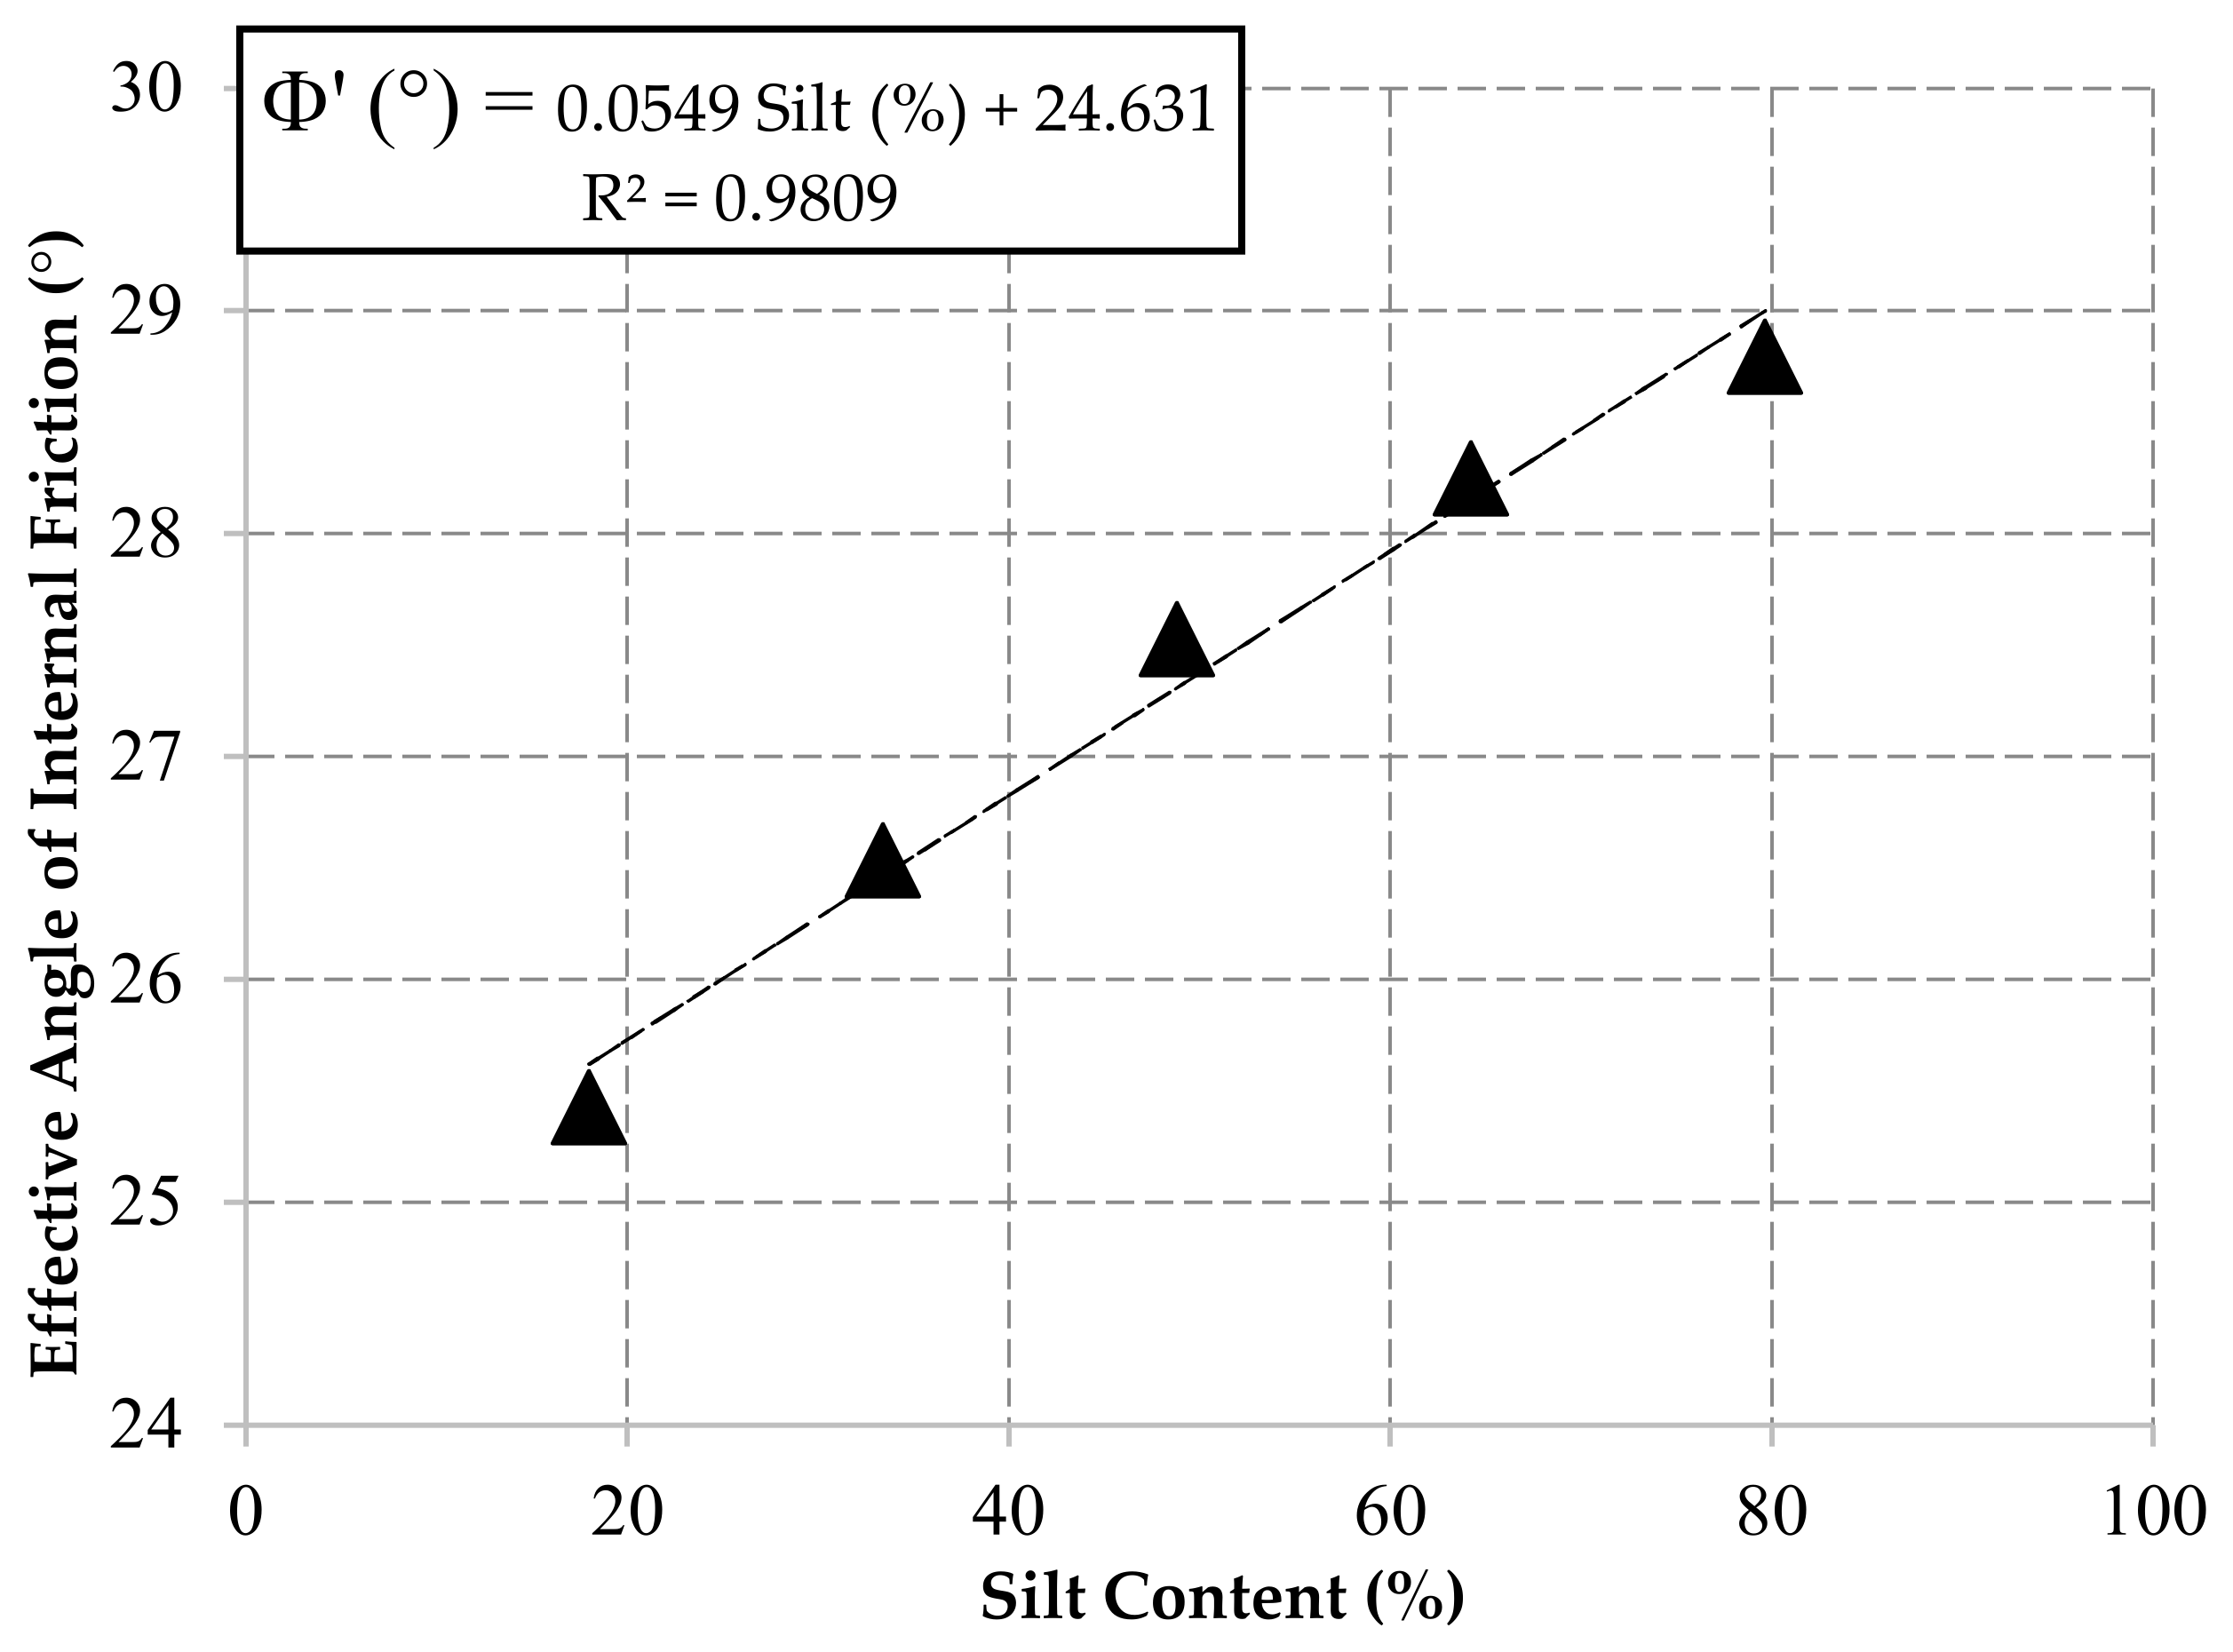
It is also apparent that the effective friction angle and the silt content increase simultaneously. For clarification, the calculated values of the friction angle are plotted against the silt content in percentage in Figure 8. The relationship between the silt content and effective angles of friction is inversely proportional, as indicated in Figure 8. The correlation between silt content and effective internal friction angle for the tested soils is:
with a coefficient of determination (R2) equal to 0.98.
ϕ′ (°) = 0.0549 Silt (%) + 24.631
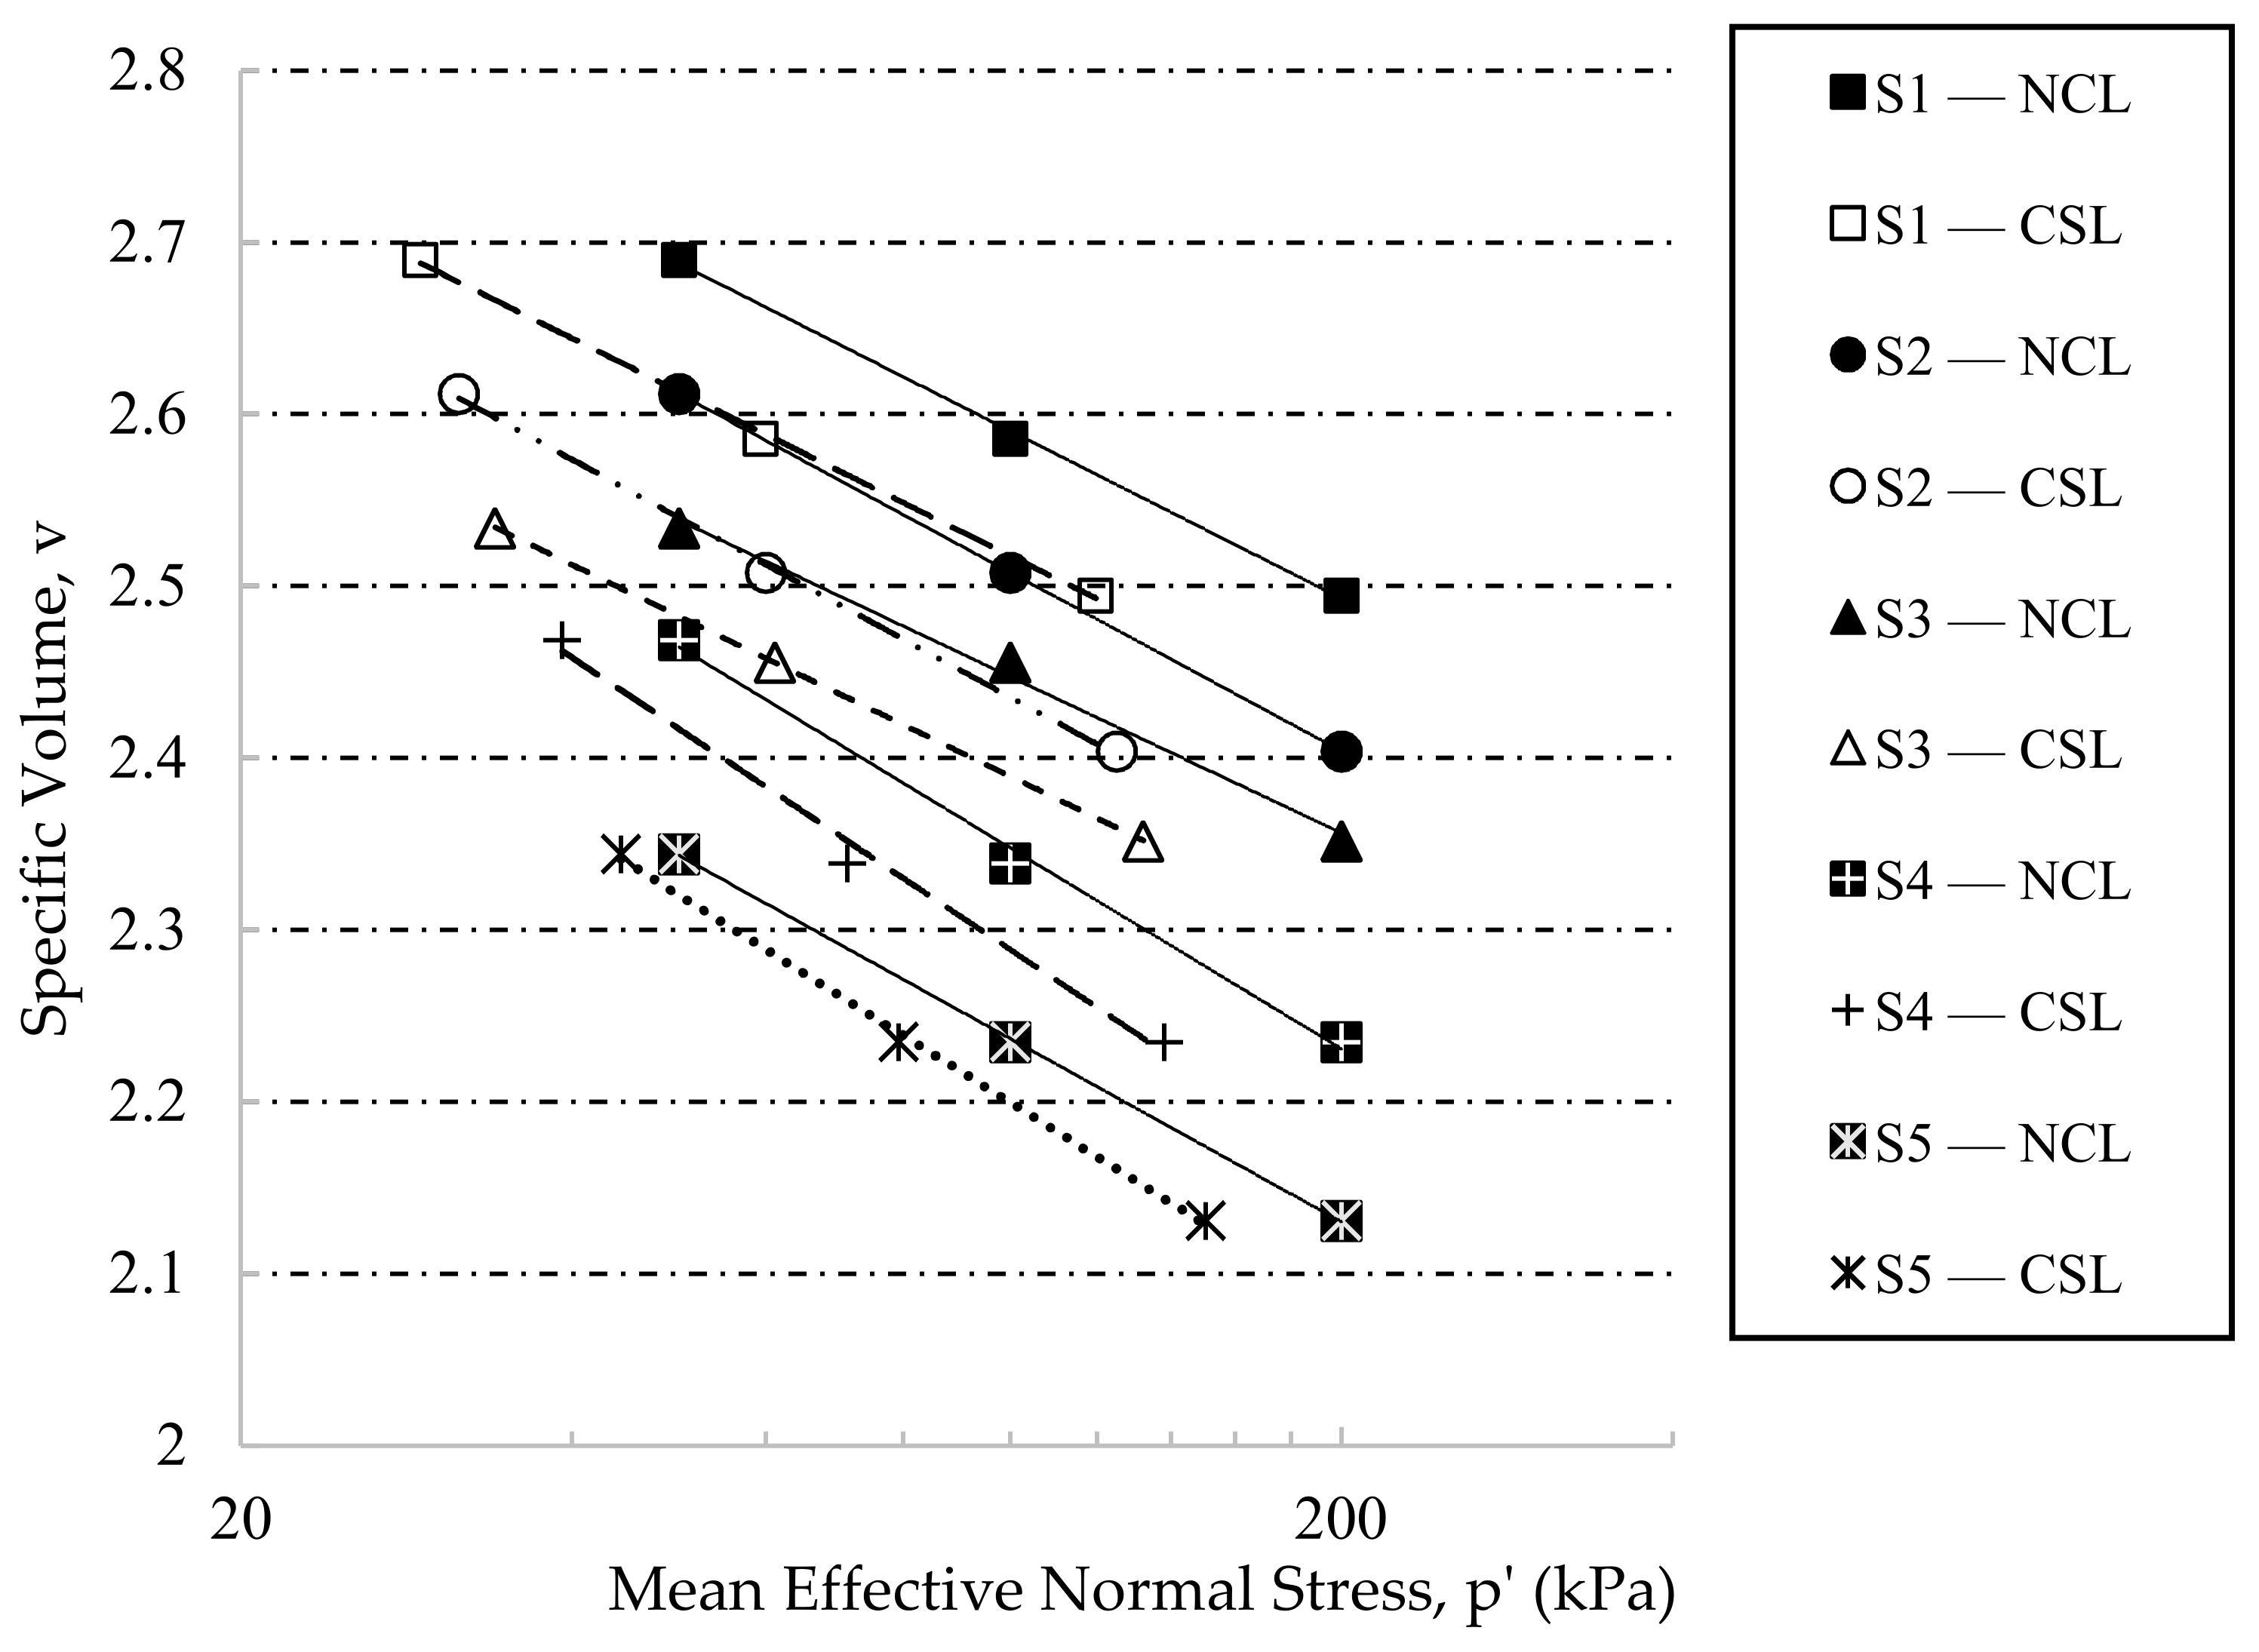
The semi-logarithmic plot of CSLs and NCLs derived from consolidated isotropic undrained shear triaxial compression testing results is shown in Figure 9. In the undrained shearing stage, the void ratio of each specimen remains constant. The water content of each tested specimen was measured as introduced previously. Therefore, the void ratio, as well as the specific volume in CSLs and NCLs, were determined. The effective stress paths shift to the left horizontally, as shown in Figure 9, because the drainage condition was undrained during the shear phase. It can be observed that the CSLs and NCLs are parallel, as shown in Figure 9, for the S1, S2, and S3 groups’ specimens. The gradients of the respective CSLs seem to be becoming non-parallel to the gradients of their corresponding NCLs with the increase in silt content, as indicated by the CSLs and NCLs of S4. For the S5 group specimens, the gradients of the CSLs are obviously not parallel to those of the NCLs, indicating that the silt particle content starts to dominate the behaviour of the soil. Therefore, it can be concluded that S1, S2, and S3 show typical clay behaviour, while S5 shows typical loose to medium-dense sand behaviour. S4 is in a transitional form.
Furthermore, the gradients of the compression lines of the tested specimens were derived from the NCL and CSL results of each group of specimens, as shown in Table 5 and Figure 9. The ratios of the gradients of compression lines (λ (NCL)/λ (CSL)) of S1, S2, S3, S4, and S5 are 1.02, 0.99, 0.97, 0.90, and 0.88, respectively. This also indicates that the NCLs and the corresponding CSLs of S1, S2, and S3 are relatively more parallel than those of S4, and S5. This indicates that specimens with higher clay contents are likely to have more parallel CSLs and NCLs. The R2 of the λ (NCL)/λ (CSL) and silt content for the tested specimens is 0.951 and the correlation equation is:
λ (NCL)/λ (CSL) = −0.0023 Silt content% + 1.07
3.2. Unconfined Compressive Strength of Stabilised Soils
The unconfined compressive strength (UCS) results for all the tested specimens are summarised in Table 6. The cement additive contents adopted were 10, 15, 20, 25, and 30%. Four groups of specimens with different PoB soft soil and kaolin soil mixing ratios were considered, as shown in Table 6. Therefore, in total 20 sets of specimens were prepared, and each set includes three specimens to determine the average results.
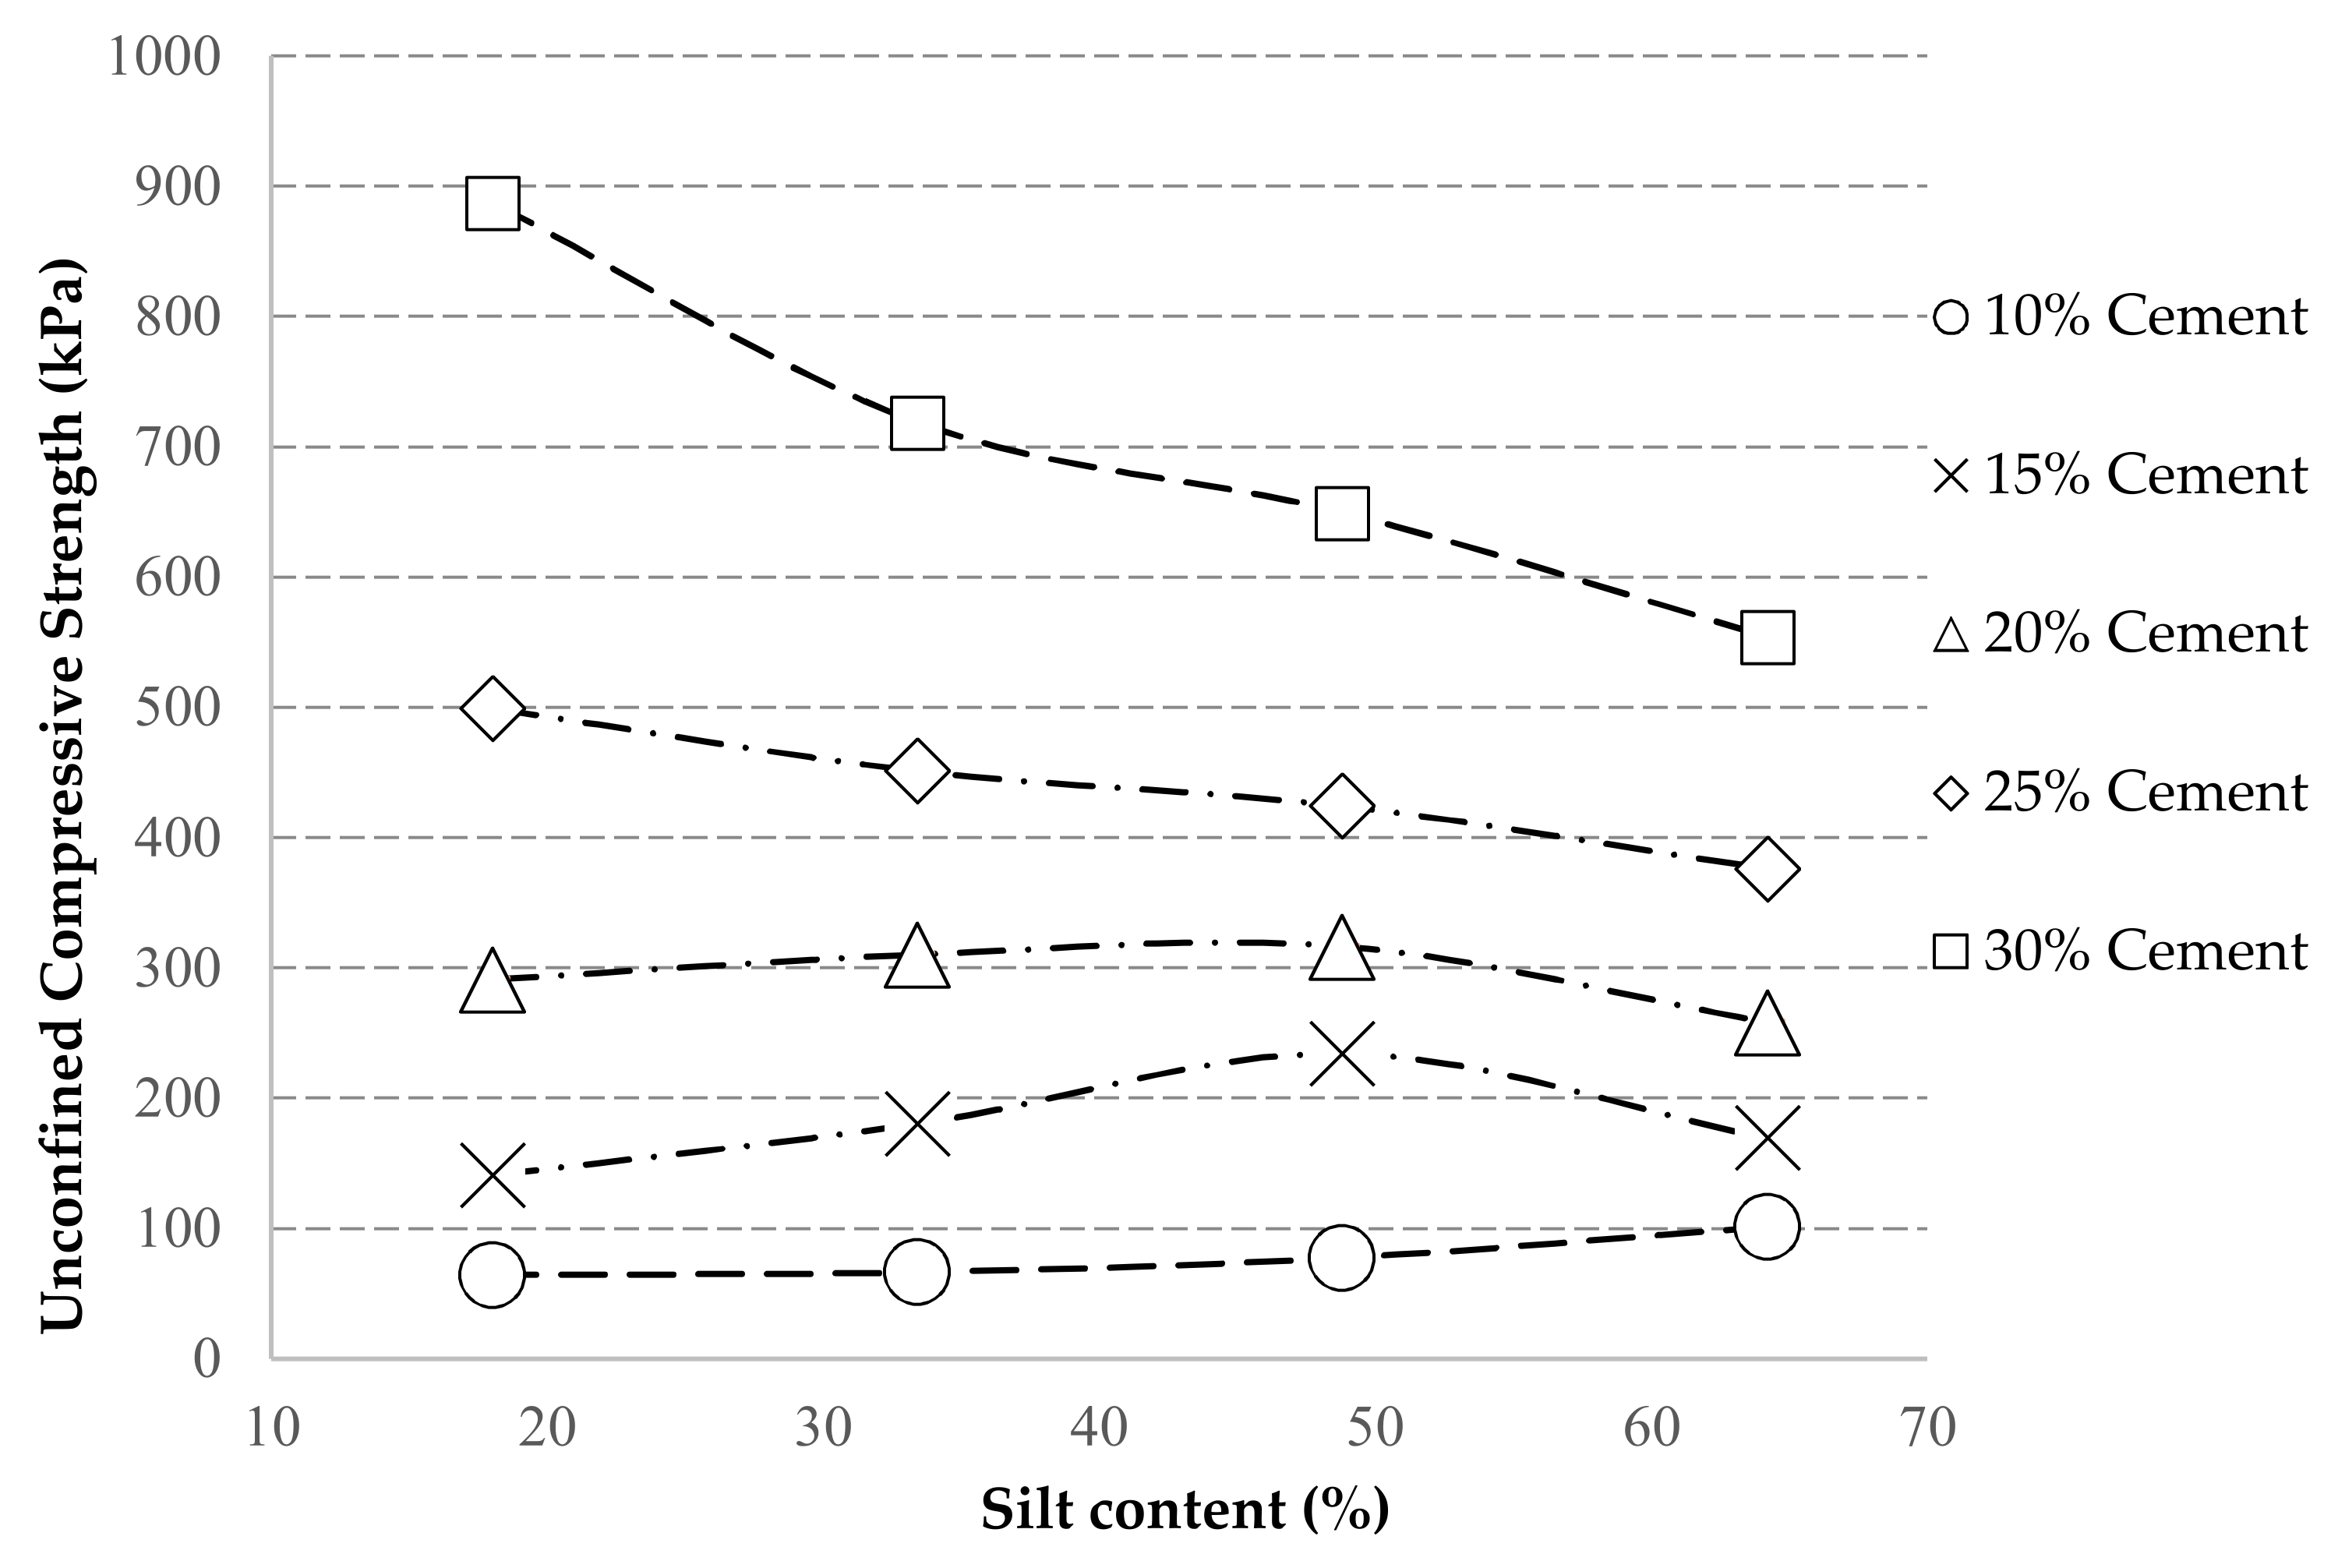
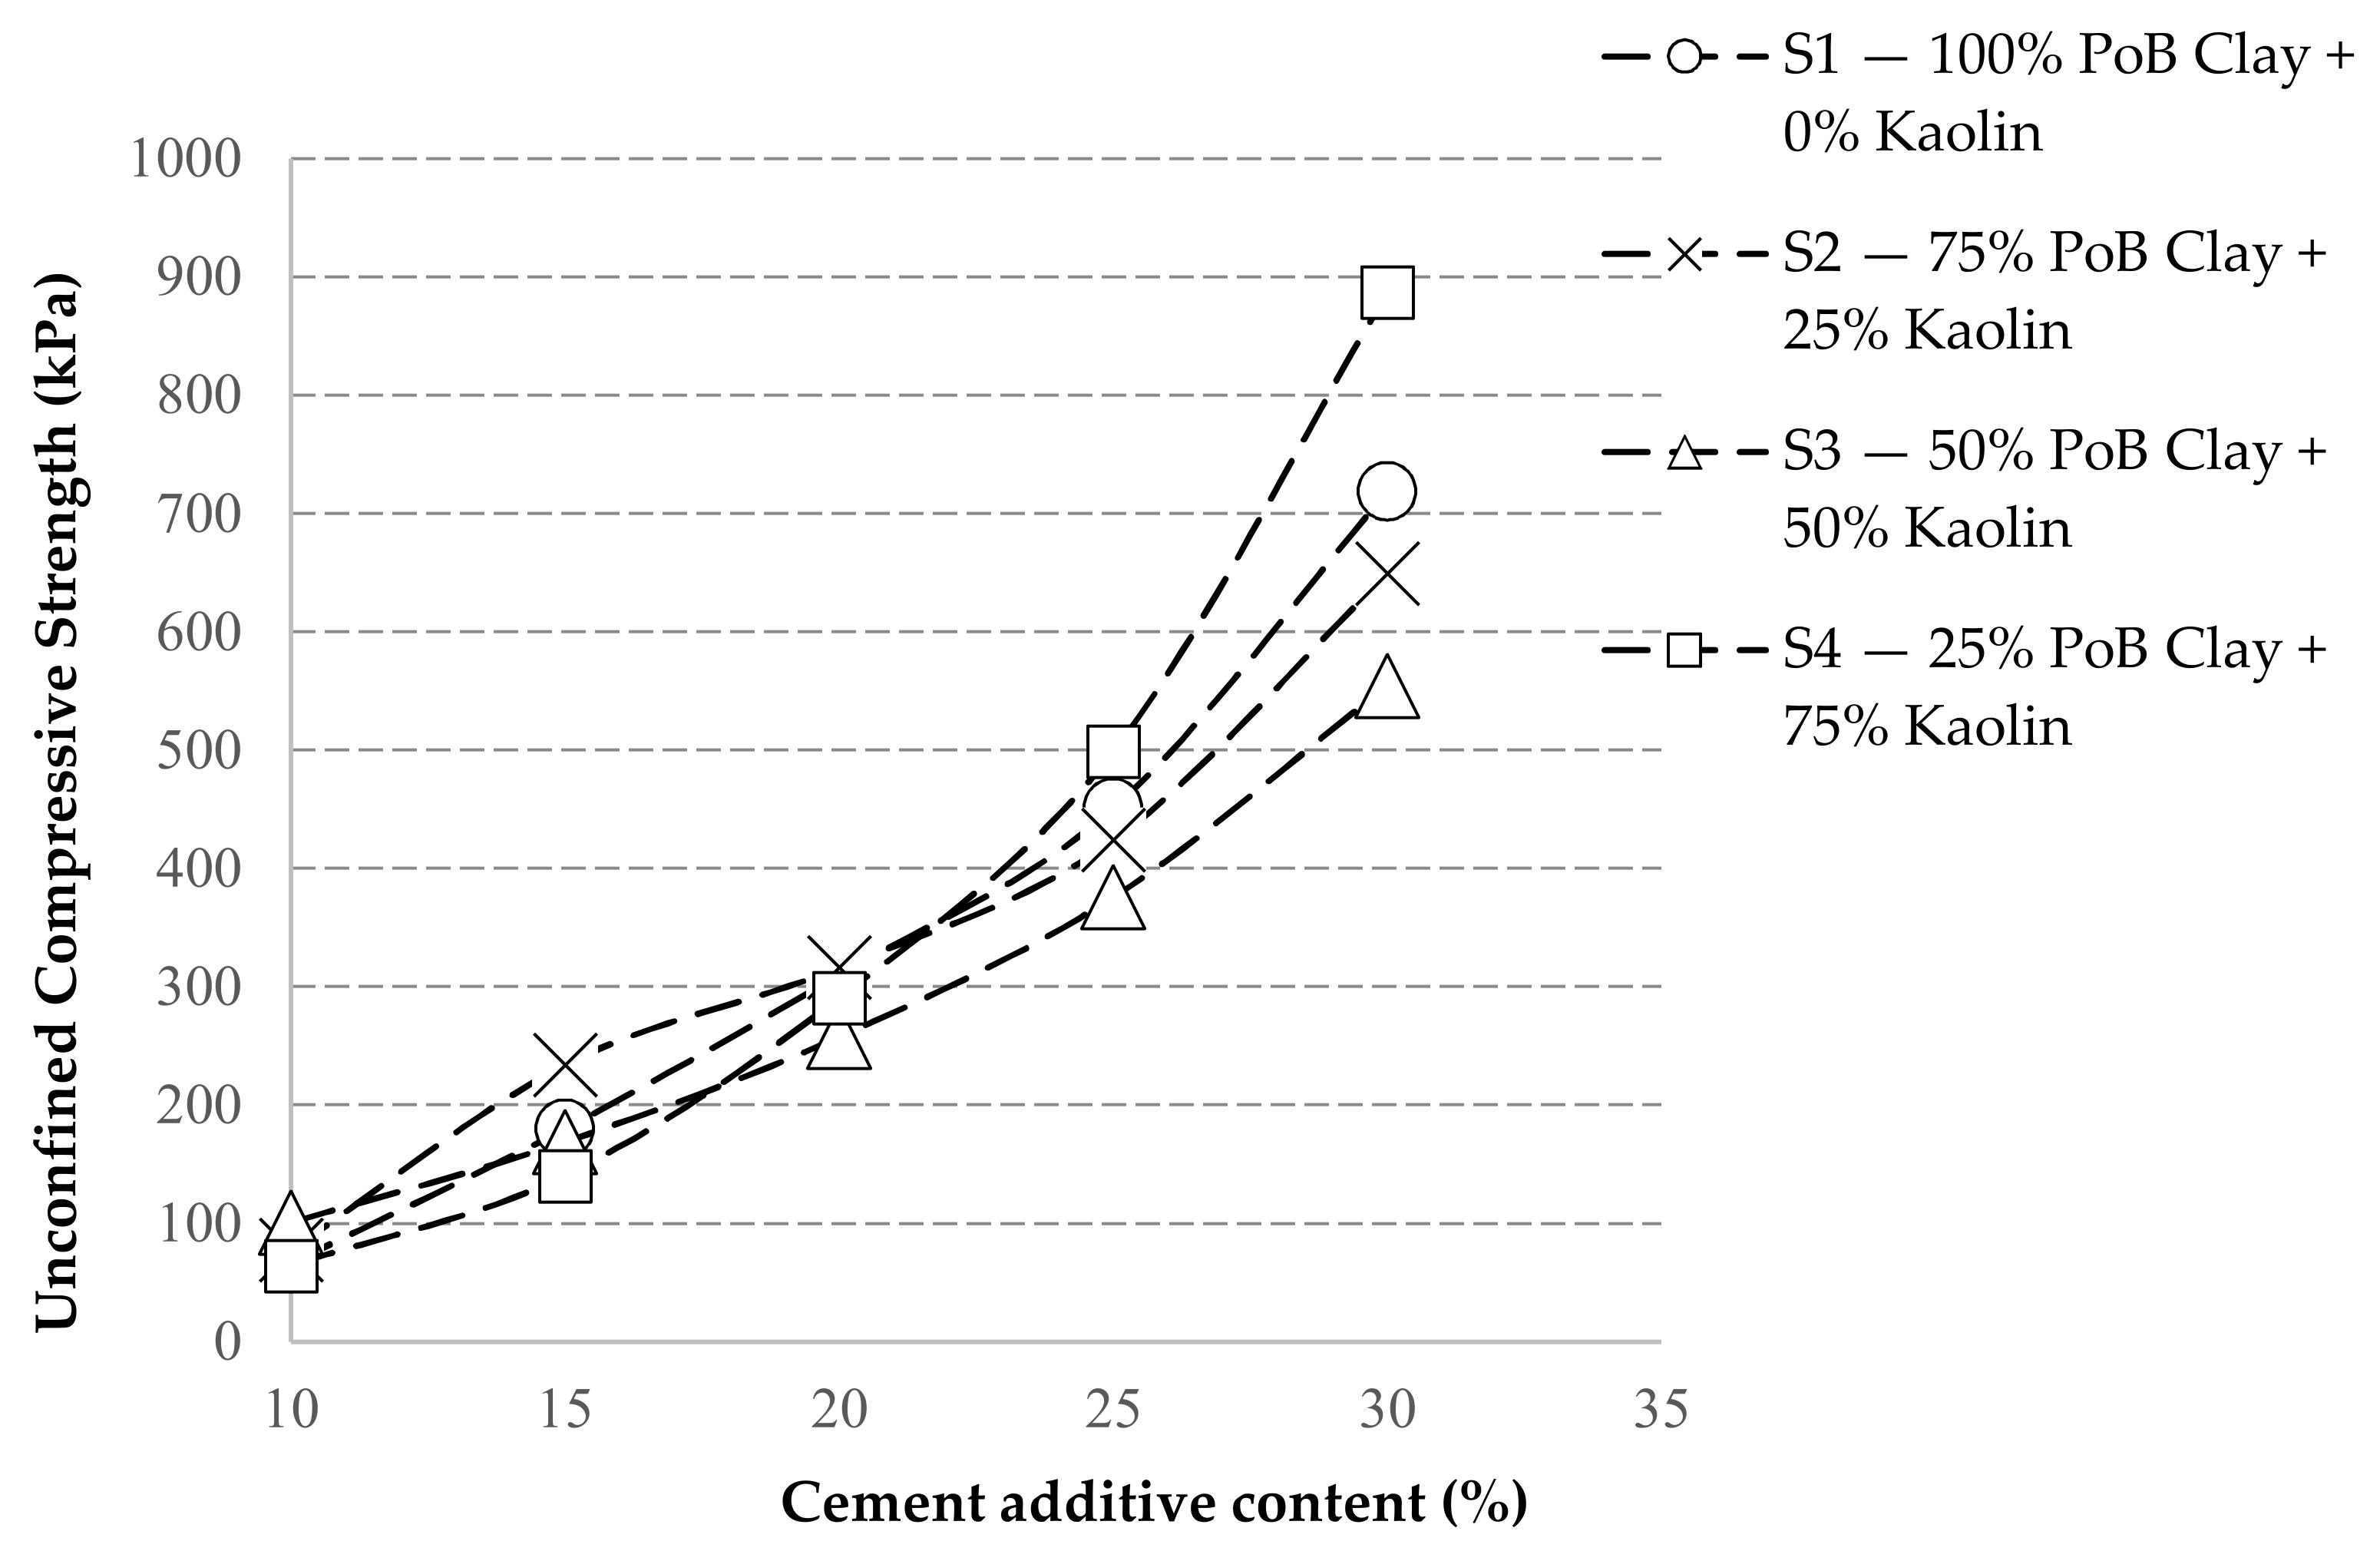
For clarity, the correlation between UCS results and the additive content of cement and the content of silt are shown from the plotted Figure 10 and Figure 11. The correlation between the UCS and the additive content for each group of stabilised specimens is plotted in Figure 10. The results of UCS for each group of specimens increased significantly as the cement additive content increased from 10% to 30%. This is consistent with the outcomes in other studies conducted for soft soils with a high moisture content [31,68,69]. However, it is interesting to find that the influence of the cement on each type of soil is different. The increase in the cement additive content has the biggest influence for the S1 group of specimens, which contain 100% Port of Brisbane soft soil. With the increase in silt content, the influence in UCS as a result of the increase in the cement additive content becomes more and more slight. For example, the addition of cement increased the strength of specimens in group S4 (25% PoB soft soil + 75% kaolin soil), but a further increase in cement content does not contribute significantly to the improvement of strength.
Based on the experimental results in this study, the correlation between silt content and the strength of specimens is related to the cement additive content. Figure 10 shows the relationship between the silt content and UCS of the specimens under varying cement additive contents. From Figure 10, it can be concluded that silt content is a key factor affecting the strength of the stabilised specimens with the same moisture content. Also, the cement additive content has significant influence in terms of the correlation between silt content and the UCS of samples.
In particular, there is an increase in the UCS with the increase of silt content when the cement additive content is only 10%. By comparing the results of specimens in groups S1 (100% PoB soft soil), S2 (75% PoB soft soil + 25% kaolin soil), and S3 (50% PoB soft soil + 50% kaolin soil), it can be seen that for the specimens with a cement additive content of 15 or 20%, the UCS increases with the increase in silt content at first. However, then there is a decrease in the UCS of specimens with a further increase in the silt content, since the UCS of the specimens in S4 (25% PoB soft soil + 75% kaolin soil) is lower than that in S3 at 15% or 20% of cement, as shown in Figure 10. That means that, for the specimens with a cement additive content of 15 and 20%, the UCS of specimens increases with the increase in silt content at first. However, once the silt content reaches a particular percentage or a saturation point, further increases in silt content will result in a decrease in the UCS. For the specimens with a high cement content, such as 25 and 30%, there is a negative correlation between the UCS of the specimens and the cement additive content, as shown in Figure 10. The UCS of specimens in the S1 (100% PoB soft soil) group is higher than that of the S2 (75% PoB soft soil + 25% kaolin soil), S3 (50% PoB soft soil + 50% kaolin soil), and S4 (25% PoB soft soil + 75% kaolin soil) groups, with 25 or 30% cement content.
The addition of cement can aggregate the soil particles to form stronger bonds between the particles, which results in the increase of strength. When the cement additive content is high, such as 25 or 30%, there are not enough clay particles to fill the voids between the silt and cement particles, which results in the decrease in strength with the increase in silt content with the cement additive content of 25% and 30%.
Therefore, it is observed based on the results plotted in Figure 10 that there is not always a positive correlation between the UCS of stabilised specimens and the silt content. Both the silt content and cement additive content have significant influence on the UCS of stabilised specimens with high-water content. Essentially, there is a linear correlation between the UCS of specimens and silt content when the cement additive content is low. When the cement additive content is in the medium range (15, or 20%), the UCS of the specimens increases with the increase in silt content at first, but then the UCS decreases once the silt content reaches a saturation point. These trends can also be observed and verified by the SEM results of specimens. The mechanism of these observed correlations is further explained by the SEM results on the aspect of the micro-structure of the specimens.
3.3. Microstructure of Stabilised Soils
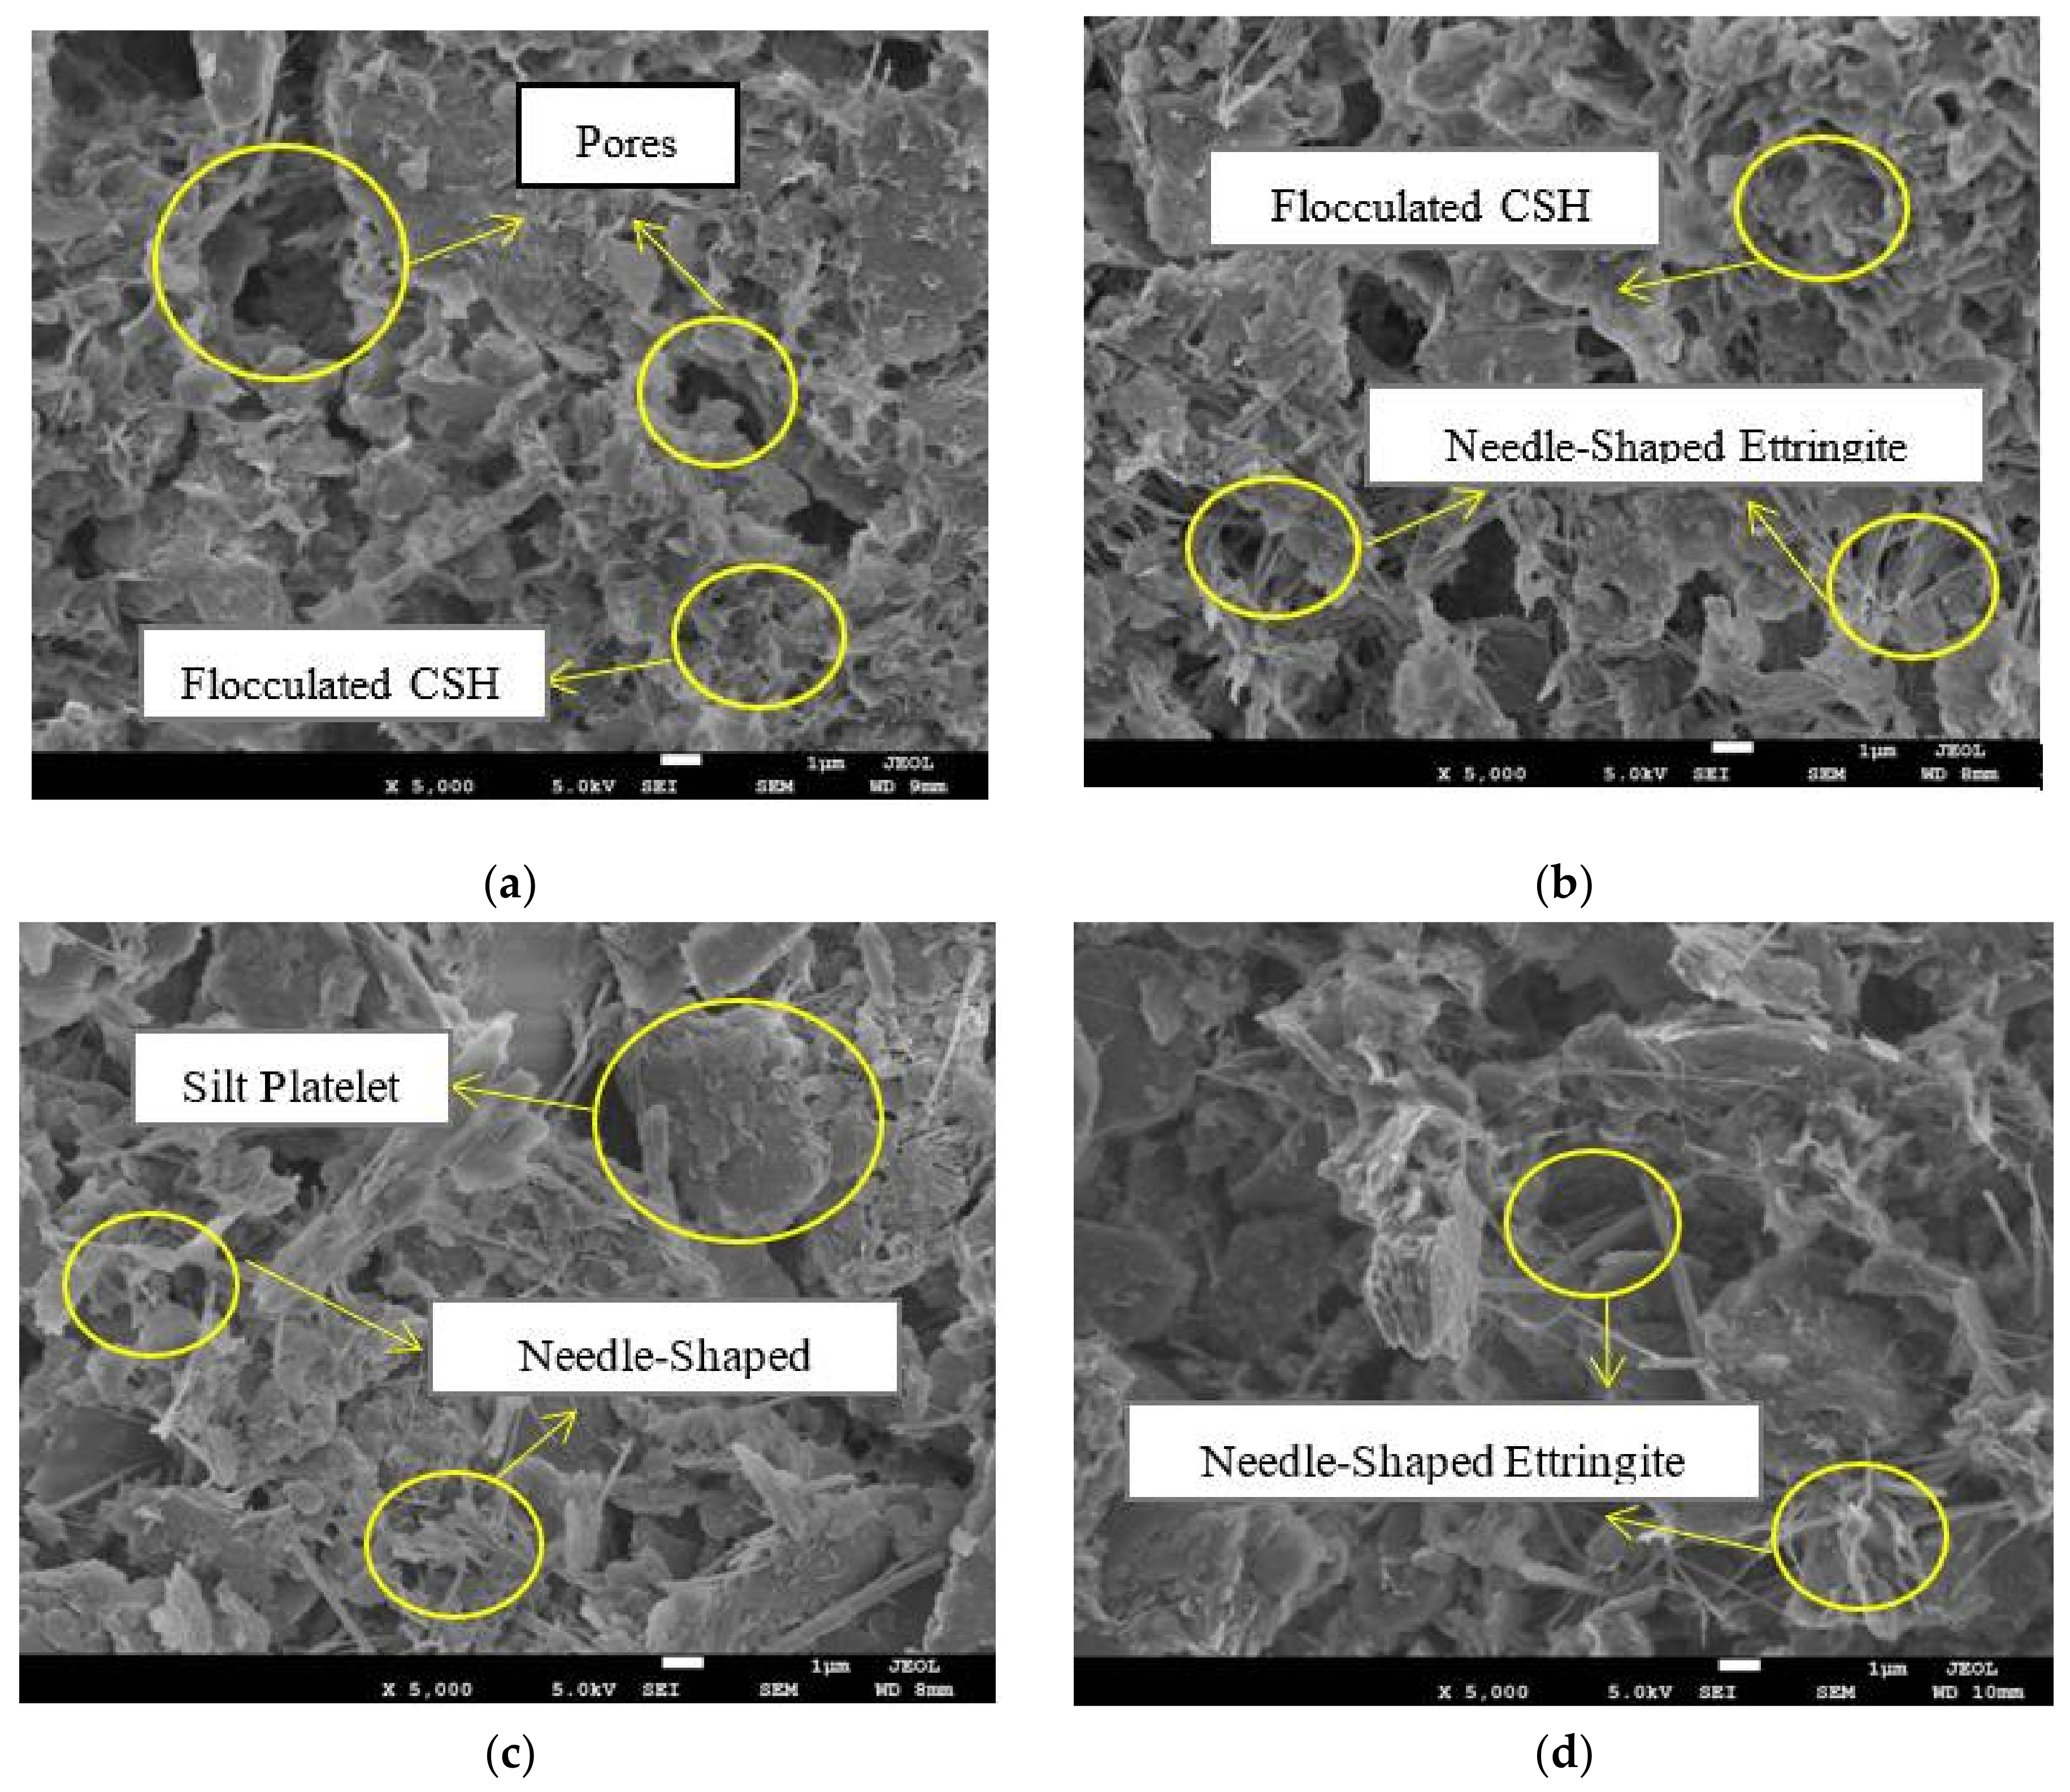
To determine the relationship between strength and microstructure development, and further clarify the findings observed from the UCS results, SEM images with 5000 magnification were analysed. Figure 12, Figure 13 and Figure 14 show the microstructure of stabilised specimens with varying silt and cement contents. Figure 12 indicates the SEM images of four types of clay silt mixture S1 (Figure 12a), S2 (Figure 12b), S3 (Figure 12c), and S4 (Figure 12d) stabilised with 10% cement. Figure 13 and Figure 14 present the SEM images of specimens stabilised with 20% and 30% cement, respectively.
It can be clearly seen by comparing Figure 12a, Figure 13a and Figure 14a that there is a decrease in the number of large pores and an increase in small pores with the increment of cement content, which can be attributed to the production of cementitious materials formed from cement hydration and pozzolanic reaction, such as calcium silicate hydrates (CSH), calcium aluminium silicate hydrates (CASH), and ettringite. These products, which can be found in the images as reticulation (CSH, CASH), flocculation (CSH, CASH) and needle-shaped structure (Ettringite), filled pores and coated soil particles, which results in a dense aggregated structure responsible for the strength gain. The observations from SEM images are consistent with results obtained by [70]. His observations of SEM images of cement-treated marine clay in Singapore indicated that the flocculation of the clay particles results in the water to be trapped within the clay-cement cluster and, therefore, both the entrance pore diameter and particles of cluster were increased [70].
However, when the cement content remained constant, the microstructure of the four samples with different silt content did not change consistently. At the lower additive content of cement (10%), there is an obvious growth in the number of larger silt platelets (see Figure 12a–d) with the increment of silt content which is due to the larger size of silt particles and edge-to-edge and edge-to-surface contact of silt platelets. However, the area of soil pores is slightly decreased at the same time. This can be attributed to those smaller size clay platelets which can easily fill in the large pores and aggregate together by cementitious gels to form large and dense aggregates, which improved the stability of the soil structure and increased the strength.
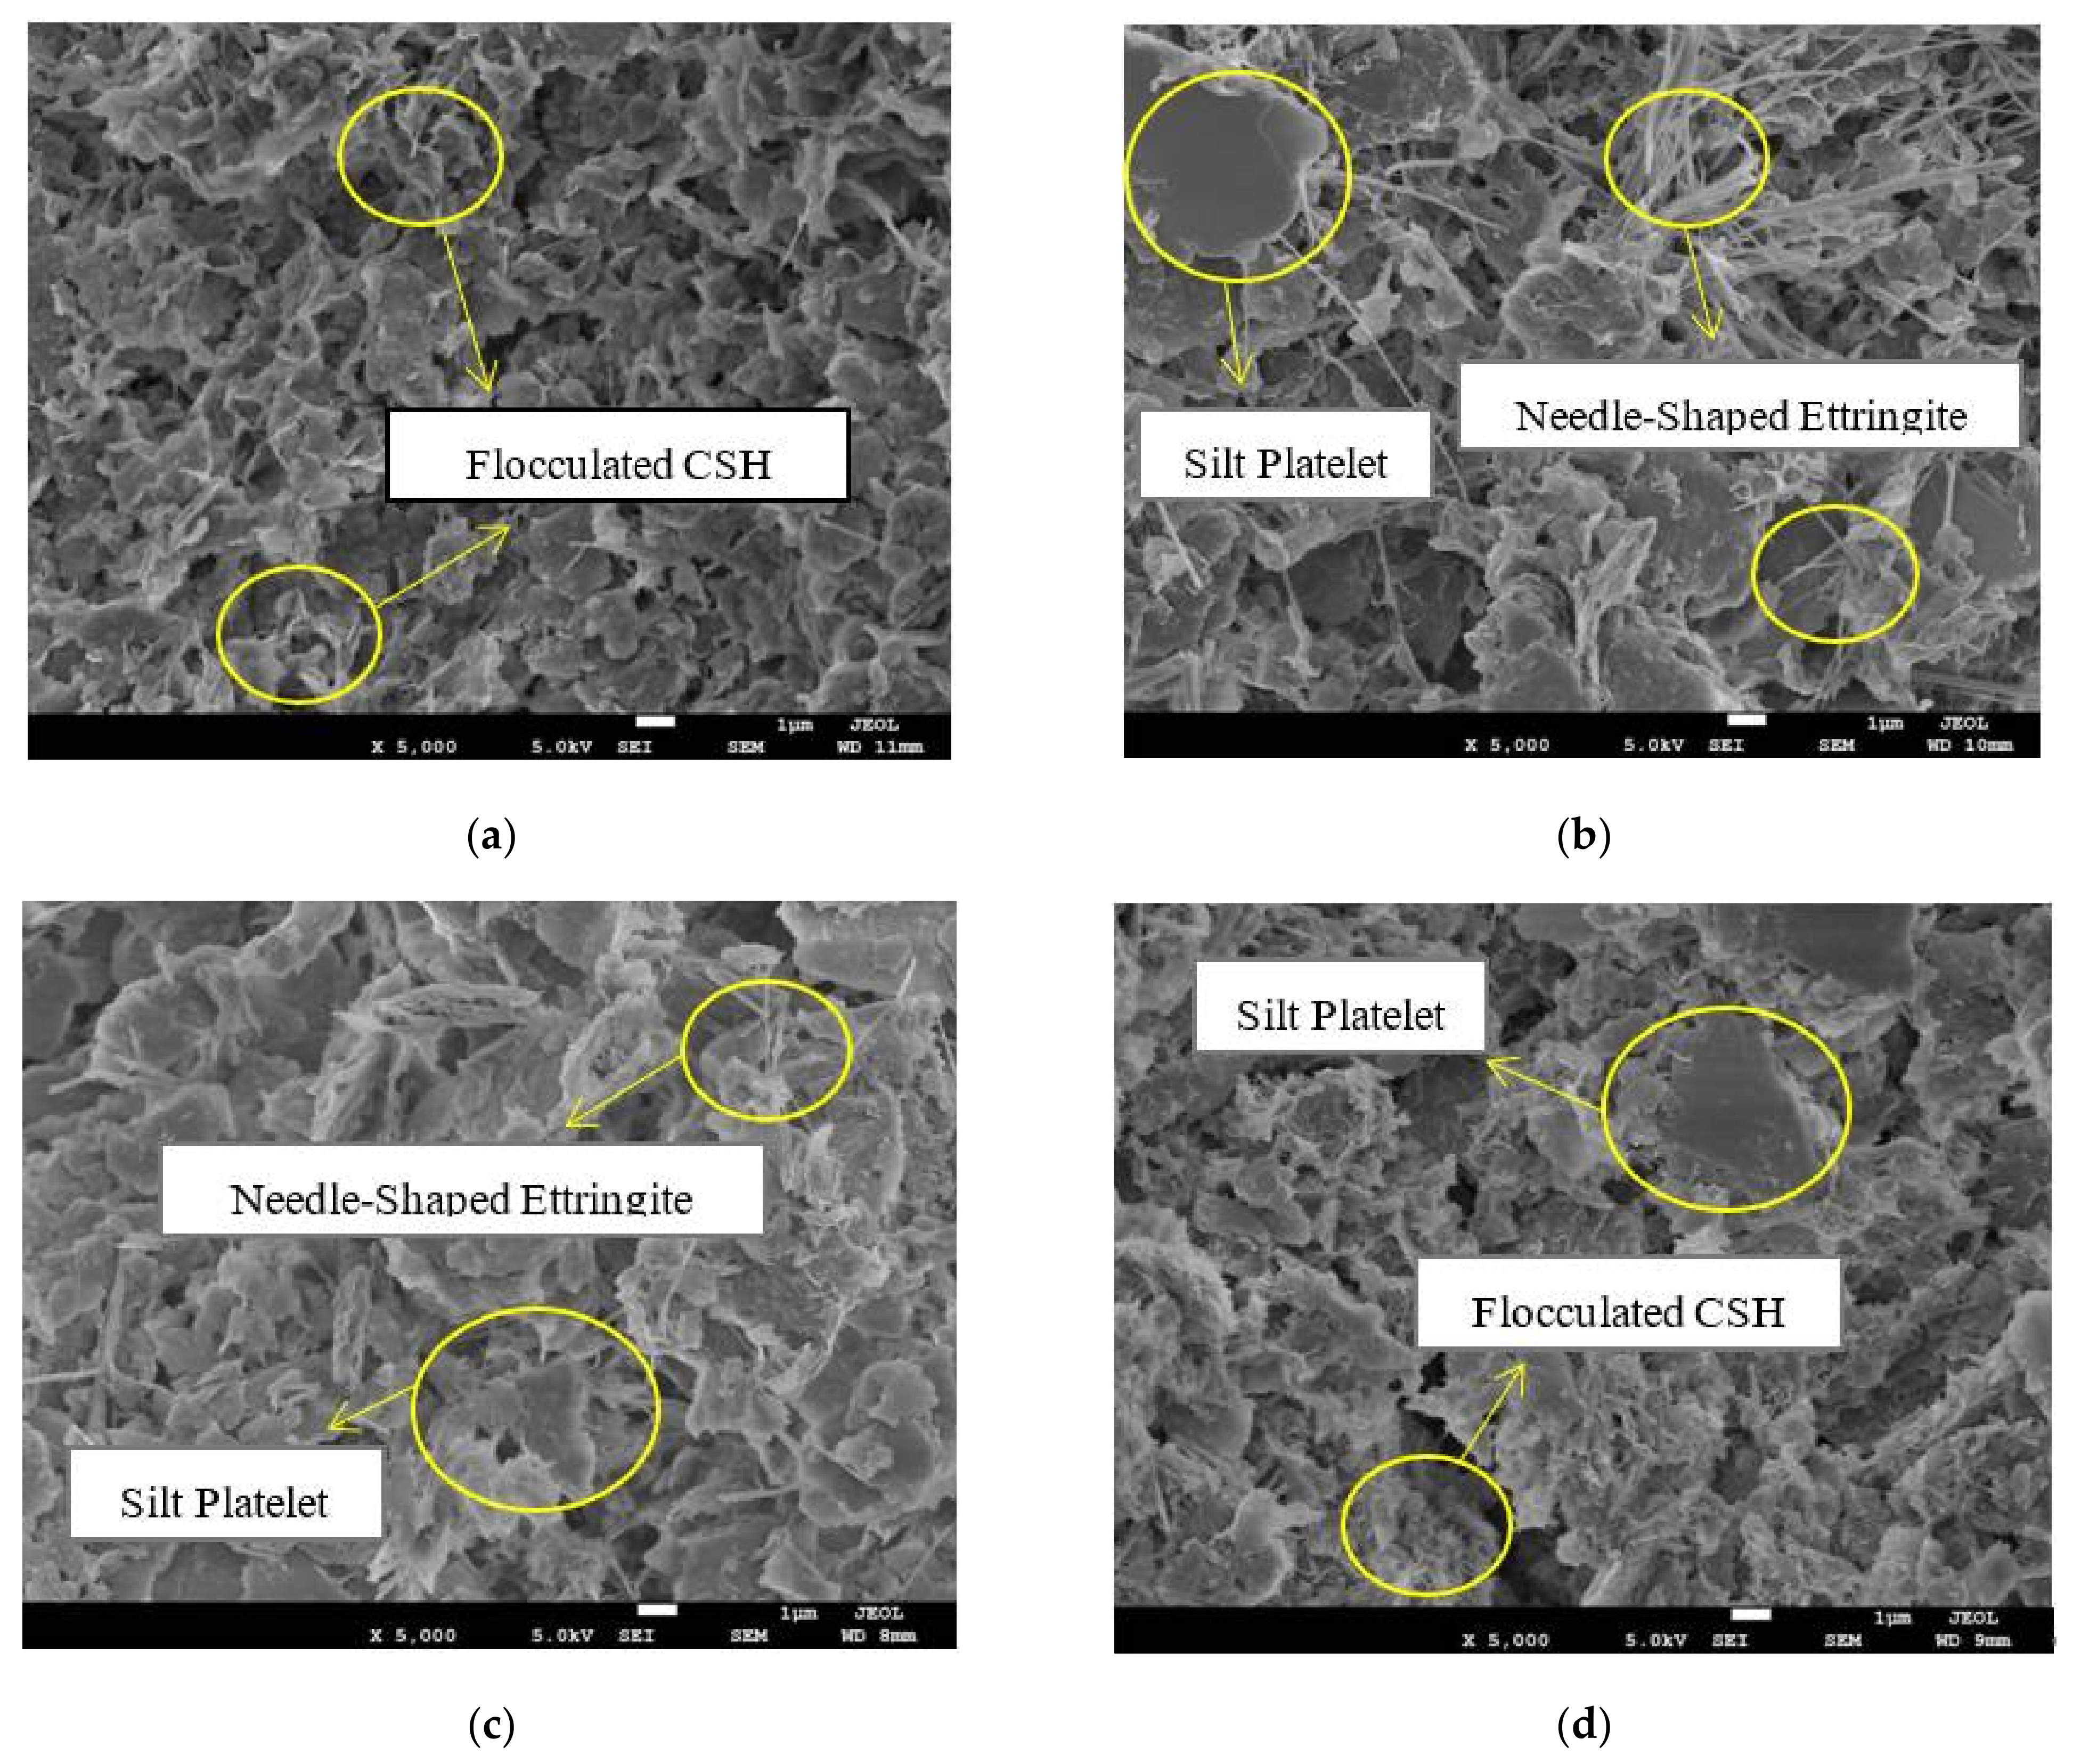
When the cement additive content is 20% (Figure 13a–c), the soil pores show an increasing trend, which is consistent with the trend of lower (10%) cement-stabilised soil. However, when the silt content is higher than 50% (Figure 13d), there is a significant increase in large pores, which can be attributed to the excessive number of large particles, because cement particles also have a larger size than clay particles. Thus, the strength gained from cementitious products can be partially countered by the pore size increment caused by excessive cement content, and that is the reason why this phenomenon did not perform at the 10% cement content. Thus, when the silt content exceeded the saturation point (50%), the excessive number of large particles lead to a substantial increase of large pores and the content of clay particles and formed hydration products are not sufficient to fully fill the pores, which resulted in a loose structure and lesser connections among particles. Once loaded, the soil particles and aggregates are prone to dislocation and sliding, resulting in the change of soil structure and reduction of soil strength. The aforementioned changes of microstructure are consistent with the tendency of UCS strength in Figure 10. Therefore, it can be concluded that the saturation point of silt content is approximately 50% when treated with 20% cement.
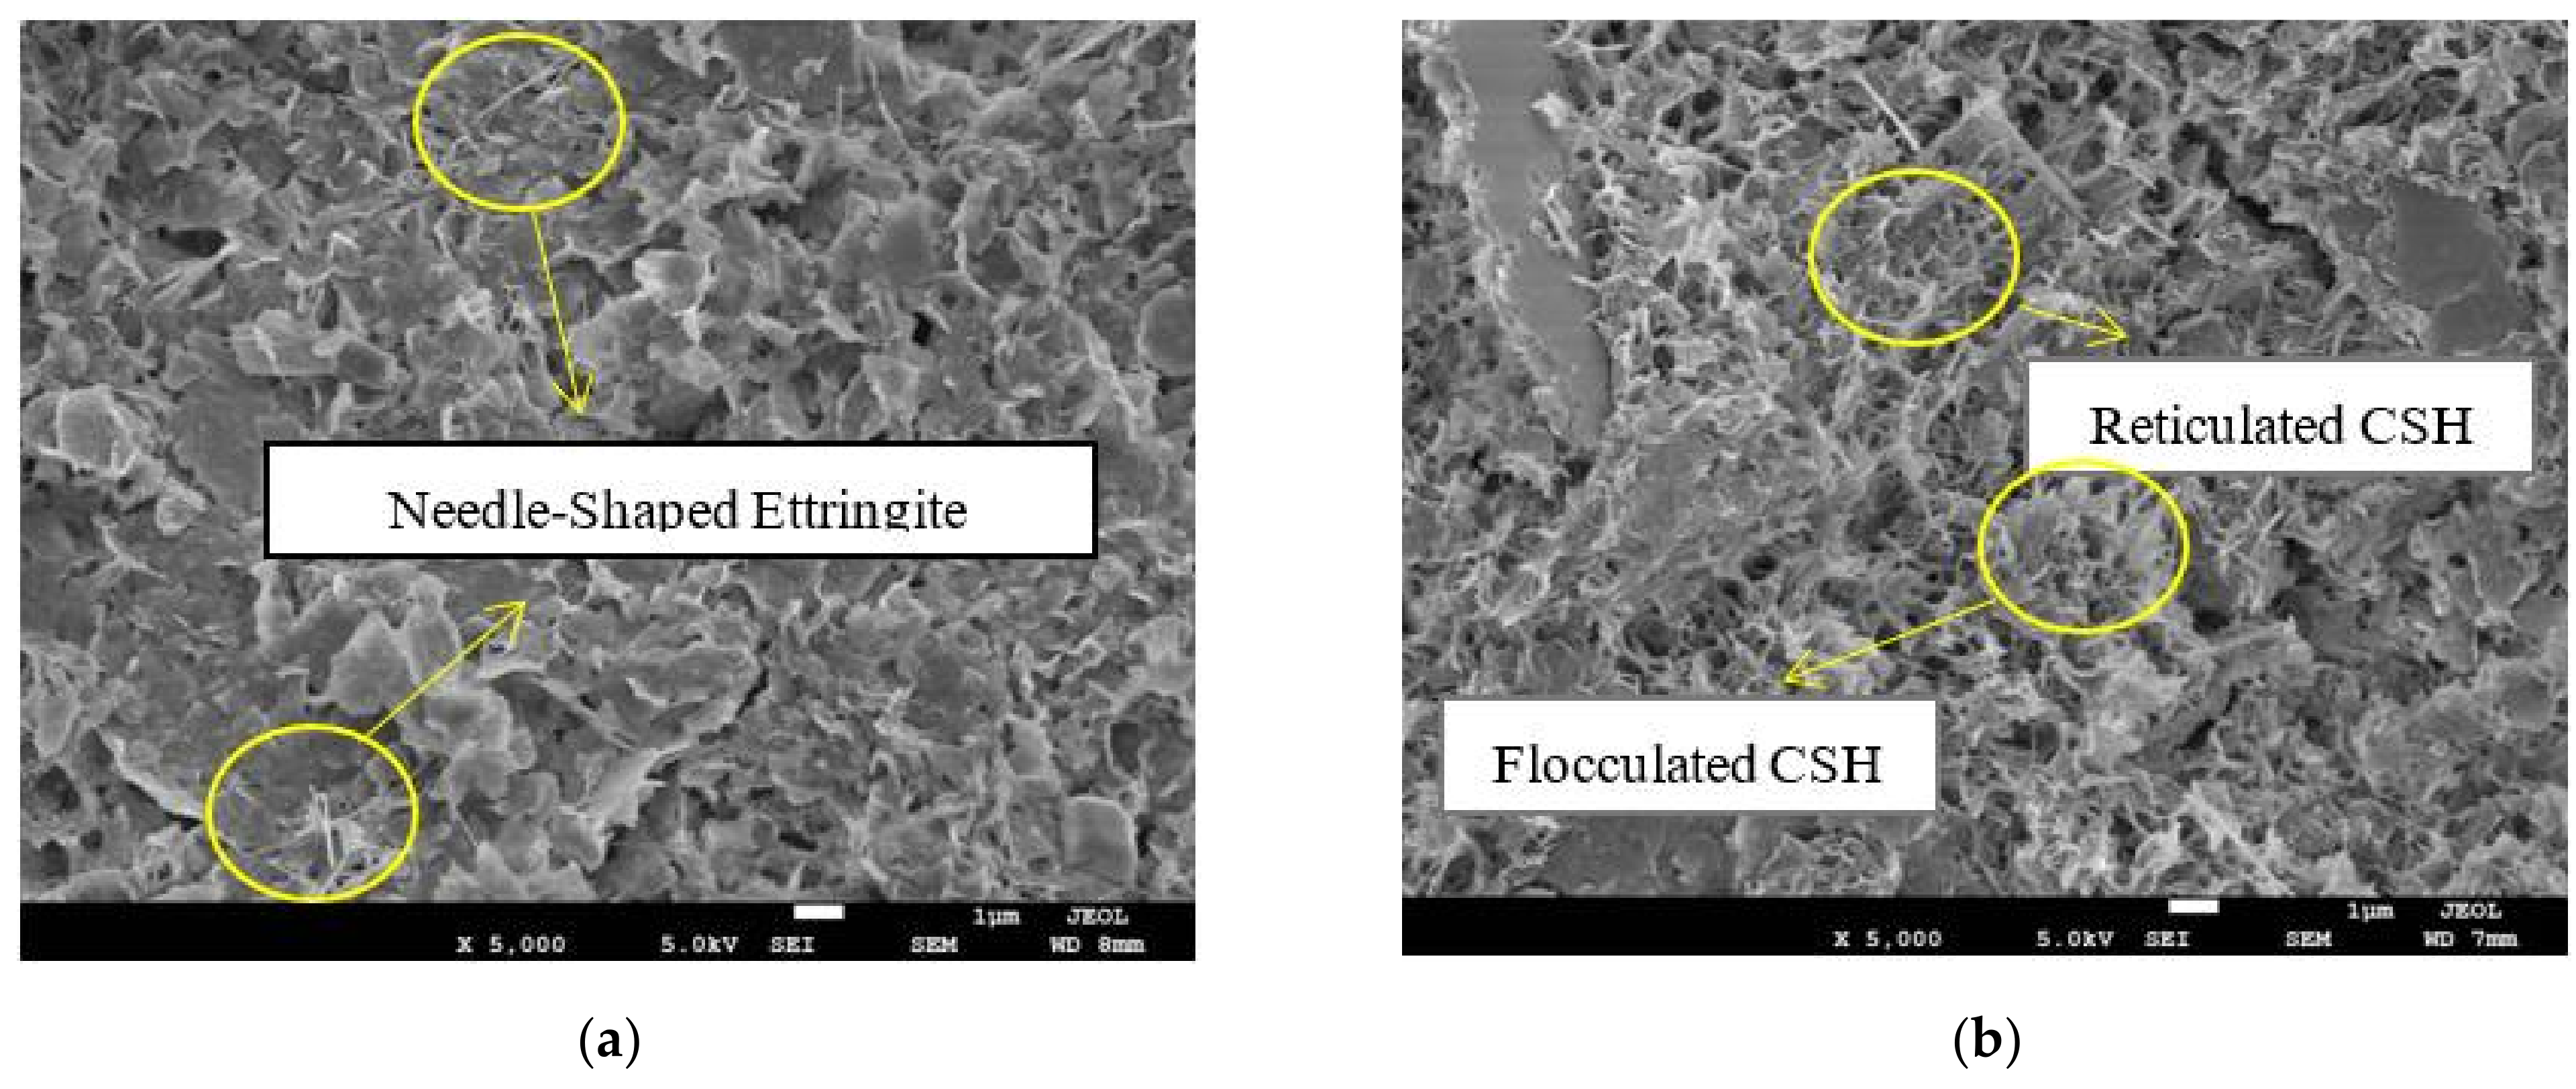
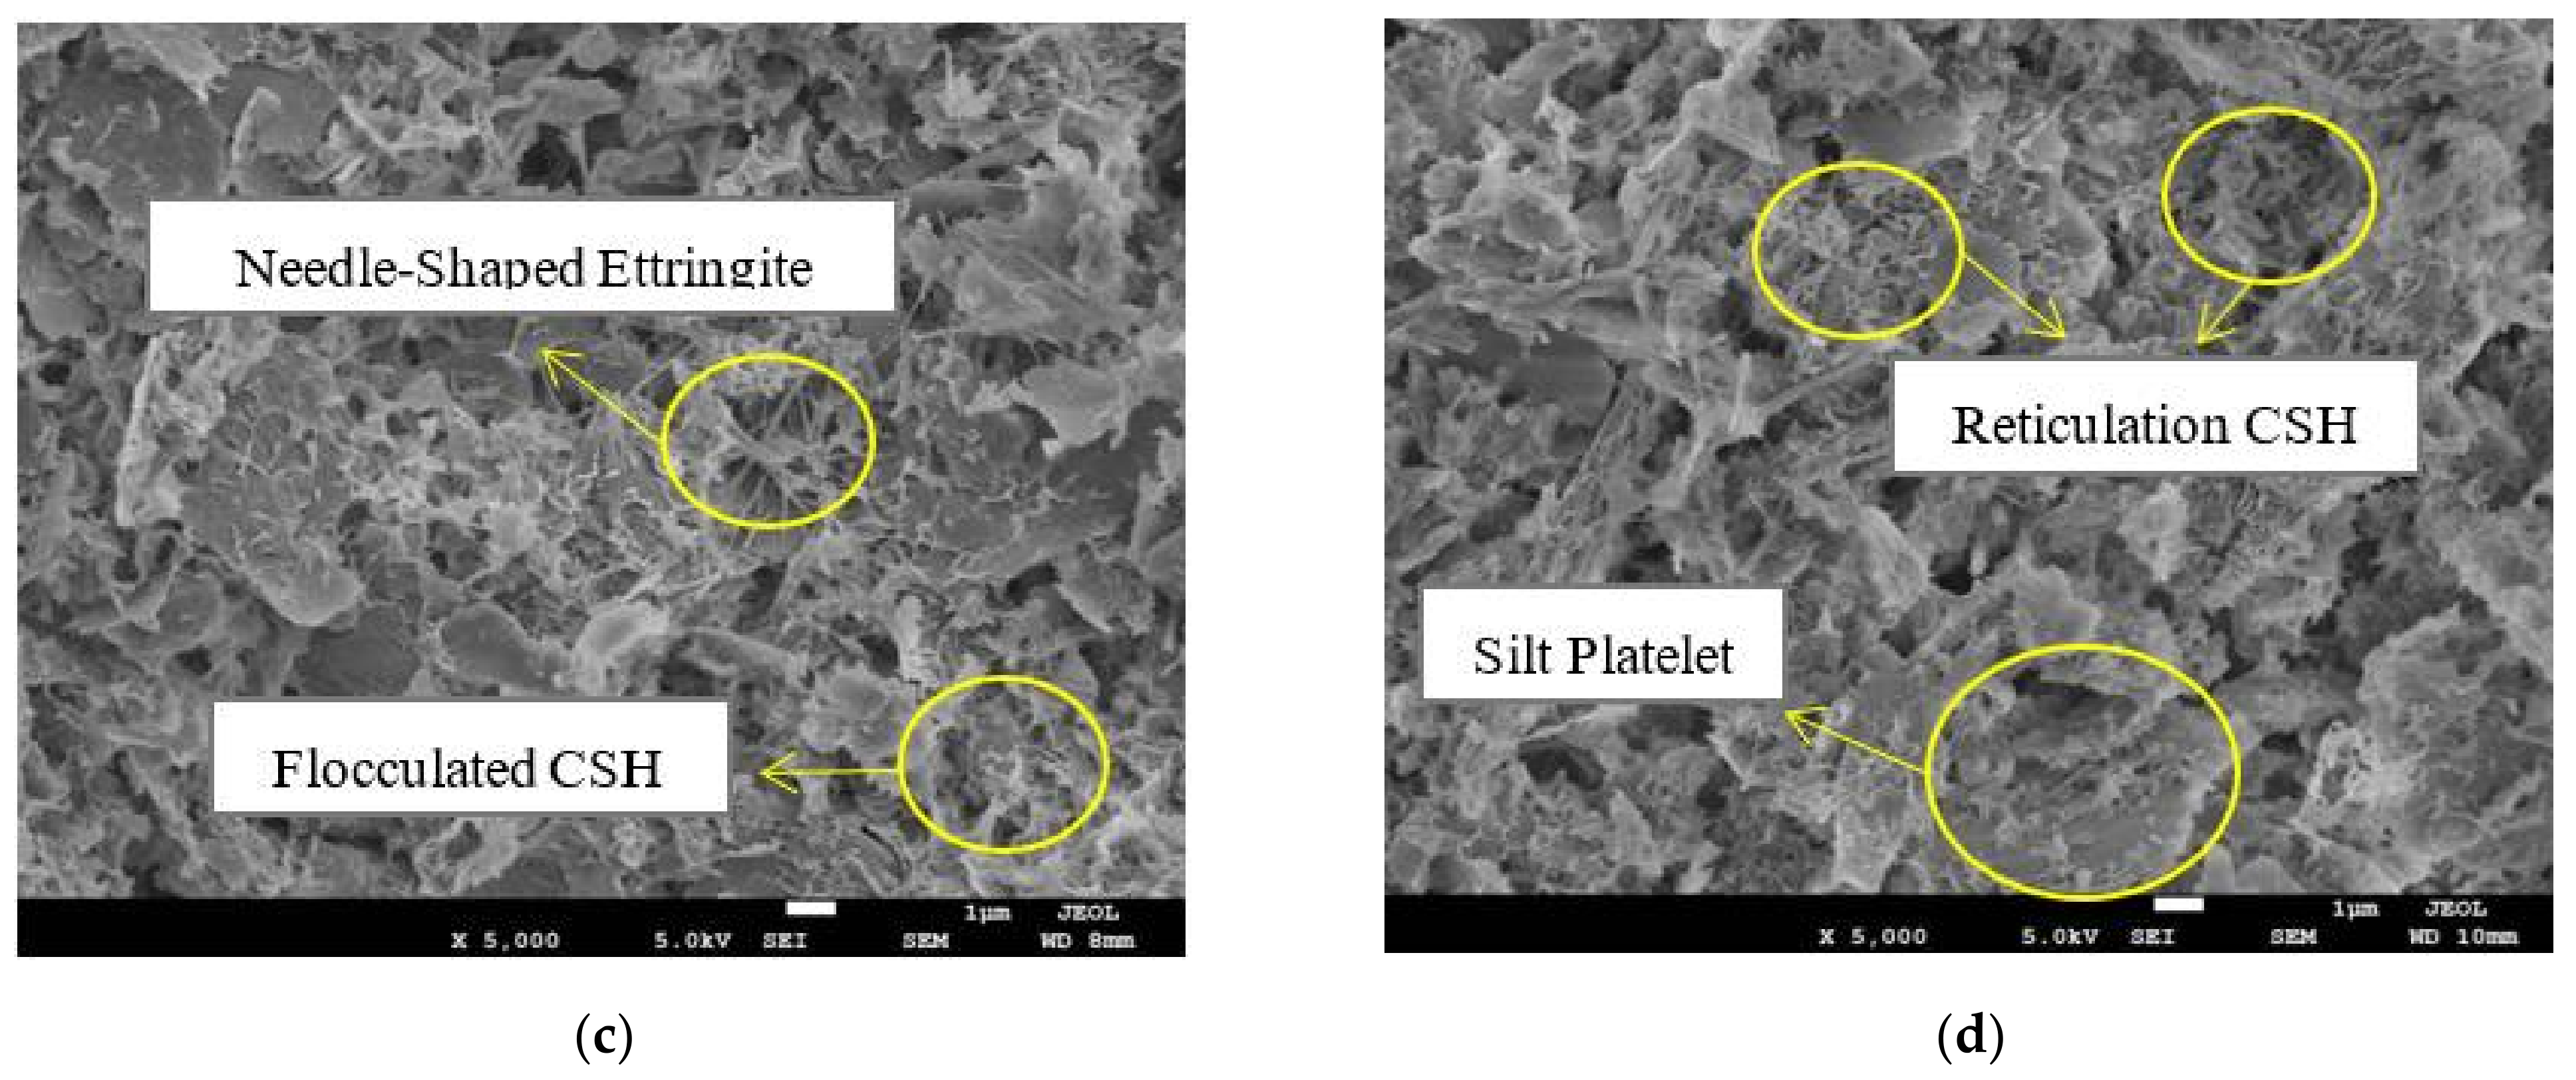
When the cement additive content is higher (30%), it can be seen from Figure 14a–d that the number of large pores increases with the increase of silt content due to the larger particle size. The large pores can lead to the decrease of the compactness of soil structure and can be easily dislocated and slide under compression. Meanwhile, it is shown that the cementitious products reduced with the increase of silt content because these cementitious materials are mainly produced by the reaction between cement and silica and alumina from clay particles. Therefore, the reduction of clay content impeded the hydration and pozzolanic reaction, resulting in the incomplete reaction of cement, which made the stabilization process imperfect. These changes in microstructure thus explains why the UCS strength continuously decreased with the increase of silt content at a high cement content (30%).
4. Conclusions
A series of triaxial compressive tests were conducted in this study for soft soils with varying silt contents and the effect of silt contents on the strength and critical state behaviours of soft soils were investigated. The empirical equations were proposed to evaluate the effect of silt content on the stress paths of reconstituted soft soils under consolidated isotropic undrained triaxial tests and also the critical state parameters. A further set of unconfined compression tests were conducted for each group of specimens stabilised by cement. As the silt content might exhibit different influence on the strength of cement- stabilised samples, a varying dosage of cement additives content were considered in this study. The experimental results indicate that silt content play a different role in soil stabilisation under different cement additive or replacement contents. The effect of cement additive content and silt content on the microstructure development of stabilised soils were also analysed by utilising the Scanning Electron Microscope (SEM) images. With the increase of cement dosage, the number of cementitious products, such as reticulated CSH and needle-shaped ettringite were notably increased, resulting in a denser structure. This can be attributed to the hydration of cement and the pozzolanic reactions.
As for the effect of silt content, since particle size plays a very important role in microstructure development, both cement and silt contents can dramatically affect the pore size distribution. When the cement additive content is lower than 10%, clay platelets can fill the pore spaces and the cementitious products can enhance the inter-cluster bond strength by aggregating clay and silt platelets together to form larger and denser aggregates responsible for the strength improvement. When the cement content is between 10% and 20%, the stabilised soil strengths increase with the increase of silt content and then decrease when silt contents are higher than 50%. This is because the strength gained from cementitious product enhancement was partially countered by the increment of pore size caused by the excessive cement and silt contents. When the cement content is higher than 20%, the strength shows a negative correlation with silt content, which can be attributed to the incomplete reaction of cement due to the reduction of clay content.
In general, any increase in the amount of cement will increase the improved soil strength (see Figure 11). However, in this study, it is very important for engineers to also realise that the increment of cement used in each cement replacement group in soils with appreciable silt percentage (see Figure 10) has a ‘saturation point’, after which any further increase in cement replacement content will not further increase the strength of the improved soil. The saturation points in this study were found to be (i) more than 50% silt for cement contents not exceeding 20% replacement, and (ii) regardless of silt content for cement contents exceeding 20% replacement. By knowing these important outcomes, engineers can reliably customise the soil-cement mix design for optimal strength outcomes given any type of fine-grained soils containing predominantly clay and silt particles.
It is acknowledged that there are other, more environmentally friendly binders than cement available for use, but this current manuscript only focuses on the use of cement. The authors’ future manuscripts will include the use of more environmentally friendly constituents, such as fly ash and/or enhanced additives.
Author Contributions
Conceptualisation: Y.L. and D.E.L.O.; Methodology: Y.L. and Z.L., Validation: E.O. and D.E.L.O.; Formal analysis, Y.L. and Z.L.; Investigation: Y.L. and Z.L.; Resources: Y.L. and Z.L.; Data curation, Y.L. and Z.L.; Writing—original draft preparation: Y.L. and Z.L.; Writing—review and editing, E.O. and D.E.L.O.; Visualization, Y.L. and Z.L.; Supervision: E.O. and D.E.L.O.; Project administration: E.O; Funding acquisition: E.O. All authors have read and agreed to the published version of the manuscript.
Funding
This research received no external funding.
Institutional Review Board Statement
Not applicable.
Informed Consent Statement
Not applicable.
Data Availability Statement
The original experimental data are available on request from the corresponding author.
Acknowledgments
The soft soil collection in this work was supported by the Port of Brisbane Pty Ltd. The SEM images were acquired by use of the Central Analytical Research Facility hosted by the Institute for Future Environments at QUT.
Conflicts of Interest
The authors declare no conflict of interest.
References
- Leong, H.Y.; Ong, D.E.L.; Sanjayan, J.G.; Nazari, A. A genetic programming predictive model for parametric study of factors affecting strength of geopolymers. RSC Adv. 2015, 5, 85630–85639. [Google Scholar] [CrossRef]
- Leong, H.Y.; Ong, D.E.L.; Sanjayan, J.G.; Nazari, A. The Effect of Different Na2O and K2O Ratios of Alkali Activator on Compressive Strength of Fly Ash Based-geopolymer. Constr. Build. Mater. 2016, 106, 500–511. [Google Scholar] [CrossRef] [Green Version]
- Leong, H.Y.; Ong, D.E.L.; Sanjayan, J.G.; Nazari, A. Strength Development of Soil-Fly Ash Geopolymer: Assessment of Soil, Fly Ash, Alkali Activators, and Water. J. Mater. Civ. Eng. 2018, 30. [Google Scholar] [CrossRef] [Green Version]
- Leong, H.Y.; Ong, D.E.L.; Sanjayan, J.G.; Nazari, A.; Kueh, S.M. Effects of Significant Variables on Compressive Strength of Soil-Fly Ash Geopolymer: Variable Analytical Approach Based on Neural Networks and Genetic Programming. J. Mater. Civ. Eng. 2018, 30. [Google Scholar] [CrossRef] [Green Version]
- Leong, H.Y.; Ong, D.E.L.; Sanjayan, J.G.; Nazari, A. Suitability of Sarawak and Gladstone Fly Ash to Produce Geopolymers: A Physical, Chemical, Mechanical, Mineralogical and Microstructural Analysis. Ceram. Int. 2016, 42, 9613–9620. [Google Scholar] [CrossRef] [Green Version]
- Ngu, L.H.; Song, J.W.; Hashim, S.S.; Ong, D.E.L. Lab-scale atmospheric CO2 absorption for calcium carbonate precipitation in sand Greenhouse Gases. Sci. Technol. 2019, 9, 519–528. [Google Scholar]
- Mehdizadeh, A.; Disfani, M.M.; Evans, R.; Arulrajah, A.; Ong, D.E.L. Discussion of ‘Development of an Internal Camera-Based Volume Determination System for Triaxial Testing’ by S. E. Salazar, A. Barnes, and R. A. Coffman. Geotech. Test. J. 2016, 39, 165–168. [Google Scholar]
- Mehdizadeh, A.; Disfani, M.M.; Evans, R.; Arulrajah, A.; Ong, D.E.L. Mechanical Consequences of Suffusion on Undrained Behaviour of a Gap-graded Cohesionless Soil—An Experimental Approach. Geotech. Test. J. 2017, 40, 1026–1042. [Google Scholar] [CrossRef] [Green Version]
- Ong, D.E.L.; Yang, D.Q.; Phang, S.K. Comparison of finite element modelling of a deep excavation using SAGE-CRISP and PLAXIS. In Proceedings of the International Conference on Deep Excavations, Singapore, 28–30 June 2006; pp. 51–64. [Google Scholar]
- Pham, V.N.; Ong, D.E.L.; Oh, O. Prediction of unconfined compressive strength of cement-stabilized sandy soil in Vietnam using artificial neural networks (ANNs) model. Int. J. Geotech. Eng. 2021. [Google Scholar] [CrossRef]
- Omoregie, A.I.; Senian, N.; Li, P.Y.; Hei, N.L.; Ong, D.E.L.; Ginjom, I.R.H.; Nissom, P.M. Ureolytic bacteria isolated from Sarawak limestone caves show high urease enzyme activity comparable to that of Sporosarcina pasteurii (DSM33). Malays. J. Microbiol. 2016, 12, 463–470. [Google Scholar]
- Omoregie, A.I.; Khoshdelnezamiha, G.; Senian, N.; Ong, D.E.L.; Nissom, P.M. Experimental Optimisation of Various Cultural Conditions on Urease Activity for Isolated Sporosarcina Pasteurii Strains and Evaluation of Their Biocement Potentials. Ecol. Eng. 2017, 109, 65–75. [Google Scholar] [CrossRef] [Green Version]
- Omoregie, A.I.; Ngu, L.H.; Ong, D.E.L.; Nissom, P.M. Low-cost cultivation of Sporosarcina pasteurii strain in food-grade yeast extract medium for microbially induced carbonate precipitation (MICP) application. Biocatal. Agric. Biotechnol. 2019, 17, 247–255. [Google Scholar] [CrossRef] [Green Version]
- Omoregie, A.I.; Palombo, E.A.; Ong, D.E.L.; Nissom, P.M. Biocementation of sand by Sporosarcina pasteurii strain and technical-grade cementation reagents through surface percolation treatment method. Constr. Build. Mater. 2019, 228, 116828. [Google Scholar] [CrossRef]
- Omoregie, A.I.; Ong, D.E.L.; Nissom, P.M. Assessing ureolytic bacteria with calcifying abilities isolated from limestone caves for biocalcification. Lett. Appl. Microbiol. 2019, 68, 173–181. [Google Scholar] [CrossRef] [Green Version]
- Omoregie, A.I.; Palombo, E.A.; Ong, D.E.L.; Nissom, P.M. A feasible scale-up production of Sporosarcina pasteurii using custom-built stirred tank reactor for in-situ soil biocementation. Biocatal. Agric. Biotechnol. 2020, 24, 101544. [Google Scholar] [CrossRef]
- Ong, D.E.L.; Sim, Y.S.; Leung, C.F. Performance of Field and Numerical Back-Analysis of Floating Stone Columns in Soft Clay Considering the Influence of Dilatancy. Int. J. Geomech. 2018, 18. [Google Scholar] [CrossRef] [Green Version]
- Ong, D.E.L.; Leung, C.F.; Chow, Y.K. Time-dependent pile behaviour due to excavation-induced soil movement in clay. In Proceedings of the 12th Pan-American Conference on Soil Mechanics and Geotechnical Engineering, Boston, MA, USA, 22–26 June 2003; Massachusetts Institute of Technology: Cambridge, MA, USA, 2003; Volume 2, pp. 2035–2040. [Google Scholar]
- Ong, D.E.L.; Leung, C.F.; Chow, Y.K. Piles subject to excavation-induced soil movement in clay. In Proceedings of the 13th European Conference on Soil Mechanics and Geotechnical Engineering, Prague, Czech Republic, 1 January 2003; Volume 2, pp. 777–782. [Google Scholar]
- Chong, E.E.M.; Ong, D.E.L. Data-Driven Field Observational Method of a Contiguous Bored Pile Wall System Affected by Accidental Groundwater Drawdown. Geosciences 2020, 10, 268. [Google Scholar] [CrossRef]
- Ong, D.E.L.; Choo, C.S. Sustainable Bored Pile Construction in Erratic Phyllite. In Proceedings of the ASEAN-Australian Engineering Congress, Kuching, Malaysia, 14–16 July 2011; pp. 30–45, ISBN 78-967-10485. [Google Scholar]
- Ong, D.E.L.; Leung, C.F.; Chow, Y.K.; Ng, T.G. Severe Damage of a Pile Group due to Slope Failure. J. Geotech. Geoenviron. Eng. 2015, 141. [Google Scholar] [CrossRef] [Green Version]
- Liu, Z.; Liu, Y.; Bolton, M.; Ong, D.E.L.; Oh, E. Effect of Cement and Bentonite Mixture on The Consolidation Behavior of Soft Estuarine Soils. Int. J. Geomate 2020, 18, 49–54. [Google Scholar] [CrossRef]
- Sun, J.; Oh, E.; Ong, D.E.L. Influence of Degree of Saturation (DOS) on Dynamic Behavior of Unbound Granular Materials. Geosciences 2021, 11, 89. [Google Scholar] [CrossRef]
- Peerun, M.I.; Ong, D.E.L.; Choo, C.S. Interpretation of geomaterial behavior during shearing aided by PIV technology. J. Mater. Civ. Eng. 2019, 31. [Google Scholar] [CrossRef] [Green Version]
- Peerun, M.I.; Ong, D.E.L.; Choo, C.S.; Cheng, W.C. Effect of interparticle behavior on the development of soil arching in soil-structure interaction. Tunn. Undergr. Space Technol. 2020, 106, 103610. [Google Scholar] [CrossRef]
- Cheng, W.C.; Li, G.; Ong, D.E.L.; Chen, S.L.; Ni, J.C. Modelling liner forces response to very close-proximity tunnelling in soft alluvial deposits. Tunn. Undergr. Space Technol. 2020, 103, 103455. [Google Scholar] [CrossRef]
- Cheng, W.C.; Li, G.; Ong, D.E.L. Lubrication characteristics of pipejacking in soft alluvial deposit. Geotech. Asp. Undergr. Constr. Soft Ground 2021. [Google Scholar] [CrossRef]
- Kang, G.; Tsuchida, T.; Athapaththu, A.M.R.G. Strength mobilization of cement-treated dredged clay during the early stages of curing. Soils Found. 2015, 55, 375–392. [Google Scholar] [CrossRef] [Green Version]
- Liu, Y.; Jiang, Y.; Xiao, H.; Lee, F.H. Determination of representative strength of deep cement-mixed clay from core strength data. Geotechnique 2017, 67, 350–364. [Google Scholar] [CrossRef]
- Yao, K.; Pan, Y.; Jia, L.; Yi, J.T.; Hu, J.; Wu, C. Strength evaluation of marine clay stabilized by cementitious binder. Mar. Georesour. Geotechnol. 2020, 38, 730–743. [Google Scholar] [CrossRef]
- Oh, E. Geotechnical and Ground Improvement Aspects of Motorway Embankments in Soft Clay. Ph.D. Thesis, Griffith University, Southeast Queensland, Australia, 2007. Available online: http://hdl.handle.net/10072/367085 (accessed on 14 May 2021).
- Wei, X.; Yang, J. A critical state constitutive model for clean and silty sand. Acta Geotech. 2019, 14, 329–345. [Google Scholar] [CrossRef]
- Mitchell, J.K.; Soga, K. Fundamentals of Soil Behavior, 3rd ed.; John Wiley & Sons: New York, NY, USA, 2005. [Google Scholar]
- Yin, J.H. Stress-strain strength characteristics of a marine soil with different clay contents. Geotech. Test. J. 2002, 25, 459–462. [Google Scholar]
- Wong, S.T.; Ong, D.E.L.; Robinson, R.G. Behaviour of MH silts with varying plasticity indices. Geotech. Res. 2017, 4, 118–135. [Google Scholar] [CrossRef] [Green Version]
- Ekinci, A. Effect of preparation methods on strength and microstructural properties of cemented marine clay. Constr. Build. Mater. 2019, 227, 116690. [Google Scholar] [CrossRef]
- Liu, S.Y.; Zhang, D.W.; Liu, Z.B.; Deng, Y.F. Assessment of unconfined compressive strength of cement stabilized marine clay. Mar. Georesour. Geotechnol. 2019, 26, 19–35. [Google Scholar] [CrossRef]
- Horpibulsuk, S.; Rachan, R.; Suddeepong, A. Assessment of strength development in blended cement admixed Bangkok clay. Constr. Build. Mater. 2011, 25, 1521–1531. [Google Scholar] [CrossRef]
- Ma, C.; Chen, L.; Chen, B. Analysis of strength development in soft clay stabilized with cement-based stabilizer. Constr. Build. Mater. 2014, 71, 354–362. [Google Scholar]
- Kwan, P.S.; Bouazza, A.; Fletcher, P.; Ranjith, P.G.; Oh, E.Y.; Shuttlewood, K.; Bolton, M. Behaviour of cement treated Melbourne and Southeast Queensland soft clays in deep stabilization works. In Proceedings of the International Conference Deep Mixing Best Practice and Recent Advances, Stockholm, Sweden, 23–25 May 2005. [Google Scholar]
- Uddin, K.; Balasubramaniam, A.S.; Bergado, D.T. Engineering behavior of cement-treated Bangkok soft clay. Geotech. Eng. 1997, 28, 89–119. [Google Scholar]
- Kang, G.; Tsuchida, T.; Athapaththu, A.M.R.G. Engineering behavior of cement-treated marine dredged clay during early and later stages of curing. Eng. Geol. 2016, 209, 163–174. [Google Scholar] [CrossRef]
- Kang, G.O.; Tsuchida, T.; Kim, Y.S. Strength and stiffness of cement-treated marine dredged clay at various curing stages. Constr. Build. Mater. 2017, 132, 71–84. [Google Scholar] [CrossRef]
- Lee, F.H.; Lee, Y.; Chew, S.H.; Yong, K.Y. Strength and modulus of marine clay-cement mixes. J. Geotech. Geoenviron. Eng. 2005, 131, 178–186. [Google Scholar] [CrossRef]
- Jauberthie, R.; Rendell, F.; Rangeard, D.; Molez, L. Stabilisation of estuarine silt with lime and/or cement. Appl. Clay Sci. 2010, 50, 395–400. [Google Scholar] [CrossRef]
- Zhang, X.; Zhu, Z. Microscopic Mechanism of Cement Improving the Strength of Lime-Fly Ash-Stabilized Yellow River Alluvial Silt. Adv. Civ. Eng. 2020, 2020, 9649280. [Google Scholar]
- Lo, S.R.; Wardani, S.P. Strength and dilatancy of a silt stabilized by a cement and fly ash mixture. Can. Geotech. J. 2002, 39, 77–89. [Google Scholar] [CrossRef]
- Lehane, B.M. Vertically loaded shallow foundation on soft clayey silt. Proc. Inst. Civ. Eng. Geotech. Eng. 2003, 156, 17–26. [Google Scholar] [CrossRef]
- Kelln, C.; Sharma, J.; Hughes, D.; Graham, J. Finite element analysis of an embankment on a soft estuarine deposit using an elastic–viscoplastic soil model. Can. Geotech. J. 2009, 46, 357–368. [Google Scholar] [CrossRef]
- Ferreira, P.M.V.; Bica, A.V.D. Problems in identifying the effects of structure and critical state in a soil with a transitional behaviour. Géotechnique 2006, 56, 445–454. [Google Scholar] [CrossRef]
- Nocilla, A.; Coop, M.R.; Colleselli, F. The mechanics of an Italian silt: An example of ‘transitional’ behaviour. Géotechnique 2006, 56, 261–271. [Google Scholar] [CrossRef]
- Horpibulsuk, S.; Miura, N.; Nagaraj, T.S. Clay–water∕cement ratio identity for cement admixed soft clays. J. Geotech. Geoenviron. Eng. 2005, 131, 187–192. [Google Scholar] [CrossRef]
- Zhang, D.; Fan, L.; Liu, S.; Deng, Y. Experimental Investigation of Unconfined Compression Strength and Stiffness of Cement Treated Salt-Rich Clay. Mar. Georesour. Geotechnol. 2013, 31, 360–374. [Google Scholar]
- Yun, J.M.; Song, Y.S.; Lee, J.H.; Kim, T.H. Strength Characteristics of the Cement-Stabilized Surface Layer in Dredged and Reclaimed Marine Clay, Korea. Mar. Georesour. Geotechnol. 2006, 24, 29–45. [Google Scholar] [CrossRef]
- Liu, L.; Zhou, A.; Deng, Y.; Cui, Y.; Yu, Z.; Yu, C. Strength performance of cement/slag-based stabilized soft clays. Constr. Build. Mater. 2019, 211, 909–918. [Google Scholar] [CrossRef]
- Terzaghi, K. Erdbaumechanik Auf Bodenphysikalischer Grundlage; Tokiwa Shoin: Chiyoda, Tokyo, 1925. [Google Scholar]
- Zhang, X.; Zhu, Z. Study on the Relationship between Microstructure and Strength of Stabilized/Solidified Silt. Int. J. Struct. Civ. Eng. Res. 2018, 7, 65–71. [Google Scholar] [CrossRef]
- Wijeyakulasuriya, V.; Hobbs, G.; Brandon, A. Some experiences with performance monitoring of embankments on soft clays. In Proceedings of the 8th Australia New Zealand Conference on Geomechanics, Hobart, Australia, 1 January 1999; Institution of Engineers Australia: Barton, Australia, 1999; pp. 783–788. [Google Scholar]
- Yin, J.; Miao, Y.H. An oedometer-based method for preparing reconstituted clay samples. Appl. Mech. Mater. 2015, 719, 193–196. [Google Scholar] [CrossRef]
- Allman, M.A.; Atkinson, J.H. Mechanical properties of reconstituted Bothkennar soil. Géotechnique 1992, 42, 289–301. [Google Scholar] [CrossRef]
- Burland, J.B. On the compressibility and shear strength of natural clays. Géotechnique 1990, 40, 329–378. [Google Scholar] [CrossRef]
- Karstunen, M.; Koskinen, M. Plastic anisotropy of soft reconstituted clays. Can. Geotech. J. 2008, 45, 314–328. [Google Scholar] [CrossRef] [Green Version]
- Hyodo, M.; Tanimizu, H.; Yasufuku, N.; Murata, H. Undrained cyclic and monotonic triaxial behaviour of saturated loose sand. Soils Found. 1994, 34, 19–32. [Google Scholar] [CrossRef] [Green Version]
- Head, K.H. Manual of Soil Laboratory Testing; Effective stress tests; John Wiley & Sons: Singapore, 1980; Volume 3. [Google Scholar]
- ASTM. D2166/D2166M—16 Standard Test Method for Unconfined Compressive Strength of Cohesive Soil; ASTM: Conshohocken, PA, USA, 2000. [Google Scholar]
- Wang, S.; Luna, R. Monotonic behavior of Mississippi River Valley silt in triaxial compression. J. Geotech. Geoenviron. Eng. 2012, 138, 516–525. [Google Scholar] [CrossRef]
- Horpibulsuk, S.; Rachan, R.; Chinkulkijniwat, A.; Raksachon, Y.; Suddeepong, A. Analysis of strength development in cement-stabilized silty clay from microstructural considerations. Constr. Build. Mater. 2010, 24, 2011–2021. [Google Scholar] [CrossRef]
- Bolton, M. Soil Improvement Using Optimised Cementitous Materilas Design. Ph.D. Thesis, Griffith University, Southeast Queensland, Australia, 2014. Available online: http://hdl.handle.net/10072/365243 (accessed on 12 May 2021).
- Kamruzzaman, A.H.M.; Chew, S.H.; Lee, F.H. Microstructure of cement-treated Singapore marine clay. Proc. Inst. Civ. Eng. Ground Improv. 2006, 10, 113–123. [Google Scholar] [CrossRef]
Figure 1.
SEM images of soils and cement used in this study (a) Port of Brisbane soft soil; (b) Kaolin Soil (KM25); (c) Ordinary Portland Cement (300 times magnification).
Figure 1.
SEM images of soils and cement used in this study (a) Port of Brisbane soft soil; (b) Kaolin Soil (KM25); (c) Ordinary Portland Cement (300 times magnification).


Figure 2.
Some soft soil specimens for consolidated undrained triaxial testing: (a) S1—100% PoB soft soil; (b)S2—75% PoB soft soil + 25% kaolin soil; (c) S3—50% PoB soft soil + 50% kaolin soil; (d) S4—25% PoB soft soil + 75% kaolin soil; and (e) S5—100% kaolin soil.
Figure 2.
Some soft soil specimens for consolidated undrained triaxial testing: (a) S1—100% PoB soft soil; (b)S2—75% PoB soft soil + 25% kaolin soil; (c) S3—50% PoB soft soil + 50% kaolin soil; (d) S4—25% PoB soft soil + 75% kaolin soil; and (e) S5—100% kaolin soil.

Figure 3.
Examples of some cement-stabilised specimens for unconfined compressive strength tests, Port of Brisbane Soft Soil + 5, 10, 15, 20, 25, and 30% cement, respectively.
Figure 3.
Examples of some cement-stabilised specimens for unconfined compressive strength tests, Port of Brisbane Soft Soil + 5, 10, 15, 20, 25, and 30% cement, respectively.

Figure 4.
Effective stress paths for different confining pressures with varying silt contents (S1 represents 100% PoB soft soil; S2 represents 75% PoB soft soil + 25% kaolin soil; S3 represents 50% PoB soft soil + 50% kaolin soil, S4 represents 25% PoB soft soil + 75% kaolin soil; and S5 represents 100% kaolin soil; while 50,100, and 200 refer to the confining pressure.).

Figure 5.
Excess pore pressure versus axial strain with different confining pressures for different silt contents. (S1 represents 100% PoB soft soil; S2 represents 75% PoB soft soil + 25% kaolin soil; S3 represents 50% PoB soft soil + 50% kaolin soil, S4 represents 25% PoB soft soil + 75% kaolin soil; and S5 represents 100% kaolin soil; while 50, 100, and 200 refer to the confining pressure.).

Figure 6.
Deviator stress versus axial strain with different confining pressures for different silt contents. (S1 represents 100% PoB soft soil; S2 represents 75% PoB soft soil + 25% kaolin soil; S3 represents 50% PoB soft soil + 50% kaolin soil, S4 represents 25% PoB soft soil + 75% kaolin soil; and S5 represents 100% kaolin soil; while 50, 100, and 200 refer to the confining pressure.).

Figure 7.
CSLs of the specimens at different confining pressures with varying kaolin contents. The dotted-point lines represent the best fitted critical state line for each group of soil.
Figure 7.
CSLs of the specimens at different confining pressures with varying kaolin contents. The dotted-point lines represent the best fitted critical state line for each group of soil.

Figure 8.
Correlation between effective internal friction angle and silt content.

Figure 9.
V-lnp relationship on a semi-logarithmic scale.

Figure 10.
Correlation between Unconfined Compressive Strength (UCS) and silt content.

Figure 11.
Correlation between Unconfined Compressive Strength (UCS) and cement content.

Figure 12.
SEM images of specimen treated by 10% cement with different silt contents: (a) S1 + 10% cement, (b) S2 + 10% cement, (c) S3 + 10% cement, (d) S4 + 10% cement.
Figure 12.
SEM images of specimen treated by 10% cement with different silt contents: (a) S1 + 10% cement, (b) S2 + 10% cement, (c) S3 + 10% cement, (d) S4 + 10% cement.

Figure 13.
SEM images of specimen treated by 20% cement with different silt contents: (a) S1 + 20% cement, (b) S2 + 20% cement, (c) S3 + 20% cement, (d) S4 + 20% cement.
Figure 13.
SEM images of specimen treated by 20% cement with different silt contents: (a) S1 + 20% cement, (b) S2 + 20% cement, (c) S3 + 20% cement, (d) S4 + 20% cement.

Figure 14.
SEM images of specimen treated by 30% cement with different silt contents: (a) S1 + 30% cement, (b) S2 + 30% cement, (c) S3 + 30% cement, (d) S4 + 30% cement.
Figure 14.
SEM images of specimen treated by 30% cement with different silt contents: (a) S1 + 30% cement, (b) S2 + 30% cement, (c) S3 + 30% cement, (d) S4 + 30% cement.


Table 1.
Basic properties of the soils.
| Soils | Clay (%) | Silt (%) | Sand (%) | LL (%) | PL (%) | PI (%) |
|---|---|---|---|---|---|---|
| Port of Brisbane soft soil | 79.8 | 18.2 | 2.0 | 91.6 | 36.7 | 54.9 |
| Kaolin soil | 19.5 | 79.6 | 0.9 | 59.2 | 48.1 | 11.1 |
Table 2.
Chemical composition of the materials.
| Oxide | PoB Soft Soil (%) | Kaolin Soil (%) | Cement (%) |
|---|---|---|---|
| LOI | 14.84 | 11.81 | 2.42 |
| Fe2O3 | 8.48 | 1.38 | 3.20 |
| CaO | 1.44 | - | 65.21 |
| K2O | 1.61 | 4.02 | 0.45 |
| SO3 | 1.47 | 0.02 | 2.98 |
| SiO2 | 48.00 | 49.34 | 19.85 |
| Al2O3 | 17.12 | 32.71 | 5.06 |
| MgO | 2.10 | 1.07 | 1.09 |
| Na2O | 3.36 | 0.04 | 0.22 |
Table 3.
Summary of all tested triaxial specimens under consolidated undrained conditions.
| Testing No | Percentage of Port of Brisbane Soft Soil | Percentage of Kaolin Soil | Confining Pressure (kPa) |
|---|---|---|---|
| S1—50 | 100% | 0% | 50 |
| S1—100 | 100% | 0% | 100 |
| S1—200 | 100% | 0% | 200 |
| S2—50 | 75% | 25% | 50 |
| S2—100 | 75% | 25% | 100 |
| S2—200 | 75% | 25% | 200 |
| S3—50 | 50% | 50% | 50 |
| S3—100 | 50% | 50% | 100 |
| S3—200 | 50% | 50% | 200 |
| S4—50 | 25% | 75% | 50 |
| S4—100 | 25% | 75% | 100 |
| S4—200 | 25% | 75% | 200 |
| S5—50 | 0% | 100% | 50 |
| S5—100 | 0% | 100% | 100 |
| S5—200 | 0% | 100% | 200 |
Table 4.
Summary of critical state parameters.
| Soil Groups | Clay Content (%) | Silt Content (%) | M | Friction Angle ° | Cohesion (kPa) |
|---|---|---|---|---|---|
| S1 | 79.80 | 18.00 | 1.01 | 25.43 | 5.12 |
| S2 | 64.73 | 33.41 | 1.05 | 26.54 | 4.58 |
| S3 | 49.65 | 48.81 | 1.09 | 27.53 | 2.52 |
| S4 | 34.58 | 64.22 | 1.12 | 28.25 | 1.87 |
| S5 | 19.50 | 79.62 | 1.14 | 28.80 | 1.86 |
Table 5.
Summary of CSL and NCL parameters.
| Soil Groups | Silt Content (%) | λ (NCL) | λ (CSL) | λ (NCL)/λ (CSL) |
|---|---|---|---|---|
| S1 | 18.20 | 0.14 | 0.14 | 1.02 |
| S2 | 33.41 | 0.15 | 0.15 | 0.99 |
| S3 | 48.81 | 0.13 | 0.13 | 0.97 |
| S4 | 64.22 | 0.16 | 0.18 | 0.90 |
| S5 | 79.62 | 0.15 | 0.17 | 0.88 |
Table 6.
Summary of stabilised specimens for unconfined compressive strength tests.
| Soil Group | Port of Brisbane (PoB) Soft Soil | Kaolin Soil | Cement Content (%) |
|---|---|---|---|
| S1 | 100% | 0% | 10, 15, 20, 25, 30 |
| S2 | 75% | 25% | 10, 15, 20, 25, 30 |
| S3 | 50% | 50% | 10, 15, 20, 25, 30 |
| S4 | 25% | 75% | 10, 15, 20, 25, 30 |
Publisher’s Note: MDPI stays neutral with regard to jurisdictional claims in published maps and institutional affiliations. |
© 2021 by the authors. Licensee MDPI, Basel, Switzerland. This article is an open access article distributed under the terms and conditions of the Creative Commons Attribution (CC BY) license (https://creativecommons.org/licenses/by/4.0/).
Share and Cite
MDPI and ACS Style
Liu, Y.; Liu, Z.; Oh, E.; Ong, D.E.L. Strength and Microstructural Assessment of Reconstituted and Stabilised Soft Soils with Varying Silt Contents. Geosciences 2021, 11, 302. https://0-doi-org.brum.beds.ac.uk/10.3390/geosciences11080302
AMA Style
Liu Y, Liu Z, Oh E, Ong DEL. Strength and Microstructural Assessment of Reconstituted and Stabilised Soft Soils with Varying Silt Contents. Geosciences. 2021; 11(8):302. https://0-doi-org.brum.beds.ac.uk/10.3390/geosciences11080302
Chicago/Turabian StyleLiu, Yaxu, Zhuang Liu, Erwin Oh, and Dominic Ek Leong Ong. 2021. "Strength and Microstructural Assessment of Reconstituted and Stabilised Soft Soils with Varying Silt Contents" Geosciences 11, no. 8: 302. https://0-doi-org.brum.beds.ac.uk/10.3390/geosciences11080302
Note that from the first issue of 2016, this journal uses article numbers instead of page numbers. See further details here.