Article

Geochemical Trends Reflecting Hydrocarbon Generation, Migration and Accumulation in Unconventional Reservoirs Based on Pyrolysis Data (on the Example of the Bazhenov Formation)

1
Center for Hydrocarbon Recovery, Skolkovo Institute of Science and Technology (Skoltech), Skolkovo Innovation Center, 30, Build. 1, Bolshoi Boulevard, 121205 Moscow, Russia
2
Gazprom Neft Science & Technology Centre, 75-79 Liter D Moika River emb., 190000 St Petersburg, Russia
*
Author to whom correspondence should be addressed.
Submission received: 11 May 2021 / Revised: 15 July 2021 / Accepted: 21 July 2021 / Published: 24 July 2021
(This article belongs to the Special Issue Petrophysics and Geochemistry of Unconventional Reservoirs)

Abstract

:
The current study is devoted to the determination and interpretation of geochemical trends reflecting hydrocarbon generation, migration and accumulation in unconventional reservoirs; the study is performed on the Bazhenov shale rock formation (Western Siberia, Russia). Results are based on more than 3000 Rock-Eval analyses of the samples from 34 wells drilled in the central part of the West Siberian petroleum basin, which is characterized by common marine sedimentation environments. Pyrolysis studies were carried out before and after the extraction of rocks by organic solvent. As a result, we have improved the accuracy of kerogen content and maturity determination and complemented the standard set of pyrolysis parameters with the content of heavy fraction of hydrocarbons. The data obtained for the wells from areas of different organic matter maturity was summarized in the form of cross-plots and diagrams reflecting geochemical evolution of the source rocks from the beginning to the end of the oil window. Interpretation of the obtained results revealed quantitative trends in the changes of generation potential, amount, and composition of generated hydrocarbons in rocks at different stages of oil generation process. The analysis of geochemical trends allowed us to improve approaches for the productivity evaluation of the formation and study the effect of organic matter maturity on distribution of productive intervals of different types.

1. Introduction

Source rocks with high organic matter content and related processes of hydrocarbon formation in petroleum basins have been studied for many decades [1,2,3,4,5]. The shale revolution of the past two decades has demonstrated that these sedimentary rocks can be a promising target for exploration. However, a number of problems associated with the choice and application of methods for prospecting and exploration as well as production of hydrocarbons from these unconventional reservoirs remain unresolved because they differ significantly from the methods and technologies used for traditional oil and gas fields.
Geochemical studies of organic matter are commonly used to establish the most important characteristics that reflect hydrocarbon forming processes and determine the current hydrocarbon potential of rocks [6,7,8,9,10]. The list of geochemical methods includes pyrolysis and coal petrographic analysis, element, molecular, and isotopic composition studies of rocks and fluids, and other analytical methods. One of the most widely used geochemical methods for the analysis of organic matter in unconventional reservoirs is Rock-Eval pyrolysis [6,7,9,11,12,13,14]. This highly informative method is applied for determination of the organic matter content, its source (kerogen type), maturity, oil and gas generation potential, mobile hydrocarbon content, and other characteristics which are necessary to assess the quality of source rock in exploration of conventional petroleum-geological systems, to estimate oil and gas reserves of unconventional fields, and to choose the methods for hydrocarbon recovery. The estimation of thermal maturity of rocks is especially important in this case, and the common approach is based on vitrinite reflection measurements. In case of the absence of vitrinite, the combination of pyrolysis and biomarker analysis of oils and rock extracts allows one to determine maturity using the data on kerogen and mobile hydrocarbons composition [7,15].
Bulk rock pyrolysis data collected from the areas of different maturity of the same source rock formation provide an opportunity to analyze the geochemical evolution of rocks from the immature kerogen to the end of hydrocarbon generation process and to determine regional and local criteria for oil and gas reserves assessment. The current study is devoted to the analysis of generation, migration and accumulation of hydrocarbons based on pyrolysis data obtained from a representative collection of rock samples from one of the largest oil shale formations in the world, the Bazhenov Formation. In the study, we consider the deposits of the central part of the West Siberian basin, which have been formed in the similar marine environment. Such deposits are the major constituent of the whole Bazhenov Formation. Analysis of more than 3000 rock samples was performed according to the unified procedure and using the same instrument. The level of maturity of the studied rocks covers the entire range established for the Bazhenov Formation—from immature to the end of the oil window—and thus allowed us to identify the main patterns associated with the hydrocarbons generation and migration. Based on the results of the analysis, we have determined the criteria for the identification of the productive intervals.

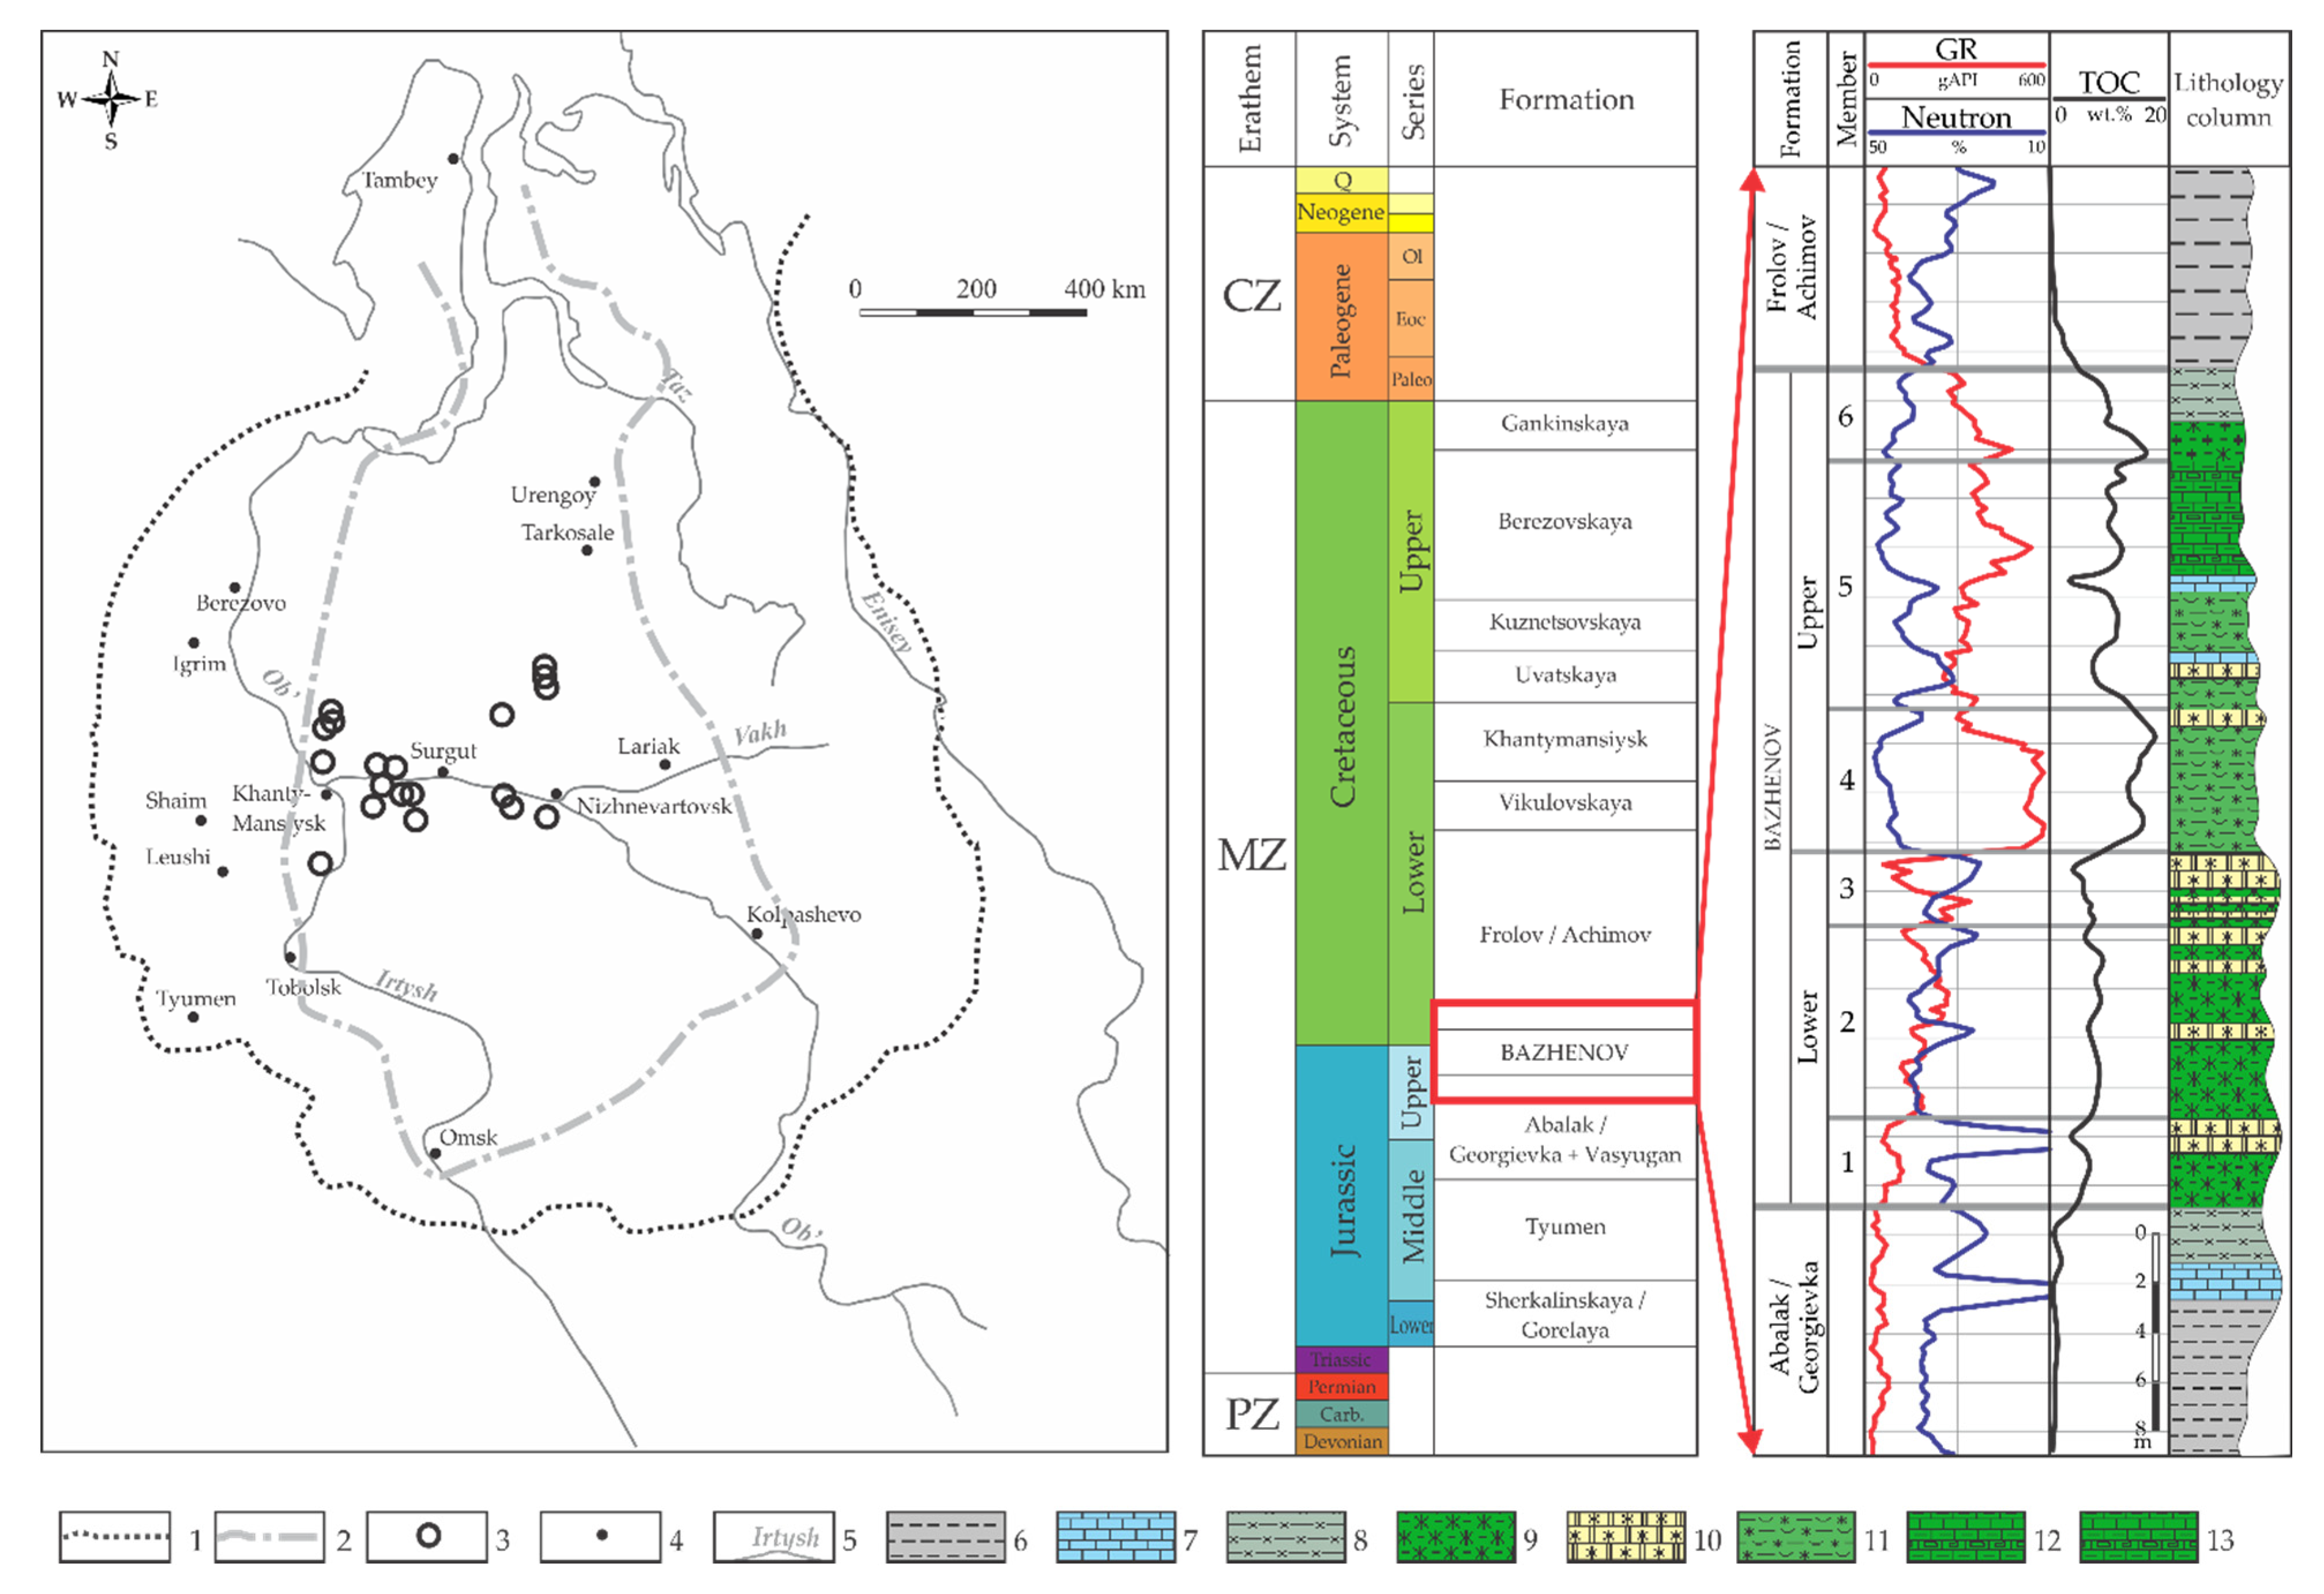
2. Geological Setting

The Bazhenov Formation is one of the largest source rock formations worldwide in terms of area and hydrocarbon resources [11,16,17,18,19,20,21]. The deposits of the Bazhenov Formation together with its stratigraphy analogs J3—K1 with similar characteristics (named the Bazhenov horizon) cover an area of more than 1 million km2 in the West Siberian Basin. The Bazhenov horizon is located at a depth of 2200 ÷ 3500 m; it is underlain by the Upper Jurassic terrigenous deposits and is overlain by Lower Cretaceous mudstones. The thickness of the formation varies from 20 to 80 m with an average of 25 to 30 m. According to various assessments [19,20,22,23], the amount of oil resources ranges from 50 billion to 1–3.5 trillion barrels, while recoverable reserves are estimated from 5 to 400 billion barrels. The considerable uncertainty of estimations comes from the insufficient investigation of the deposits over the large area of distribution, as well as from the poor adaptation of the resource assessment methods for the development of shale formations with extremely low permeability. The initial production rates of wells are usually low (8 to 12 t/day) and reach values up to 300 t/day only in rare cases, such as the Salym field [24]. At the same time, a large number of wells turn out to be “dry”, even after the application of hydraulic fracturing [24]. Low production rates are caused by extremely low permeability (from 0.001 to 0.1 mD) of the Bazhenov Formation rocks [25]. Oil and hydrocarbon gases of the Bazhenov Formation occupy void space of the rocks, including intergranular space and pores in kerogen. Intergranular porosity varies from 1% to 4%, and in some intervals could reach 8% [25]; organic porosity depends on thermal maturity and could reach 50% of the kerogen volume for the mature rocks [26,27]. The Bazhenov Formation is characterized by water-wet and neutral wettability [28].
The sediments of the Bazhenov Formation have been accumulated mostly (except paleoshelf areas) in marine conditions corresponding to the maximum of sea-level transgression period [29], which explains its wide spread. The Bazhenov Formation deposits significantly differ from the underlying and overlying rocks by increased radioactivity and high organic matter content. It is composed mainly of organic-rich clayey-siliceous, organic-rich clayey-carbonate-siliceous and organic-rich siliceous rocks [17,18,19,21,29,30,31,32,33]. According to the results of lithological and geochemical studies, the Bazhenov Formation is usually subdivided into Lower Bazhenov and Upper Bazhenov. The Upper Bazhenov is represented by organic-rich clayey-siliceous and organic-rich carbonate-clayey-siliceous rocks with increased content of pyrite in most of the studied areas. The Lower Bazhenov is composed mainly of siliceous rocks; carbonates are almost absent, except for the secondary dolomites and limestones, which replace the siliceous rocks.
By lithological composition, the section is subdivided into six members that differ by the content of the main rock-forming components: silica, organic matter, clay minerals, carbonates, and pyrite [29]. The lower member 1 is predominantly siliceous, with a low clay minerals content (up to 15%) and relatively low content of organic matter (TOC up to 5%). In the member 2, the TOC content increases compared to member 1 (up to 10%); it is characterized by a significant amount of thin radiolarite interlayers composed of radiolarian shell fragments and remains of bivalves and fish. The member 3 is composed of siliceous and clayey-siliceous rocks (up to 20% of clays), and a large amount of radiolarites. In this member, TOC values usually do not exceed 5 wt.%. Radiolarite layers are often productive due to improved reservoir properties by comparison with other layers. The radiolarite member 3 is the uppermost member of the Lower Bazhenov. The sediments of the Upper Bazhenov contain an increased amount of organic matter (TOC up to 30%), which usually reaches its maximum in the member 4 which is represented by clayey-siliceous rocks. The organic-rich carbonate-clayey-siliceous member 5 also contains a high amount of organic matter, framboidal pyrite and biogenic carbonates. The member 6, composed of siliceous claystone and clayey-siliceous rocks and often also contain an increased amount of pyrite, indicating reducing depositional environment.
The Bazhenov Formation is overlaid by the Frolov Formation and underlaid by the Abalak Formation. These deposits are predominantly terrigenous clayey with a significantly lower organic matter content compared to the Bazhenov. The described sequence [29] is quite typical for the central part of the West Siberian Basin, with some variations in the amount of rock-forming components and the absence of some elements in the Bazhenov Formation areas that were subjected to erosion. The composition of the formation forming members is very similar, and the main differences come from the quantitative fluctuations of the main components, the appearance/disappearance of pyrite framboids, and the variations in the organic matter content. The simplified lithostratigraphic column of the Bazhenov Formation with underlying and overlying formations based on typical section from existing studies [29,34] is presented below (Figure 1).
TOC values vary along the section from 2 to 30 wt.%. For most regions of the Bazhenov Formation, the average TOC values are 9–12 wt.%, while the Upper part is characterized by higher values [35,36,37,38,39]. Kerogen is one of the main rock-forming components, its content varies from 5–50 vol.% [19,35]. Most of kerogen of the Bazhenov Formation is classified as type II [40,41,42], although some thin layers (usually 10–20 cm) are identified as type I kerogen [40,43].
The Bazhenov Formation contains kerogen and hydrocarbons in different forms including heavy oil fractions, light oil and hydrocarbon gases. The composition of organic matter in the rocks depends on the level of the catagenetic transformation. Despite the formation having quite uniform depth [35,44], the organic matter maturity varies significantly: from immature to the end of the oil window (stages PC3, MC1, MC2, MC3 according to Vassoevich’s scale [35,45]). Maturity of the Bazhenov Formation organic matter changes by area, from field to field, while from bottom to top of the formation in the particular area, the maturity is approximately constant. The maturity depends on a number of factors, including heat flow, tectonic conditions such as the proximity of faults and intrusions, and often varies considerably within relatively small areas.
The Bazhenov Formation deposits have a high initial oil generation potential, which can reach 150 ÷ 180 mg HC/g rock, in rare cases up to 250 mg HC/g rock [35,39,41]. The initial hydrogen index (HI0) is in the range of 650 ÷ 750 mg HC/g TOC [35].
In general, the Bazhenov Formation can be considered as an entire petroleum system covering the central part of the West Siberian Basin. The studied central area of the Bazhenov Formation was formed under similar reducing marine sedimentation conditions. The genesis and initial characteristics of organic matter are common. The currently observed differences in the organic matter content, composition and thermal maturity in rocks result from variations in the amount of initial organic matter, thermal history of the region, mineral matrix composition and structure, and other factors, which determine kerogen transformation to hydrocarbons.

3. Samples

In the current study, we have analyzed core samples from 34 wells located within the central part of the West Siberian Basin (Figure 1). The studied Bazhenov Formation intervals from different wells and oilfields are similar to each other in terms of structure and lithological composition. Considerable variations in the organic matter thermal maturity over the studied Bazhenov Formation area allow us to identify and analyze the evolution of the oil forming process during the geological history of the basin. Samples were collected from the core at equal intervals (on average, 2 samples per 1 m), from intervals with the known lithological composition and corresponding to lithostratigraphic members. The overlying and underlying terrigenous rocks were not involved in the analysis. A total of 1909 rock samples were subjected to Rock-Eval pyrolysis before extraction with an organic solvent and 1100 of them were analyzed after extraction.

4. Methods

Pyrolysis studies were carried out on HAWK pyrolyzer (Wildcat Technologies LLC, Humble, TX, USA) according to the bulk-rock temperature program.
The basis of Rock-Eval pyrolysis technique has been repeatedly described in previous studies [8,14,42,46]. The bulk-rock program includes two stages of heating (in an inert atmosphere and the presence of air), with continuous recording of released hydrocarbons using a flame ionization detector (FID), and carbon oxides CO and CO2 using IR cells. The crushed sample in the crucible is transferred to the oven, where stepwise heating takes place according to a specified temperature program. At the first stage of pyrolysis, gaseous hydrocarbons are released at temperatures up to 90 °C, giving S0. With a further increase of temperature to 300 °C, liquid hydrocarbons (S1) are thermally evaporated from the rock. High-boiling point hydrocarbons and hydrocarbon products of kerogen pyrolysis are detected at higher temperatures up to 650 °C (S2). The output pyrolysis parameters are S0 (gaseous hydrocarbons), S1 (light petroleum hydrocarbons), and S2 (products of kerogen pyrolysis plus heavy oil fractions) measured in mg HC/g rock, as well as parameters S3 (the amount of CO2 released during the pyrolysis), S4 (the amount of CO2 released during the oxidation stage) and S5 (the amount of CO2 released during the carbonate decomposition) measure and reported as mg CO2/g rock. These parameters are used for the calculation of the total organic carbon content TOC in wt.%. The temperature of the maximum of peak S2 is Tmax, which is an indicator of the maturity, it was reported to correlate with the vitrinite reflectance [47,48].
The sum of (S0 + S1 + S2) is attributed to the petroleum generation potential, and for immature organic matter is equal to the initial generation potential of the rock. The parameter S2 characterizes the residual generation potential of the rock.
Heavy hydrocarbon fractions (resins and asphaltenes) are registered as part of the peak S2 due to high boiling temperatures. For a more reliable determination of the heavy hydrocarbons content, pyrolysis was carried out before and after the extraction of powdered rock with chloroform in Soxhlet apparatus for 1-2 months. The proportion of soluble resins and asphaltenes was determined as the difference in S2 value before and after extraction (ΔS2 = S2 − S2ex). Here and after pyrolysis parameters and indices after extraction are labeled by “ex”.
The processing of the obtained data also included calculation of hydrogen index HI (mg HC/g TOC) = S2/TOC × 100 (or HIex = S2ex/TOCex × 100), oxygen index OI (mg CO2/g TOC) = S3/TOC × 100, productivity index PI = (S0 + S1)/(S0 + S1 + S2), generative organic carbon content GOC (wt.%) = (S0 + S1 + S2) × 0.085 + S3 × 12/440 + (S3CO + S3′CO) × 12/280) [12,49].
Along with the mentioned indices, we propose the use of the coefficient Kgoc, which characterizes the proportion of kerogen that could be transformed to hydrocarbons under elevated temperatures. It is calculated as the ratio of the carbon in generative kerogen (GOC—generative organic carbon) to the total organic carbon TOC for the samples extracted by chloroform. The calculation was performed according to the formula Kgoc = (GOCex/TOCex) × 100, %. In the current study, the coefficient Kgoc is used for the quantitative representation of the organic matter transformation to petroleum as the result of the gradual realization of the generation potential. Unlike Tmax and HI, Kgoc characterizes the organic matter maturity directly as the proportion of kerogen remaining: it decreases from the highest value at the initial stage of catagenetic transformation to zero when the generation potential is fully realized.

5. Results and Discussion

Rock-Eval pyrolysis data interpretation before and after extraction is described above (Section 4). The obtained results for the selected Bazhenov Formation rock samples are summarized in Table 1. Because we sampled the rock at equal intervals, the number of samples reflects the distribution of intervals with the specified characteristics within the Bazhenov Formation. The results of the analyses are represented as the diagrams and plots.

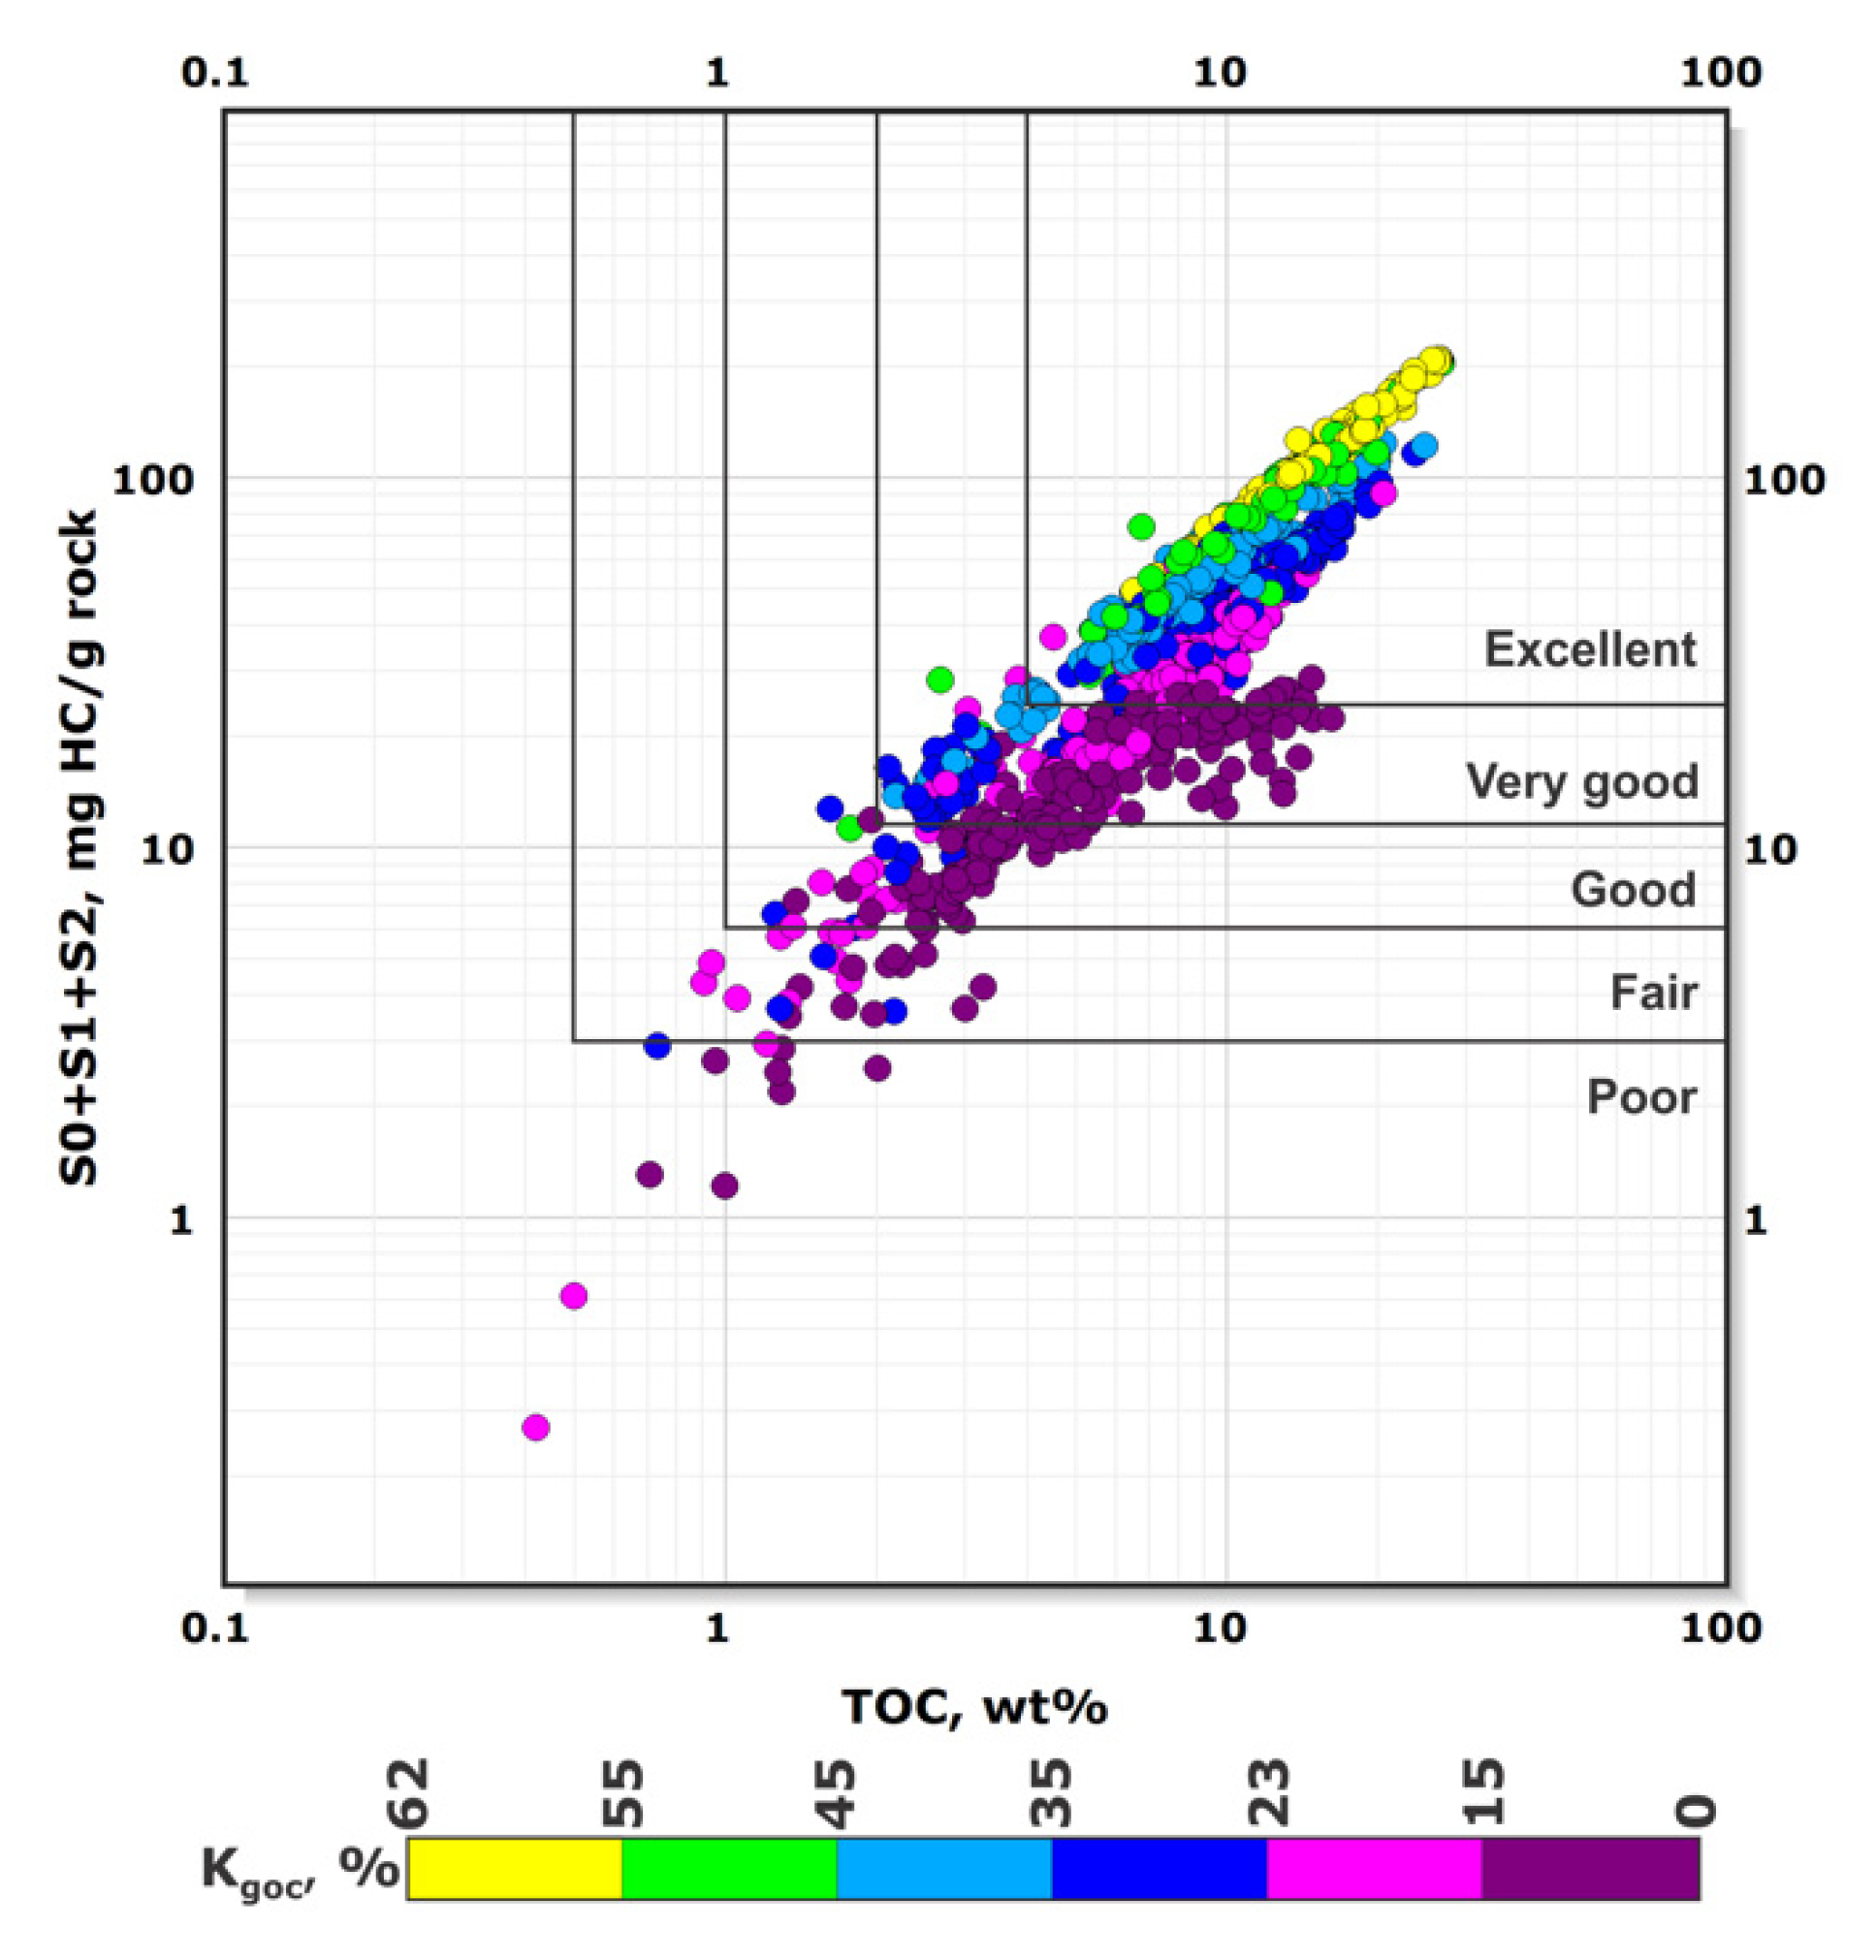
5.1. Generation Potential of the Bazhenov Formation Rocks
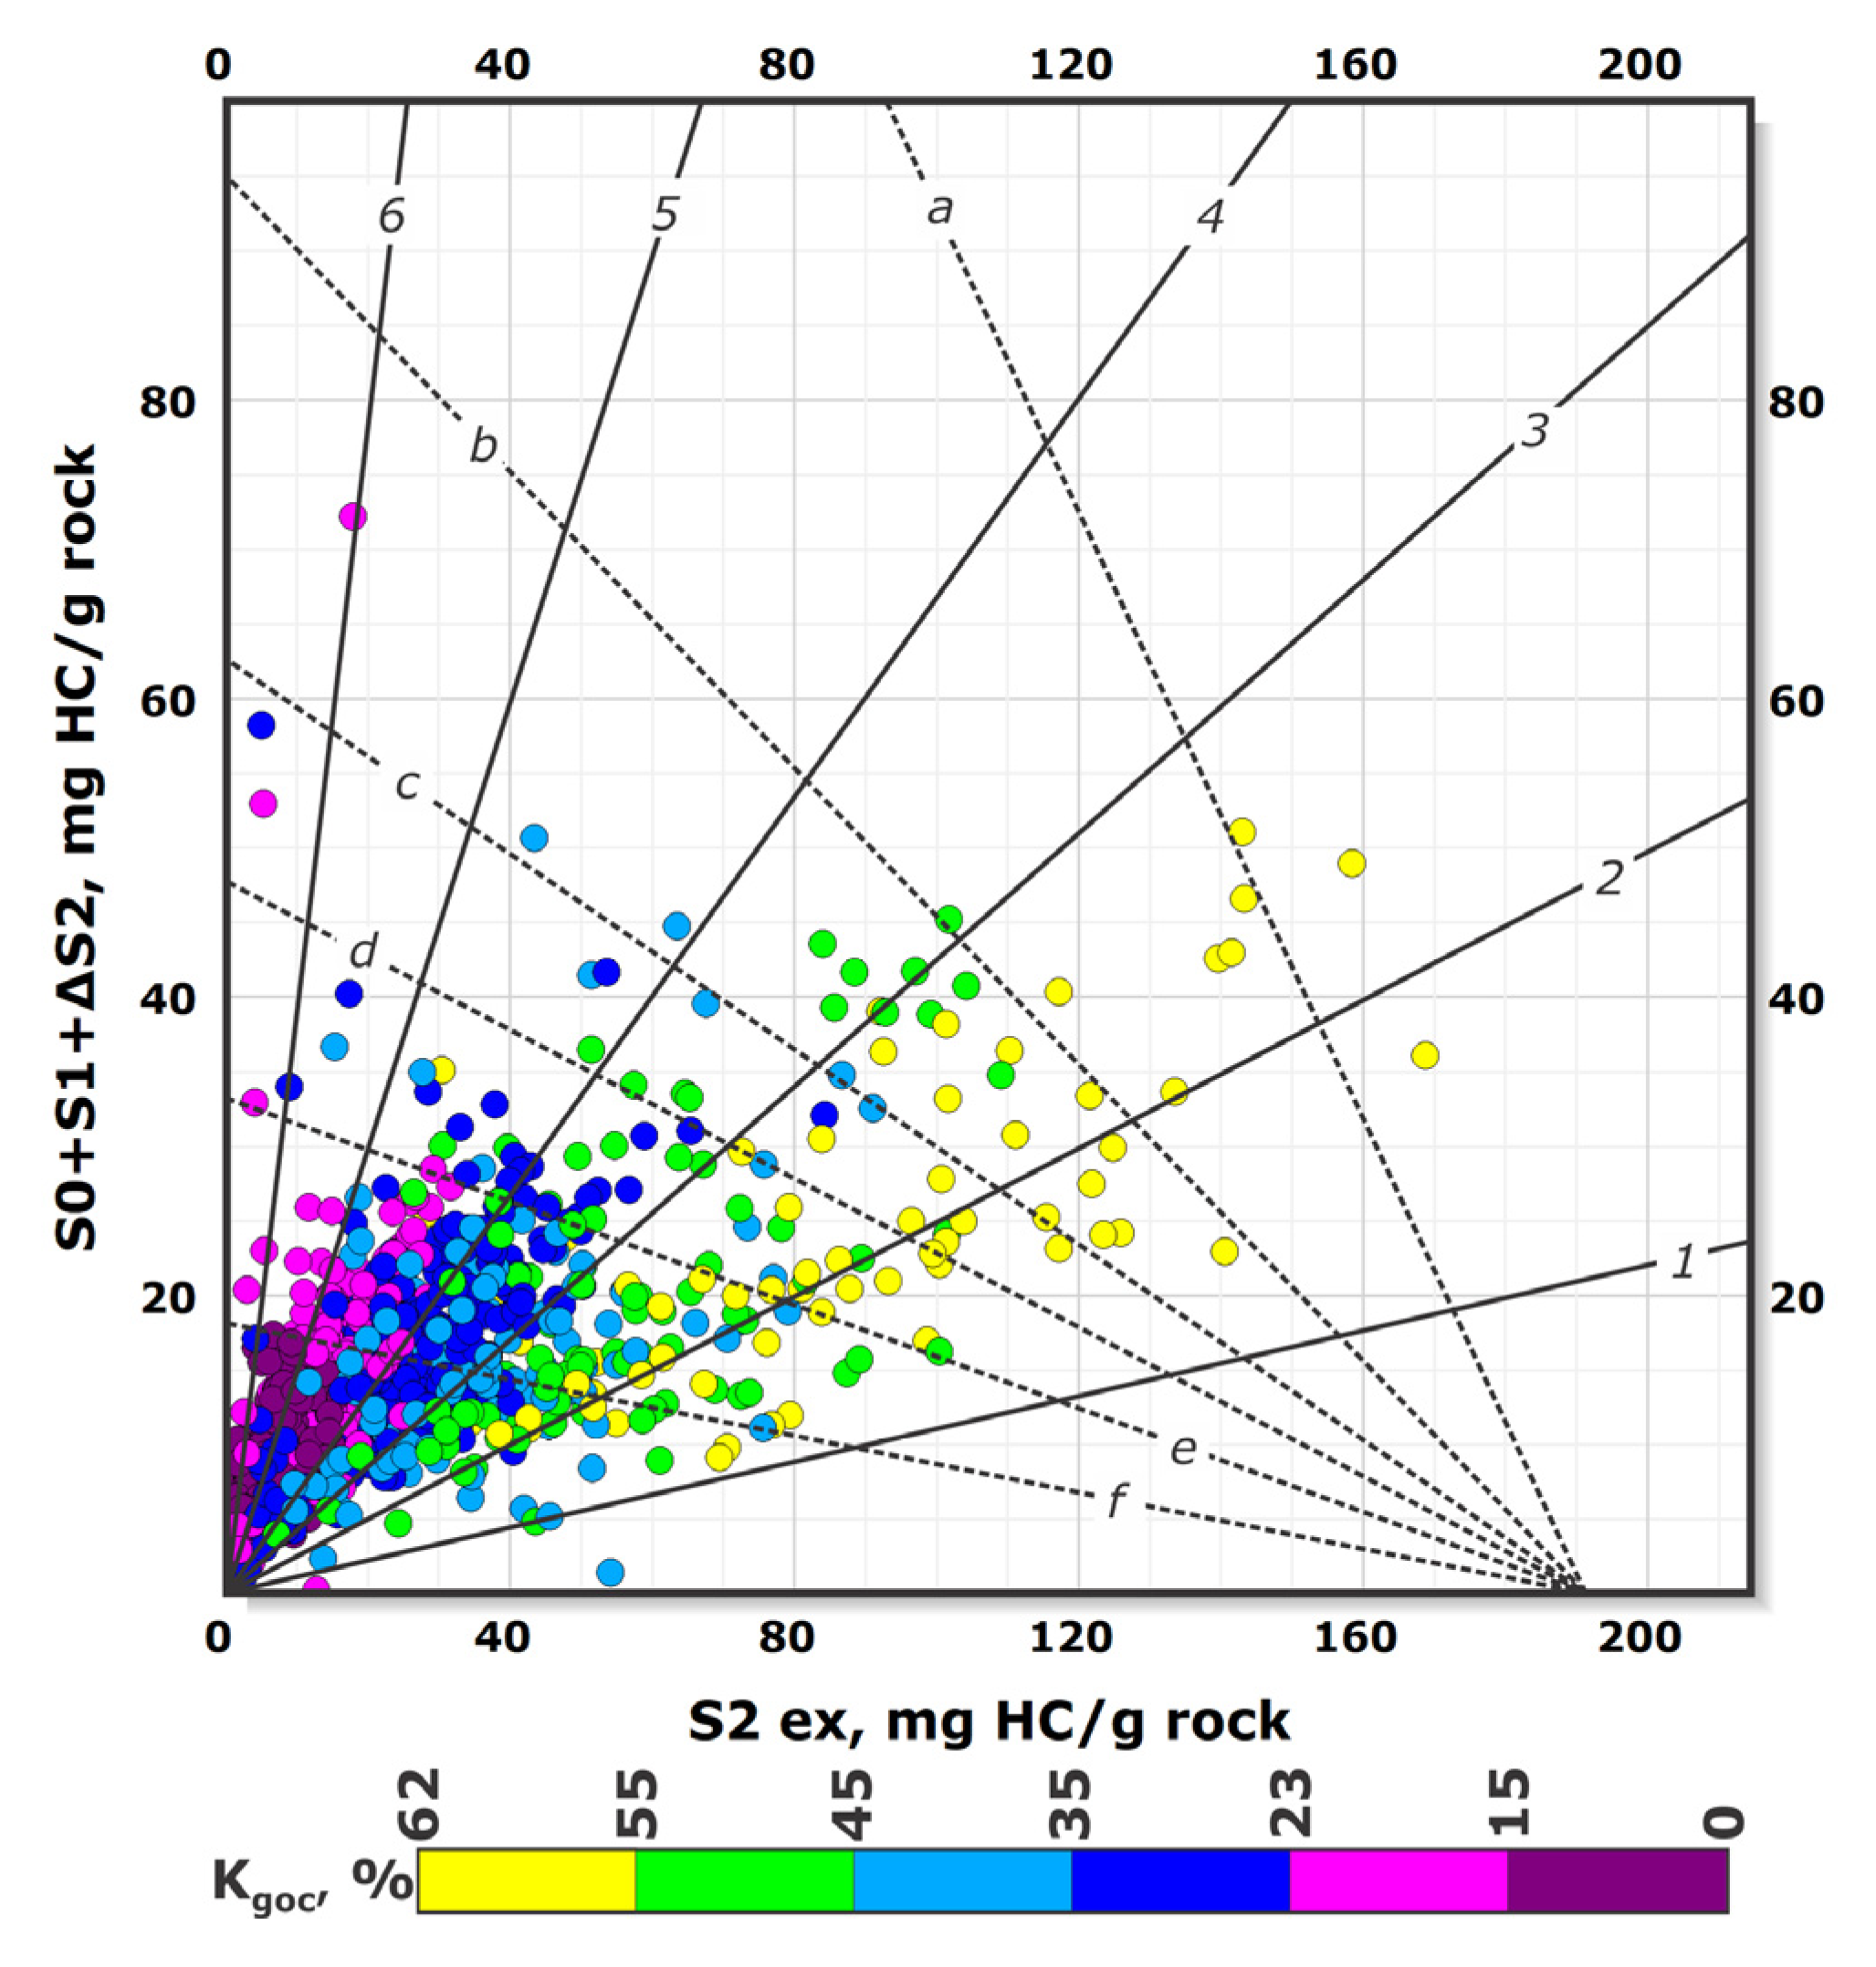
The generation potential of rocks can be estimated using the data on the balance characteristics of the hydrocarbon composition (S0 + S1 + S2) and TOC, the diagram is shown in Figure 2. This type of diagram and the classification of rocks by their generation potential value was initially reported in [7,15]. The given diagram is complemented by the parameter Kgoc (shown in color), which reflects maturation as the proportion of pyrolyzable organic matter.
The obtained data provide the statistically reliable characterization of the Bazhenov Formation deposits in the central part of the Western Siberian Basin and do not contradict the results of individual studies for different geological objects in this region. As it follows from the diagram, the rocks of the Bazhenov formation are characterized by TOC content in the range from 0.5 to 30.5 wt.%, with an average of 9.6 wt.%. The generation potential of rocks (S0 + S1 + S2) varies in a wide range, and more than 90% of the samples show values from 15 to 105 mg HC/g rock. According to the classification from [7,15], 75% of the studied samples belong to rocks with “excellent” generation potential, and most of these samples are characterized by Kgoc above 35%. About 15% of the samples fall into the range of “good” and “very good” potential, with a proportion of pyrolyzable carbon Kgoc < 35%.

5.2. Kerogen Type

Information about the kerogen type can be obtained from the HI-Tmax diagram, often called the modified van Krevelen diagram. It was used in many previous studies to analyze the kerogen type, for example in [3,9]. In Figure 3, we report a modified version of van Krevelen diagram for the studied sample collection. In addition to the previous studies, we have made a diagram using the HIex and Tmaxex values determined for the extracted samples in order to characterize kerogen itself without the consideration of the soluble hydrocarbon fractions in S2 and Tmax. Another feature is the addition of Kgoc to the diagram (shown in color), which reflects maturation as the proportion of pyrolyzable organic matter.
Figure 3 is useful for reliable determination of the organic matter source and analysis of organic matter geochemical evolution during maturation. According to the position on the diagram, more than 95% of kerogen samples can be classified as type II kerogen with different thermal maturity, which is consistent with previous studies based on the characterization of the Bazhenov Formation kerogen by elemental analysis, petrography, and pyrolysis [40,41,50].
About 1.5% of the samples are characterized by increased values of the hydrogen index HIex > 750 mg HC/g TOC, which is typical for type I kerogen. Type I kerogen is commonly associated with lacustrine settings. However, type I kerogen can also be formed from concentrated marine algae or from organic matter that has undergone extensive bacterial reworking [7,51]. In the Upper Bazhenov Formation, type I kerogen was previously identified based on organic petrography, elemental analysis, Rock-Eval pyrolysis, and molecular parameters [43,52]. About 3.5% of the studied samples may be incorrectly referred to type III kerogen. Taking into account the general trend and the proportion of converted kerogen, we conclude that these samples contain type II kerogen of very high maturity, where organic matter is transformed to the maximal extent.
Further discussion relates only to the samples containing type II kerogen. Individual samples with enormously high HI probably refer to type I kerogen (red markers on Figure 3), and they were excluded from analysis to avoid incorrect interpretations.
Thus, for the further studies of maturity trends we have carefully selected the samples, representing the rocks formed under similar depositional environment, containing the same kerogen type and collected from different areas of the central part of the Bazhenov Formation. The conclusions made are reliable for rocks with marine type II organic matter accumulated under reducing environments, which is characteristic for the most of the Bazhenov deposits.

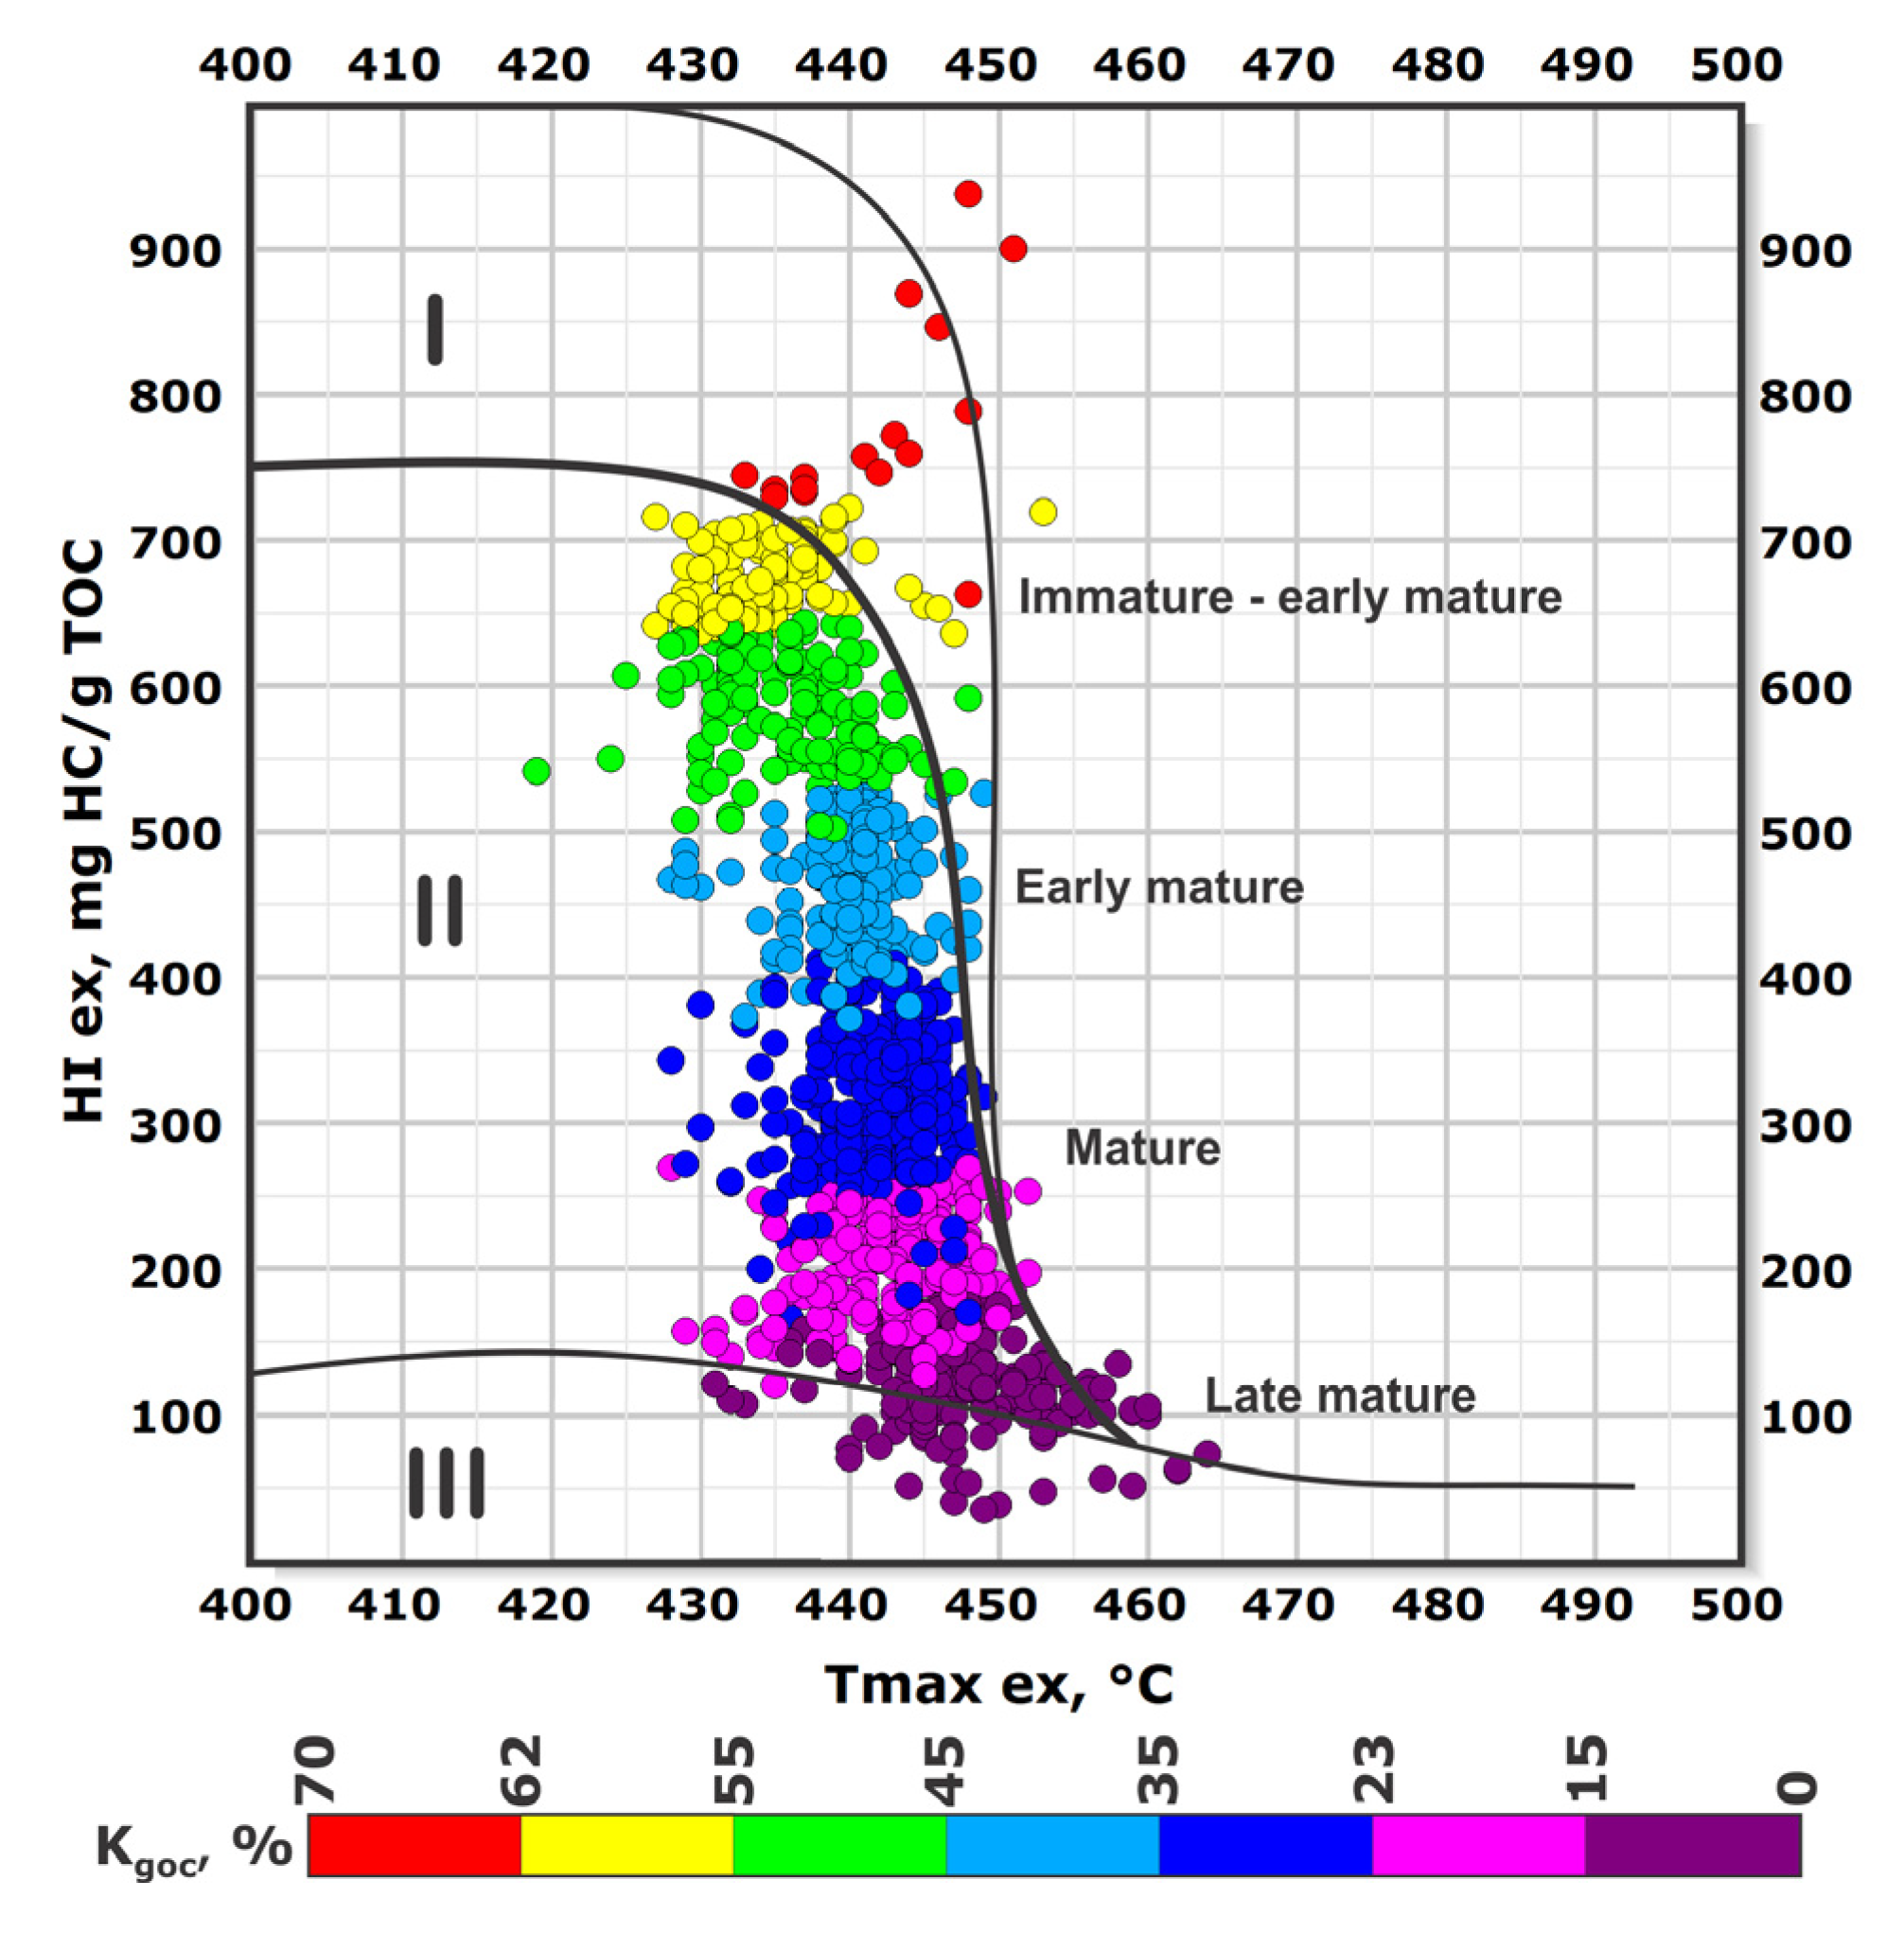
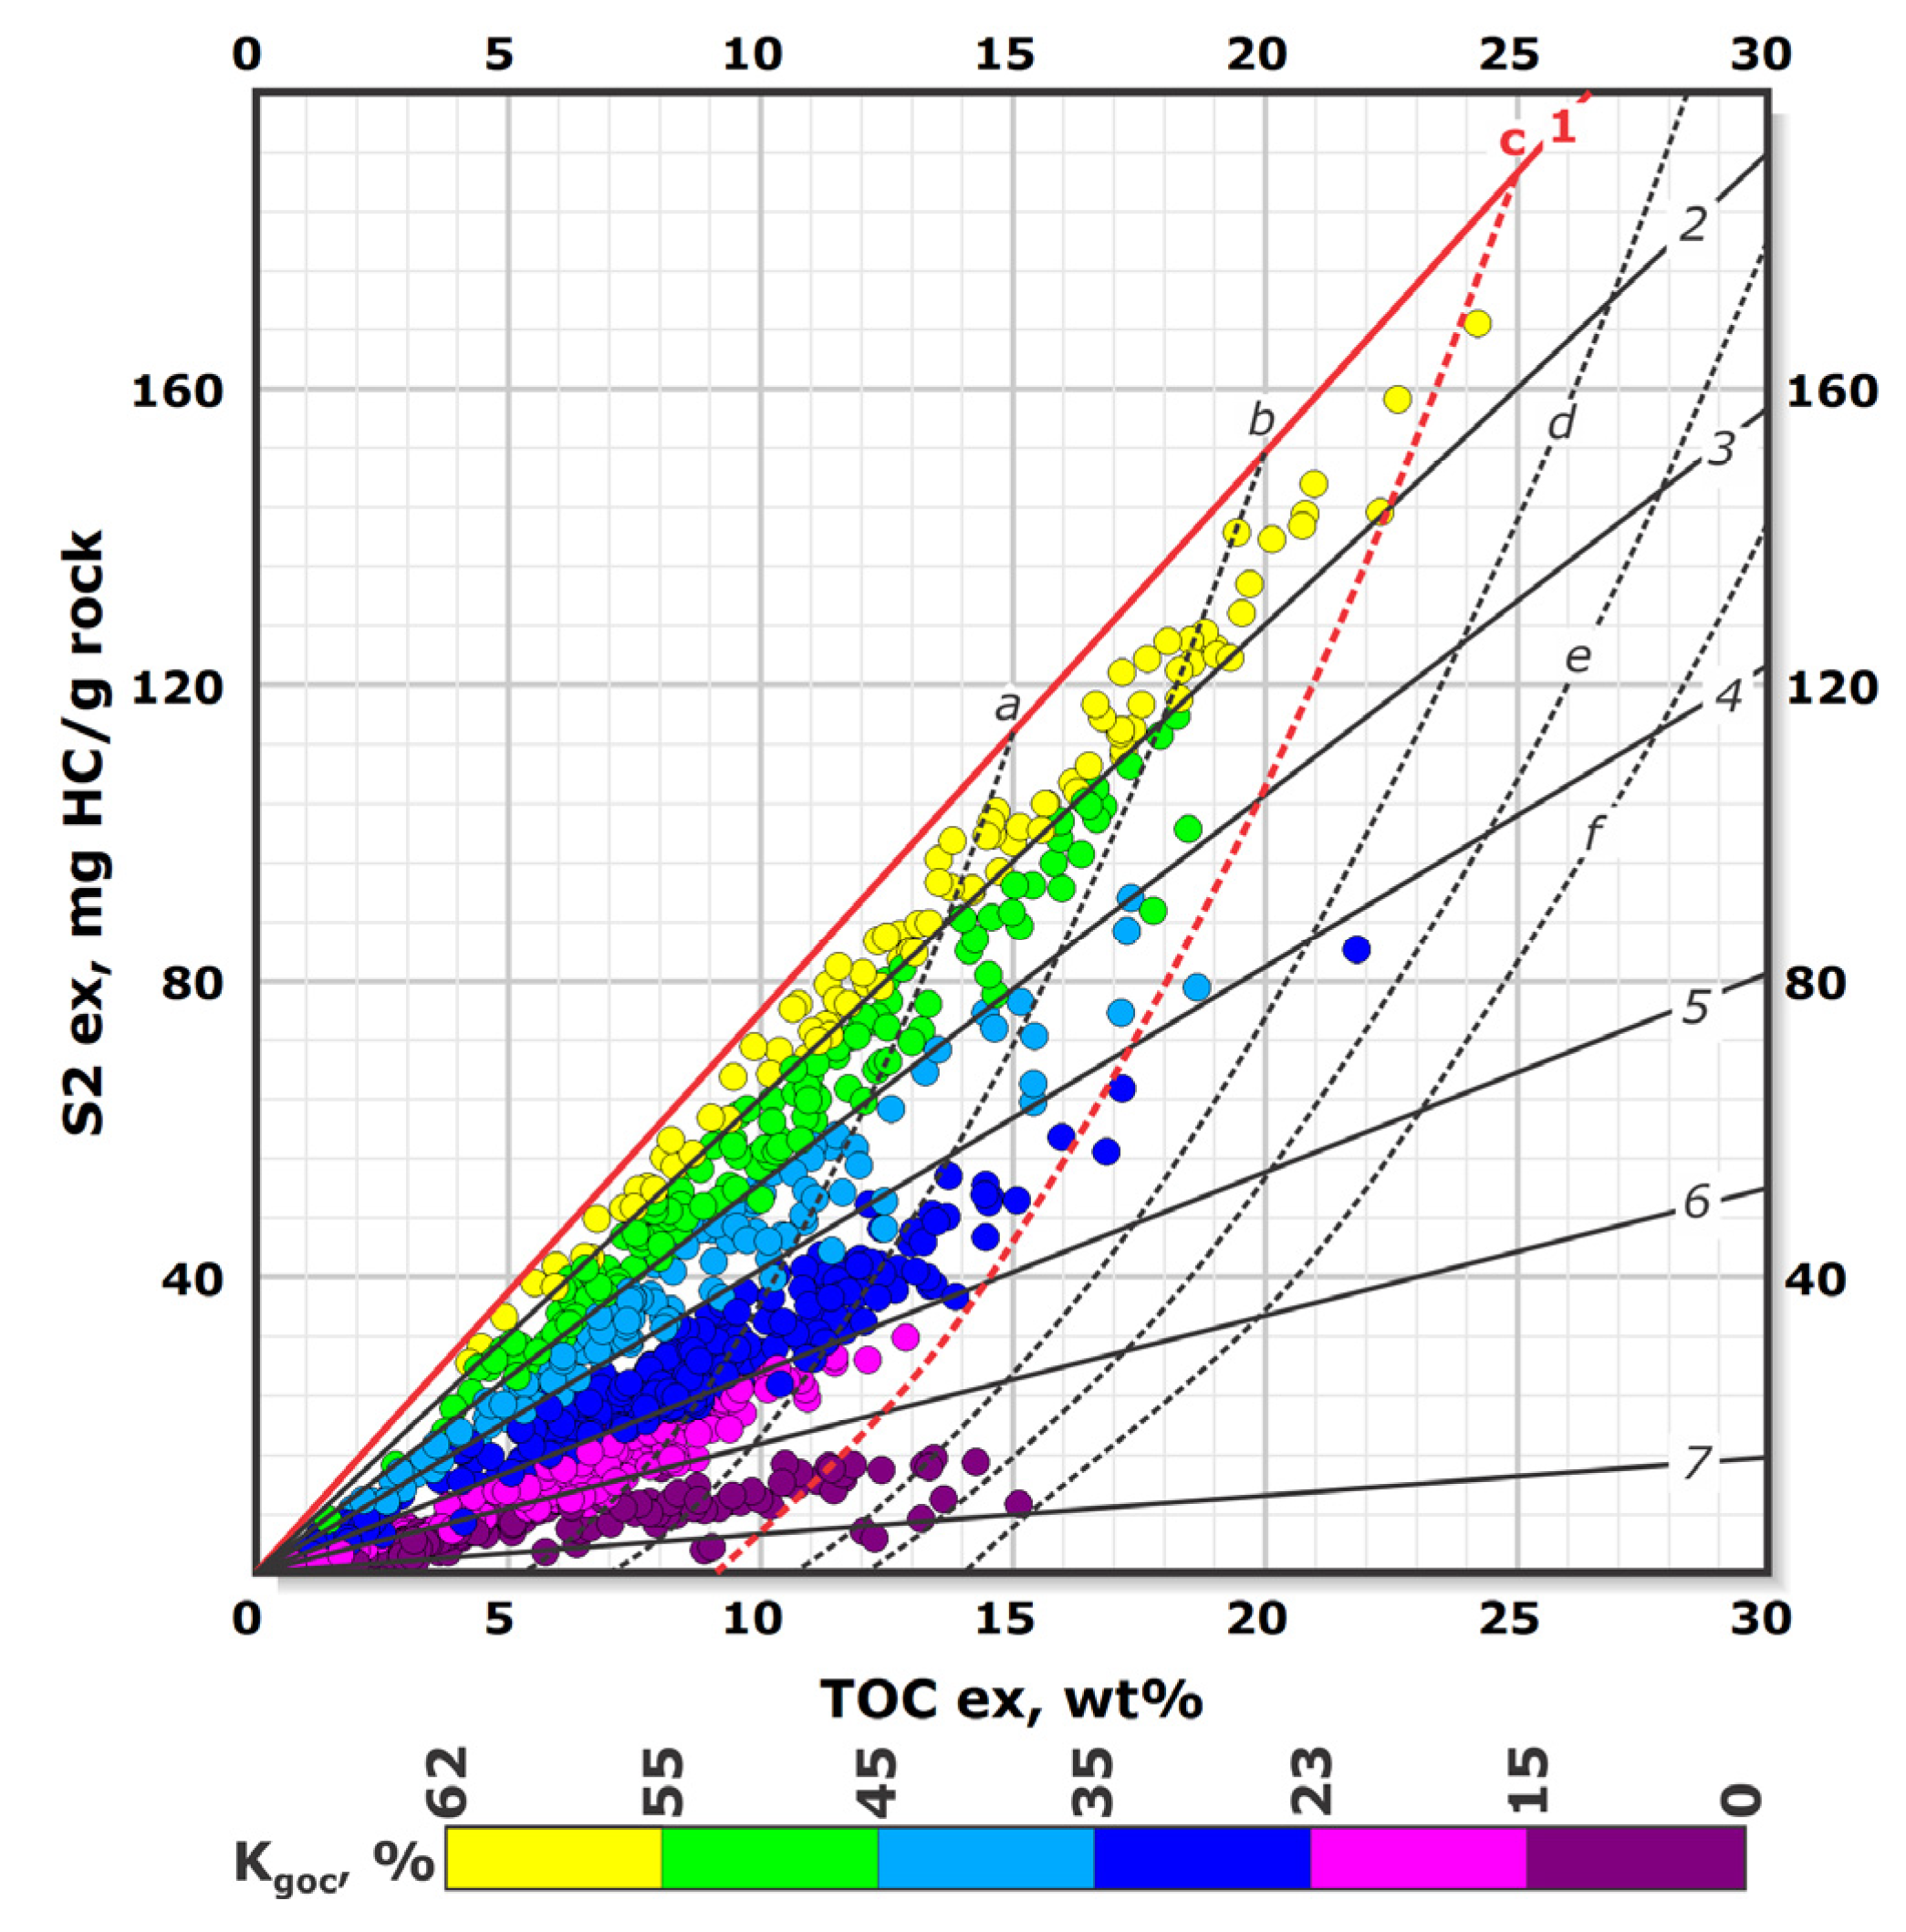
5.3. Relations between Thermal Maturity and Organic Matter Content in Rocks

Analysis of the inter-relations between TOC and the degree of catagenesis was carried out using S2ex-TOCex diagram (Figure 4), illustrating the organic matter content and the residual generation potential of rocks, see for example [42]. In the current study, S2-TOC diagram was built for the extracted rock samples to evaluate the content of kerogen and generation potential without contribution of extractable heavy hydrocarbon to S2. In Figure 4, points are colored according to Kgoc values, which reflect the content of generative kerogen in rock at the current maturity stage. As it follows from the diagram, the maximum of S2 and TOC values correspond to organic matter with the lowest degree of transformation (Kgoc > 55%, yellow points). A decrease in Kgoc leads to the decrease in the highest S2 and TOC values at each maturity level, which is the result of hydrocarbons generation at the previous stages of catagenesis.
The difference in the location of points, corresponding to different kerogen conversion, is explained by the solid lines 1–7. These lines have been calculated using the equation S2 (mg HC/g rock) = 10 × Kgoc × TOC (wt.%)/CHC, where CHC is the average mass fraction of carbon in hydrocarbon products, equal to 0.85 [12]. The line 1 (in red) is located above the area of all experimentally measured values and corresponds to the generative kerogen proportion Kgoc of 65%. From this fact, we conclude that the initial Kgoc did not exceed 65% and this line reflects the initial state of the system before the start of hydrocarbon generation. With increasing maturity, the line slope decreases and tends to the horizontal line by the end of the system evolution, which corresponds to the complete exhaustion of the generation potential and the very end of hydrocarbons generation (S2 = 0). The calculated values are in good agreement with the experimentally determined Kgoc.
The dashed lines af reflect the expected maturity trends for points with different values of TOC0. For example, line c (in red) corresponds to TOC0 = 25 wt.%. Because this line c restricts the highest TOC values in the diagram, we conclude that TOC0 generally did not exceed 25 wt.% in the studied area. For the latest maturity stage, this line comes to the point TOC = 8.75 wt.%, which corresponds to the non-pyrolyzable carbon fraction of 35%. This estimation is in accordance with the earlier made conclusion that the initial GOC0/NGOC0 ratio for the BF samples is 65:35. We have observed only a few exceptions to this rule for the points located in the lower part of the diagram, they reach the line corresponding to TOC0 of 30 wt.%.
To sum up, the estimation of the initial TOC0 content and the degree of its transformation to hydrocarbons during catagenesis are available for each particular point, according to the trends illustrated in Figure 4. The predictions are reliable under the assumption of the same kerogen type and the same initial GOC0/NGOC0 ratio.

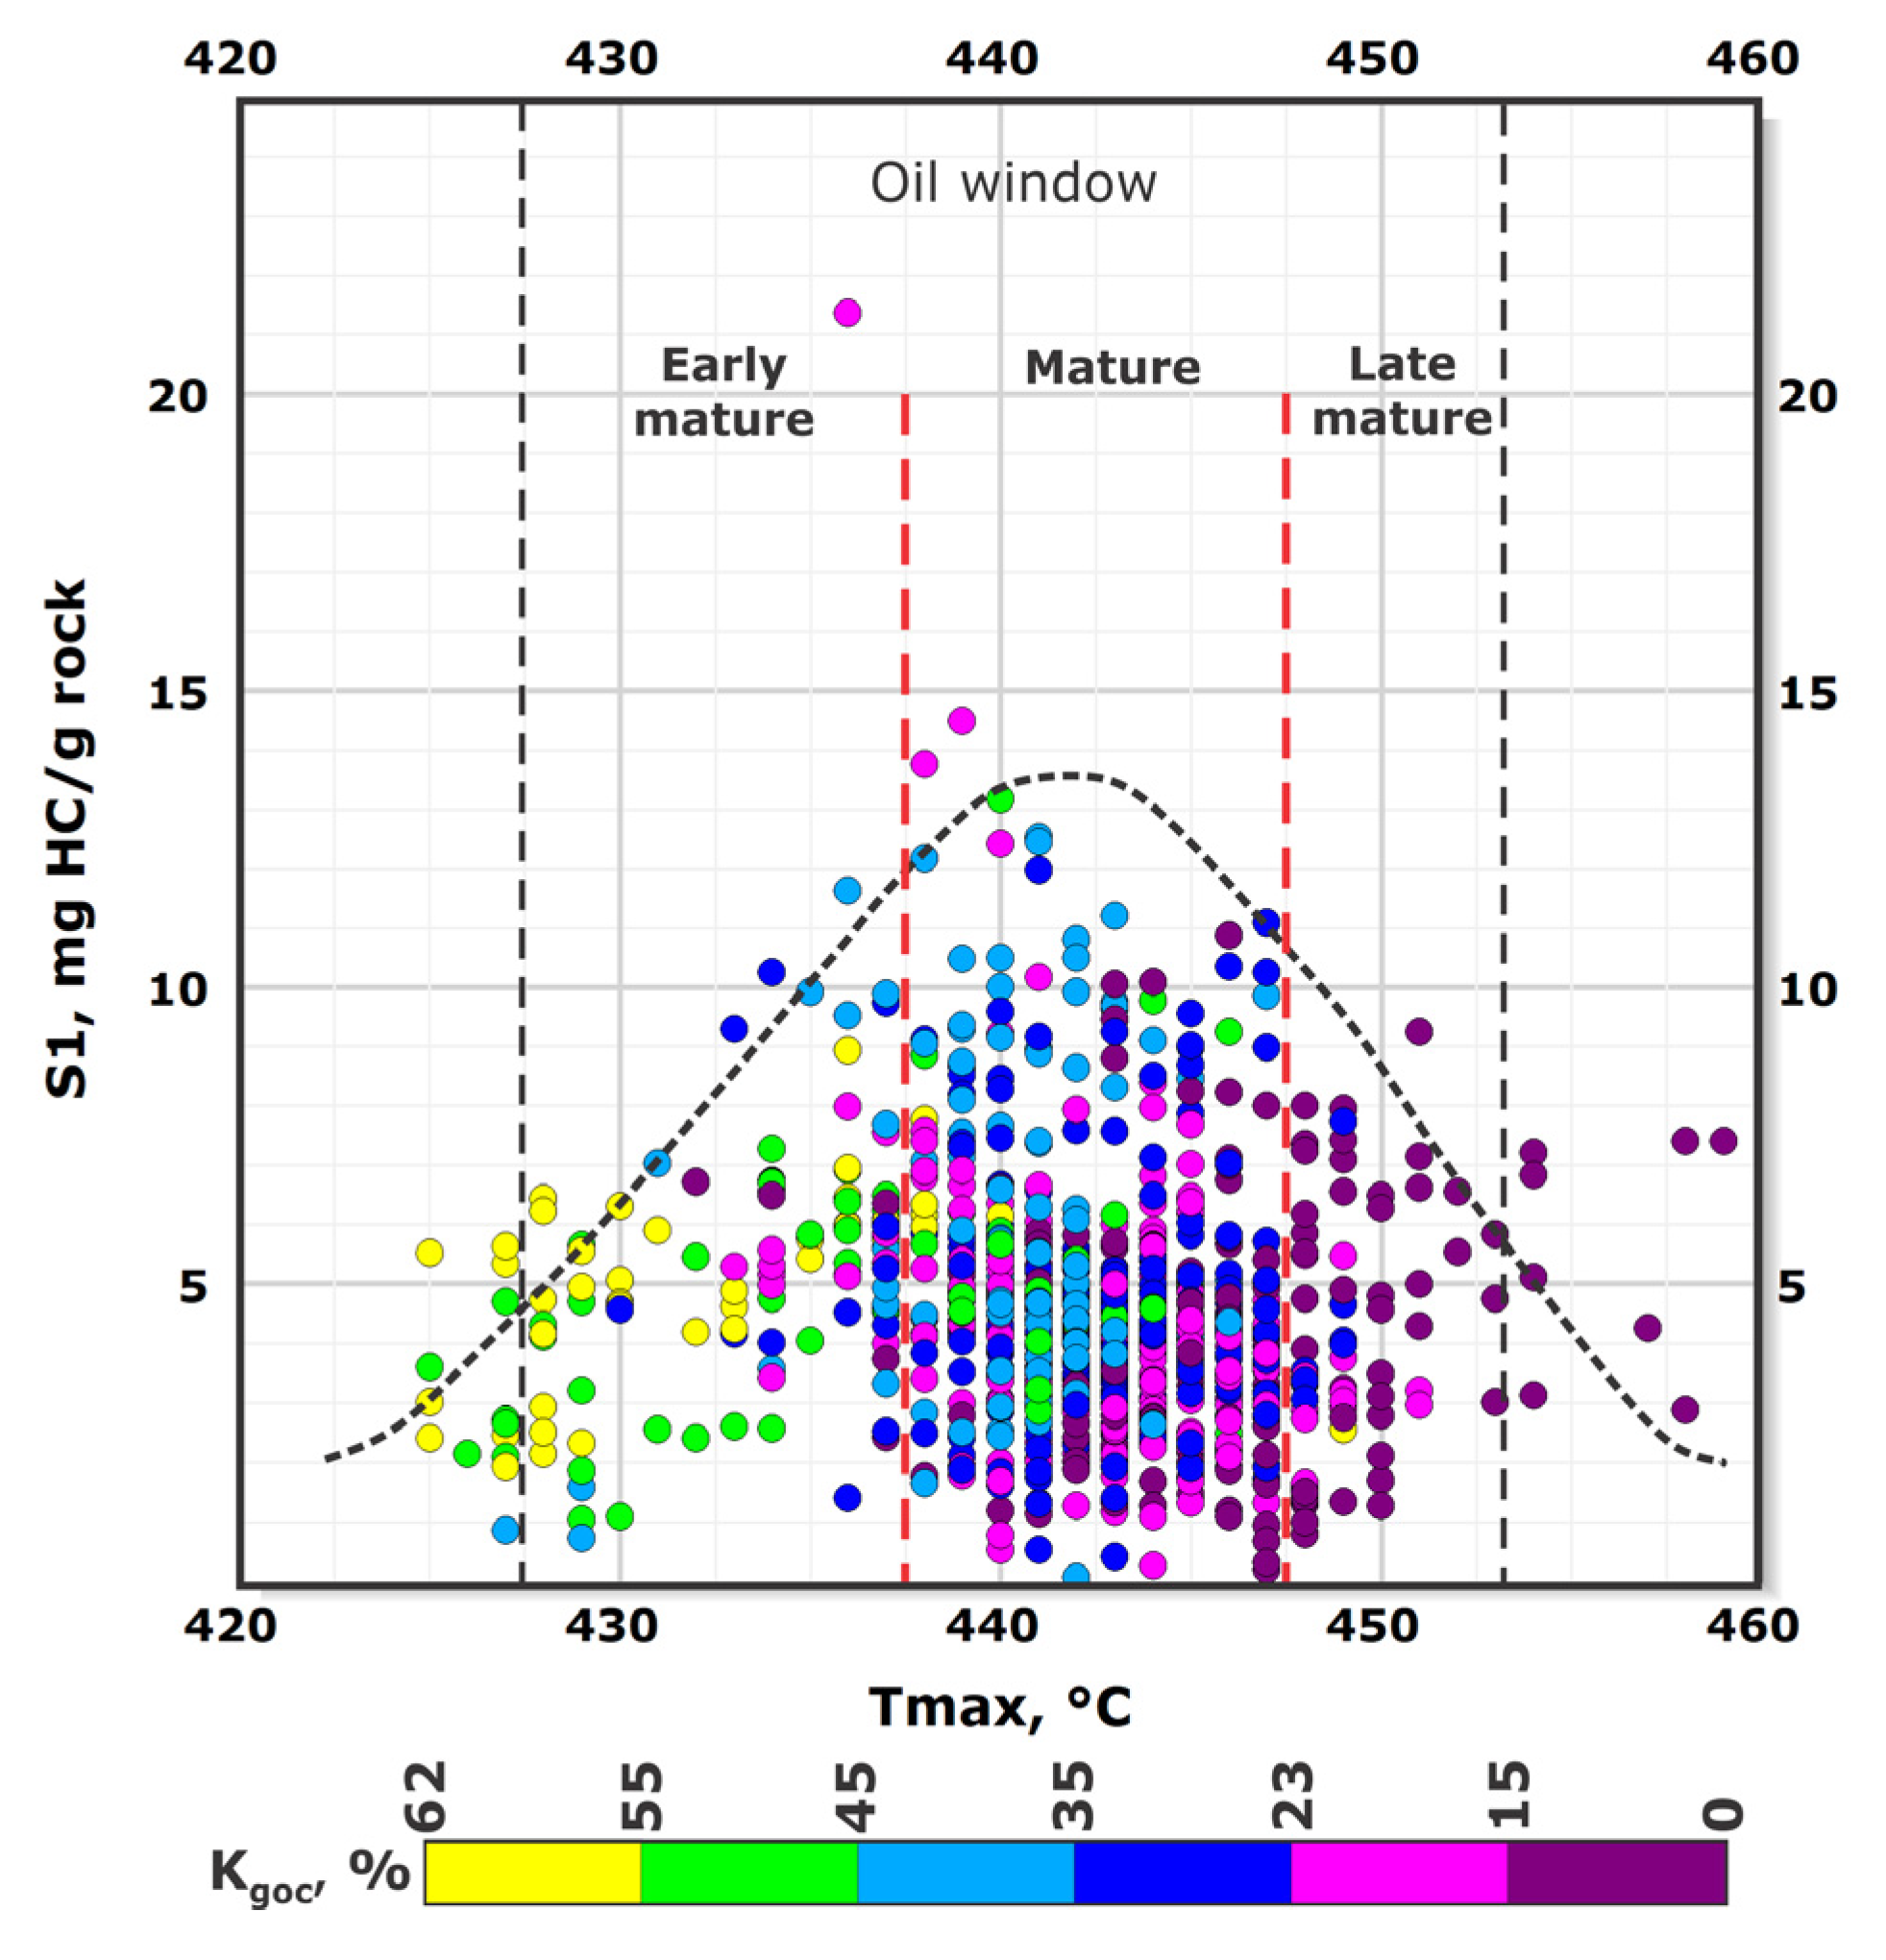
5.4. Relations between Thermal Maturity and Oil Saturation of the Rocks

Analysis of the relation between the maturity and oil saturation of rocks was carried out using the diagram (S0 + S1 + ΔS2) − S2ex (Figure 5). Similar to the previous diagrams, the color reflects the Kgoc value characterizing both the maturity and the degree of kerogen conversion to hydrocarbons.
The solid lines starting from the origin are calculated for various degrees of realization of the kerogen generation potential, determined by the ratio (S20 − S2ex)/S20, where S20 is the value of S2 for a given TOC at the initial stage of catagenesis. The horizontal axis (S0 + S1 + ΔS2) = 0 is the line reflecting the initial state of the system, and the vertical axis (S2 = 0) corresponds to the final state. The intermediate lines correspond to values of (S20 − S2ex)/S20 ranging from 0 to 1.
The dashed lines with a negative slope a–f represent both maturity trend and hydrocarbons loss. In the diagram (Figure 5), these lines reflect the evolution of the rock with TOC0 = 25 wt.% and S20 = 191.2 mg HC/g rock. The value of TOC0 was chosen based on the analysis of the diagram shown in Figure 4, where 25 wt.% is the maximum for the majority of the samples. The value of S20 was calculated by the formula discussed above S20 (mg HC/g rock) = 10 × Kgoc × TOC0 (wt.%)/CHC.
Before the beginning of hydrocarbon generation, the point reflecting the state of the system is located on the horizontal axis; and after the complete generation, it is located on the vertical axis. The intermediate position of points in the diagram depends on the transformation degree and the amount of migrated fluids loss. In the case of a closed system, the decrease in S2ex is accompanied by the equal increase of the sum (S0 + S1 + ΔS2), thus leading to the shift of the point with the initial value S20 along the line a, according to the equation (S0 + S1 + ΔS2) = S20 − S2ex. If the system loses mobile hydrocarbons due to migration, the trajectory will show a smaller slope to the horizontal axis following the equation (S0 + S1 + ΔS2) = (100% − Kloss) × (S20 − S2ex), where Kloss (%) is the proportion of the generated fluid that was lost.
The slope of the dashed lines af starting from the point S2 = 191.2 mg HC/g rock is determined by the maximum values of (S0 + S1 + ΔS2) for the samples at each maturity stage with corresponding Kgoc (the sets are shown in different colors, Figure 5). Therefore, the loss factor Kloss can be estimated. For the set of samples with the maximum percentage of generative kerogen (in yellow, 55% < Kgoc < 62%), the obtained straight line corresponds to the total hydrocarbon preservation in the rock. For the other sets of points, the fraction of the fluid loss increases according to (S0 + S1 + ΔS2) = (100% − Kloss) × (S20 − S2ex): Kloss = 52%—for 45 < Kgoc < 55 %, Kloss = 67% for 35 < Kgoc < 45%, Kloss = 75% for 23 < Kgoc < 35%, Kloss = 85% for 15 < Kgoc < 23%, and Kloss = 92% for 0 < Kgoc < 15%.
We observe that decreasing Kgoc leads to a decrease in the hydrocarbon preservation in rock. It is easy to show that the maximum hydrocarbon content in the rock corresponds to the group of points with minimal thermal maturity and maximal fluid preservation (45 < Kgoc < 62%). For rocks with a higher degree of kerogen conversion, the fluid is rapidly lost, and the volume of generated hydrocarbons does not exceed the rate of migration. At a low degree of organic matter transformation, we also expect low hydrocarbon volume in the rock due to a lower amount of already generated hydrocarbons; however, no such points are present in the analyzed sample set.
It should be emphasized that the present analysis was carried out using the sum of generated hydrocarbons, including gaseous (S0), liquid (S1), and heavy (ΔS2) hydrocarbons. From oil production point of view, it is more important to analyze the relationship between the catagenesis stage and the liquid hydrocarbon content (S1), the S1-Tmax plot is shown in Figure 6.
As it follows from Figure 6, the optimal values of Tmax, at which the maximum fluid saturation is maintained (up to 14 mg HC/g rock) for the Bazhenov Formation, are in the range of 438 ÷ 448 °C. At Tmax less than 438 °C, a sufficient amount of hydrocarbons is not yet formed in the rocks, and at Tmax above 448 °C, a significant loss in oil saturation is observed. On the conversion scale, the maximum content of liquid hydrocarbons corresponds to the range 23% < Kgoc < 45%. The difference from the estimation made above for the generated hydrocarbons content appears when we took into account ΔS2, which are heavy hydrocarbons that can be transformed into mobile liquid hydrocarbons at later stages of the system evolution.

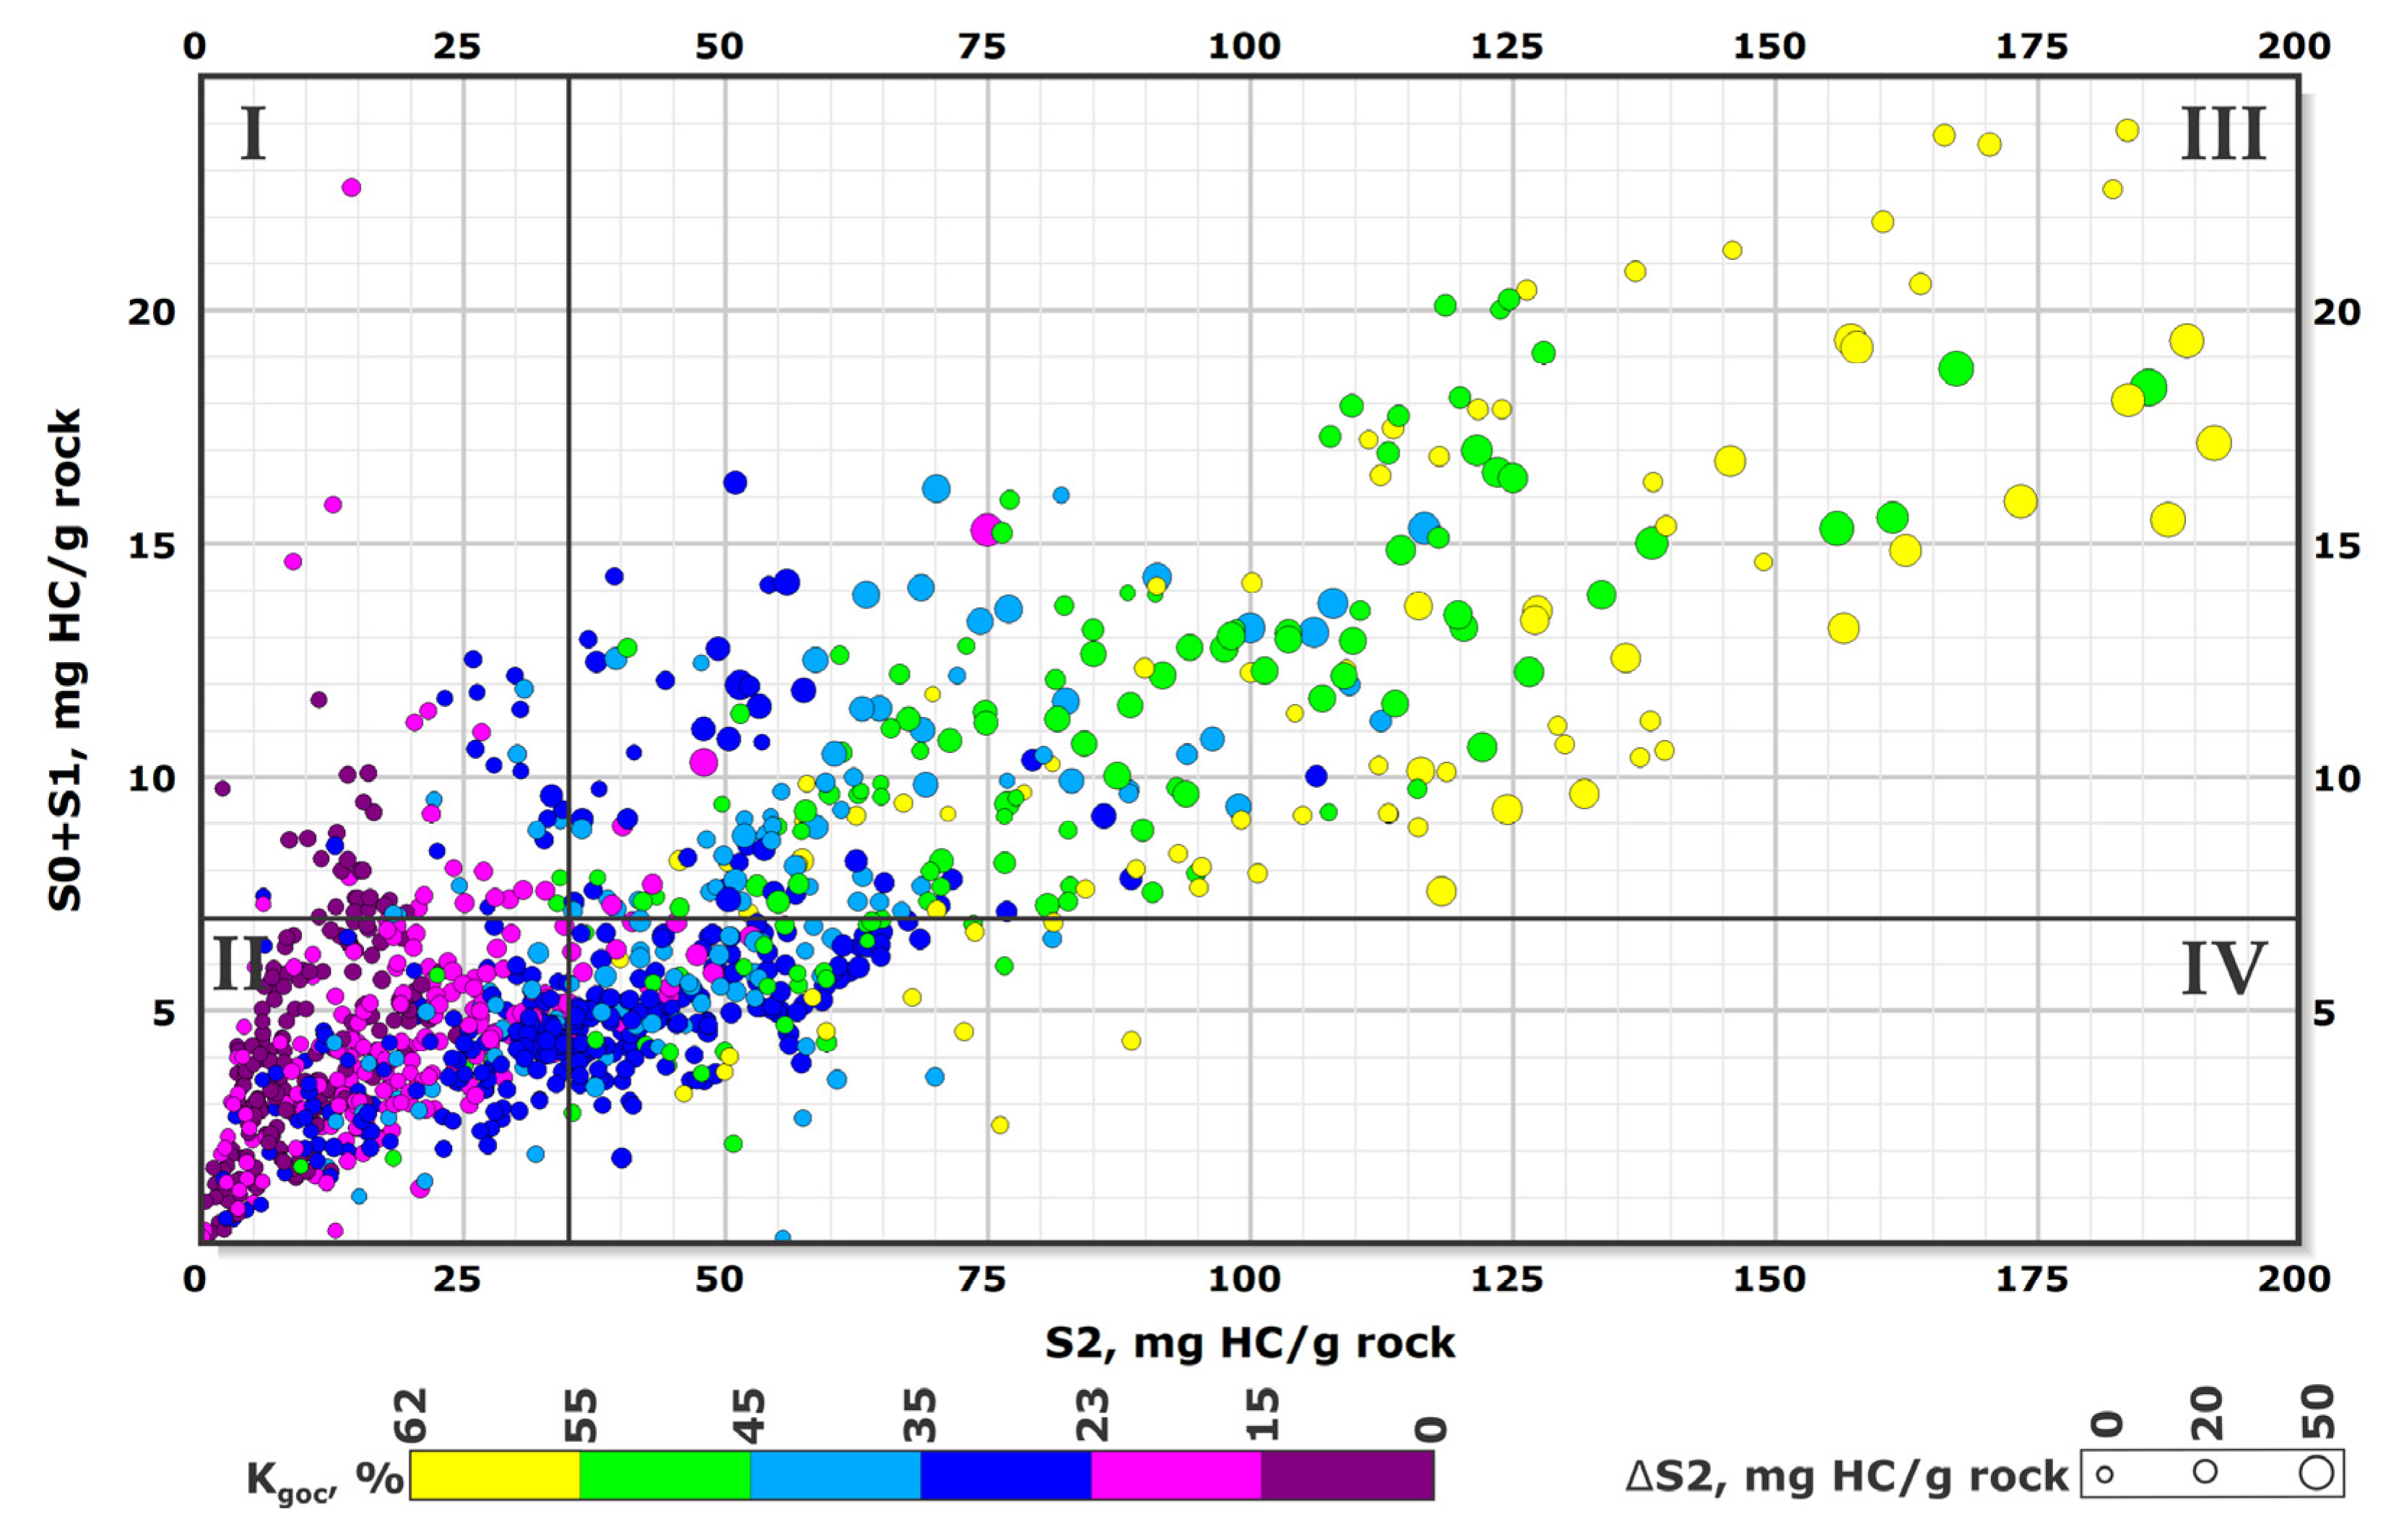
5.5. Identification of Potentially Productive Intervals According to Pyrolysis Studies

For conventional reservoirs, the identification of oil saturated intervals is performed using S1. The higher S1 is, the more promising in terms of production the interval is considered. For oil shale reservoirs, this criterion is not optimal because, in addition to the presence of mobile fluids, the interval should be also characterized by the increased reservoir properties. Lithological studies and production data for different oil shales including the data on the Bazhenov Formation oilfields show that the reservoir properties strongly depend on TOC content and kerogen maturity [13,24,53,54]. Reservoir properties are better developed for intervals with low TOC content due to increased primary intergranular porosity and increased maturity of organic matter caused by the development of secondary porosity during kerogen transformation [26,55,56,57]. Because the Bazhenov Formation rocks generally are low-permeable, the migration process predominantly involves nonpolar hydrocarbons, which are accumulated in intervals with better reservoir properties (including radiolarian intervals). Heavy hydrocarbons are less prone to migrate due to their higher viscosity and large molecular size; therefore, such hydrocarbons remain in the void space of the rock and further decrease permeability.
Based on analysis of data on the Bazhenov Formation (Figure 2, Figure 3, Figure 4, Figure 5 and Figure 6) we suggested the criteria for identification of potentially oil-productive intervals based on pyrolysis parameters. Intervals with low TOC content (<5 wt.%) are usually characterized by high oil saturation S1 (>7 mg HC/g rock) and low content of heavy oil fractions (ΔS2 < 20 mg HC/g rock). On the contrary, at high TOC values (>5 wt.%) especially in the case of low kerogen maturity (Kgoc > 35%), the rocks of unconventional reservoirs usually have ultra-low permeability because the pores existing in the mineral matrix are “sealed” by a high content of heavy oil fractions (ΔS2 > 20 mg HC/g rock). These intervals are not interesting from the point of view of mobile hydrocarbons production even in the case of high oil saturation S1 (>7 mg HC/g rock). However, they can be considered as promising for oil production using thermal enhanced oil recovery methods (EOR), which induces in situ conversion of kerogen (S2ex) and heavy oil fractions (ΔS2) into mobile hydrocarbons (S1). Thus, to assess the interval prospects, it is necessary to take into account both S1, ΔS2, TOC values, and kerogen maturity (Kgoc, HI, PI). The suggested pyrolysis criteria are listed in Table 2.
An example of the application of the criteria to the analysis of the studied Bazhenov Formation samples set is given in Figure 7, where the color of the points indicates the proportion of generative kerogen Kgoc, and the size of the points reflects the heavy hydrocarbon content (ΔS2).
We attribute the intervals falling into zone I to the group of accumulating intervals, characterized by increased oil saturation and better reservoir properties. In terms of production, these intervals are similar to tight rock reservoirs, for which hydraulic fracturing and multistage hydraulic fracturing technologies can be efficiently applied. The prospect of the intervals increases with decreasing Kgoc (shown in color) and ΔS2 (shown by point size).
The points in zone II are classified as conditionally productive. They differ from the intervals in zone I by lower oil saturation (S1) which may be associated with the partial loss of fluid during core recovery and storage. The promising intervals in zone II are characterized by higher values of S1, Kgoc and lower S2. As it follows from Figure 7, such points are located in the upper-left part of zone II. We suppose that up to 50% of samples falling into zone II represent the intervals with reservoir properties and oil saturation similar to those of intervals in zone I, and lower S1.
The points in zone III are classified as oil saturated source rocks and promising for the use of thermal EOR, promoting the conversion of kerogen and high-viscosity hydrocarbons into mobile hydrocarbons. The closer to the right and higher the point is, the more promising the interval is considered when using thermal EOR. The prospects of the interval increase with an increase in Kgoc (shown by color) and an increase in ΔS2 (shown by point size).
The points in zone IV belong to the category of nonproductive rocks, although these may include the intervals with a very low organic matter transformation degree, which may be promising for the use of thermal EOR in case of high TOC content.
To evaluate the distribution of intervals with different properties, we calculated the number of points falling into zones I–IV. The proportions of intervals for the whole Bazhenov and for the areas with different maturity are given in Table 3.
As it follows from Table 3, the percentage of oil saturated intervals with increased reservoir properties, which are promising for development by hydraulic fracturing technology, is 11% (zone I shown in Figure 7). Thirty-eight percent of intervals falling into zone II have the same reservoir properties as those in zone I, but lower oil saturation (S1). Taking into account possible losses of fluid during core recovery and storage, up to the half (19%) of points in zone II could be also considered as potentially productive.
We classify about 36% of the intervals as oil saturated rocks with very low permeability and high generation potential (zone III). These intervals could be considered as potentially productive in case of application of more complex recovery methods, including gas, chemical, and thermal EOR combined with hydraulic fracturing. The remaining 15% belong to nonproductive intervals (zone IV).
The distribution of the reported interval types varies by area in a strong connection with organic matter maturity. At the immature stage and the beginning of the oil window, the part of intervals in zone I is only several percent and the proportion of intervals in zone III reaches 70%. At the middle of the oil window, the part of intervals in zone I increases up to 14.5%, while the percent of intervals in zone III decreases to 12.5%. At the end of the oil window, the proportion of intervals in zone I is 36%, while the part of rocks in zone III is almost 0%. However, at end of the oil window, the retention of hydrocarbons in the reservoir decreases considerably due to migration of fluid when compared to the beginning of the oil window.

6. Conclusions

We have studied a representative sample collection (more than 3000 samples) from the productive area of the Bazhenov Formation located in the central part of the West Siberian Basin. Unified pyrolysis analyses of rock samples were performed before and after extraction with chloroform using the same methodology and equipment. The developed procedure has significantly improved the determination of standard pyrolysis characteristics and additional parameters, including the calculation of heavy hydrocarbons fraction content in the rocks.
The study allowed us to identify and analyze maturity trends for the Bazhenov Formation. In agreement with the previously obtained data for selected deposits, the analysis of the entire set of data provided quantitative characterization of the variability of rocks and organic matter characteristics, organic matter generation potential, the evolution of the source rock at different stages of catagenesis, and also allowed us to establish the proportion of the intervals of different productivity.
To summarize, in the current study we have obtained the following data on the Bazhenov Formation:
  • More than 98.5% of organic matter in the deposits belongs to type II kerogen with different maturity. Up to 1.5% of organic matter belongs to type I kerogen, with a higher initial generation potential;
  • More than 75% of the intervals of the Bazhenov Formation are characterized by “excellent” generation potential, 15% of the intervals have “very good” and “good”, the remaining 10% of deposits are at the end of oil generation and their generation potential is exhausted;
  • About 46% of the studied samples of the Bazhenov Formation correspond to the initial stage of oil generation, 46% belong to the middle of the oil window and about 8% belong to the end of the oil window;
  • We have established the quantitative relations between organic matter content and maturity. The maximum and average values of TOC at the beginning of oil generation are approximately two times higher than the ones at the end of the oil window. According to the obtained data, the ratio of generative and nongenerative kerogen for immature kerogen was estimated as 65% and 35%, respectively;
  • The content of generated hydrocarbons in rocks (light oil, heavy oil fractions and hydrocarbon gas) depends on maturity. The amount of hydrocarbons in reservoir increases due to hydrocarbon generation and decreases as the result of migration from the source rocks. The beginning of the kerogen transformation to hydrocarbons is characterized by almost complete preservation of newly formed hydrocarbons in pore space of rock (more than 90%), while at the peak of generation (the middle of the oil window) the proportion of the remaining hydrocarbons in the reservoir decreases to 30%, and at the end of the oil window this proportion drops down to 10% and below;
  • The maximum content of light and liquid hydrocarbons in the reservoir is observed for the rocks corresponding to the middle of the oil window (438 °C < Tmax < 448 °C), at the beginning and at the end of the oil window the content of these HC fractions is two or more times lower;
  • Using the obtained geochemical trends, we have suggested the criteria (Table 2) for the classification of rocks in terms of hydrocarbon production prospects and estimated the percentage of each type of intervals (Table 3 and further discussion) in dependence on the maturity level.
The study extends existing knowledge on hydrocarbon generation, migration and accumulation in the Bazhenov source rock formation. The analysis of geochemical trends allowed us to improve approaches for the productivity evaluation of the formation and study the effect of organic matter maturity on distribution of productive intervals of different types. The developed approaches for the interpretation of pyrolysis data can be applied for the characterization of other unconventional organic-rich formations; however, the geological, petrophysical and geochemical features of deposits should be taken into account.

Author Contributions

Conceptualization, M.S., E.K., N.M.; methodology, M.S., E.K., P.M., E.L., T.B.; software, P.M.; validation, M.S.; formal analysis, E.K., P.M., M.S., E.L.; investigation, E.K., T.B., P.M.; resources, N.M.; data curation, P.M.; writing—original draft preparation, M.S., E.K., P.M.; writing—review and editing, M.S., E.L., P.M.; visualization, P.M.; supervision, M.S.; project administration, E.K., M.S. All authors have read and agreed to the published version of the manuscript.

Funding

This research was supported by the Ministry of Science and Higher Education of the Russian Federation under agreement No. 075-10-2020-119 within the framework of the development program for a world-class Research Center.

Institutional Review Board Statement

Not applicable.

Informed Consent Statement

Not applicable.

Data Availability Statement

Data is not available.

Acknowledgments

The authors thank the Center for Hydrocarbon Recovery Laboratory members for technical support.

Conflicts of Interest

The authors declare no conflict of interest.

References

  1. Jarvie, D.M.; Hill, R.J.; Ruble, T.E.; Pollastro, R.M. Unconventional shale—Gas systems: The Mississippian Barnett Shale of north-central Texas as one model for thermogenic shale-gas assessment. AAPG Bull. 2007, 91, 475–499. [Google Scholar] [CrossRef]
  2. Hartwig, A.; di Primio, R.; Anka, Z.; Horsfield, B. Source rock characteristics and compositional kinetic models of Cretaceous organic rich black shales offshore southwestern Africa. Org. Geochem. 2012, 51, 17–34. [Google Scholar] [CrossRef]
  3. Jin, H.; Sonnenberg, S.A. Characterization for Source Rock Potential of the Bakken Shales in the Williston Basin, North Dakota and Montana. In Proceedings of the Unconventional Resources Technology Conference, Denver, CO, USA, 12–14 August 2013; pp. 117–126. [Google Scholar] [CrossRef]
  4. Raji, M.; Grocke, D.R.; Greenwell, C.; Cornford, C. Pyrolysis, Porosity and Productivity in Unconventional Mudstone Reservoirs: ‘Free’ and ‘Adsorbed’ Oil. In Proceedings of the Unconventional Resources Technology Conference, San Antonio, TX, USA, 20–22 July 2015; pp. 270–279. [Google Scholar] [CrossRef]
  5. Mani, D.; Patil, D.J.; Dayal, A.M.; Prasad, B.N. Thermal maturity, source rock potential and kinetics of hydrocarbon generation in Permian shales from the Damodar Valley basin, Eastern India. Mar. Pet. Geol. 2015, 66, 1056–1072. [Google Scholar] [CrossRef]
  6. Hunt, J.M. Petroleum Geochemistry and Geology; Wood Hole: San Francisco, CA, USA, 1979; ISBN 978-0716724414. [Google Scholar]
  7. Tissot, B.P.; Welte, D.H. Petroleum Formation and Occurrence, 2nd ed.; Springer: Berlin/Heidelber, Germany, 1984; ISBN 978-3-642-87815-2. [Google Scholar]
  8. Espitalie, J.; Marquis, F.; Barsony, I. Geochemical logging. In Analytical Pyrolysis—Techniques and Applications; Voorhees, K.J., Ed.; Butterworth-Heinemann: Boston, MA, USA, 1984; pp. 276–304. [Google Scholar]
  9. Espitalie, J.; Bordenave, M.L. Rock-Eval pyrolysis. In Applied Petroleum Geochemistry; Technip: Paris, France, 1993; pp. 237–361. [Google Scholar]
  10. Barbieri, M. Isotopes in Hydrology and Hydrogeology. Water 2019, 11, 291. [Google Scholar] [CrossRef] [Green Version]
  11. Lopatin, N.V.; Zubairaev, S.L.; Kos, I.M.; Emets, T.P.; Romanov, E.A.; Malchikhina, O.V. Unconventional oil accumulations in the Upper Jurassic Bazhenov black shale Formation, West Siberian Basin: A self-sourced reservoir system. J. Pet. Geol. 2003, 26, 225–244. [Google Scholar] [CrossRef]
  12. Jarvie, D.M. Shale resource systems for oil and gas: Part 1—Shale-gas resource systems. In AAPG Memoir 97, Shale Reservoirs—Giant Resources for the 21st Century; Breyer, J.A., Laubach, S.E., Eds.; AAPG: Tulsa, OK, USA, 2012; pp. 69–87. [Google Scholar] [CrossRef]
  13. Jarvie, D.M. Shale resource systems for oil and gas: Part 2—Shale-oil resource systems. In AAPG Memoir 97, Shale Reservoirs—Giant Resources for the 21st Century; Breyer, J.A., Laubach, S.E., Eds.; AAPG: Tulsa, OK, USA, 2012; pp. 89–119. [Google Scholar] [CrossRef]
  14. Maende, A.; Weldon, W.D. Pyrolysis and TOC Identification of Tight Oil Sweet Spots. In Proceedings of the Unconventional Resources Technology Conference, Denver, CO, USA, 12–14 August 2013; pp. 2573–2583. [Google Scholar] [CrossRef]
  15. Peters, K.E. Guidelines for evaluating petroleum source rock using programmed pyrolysis. AAPG Bull. 1986, 73, 318–329. [Google Scholar]
  16. Nesterov, I.I.; Ushatinsky, I.N.; Malykhin, A.Y.; Stavitsky, B.P.; Pyankov, B.N. Petroleum Productivity of Shale Rocks of West Siberia; Nedra: Moscow, Russia, 1987. (In Russian) [Google Scholar]
  17. Peters, K.E.; Kontorovich, A.E.; Moldowan, J.M. Geochemistry of Selected Oils and Rocks from the Central Portion of the West Siberian Basin, Russia. AAPG Bull. 1993, 77, 863–887. [Google Scholar]
  18. Kontorovich, A.E.; Moskvin, V.I.; Bostikov, O.I.; Danilova, V.P.; Fomin, A.N.; Fomichev, A.S.; Kostyreva, E.A.; Melenevsky, V.N. Main oil source formations of the West Siberian basin. Pet. Geosci. 1997, 3, 343–358. [Google Scholar] [CrossRef]
  19. Ulmishek, G.F. Petroleum geology and resources of the West Siberian Basin, Russia; U.S. Geological Survey Bulletin 2201-G; US Department of the Interior, US Geological Survey: Reston, VA, USA, 2003. [Google Scholar]
  20. Klett, T.R.; Schenk, C.J.; Brownfield, M.E.; Leathers-Miller, H.M.; Mercier, T.J.; Pitman, J.K.; Tennyson, M.E. Assessment of undiscovered continuous oil and shale-gas resources in the Bazhenov Formation of the West Siberian Basin Province, Russia. U.S.G.S. Fact Sheet No. 2016-3083. US Geol. 2016, 1–2. [Google Scholar] [CrossRef] [Green Version]
  21. Eder, V.G.; Zamirailova, A.G.; Yan, P.A. The regularities of the distribution of siliceous mudstones and “coccolith” member of the Bazhenov Formation. Russ. Geol. Geophys. 2017, 58, 416–424. [Google Scholar] [CrossRef]
  22. U.S. Energy Information Administration. Technically Recoverable Shale Oil and Shale Gas Resources: An Assessment of 137 Shale Formations in 41 Countries Outside the United States; U.S. Department of Energy: Washington, WA, USA, 2013. [Google Scholar]
  23. Kontorovich, A.E.; Burshtein, L.M.; Kazanenkov, V.A.; Kontorovich, V.A.; Kostyreva, E.A.; Ponomareva, E.V.; Ryzhkova, S.V.; Yan, P.A. The Bazhenov suite is the main reserve of unconventional oil in Russia. Georesur. Geoenerg. Geopolit. 2014, 2, 1–8. (In Russian) [Google Scholar]
  24. Alexeev, A.D. The Bazhenov Formation: In Search of Big Shale Oil in Upper Salym. Part 2. ROGTEC 2014, 2, 14–27. [Google Scholar]
  25. Khamidullin, R.A.; Kalmykov, G.A.; Korost, D.V.; Balushkina, N.S.; Bakai, A.I. The reservoir properties of the rocks of the bazhenovskaya formation. Mosc. Univ. Geol. Bull. 2013, 68, 310–317. [Google Scholar] [CrossRef]
  26. Vasiliev, A.L.; Pichkur, E.B.; Mikhutkin, A.A.; Spasennikh, M.J.; Bogdanovich, N.N.; Balushkina, N.S.; Kalmikov, G.A. The study of pore space morphology in kerogen from Bazhenov formation. OIJ 2015, 10, 28–31. [Google Scholar]
  27. Spasennykh, M.; Voropaev, A.; Kozlova, E.; Leushina, E.; Polyakov, V.; Vasiliev, A.; Bogdanovich, N.; Popov, Y.; Maximov, A. Organic Matter of Bazhenov Formation: Chemical and Isotope Composition, Microstructure, Thermal Maturation, Generation Potential and the Effect on Rock Properties. In Proceedings of the Sixth EAGE Shale Workshop, Bordeaux, France, 28 April–1 May 2019; pp. 1–5. [Google Scholar] [CrossRef]
  28. Mukhametdinova, A.; Karamov, T.; Bogdanovich, N.; Borisenko, S.; Rudakovskaya, S.; Cheremisin, A. Wettability of organic-rich source rocks: Case study on Bazhenov Formation (Abalak-Bazhenov group). Adv. Geosci. 2020, 54, 195–204. [Google Scholar] [CrossRef]
  29. Panchenko, I.V.; Nemova, V.D.; Smirnova, M.E.; Ilyina, M.V.; Baraboshkin, E.Y.; Ilyin, V.S. Stratification and detailed correlation of Bazhenov Horizon in the Central part of the Western Siberia according to lithological and paleontological core analysis and well logging. Oil Gas Geol. 2016, 6, 22–34. (In Russian) [Google Scholar]
  30. Petersen, J.A.; Clarke, J.W. Geology and hydrocarbon habitat of the West Siberian Basin. AAPG Stud. Geol. 1991, 32, 1–9. [Google Scholar] [CrossRef]
  31. Kontorovich, A.E.; Danilova, V.P.; Zamiraylova, A.G.; Zanin, Y.N.; Kostyreva, E.A.; Melenevskiy, V.N.; Moskvin, V.I.; Eder, V.G. Lithology, organic geochemistry, paleogeography, oil bearing capacity and petroleum-generating potential of the Bazhenovo Formation. In Proceedings of the 25th International Meeting on Organic Geochemistry, Interlaken, Switzerland, 18–23 September 2011. [Google Scholar]
  32. Korobova, N.I.; Makarova, O.M.; Kalmykov, G.A.; Petrakova, N.N.; Yurchenko, A.Y.; Sharafutdinov, V.F.; Korost, S.R.; Kalabin, V.V. The main types of sections of the oil-bearing Bazhenov Formation on the Northeastern Surgut Arch. Mosc. Univ. Geol. Bull. 2015, 70, 419–427. [Google Scholar] [CrossRef]
  33. Kontorovich, A.E.; Yan, P.A.; Zamirailova, A.G.; Kostyreva, E.A.; Eder, V.G. Classification of rocks of the Bazhenov Formation. Russ. Geol. Geophys. 2016, 57, 1606–1612. [Google Scholar] [CrossRef]
  34. Panchenko, I.V.; Sobolev, I.D.; Rogov, M.A.; Latyshev, A.V. Volcanic Tuffs and Tuffites in Jurassic–Cretaceous (Volgian–Ryazanian) Boundary Rocks of Western Siberia. Lithol. Miner. Resour. 2021, 56, 152–188. [Google Scholar] [CrossRef]
  35. Kozlova, E.V.; Fadeeva, N.P.; Kalmykov, G.A.; Balushkina, N.S.; Pronina, N.V.; Poludetkina, E.N.; Kostenko, O.V.; Yurchenko, A.Y.; Borisov, R.S.; Bychkov, A.Y.; et al. Geochemical technique of organic matter research in deposits enrich in kerogen (the Bazhenov Formation, West Siberia). Mosc. Univ. Geol. Bull. 2015, 70, 409–418. [Google Scholar] [CrossRef]
  36. Goncharov, I.V.; Samoilenko, V.V.; Oblasov, N.V. Prospects of Shale Oil Bazhenov Formation in the South-East of Western Siberia. In Proceedings of the SPE Russian Oil and Gas Exploration & Production Technical Conference and Exhibition, Moscow, Russia, 14–16 October 2014; pp. 1–11. [Google Scholar] [CrossRef]
  37. Kozlova, E.V.; Kalmykov, G.A.; Ganichev, D.I.; Balushkina, N.S. Forms of hydrocarbons in rocks of the Bazhen formation. Russ. Geophys. J. 2015, 3, 15–22. (In Russian) [Google Scholar]
  38. Volkov, V.A.; Oleynik, E.V.; Oksenoyd, E.E.; Sidorov, A.A. Structure and source potential of the Bazhenov formation in the central part of West Siberia. Geol. Miner. Resour. Sib. 2016, 3, 79–98. (In Russian) [Google Scholar] [CrossRef] [Green Version]
  39. Kontorovich, A.E.; Ponomareva, E.V.; Burshtein, L.M.; Glinskikh, V.N.; Kim, N.S.; Kostyreva, E.A.; Pavlova, M.A.; Rodchenko, A.P.; Yan, P.A. Distribution of organic matter in rocks of the Bazhenov Horizon (West Siberia). Russ. Geol. Geophys. 2018, 59, 357–371. [Google Scholar] [CrossRef]
  40. Kontorovich, A.E.; Bogorodskaya, L.I.; Borisova, L.S.; Burshtein, L.M.; Ismagilov, Z.P.; Efimova, O.S.; Kostyreva, E.A.; Lemina, N.M.; Ryzhkova, S.V.; Sozinov, S.A.; et al. Geochemistry and Catagenetic Transformations of Kerogen from the Bazhenov Horizon. Geochem. Int. 2019, 57, 621–634. [Google Scholar] [CrossRef]
  41. Goncharov, I.V.; Samoilenko, V.V.; Oblasov, N.V.; Fadeeva, S.V.; Veklich, M.A.; Kashapov, R.S.; Trushkov, P.V.; Bahtina, E.S. Types of organic matter and catagenesis of the Bazhenov formation and its same-aged analogues. OIJ 2016, 10, 20–25. (In Russian) [Google Scholar]
  42. Lopatin, N.P.; Emets, T.P. Pyrolysis in Oil and Gas Geology; Galimov, E.M., Ed.; Nauka: Moscow, Russia, 1987. (In Russian) [Google Scholar]
  43. Bulatov, T.; Kozlova, E.; Leushina, E.; Panchenko, I.; Pronina, N.; Voropaev, A.; Morozov, N.; Spasennykh, M. Alginite-Rich Layers in the Bazhenov Deposits of Western Siberia. Geosciences 2021, 11, 252. [Google Scholar] [CrossRef]
  44. Fomin, A.N. Catagenesis of Organic Matter and Petroleum Potential of the Mesozoic (Jurassic, Triassic) and Paleozoic Sediments of the West Siberian Megabasin; IPGG SB RAS: Novosibirsk, Russia, 2011. (In Russian) [Google Scholar]
  45. Vassoevich, N.B. Origin of petroleum. Mosc. Univ. Geol. Bull. 1975, 5, 3–23. [Google Scholar]
  46. Langford, F.F.; Blanc-Valleron, M.M. Interpreting Rock-Eval pyrolysis data using graphs of pyrolyzable hydrocarbons vs total organic carbon. AAPG Bull. 1990, 74, 799–804. [Google Scholar]
  47. Espitalie, J. Use of Tmax as a maturation index for different types of organic matter: Comparison with vitrinite reflectance. In Thermal Modeling in Sedimentary Basins, Proceedings of Meeting: 1st IFP Exploration Research Conference, Carcans, France, 3–7 June 1985; Burrus, J., Ed.; Technip: Paris, France, 1986; Volume 44, pp. 475–496. [Google Scholar]
  48. Wüst, R.A.; Cook, J. Vitrinite Reflectance Versus Pyrolysis Tmax Data: Assessing Thermal Maturity in Shale Plays with Special Reference to the Duvernay Shale Play of the Western Canadian Sedimentary Basin. In Proceedings of the SPE Unconventional Resources Conference and Exhibition-Asia Pacific, Brisbane, Australia, 11–13 November 2013. [Google Scholar] [CrossRef] [Green Version]
  49. Behar, F.; Beaumont, V.; Penteado, H.D.B. Rock-Eval 6 Technology: Performances and Developments. Oil Gas Sci. Technol. Rev. IFP 2001, 56, 111–134. [Google Scholar] [CrossRef]
  50. Pronina, N.V.; Vaitekhovich, A.P. Direct signs of oil-generation in the rocks of Bazhenov Suite. Georesources 2021, 23, 152–157. [Google Scholar] [CrossRef]
  51. Peters, K.E.; Walters, C.C.; Moldowan, J.M. The Biomarker Guide, 1st ed.; Cambridge University Press: Cambridge, UK, 1993; p. 1155. [Google Scholar]
  52. Bulatov, T.; Kozlova, E.; Spasennykh, M.; Leushina, E. Specific Layers Containing Highly Oil-Prone Organic Matter in the Bazhenov Formation. In Proceedings of the 29th International Meeting on Organic Geochemistry, Gothenburg, Sweden, 1–6 September 2019; pp. 1–2. [Google Scholar] [CrossRef]
  53. Skvortsov, M.B.; Dakhnova, M.V.; Mozhegova, S.V.; Kirsanov, A.M.; Komkov, I.K.; Paizanskaya, I.L. Geochemical methods for prediction and assessment of shale oil resources (case study of Bazhenov Formation). Russ. Geol. Geophys. 2017, 58, 495–503. [Google Scholar] [CrossRef]
  54. Karpov, Y.A.; Balushkina, N.S.; Stupakova, A.V.; Fomina, M.M.; Topchii, M.S.; Miftakhova, A.A.; Kalmykov, A.G.; Kalmykov, G.A. The Criteria for the Occurrence of Oil-Producing Rocks of the Bazhenovskaya Highly Carbonaceous Formation with an Evolved System of Kerogen Pore Capacity. Mosc. Univ. Geol. Bull. 2019, 74, 285–296. [Google Scholar] [CrossRef]
  55. Kalmykov, A.G.; Karpov, Y.A.; Topchiy, M.S.; Fomina, M.M.; Manuilova, E.A.; Sheremeteva, E.V.; Tretyakova, I.O.; Pronina, N.V.; Shishkov, V.A.; Balushkina, N.S.; et al. The effect of catagenetic maturity on the formation of reservoirs with organic porosity in the Bazhenov formation and peculiarities of their extension. Georesources 2019, 21, 159–171. [Google Scholar] [CrossRef]
  56. Postnikova, O.V.; Postnikov, A.V.; Zueva, O.A.; Kozionov, A.E.; Milovanova, E.V.; Savinova, L.A. Types of Void Space in the Bazhenov Reservoir Rocks. Geosciences 2021, 11, 269. [Google Scholar] [CrossRef]
  57. Nemova, V.D.; Pogodaeva, A.M.; Kim, O.O.; Matyukhina, T.A. Petrophysica characteristics of the Late Jurassic—Early Cretaceous productive levels of the Sredne-Nazym field. Pet. Geol. Theor. Appl. Stud. 2020, 15, 1–16. [Google Scholar] [CrossRef]
Figure 1. The Bazhenov Formation map with marked location of the studied areas and simplified lithostratigraphic column. Legend: 1—Bazhenov Horizon boundary; 2—Bazhenov Formation boundary; 3—studied field; 4—city; 5—river; 6—claystone; 7—limestone; 8—siliceous claystone; 9—organic-rich siliceous rocks with low clay content; 10—radiolarite; 11—organic-rich siliceous rocks; 12—organic-rich carbonate-clayey-siliceous rocks; 13—organic-rich clayey-siliceous rocks with pyrite (modified after Panchenko et al., 2021 [34]).
Geosciences 11 00307 g001
Figure 2. Characteristics of the generation potential of the Bazhenov Formation deposits. The color indicates the proportion of generative kerogen Kgoc = (GOCex/TOCex) × 100, %.
Geosciences 11 00307 g002
Figure 3. Modified van Krevelen diagram for the studied sample collection. Values of HIex and Tmaxex were determined for samples after extraction with chloroform. The color indicates the proportion of generative kerogen Kgoc = (GOCex/TOCex) × 100, %. Lines divide samples into: I—type I kerogen, II—type II kerogen, III—type III kerogen.
Geosciences 11 00307 g003
Figure 4. S2ex-TOCex diagram for the studied sample collection. The color indicates the proportion of generative kerogen Kgoc. The calculated maturity trends are drawn as solid and dashed lines. Straight solid lines reflect different values of kerogen conversion GOC/TOC0: 1—65%; 2—55%; 3—45%; 4—35%; 5—25%; 6—15%, 7—5%. Dashed curves reflect maturity trends for the samples with initial values of TOC0 equal to a—15, b—20, c—25, d—30, e—35, f—40 wt.%.
Geosciences 11 00307 g004
Figure 5. S0 + S1 + ΔS2 − S2ex diagram for the studied samples. The color indicates the proportion of generative kerogen Kgoc. The calculated maturity trends are drawn as solid and dashed lines. Solid lines illustrate the different degrees of realization of the kerogen generation potential (1 − S2ex/S20): 1—0.1; 2—0.2; 3—0.3; 4—0.4; 5—0.6; 6—0.8. Dashed lines limit the different percentage of fluid loss Kloss: a—0%; b—52%, c—67%, d—75%, e—85%, f—92%.
Geosciences 11 00307 g005
Figure 6. Cross-plot of the amount of generated hydrocarbon fluid (S1) and temperature Tmax illustrating the relations between maturity and fluid saturation of the rocks. The color indicates the proportion of generative kerogen Kgoc.
Geosciences 11 00307 g006
Figure 7. The S0 + S1 − S2 diagram. The color indicates the proportion of generative kerogen Kgoc, the size of the points reflects the content of ΔS2, and the areas indicate the development prospects. Lines divide plot into four zones: I—zone I, II—zone II, III—zone III, IV—zone IV.
Geosciences 11 00307 g007
Table 1. Characteristic ranges of pyrolysis parameters for the Bazhenov Formation (BF) samples at different maturity stages.
Maturity StageCatagenesis Stage 1Number of
Samples
Share in the BF
Section, %
TmaxHITmaxexHIexKgoc
ImmaturePC3-MC142222425 ÷ 438500 ÷ 700430 ÷ 440400 ÷ 75045 ÷ 62
Early oil
window
MC1–246424436 ÷ 441425 ÷ 550434 ÷ 444350 ÷ 55035 ÷ 45
Middle oil windowMC287446439 ÷ 445200 ÷ 450436 ÷ 450100 ÷ 45015 ÷ 35
Late oil
window
MC31498440 ÷ 455<200444 ÷ 46650 ÷ 1503 ÷ 15
1 According to Vassoevich et al., 1975 [45] and Kozlova et al., 2015 [35].
Table 2. Pyrolysis characteristics of productive intervals in the Bazhenov formation.
Productive Intervals FeaturesPossible Method of DevelopmentTOCS1S2ΔS2Kgoc
wt.%mg HC/g Rock%
Increased oil saturation,
Increased reservoir properties
Hydraulic
fracturing
Low
<5%
High
>7
Low
<35
Low
<20
Low
<35
High generation potential of kerogen, Increased heavy oil fractions contentThermal
EOR
High
>5%
High
>7
High
>35
High
>20
High
>35
Table 3. Distribution of the studied samples over the identified production approaches zones. The estimations are given for each maturity stage.
Oil Generation StageKgoc, %Number of SamplesInterval Occurrence Estimated from Number of Samples
Zone IZone IIZone IIIZone IV
Beginning of
generation
45 ÷ 624222.5%18%70.5%9%
Early oil
window
35 ÷ 454645%19.5%61.5%14%
Middle oil
window
15 ÷ 3587414.5%52%12.5%21%
Late oil
window
0 ÷ 1514936%64%0%0%
Total for BF190911%38%36%15%
Publisher’s Note: MDPI stays neutral with regard to jurisdictional claims in published maps and institutional affiliations.

