
Ice Core Chronologies from the Antarctic Peninsula: The Palmer, Jurassic, and Rendezvous Age-Scales

 , , ,
, , ,
Abstract
:1. Introduction
2. Data and Methods
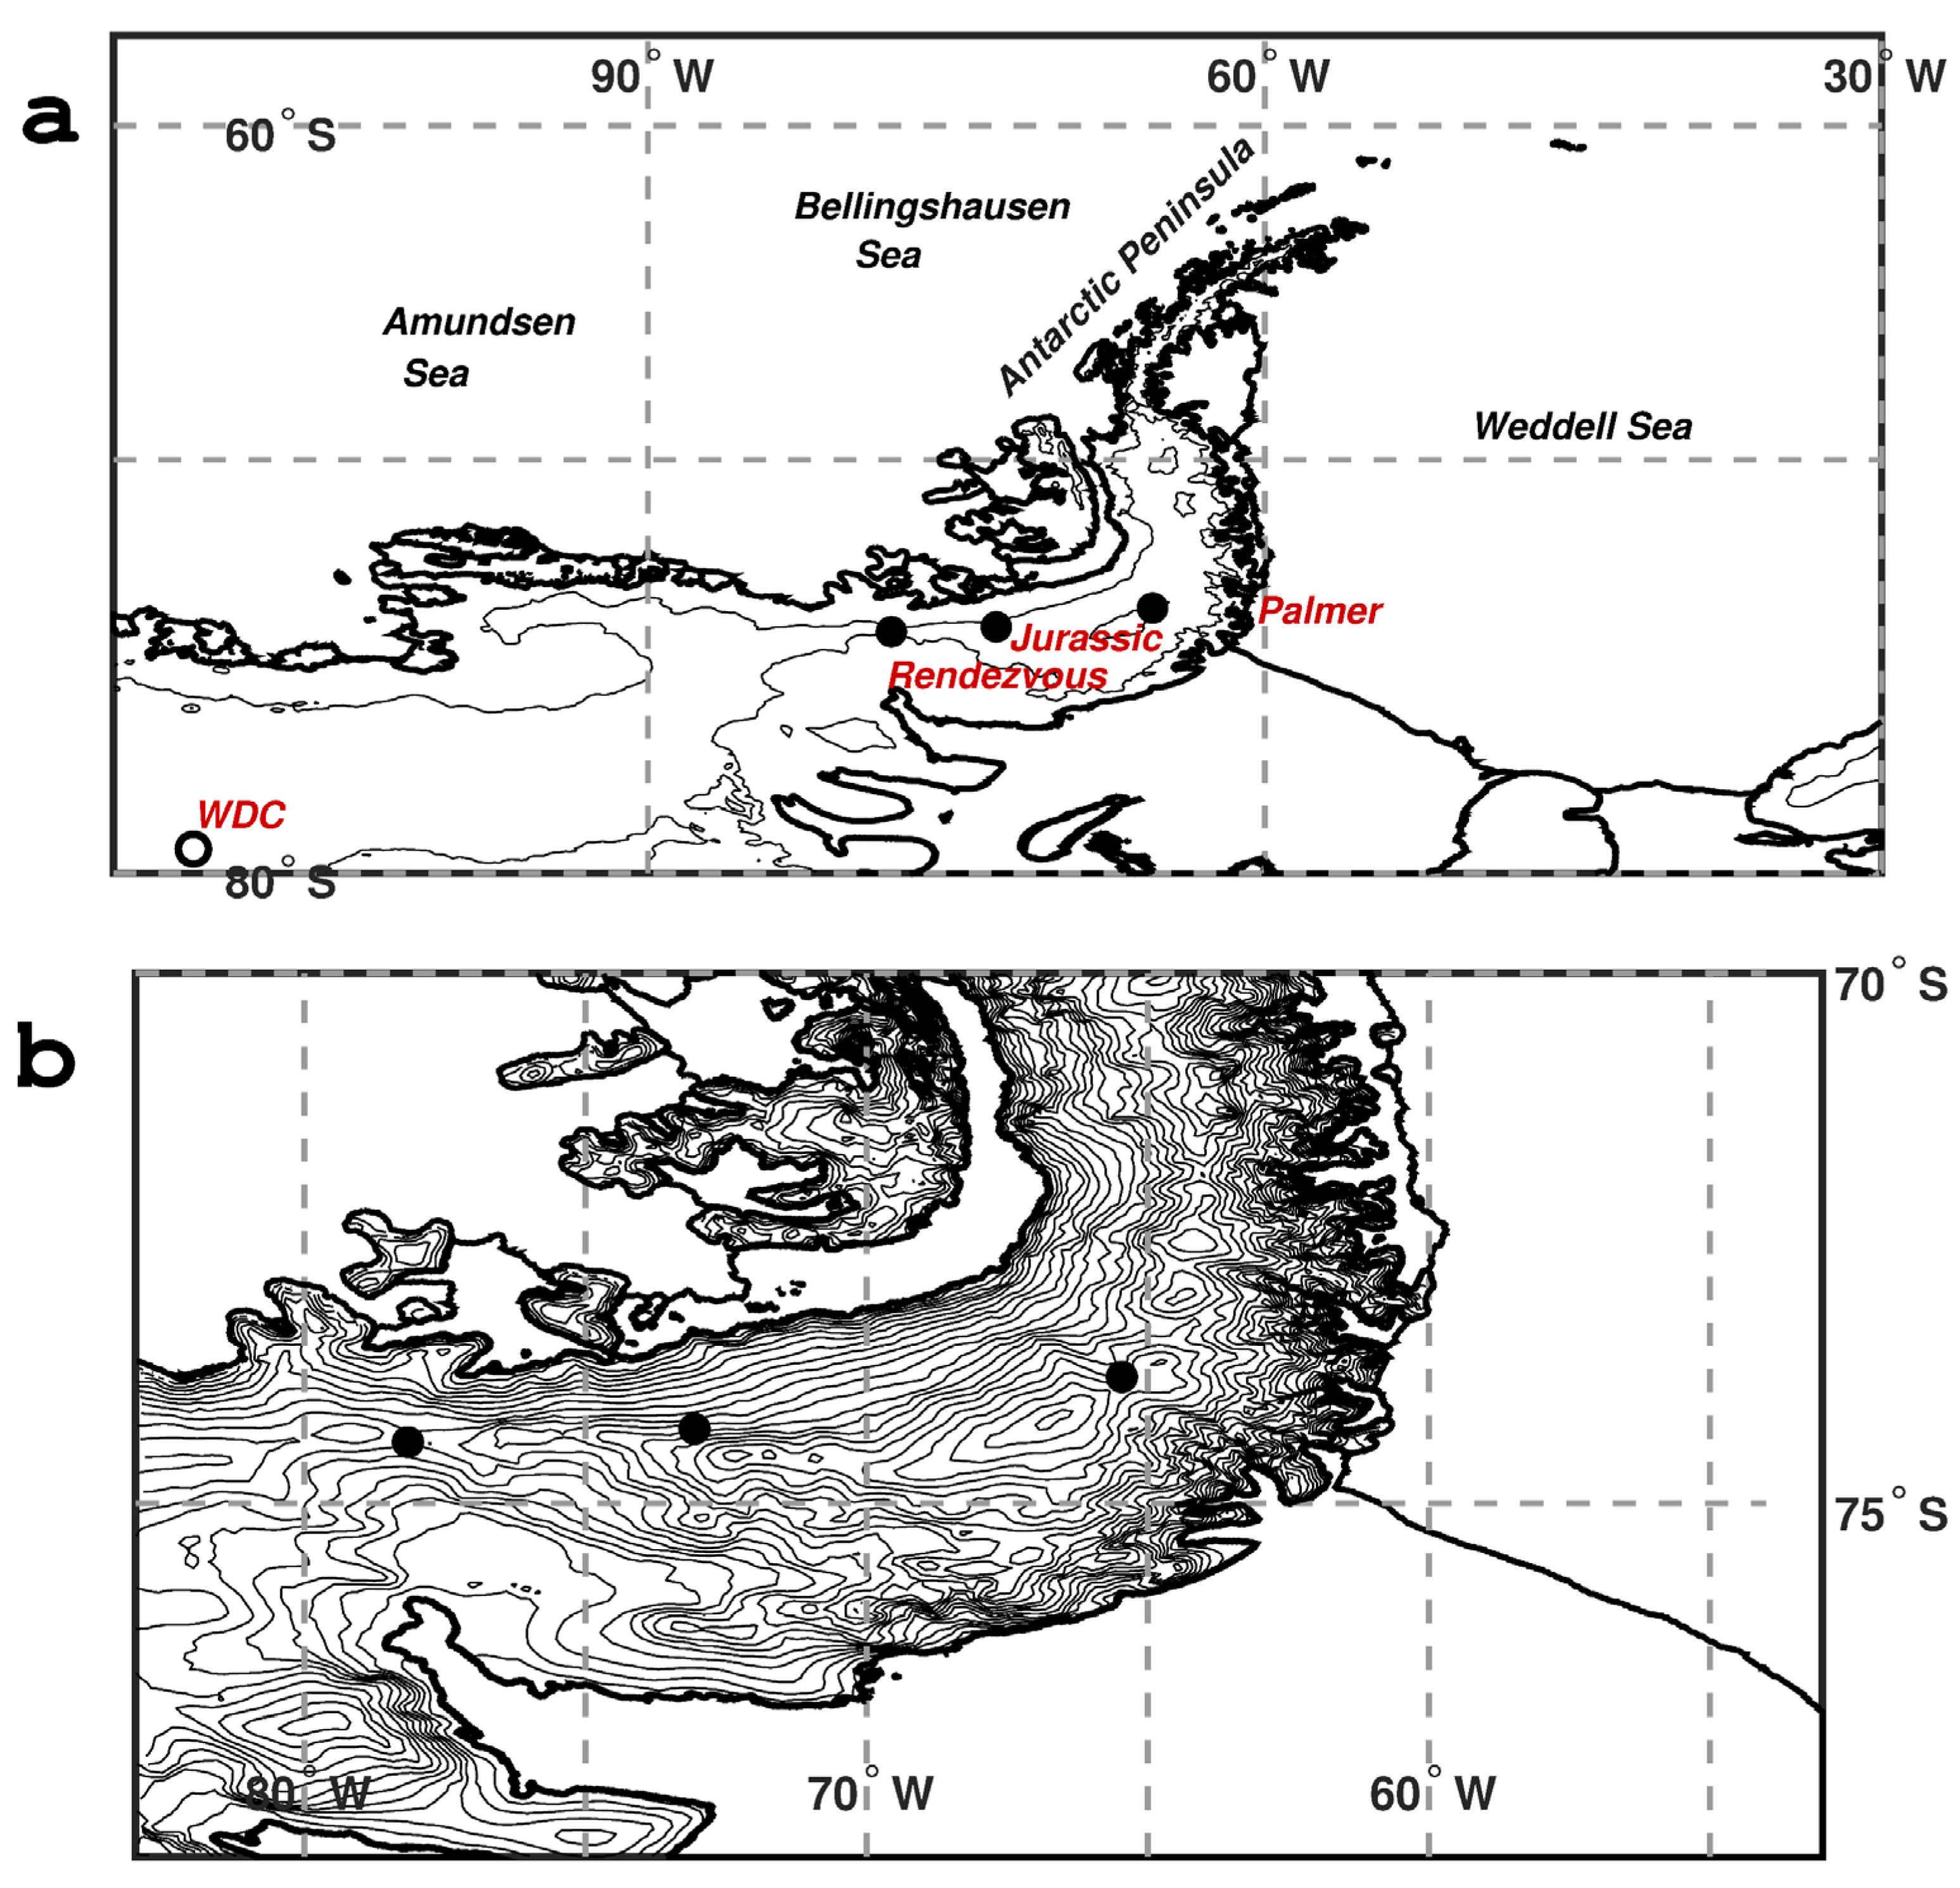
2.1. Drill Sites
2.2. Datasets
2.2.1. Chemistry Data
2.2.2. Water Stable Isotope Records
2.3. Methods
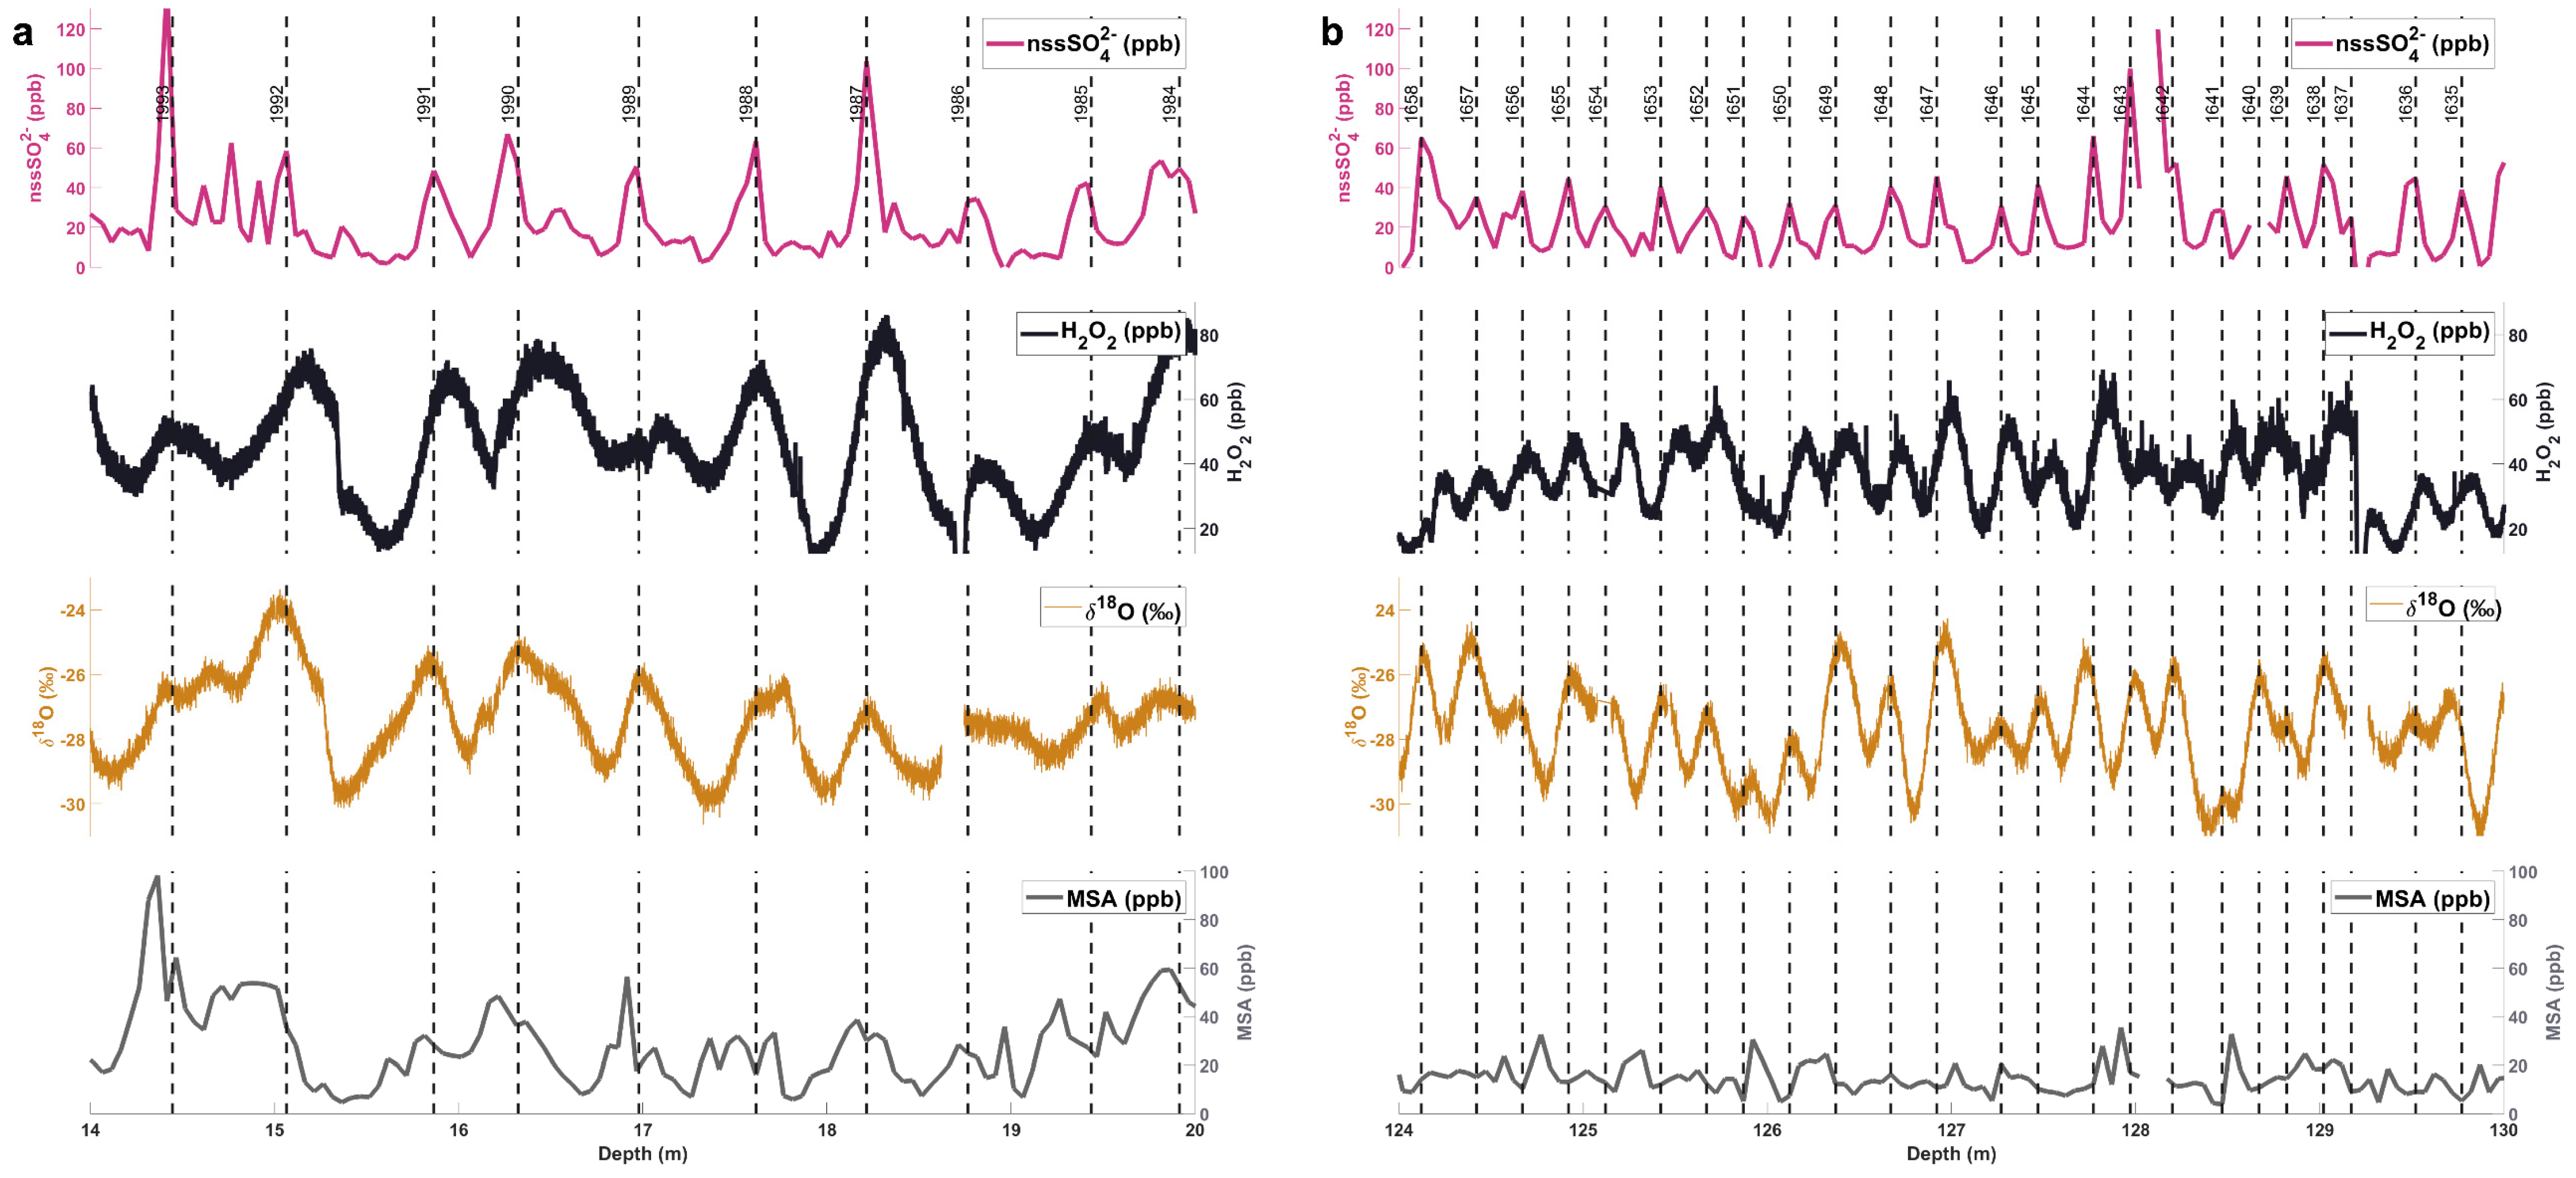
2.3.1. Annual-Layer Counting
2.3.2. Defining Volcanic Horizons
3. Results and Discussion
3.1. Age Scales
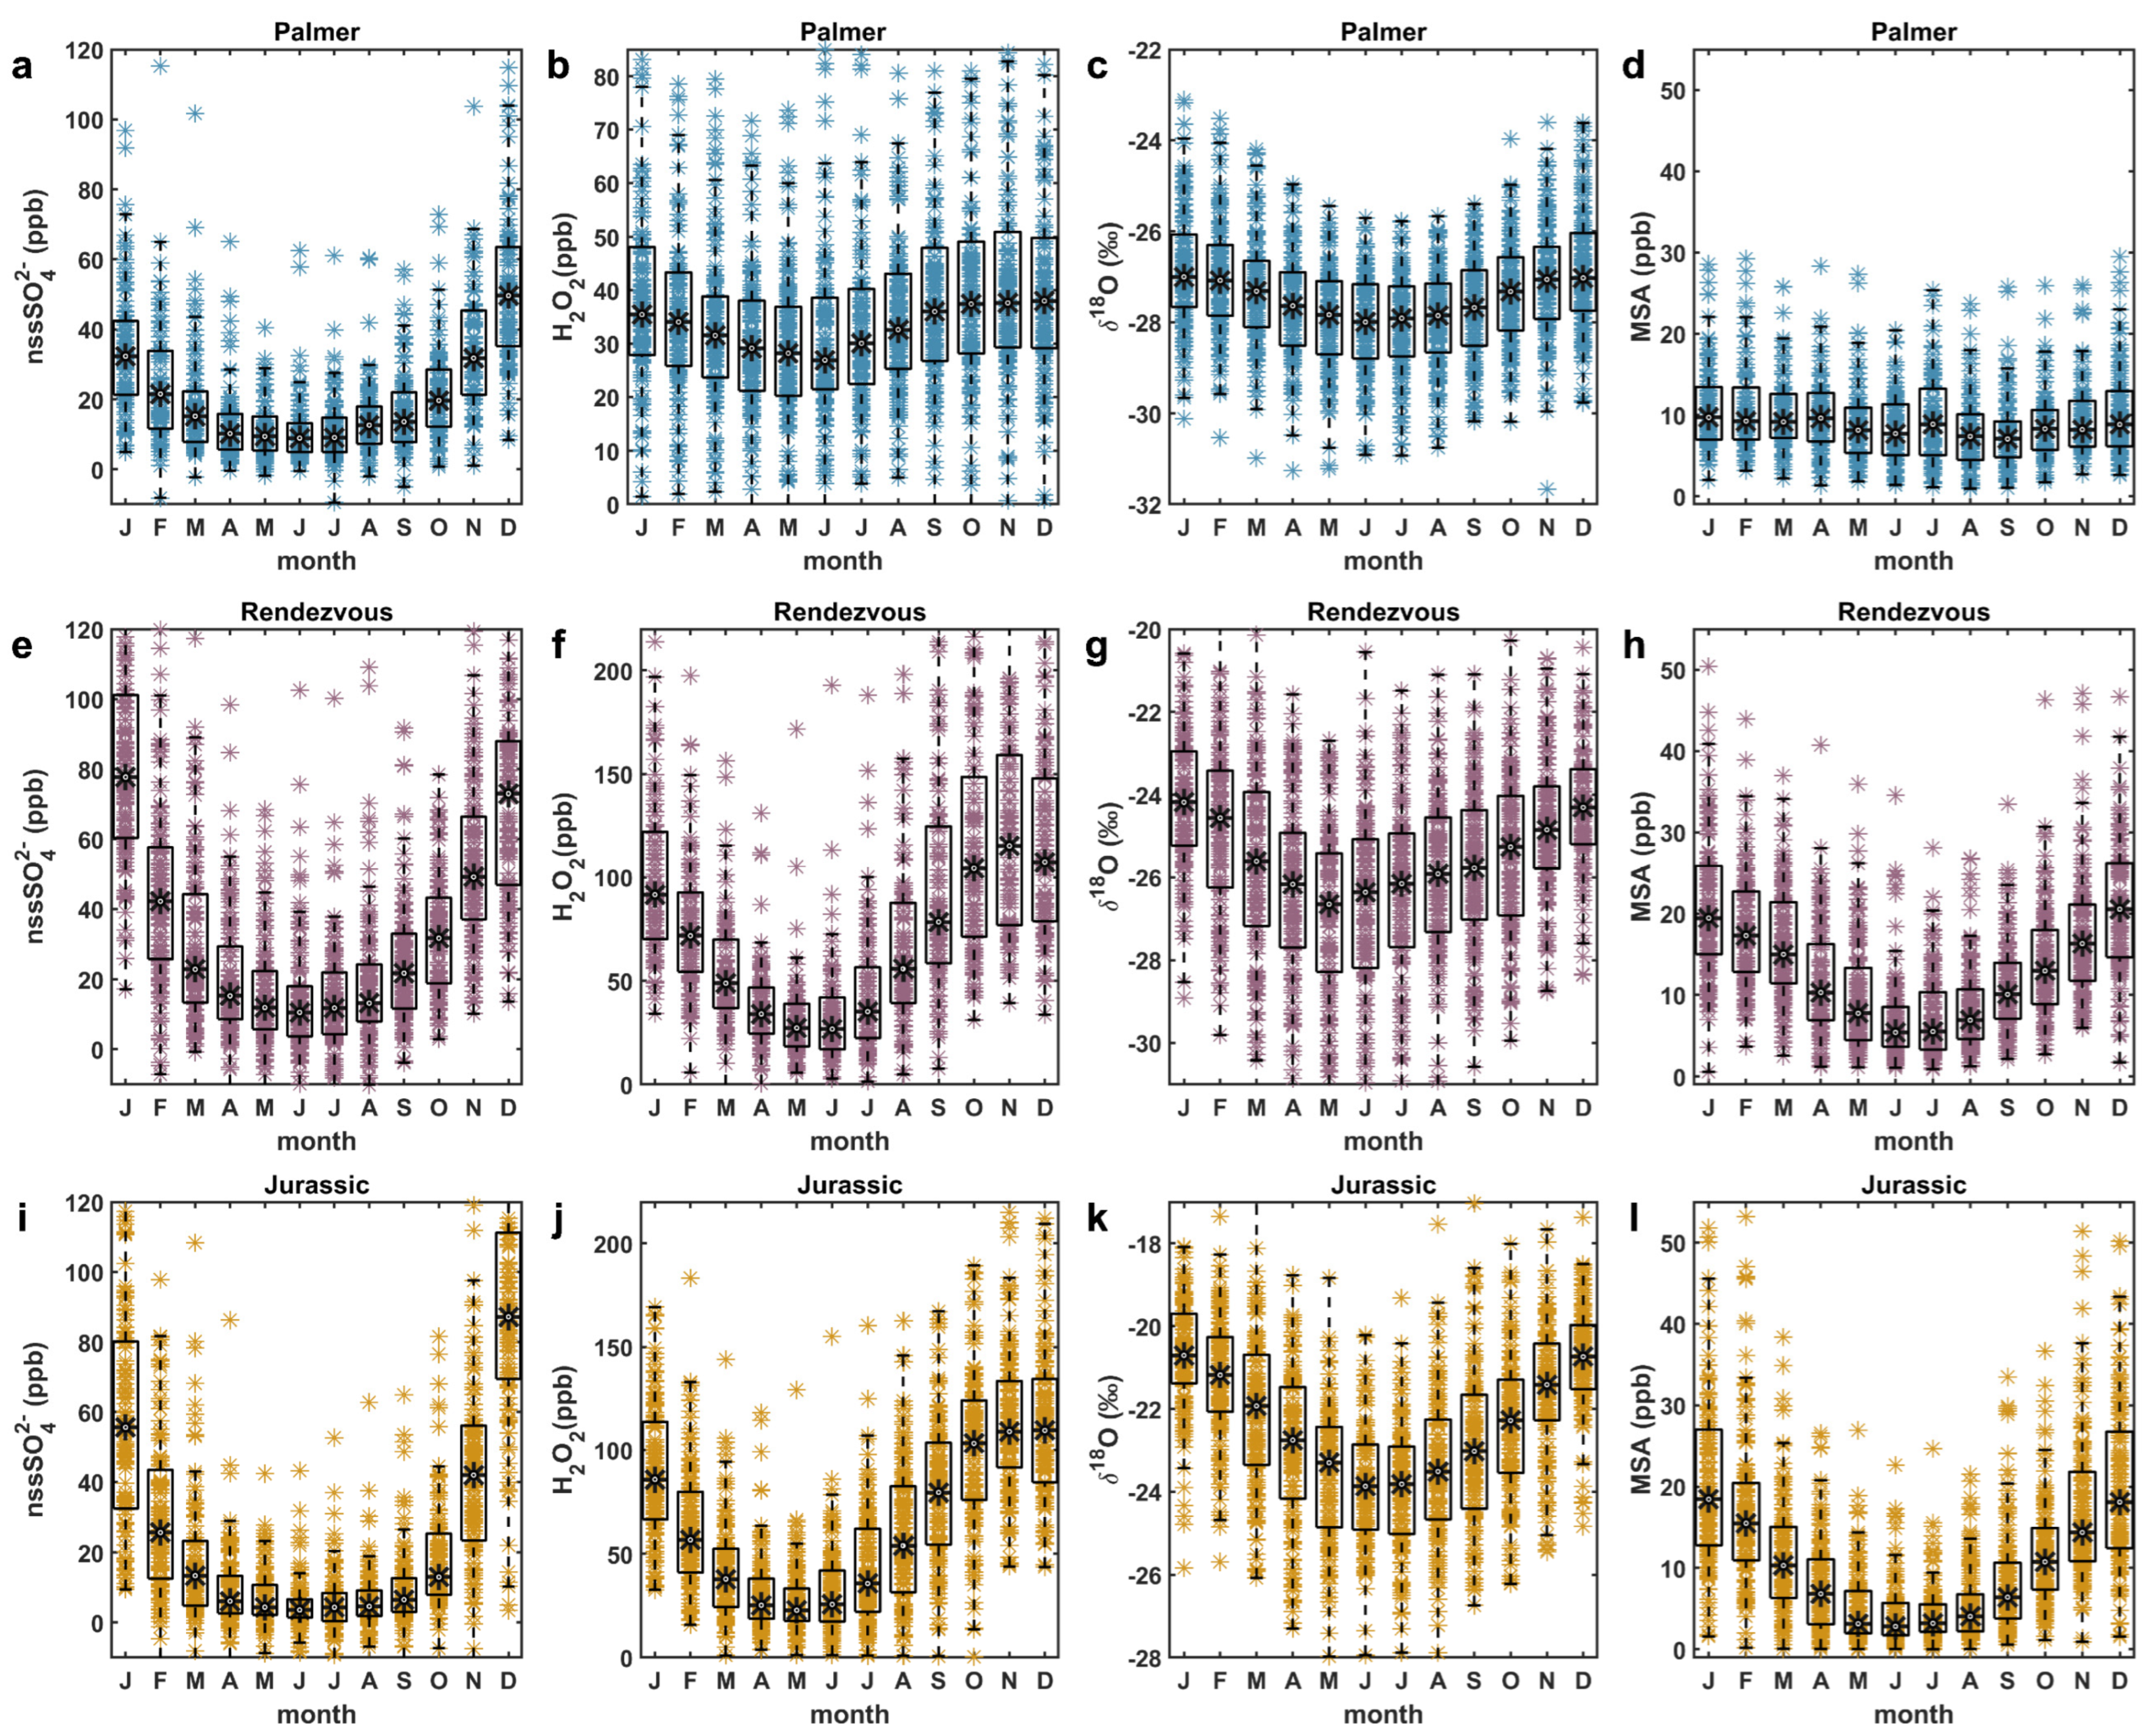
3.1.1. Seasonality
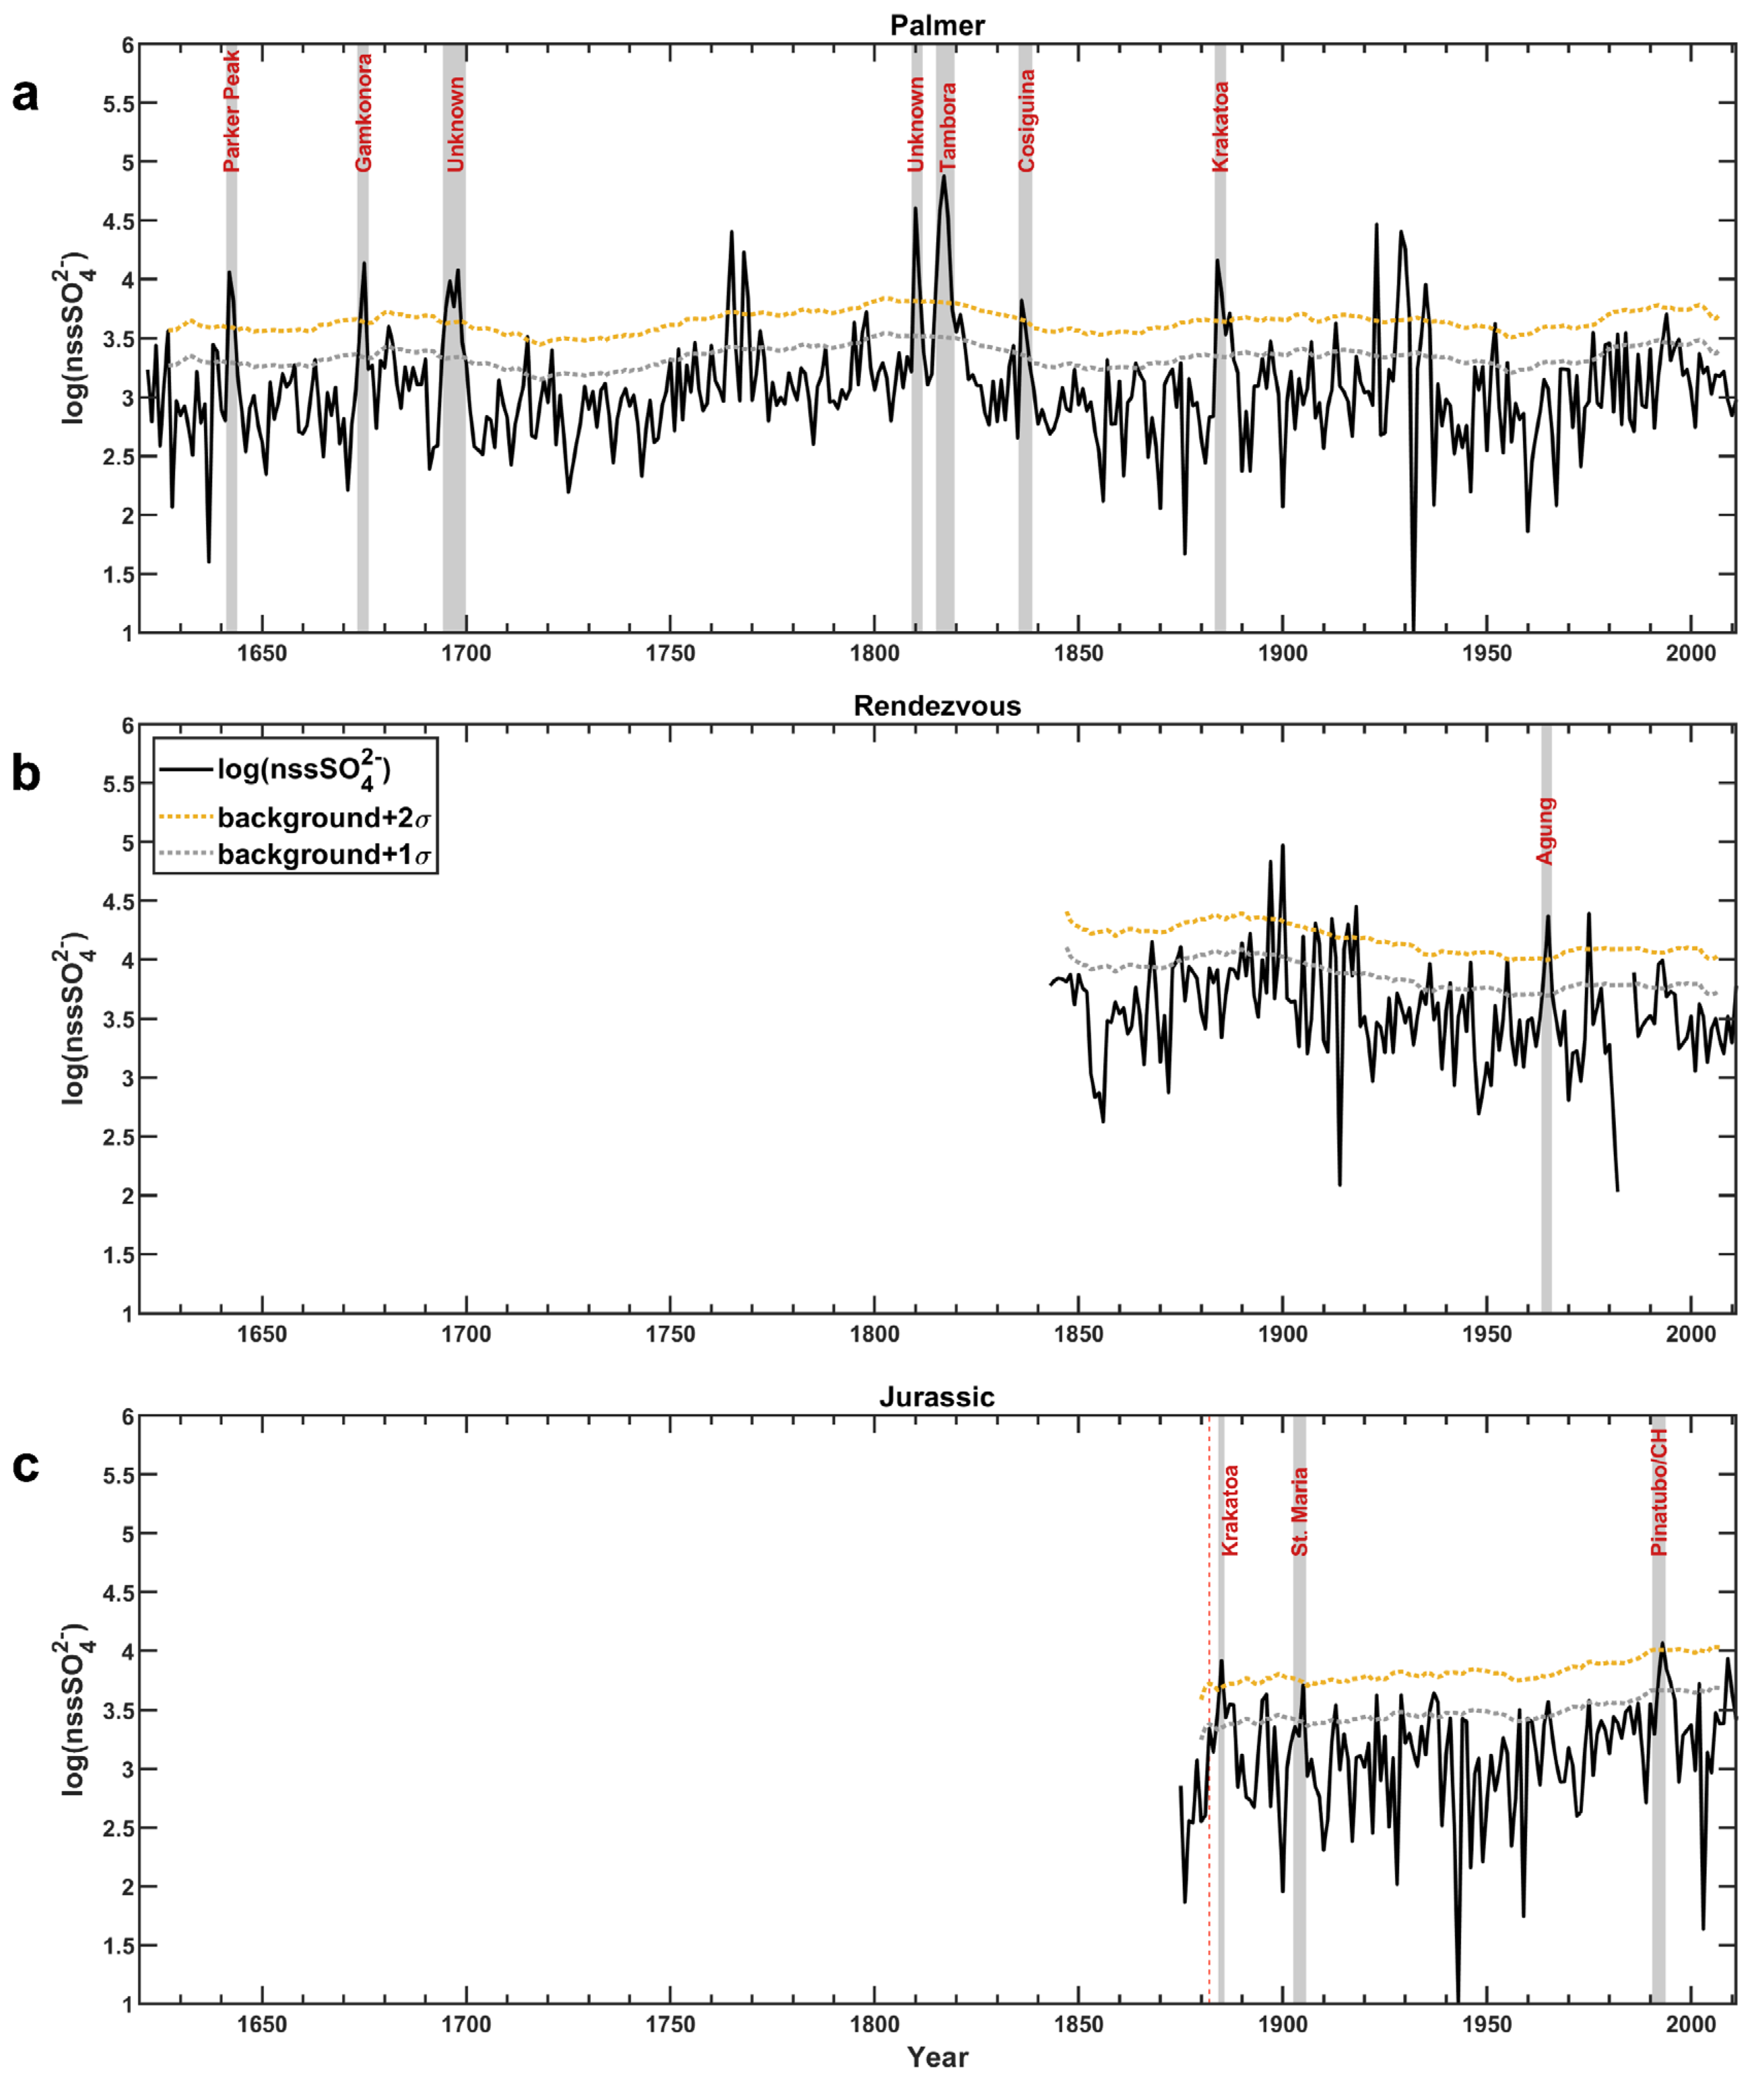
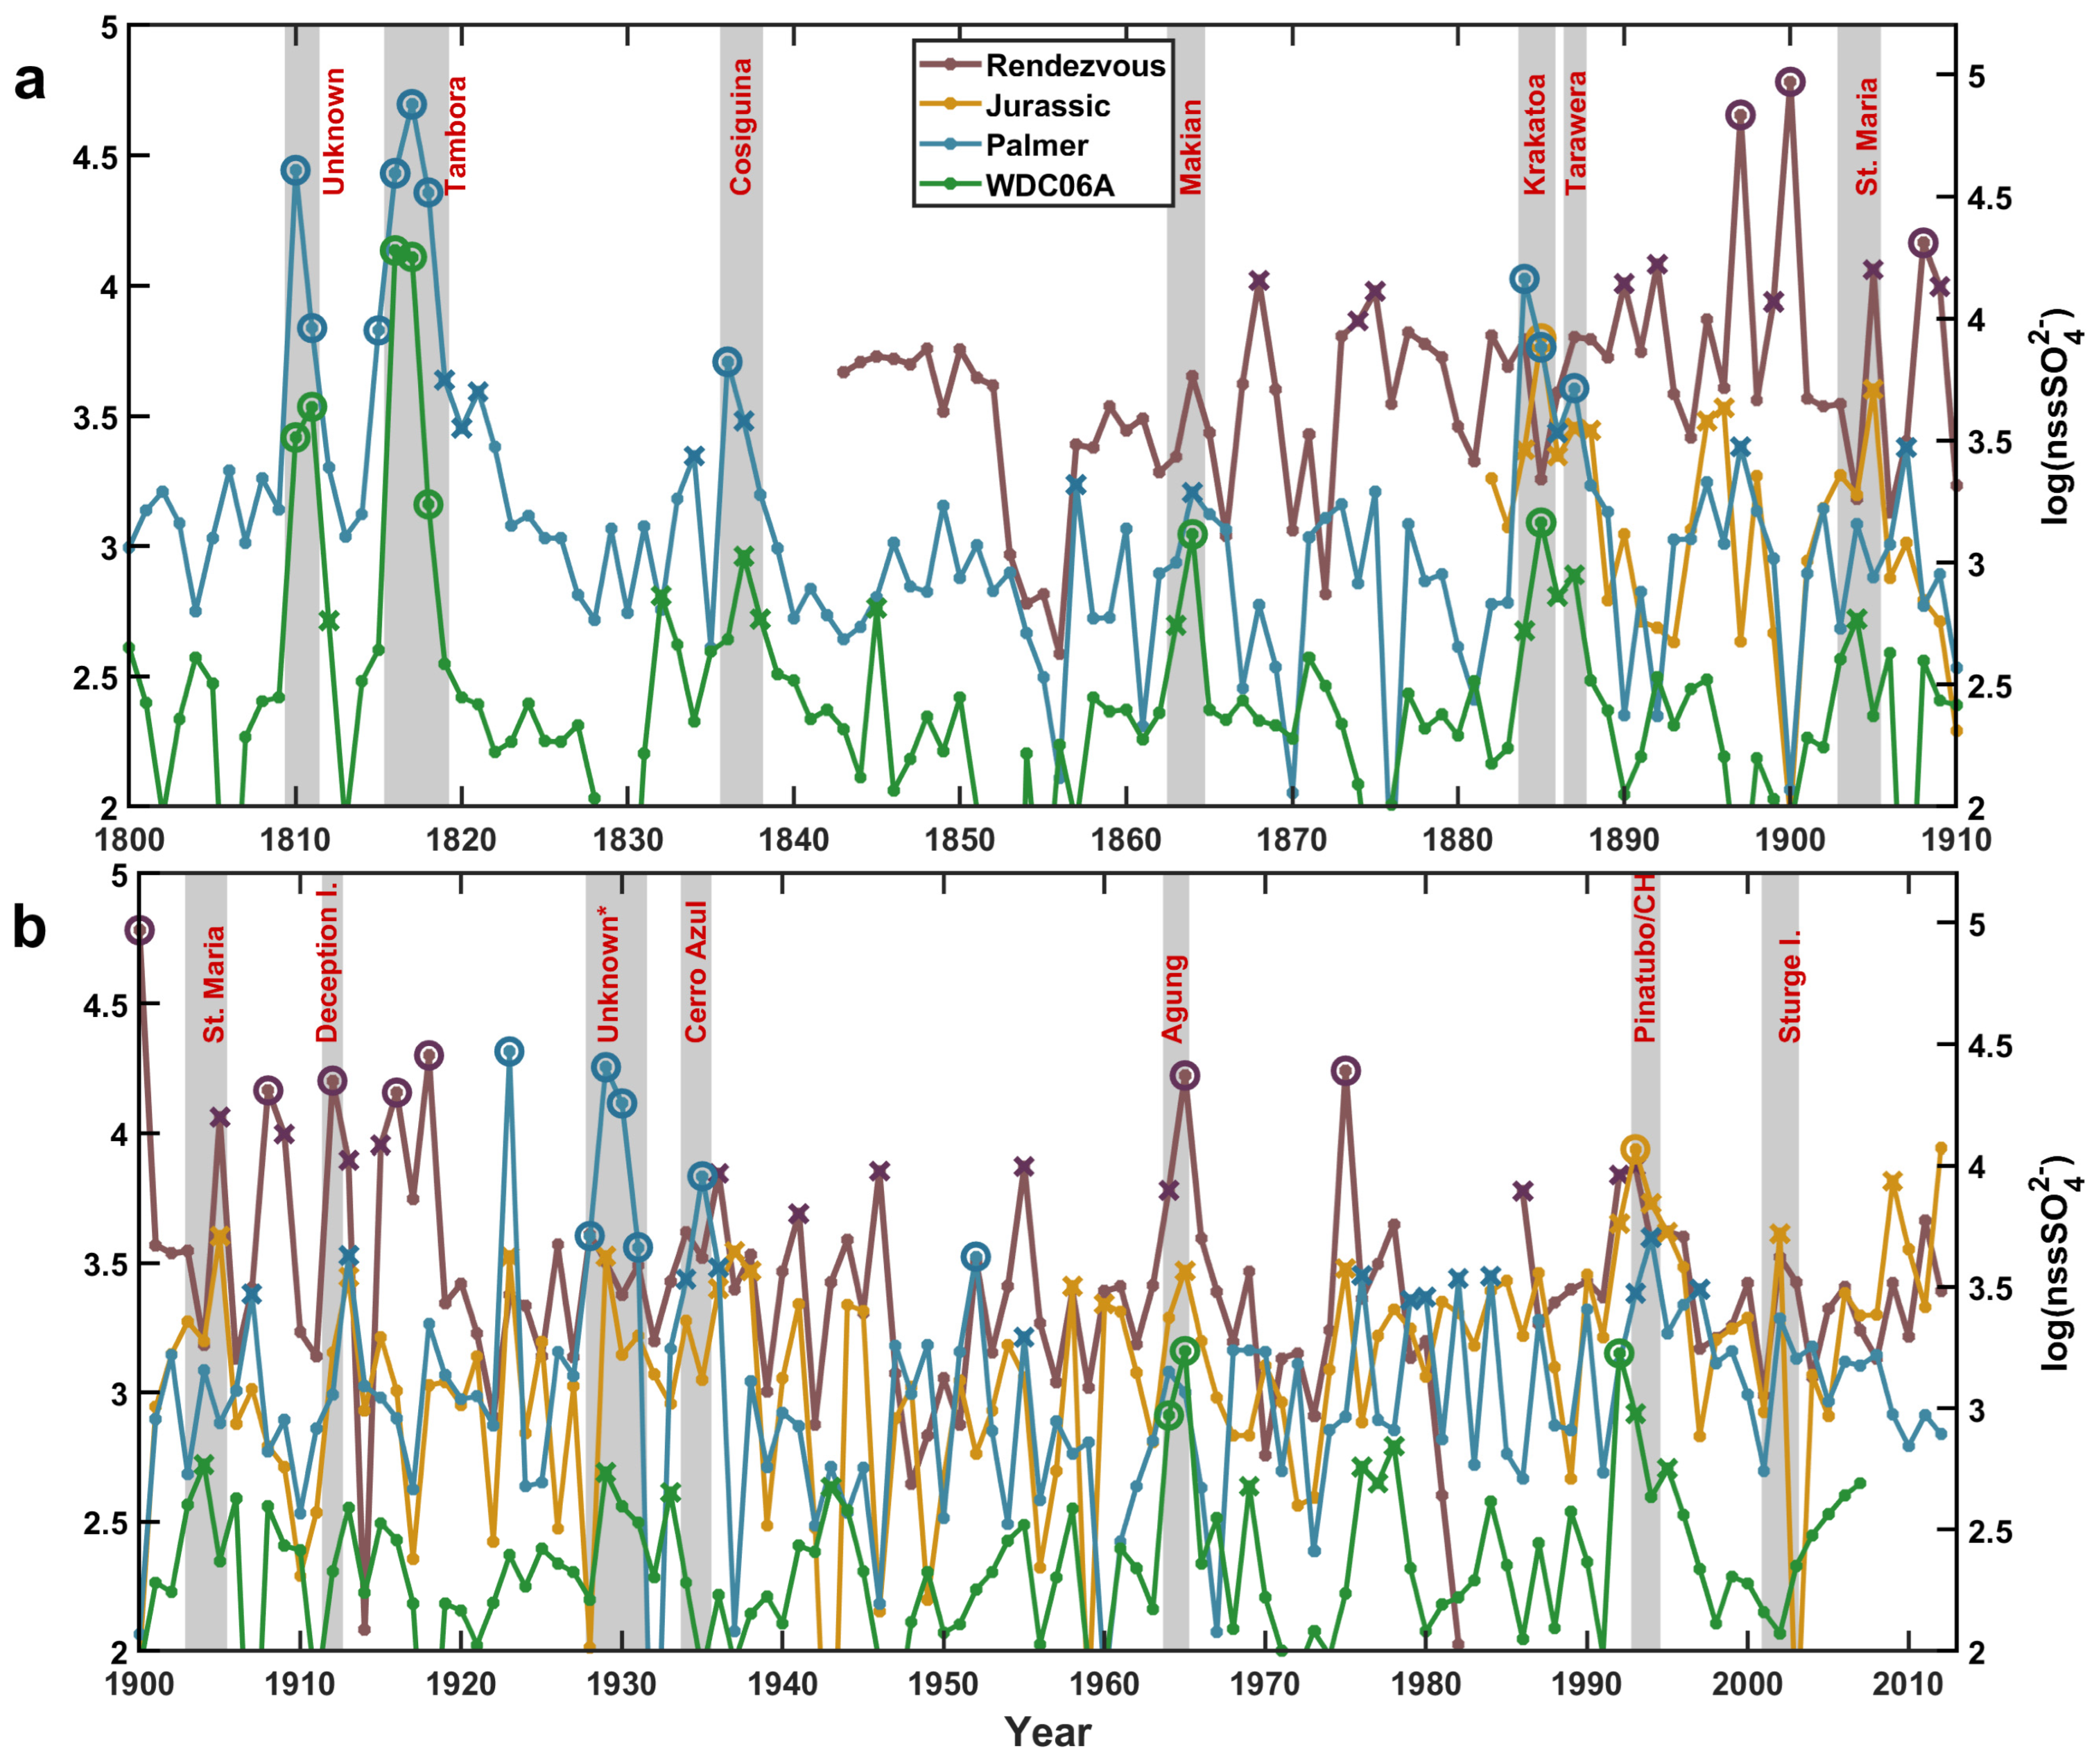
3.1.2. Volcanic Horizons
4. Summary
Author Contributions
Funding
Data Availability Statement
Acknowledgments
Conflicts of Interest
References
- EPICA. Community Members Eight Glacial Cycles from an Antarctic Ice Core. Nature 2004, 429, 623–628. [Google Scholar] [CrossRef] [PubMed] [Green Version]
- Sinclair, K.E.; Bertler, N.A.N.; Bowen, M.M.; Arrigo, K.R. Twentieth Century Sea-Ice Trends in the Ross Sea from a High-Resolution, Coastal Ice-Core Record. Geophys. Res. Lett. 2014, 41, 3510–3516. [Google Scholar] [CrossRef]
- Thomas, E.R.; Abram, N.J. Ice Core Reconstruction of Sea Ice Change in the Amundsen-Ross Seas since 1702 A.D. Geophys. Res. Lett. 2016, 43, 5309–5317. [Google Scholar] [CrossRef] [Green Version]
- Winstrup, M.; Vallelonga, P.; Kjær, H.A.; Fudge, T.J.; Lee, J.E.; Riis, M.H.; Edwards, R.; Bertler, N.A.N.; Blunier, T.; Brook, E.J.; et al. A 2700-Year Annual Timescale and Accumulation History for an Ice Core from Roosevelt Island, West Antarctica. Clim. Past Discuss. 2017, 2017, 1–46. [Google Scholar] [CrossRef] [Green Version]
- Pruett, L.E.; Kreutz, K.J.; Wadleigh, M.; Mayewski, P.A.; Kurbatov, A. Sulfur Isotopic Measurements from a West Antarctic Ice Core: Implications for Sulfate Source and Transport. Ann. Glaciol. 2004, 39, 161–168. [Google Scholar] [CrossRef] [Green Version]
- Steig, E.J.; Mayewski, P.A.; Dixon, D.A.; Kaspari, S.D.; Frey, M.M.; Schneider, D.P.; Arcone, S.A.; Hamilton, G.S.; Spikes, V.B.; Albert, M.; et al. High-Resolution Ice Cores from USITASE (West Antarctica): Development and Validation of Chronologies and Determination of Precision and Accuracy. Ann. Glaciol. 2005, 41, 77–84. [Google Scholar] [CrossRef] [Green Version]
- Abram, N.J.; Wolff, E.W.; Curran, M.A.J. A Review of Sea Ice Proxy Information from Polar Ice Cores. Quat. Sci. Rev. 2013, 79, 168–183. [Google Scholar] [CrossRef]
- Sigg, A.; Neftel, A. Seasonal Variations in Hydrogen Peroxide in Polar Ice Cores. Ann. Glaciol. 1988, 10, 157–162. [Google Scholar] [CrossRef] [Green Version]
- Frey, M.M.; Bales, R.C.; McConnell, J.R. Climate Sensitivity of the Century-Scale Hydrogen Peroxide (H2O2) Record Preserved in 23 Ice Cores from West Antarctica. J. Geophys. Res. Atmos. 2006, 111, D21301. [Google Scholar] [CrossRef] [Green Version]
- Thomas, E.R.; Marshall, G.J.; McConnell, J.R. A Doubling in Snow Accumulation in the Western Antarctic Peninsula since 1850. Geophys. Res. Lett. 2008, 35, L01706. [Google Scholar] [CrossRef] [Green Version]
- Hoffmann, K.; Fernandoy, F.; Meyer, H.; Thomas, E.R.; Aliaga, M.; Tetzner, D.; Freitag, J.; Opel, T.; Arigony-Neto, J.; Göbel, C.F.; et al. Stable Water Isotopes and Accumulation Rates in the Union Glacier Region, Ellsworth Mountains, West Antarctica, over the Last 35 Years. Cryosphere 2020, 14, 881–904. [Google Scholar] [CrossRef] [Green Version]
- Moser, D.E.; Jackson, S.; Kjær, H.A.; Markle, B.; Ngoumtsa, E.; Pedro, J.B.; Segato, D.; Spolaor, A.; Tetzner, D.; Vallelonga, P.; et al. An Age Scale for the First Shallow (Sub-)Antarctic Ice Core from Young Island, Northwest Ross Sea. Geosciences 2021, 11, 368. [Google Scholar] [CrossRef]
- Sigl, M.; Fudge, T.J.; Winstrup, M.; Cole-Dai, J.; Ferris, D.; McConnell, J.R.; Taylor, K.C.; Welten, K.C.; Woodruff, T.E.; Adolphi, F.; et al. The WAIS Divide Deep Ice Core WD2014 Chronology—Part 2: Annual-Layer Counting (0--31\,Ka\,BP). Clim. Past 2016, 12, 769–786. [Google Scholar] [CrossRef] [Green Version]
- Cole-Dai, J.; Mosley-Thompson, E. The Pinatubo Eruption in South Pole Snow and Its Potential Value to Ice-Core Paleovolcanic Records. Ann. Glaciol. 1999, 29, 99–105. [Google Scholar] [CrossRef] [Green Version]
- Castellano, E.; Becagli, S.; Jouzel, J.; Migliori, A.; Severi, M.; Steffensen, J.P.; Traversi, R.; Udisti, R. Volcanic Eruption Frequency over the Last 45 Ky as Recorded in Epica-Dome C Ice Core (East Antarctica) and Its Relationship with Climatic Changes. Glob. Planet. Change 2004, 42, 195–205. [Google Scholar] [CrossRef]
- Nardin, R.; Amore, A.; Becagli, S.; Caiazzo, L.; Frezzotti, M.; Severi, M.; Stenni, B.; Traversi, R. Volcanic Fluxes Over the Last Millennium as Recorded in the Gv7 Ice Core (Northern Victoria Land, Antarctica). Geosciences 2020, 10, 38. [Google Scholar] [CrossRef] [Green Version]
- Cole-Dai, J.; Mosley-Thompson, E.; Thompson, L.G. Quantifying the Pinatubo Volcanic Signal in South Polar Snow. Geophys. Res. Lett. 1997, 24, 2679–2682. [Google Scholar] [CrossRef]
- Thomas, E.R.; Bracegirdle, T.J. Precipitation Pathways for Five New Ice Core Sites in Ellsworth Land, West Antarctica. Clim. Dyn. 2015, 44, 2067–2078. [Google Scholar] [CrossRef]
- Dee, D.P.; Uppala, S.M.; Simmons, A.J.; Berrisford, P.; Poli, P.; Kobayashi, S.; Andrae, U.; Balmaseda, M.A.; Balsamo, G.; Bauer, P.; et al. The ERA-Interim Reanalysis: Configuration and Performance of the Data Assimilation System. Q. J. R. Meteorol. Soc. 2011, 137, 553–597. [Google Scholar] [CrossRef]
- Fretwell, P.; Pritchard, H.D.; Vaughan, D.G.; Bamber, J.L.; Barrand, N.E.; Bell, R.; Bianchi, C.; Bingham, R.G.; Blankenship, D.D.; Casassa, G.; et al. Bedmap2: Improved Ice Bed, Surface and Thickness Datasets for Antarctica. Cryosphere 2013, 7, 375–393. [Google Scholar] [CrossRef] [Green Version]
- Greene, C.A.; Gwyther, D.E.; Blankenship, D.D. Antarctic Mapping Tools for Matlab. Comput. Geosci. 2017, 104, 151–157. [Google Scholar] [CrossRef]
- Grieman, M.M.; Hoffmann, H.M.; Humby, J.D.; Mulvaney, R.; Nehrbass-Ahles, C.; Rix, J.; Thomas, E.R.; Tuckwell, R.; Wolff, E.W. Continuous Flow Analysis Methods for Sodium, Magnesium and Calcium Detection in the Skytrain Ice Core. J. Glaciol. 2021, 68, 90–100. [Google Scholar] [CrossRef]
- Bigler, M.; Svensson, A.; Kettner, E.; Vallelonga, P.; Nielsen, M.E.; Steffensen, J.P. Optimization of High-Resolution Continuous Flow Analysis for Transient Climate Signals in Ice Cores. Environ. Sci. Technol. 2011, 45, 4483–4489. [Google Scholar] [CrossRef] [PubMed]
- Gkinis, V.; Popp, T.J.; Johnsen, S.J.; Blunier, T. A Continuous Stream Flash Evaporator for the Calibration of an IR Cavity Ring-down Spectrometer for the Isotopic Analysis of Water. Isotopes Environ. Health Stud. 2010, 46, 463–475. [Google Scholar] [CrossRef] [PubMed] [Green Version]
- Gkinis, V.; Popp, T.J.; Blunier, T.; Bigler, M.; Schüpbach, S.; Kettner, E.; Johnsen, S.J. Water Isotopic Ratios from a Continuously Melted Ice Core Sample. Atmos. Meas. Tech. 2011, 4, 2531–2542. [Google Scholar] [CrossRef] [Green Version]
- Jones, T.R.; White, J.W.C.; Steig, E.J.; Vaughn, B.H.; Morris, V.; Gkinis, V.; Markle, B.R.; Schoenemann, S.W. Improved Methodologies for Continuous-Flow Analysis of Stable Water Isotopes in Ice Cores. Atmos. Meas. Tech. 2017, 10, 617–632. [Google Scholar] [CrossRef] [Green Version]
- Emanuelsson, B.D.; Baisden, W.T.; Bertler, N.A.N.; Keller, E.D.; Gkinis, V. High-Resolution Continuous-Flow Analysis Setup for Water Isotopic Measurement from Ice Cores Using Laser Spectroscopy. Atmos. Meas. Tech. 2015, 8, 2869–2883. [Google Scholar] [CrossRef] [Green Version]
- Maselli, O.J.; Fritzsche, D.; Layman, L.; McConnell, J.R.; Meyer, H. Comparison of Water Isotope-Ratio Determinations Using Two Cavity Ring-down Instruments and Classical Mass Spectrometry in Continuous Ice-Core Analysis. Isot. Environ. Health Stud. 2013, 49, 387–398. [Google Scholar] [CrossRef]
- Mulvaney, R.; Pasteur, E.C.; Peel, D.A.; Saltzman, E.S.; Whung, P.-Y. The Ratio of MSA to Non-Sea-Salt Sulphate in Antarctic Peninsula Ice Cores. Tellus B 1992, 44, 295–303. [Google Scholar] [CrossRef] [Green Version]
- Emanuelsson, B.D.; Humby, J.D.; Tetzner, D.R.; Thomas, E.R.; Vladimirova, D.O. Ages Scales for the Palmer, Jurassic, and Rendezvous Antarctic Peninsula Ice Cores (Version 1.0) [Data Set]. NERC EDS UK Polar Data Cent. 2022. [Google Scholar] [CrossRef]
- Küttel, M.; Steig, E.J.; Ding, Q.; Monaghan, A.J.; Battisti, D.S. Seasonal Climate Information Preserved in West Antarctic Ice Core Water Isotopes: Relationships to Temperature, Large-Scale Circulation, and Sea Ice. Clim. Dyn. 2012, 39, 1841–1857. [Google Scholar] [CrossRef]
- Sigl, M.; McConnell, J.R.; Layman, L.; Maselli, O.; McGwire, K.; Pasteris, D.; Dahl-Jensen, D.; Steffensen, J.P.; Vinther, B.; Edwards, R.; et al. A New Bipolar Ice Core Record of Volcanism from WAIS Divide and NEEM and Implications for Climate Forcing of the Last 2000 Years. J. Geophys. Res. Atmos. 2013, 118, 1151–1169. [Google Scholar] [CrossRef]
- Kohno, M.; Fujii, Y. Past 220 Year Bipolar Volcanic Signals: Remarks on Common Features of Their Source Volcanic Eruptions. Ann. Glaciol. 2002, 35, 217–223. [Google Scholar] [CrossRef] [Green Version]
- Tetzner, D.R.; Thomas, E.R.; Allen, C.S.; Piermattei, A. Evidence of Recent Active Volcanism in the Balleny Islands (Antarctica) From Ice Core Records. J. Geophys. Res. Atmos. 2021, 126. [Google Scholar] [CrossRef]


| Latitude | Longitude | Elevation (m a.s.l.) | Drill Date | Depth (m below the Snow Surface) | Age Range (C.E.) | −10 m Temperature (°C) | |
|---|---|---|---|---|---|---|---|
| Palmer | 73.86° S | 65.46° W | 1897 | 24–29 December 2012 | 0–133 | 1621–2011 | −22.4 |
| Rendezvous | 74.45° S | 78.16° W | 1006 | 9–16 December 2012 | 0–141 | 1843–2011 | −23.8 |
| Jurassic | 74.33° S | 73.06° W | 1139 | 19–27 November 2012 | 0–140 | 1874–2011 | −16.7 |
| a | Palmer | nssSO42− | WDC | Diff. w. WDC | ||||||||
| Volcano | Year of Eruption | Start Depth | End Depth | Start Date | End Date | log(Conc.) 2σ | Conc. 2σ | High-res. Conc. 2σ | Start Date | End Date | Start Date | End Date |
| Pinatubo/CH | 1991 | 14.52 | 13.52 | 1991.9 | 1994.4 | x | x | 1991.5 | 1993.5 | 0.4 | 0.9 | |
| Agung | 1963 | 29.72 | 29.07 | 1963.8 | 1965.1 | x | 1963.6 | 1965.6 | 0.2 | 0.5 | ||
| Krakatoa | 1883 | 59.22 | 58.67 | 1883.8 | 1885.7 | x | x | x | 1884 | 1886.4 | 0.2 | 0.7 |
| Cosiguina | 1835 | 75.91 | 74.99 | 1835.7 | 1838.2 | x | x | x | 1834.7 | 1838.2 | 1 | 0 |
| Tambora | 1815 | 81.87 | 80.84 | 1815.5 | 1819.1 | x | x | x | 1815.4 | 1818.4 | 0.1 | 0.7 |
| Unknown 1809 | - | 83.67 | 83.03 | 1809.5 | 1811.3 | x | x | x | 1809.4 | 1812.1 | 0.1 | 0.8 |
| Unknown 1694 | - | 114.47 | 113.22 | 1694.7 | 1699.5 | x | x | x | 1694.6 | 1697.4 | 0.1 | 2.1 |
| Gamkonora | 1673 | 120.05 | 119.57 | 1673.7 | 1675.7 | x | x | x | 1673.7 | 1676 | 0 | 0.3 |
| Parker Peak | 1640 | 128.27 | 127.87 | 1641.7 | 1643.5 | x | x | x | 1641.6 | 1643.7 | 0.1 | 0.2 |
| total number of exceedances: | 14 | 16 | ~28 | mean diff.: | 0.47 | |||||||
| b | Rendezvous | nssSO42− | Diff. w. WDC | |||||||||
| Volcano | Start Depth | End Depth | Start Date | End Date | log(Conc.) 2σ | Conc. 2σ | High-res. Conc. 2σ | Start Date | End Date | |||
| Pinatubo/CH | 1991 | 28.58 | 27.3 | 1991.8 | 1993.0 | x | x | 1991.5 | 1993.5 | 0.3 | 0.5 | |
| Agung | 1963 | 56.35 | 54.7 | 1963.8 | 1965.5 | x | x | x | 1963.6 | 1965.6 | 0.2 | 0.1 |
| St. Maria | 1902 | 101.4 | 100.9 | 1904.8 | 1905.7 | x | x | 1902.9 | 1904.3 | 1.9 | 1.4 | |
| total number of exceedances: | 7 | 10 | ~21 | mean diff.: | 0.73 | |||||||
| c | Jurassic | nssSO42− | Diff. w. WDC | |||||||||
| Volcano | Start Depth | End Depth | Start Date | End Date | log(Conc.) 2σ | Conc. 2σ | High-res. Conc. 2σ | Start Date | End Date | |||
| Pinatubo/CH | 1991 | 38.29 | 35.65 | 1990.9 | 1993.3 | x | x | x | 1991.5 | 1993.5 | 0.6 | 0.2 |
| St. Maria | 1902 | 119.2 | 117.88 | 1902.7 | 1905.3 | x | x | 1902.9 | 1904.3 | 0.2 | 1 | |
| Krakatoa | 1883 | 132.05 | 131.6 | 1884.6 | 1885.3 | x | x | x | 1884 | 1886.4 | 0.6 | 1.1 |
| total number of exceedances: | 2 | 4 | ~21 | mean diff.: | 0.62 | |||||||
Publisher’s Note: MDPI stays neutral with regard to jurisdictional claims in published maps and institutional affiliations. |
© 2022 by the authors. Licensee MDPI, Basel, Switzerland. This article is an open access article distributed under the terms and conditions of the Creative Commons Attribution (CC BY) license (https://creativecommons.org/licenses/by/4.0/).
Share and Cite
Emanuelsson, B.D.; Thomas, E.R.; Tetzner, D.R.; Humby, J.D.; Vladimirova, D.O. Ice Core Chronologies from the Antarctic Peninsula: The Palmer, Jurassic, and Rendezvous Age-Scales. Geosciences 2022, 12, 87. https://0-doi-org.brum.beds.ac.uk/10.3390/geosciences12020087
Emanuelsson BD, Thomas ER, Tetzner DR, Humby JD, Vladimirova DO. Ice Core Chronologies from the Antarctic Peninsula: The Palmer, Jurassic, and Rendezvous Age-Scales. Geosciences. 2022; 12(2):87. https://0-doi-org.brum.beds.ac.uk/10.3390/geosciences12020087
Chicago/Turabian StyleEmanuelsson, B. Daniel, Elizabeth R. Thomas, Dieter R. Tetzner, Jack D. Humby, and Diana O. Vladimirova. 2022. "Ice Core Chronologies from the Antarctic Peninsula: The Palmer, Jurassic, and Rendezvous Age-Scales" Geosciences 12, no. 2: 87. https://0-doi-org.brum.beds.ac.uk/10.3390/geosciences12020087