
In-Situ Evolution of Calcite Twinning during Uniaxial Compression of Carrara Marble at Room Temperature


Laboratoire de Mécanique des Solides, CNRS UMR 7649, École Polytechnique, 91128 Palaiseau, France
*
Authors to whom correspondence should be addressed.
Geosciences 2022, 12(6), 233; https://0-doi-org.brum.beds.ac.uk/10.3390/geosciences12060233
Submission received: 30 January 2022
/
Revised: 22 May 2022
/
Accepted: 24 May 2022
/
Published: 31 May 2022
(This article belongs to the Special Issue Calcite Deformation Twins: From Crystal Plasticity to Applications in Geosciences)
Abstract
:Calcite twinning is a dominant deformation mechanism at low temperatures. It is often used to reconstruct paleostresses: orientations of the principal stress axes, stress ratios and differential stress. Despite numerous studies, on single crystals and aggregates, questions remain about the initiation and evolution of the twinning. In particular, the existence of a critical value for the activation of twin planes is debated. In this study, Carrara marble samples were uniaxially deformed at low temperature. The experiments were monitored in situ in an SEM (Scanning Electron Microscope) and a deformation analysis was performed at regular intervals using image correlation. Image correlation analysis shows the link between the overconcentration of strains and the appearance of the first twinned planes. This is followed by a densification and a gradual thickening of the twin lamellae. Fracturing only appears in a third stage as a precursor to the collapse of the sample. The inversion, using the CSIT-2 technique, showed that the twinned planes are globally related to the applied macroscopic stress. The inversion allows one to retrieve the macroscopic stress tensor. Schmid factors were extracted from this analysis and correlated to the loading curves. For crystals of about 200 µm diameter, the threshold value is in between 6.75 and 8.25 MPa.
1. Introduction
The safety of CO2 geological sequestration in carbonate aquifers or depleted hydrocarbon reservoirs depends on the long-term mechanical behaviour of the host rock. The short-term hydro-mechanical behaviour of carbonate rocks is addressed in numerous studies investigating damage criteria and formation of compaction bands [1,2,3,4]. The latter essentially involves micro-damage and grain rearrangement, leading to localized cataclastic flow and pore collapse. Conversely, long-term creep of carbonates is shown to involve local contribution of crystal slip plasticity [5]. Twinning activity is often reported in natural carbonates and experimental deformation studies [6,7,8,9,10,11], but its contribution remains quantitatively unclear. For instance, due to different experimental conditions and analytical techniques, controversy still exists about the critical resolved shear stress needed to activate twinning. Similarly, no clear consensus exists about the thickening evolution of twin lamella. Understanding how, when and where calcite twinning occurs and how it evolves is, therefore, among the key questions for the understanding of the long-term mechanical behaviour of carbonate rocks.
The geometrical analysis of calcite twinning dates back to the 1950s, with the first data inversion [12], which reconstructed the orientation of the palaeostresses. This approach was followed by other inversion methods [13,14,15,16,17,18], in order to reconstruct the strain tensors and the improvement in inversion procedures to reconstruct the orientations but also the magnitudes of the paleostresses [19,20,21,22]. In calcite, three twin planes of trigonal symmetry can be activated in a direction and sense imposed by the host crystal. Thus, a twin plane is compared, in analogy, to a simple homogeneous shear, allowing one to calculate the orientations of the main stresses as well as the magnitude.
The twinning mechanism is known to be very common in carbonates, as it can be activated at low temperatures and very low stress magnitudes ([23] and references therein). Twinning boundaries are the result of the twinning dislocations (or disconnections). This has severe consequences at the crystal scale but also implications for the aggregate. Indeed, from the moment the crystal is twinned, it can no longer be considered as a single crystal. Instead, it will behave as a “composite” grain, with portions of different crystallographic orientations, separated by coherent interfaces. The latter will interact with other twinning systems, but also will act as barriers for crystal slip plasticity mediated by dislocation glide. It was predicted that such interactions would result in strain hardening, which could lead to fracturing [24]. It has been stated that the formation of multiple twin lamellae could be seen as a reduction in grain size, which could increase the strength of the rock at low temperatures or could lead to softening at high temperatures [25]. In a recent study [26], we studied the twinning of calcite single crystals deformed by uniaxial compression at room temperature. We show that, at first, twinning leads to strong strain hardening, followed by a quasi-steady-state flow stress, related to twinning densification.
Twinning of calcite only activates if one component of the applied deviatoric stress exceeds the critical resolved shear stress corresponding to a twin system; the component of traction along the twin gliding direction must exceed a critical threshold value. The existence of a well-defined critical threshold for activation of twinning is subject to debate [24,27,28,29,30,31,32]. In particular, the study on metals [33] showed that, depending on the degree of imperfections, one should rather speak of a range of critical resolved shear stresses that can cause twinning. From a different perspective, previous works [24,34,35] attributed the thickening mechanisms of twin lamella solely to temperature. Our study, based on in-situ observation of the twinning deformation of single crystals [26], provided new insights about the evolution of twinning deformation. Our results from direct in-situ testing observation provided experimental evidence for (1) very small initial critical shear stress; (2) time-dependent thickening of lamella, operating at room temperature. However, direct application of these results to natural systems is not straightforward. Indeed, on the one hand, we used pure and large cm sized calcite single crystals, whereas natural calcite usually contains impurities, inclusions and is often pre-twinned. On the other hand, the uniaxial compression tests result in samples with free and unconstrained lateral surfaces, which hardly compare to the boundary conditions of aggregate constitutive calcite grains. The crucial question of the critical threshold shear stress that must be considered for twinning inversion methods still remains.
In this study, we monitor, using in-situ SEM (scanning electron microscope), the uniaxial deformation of Carrara marbles, in order to determine the critical resolved shear stresses for twinning, corresponding to the individual constitutive grains of a dense aggregate.
2. Materials and Preparation Protocol
2.1. Sample Preparation
The samples were all cut from the same block of Carrara marble. This material was chosen because the grain size is fairly homogeneous and we may neglect a possible effect of grain-size distribution on the critical resolved shear stress [25,27,28]. A broad grain-size distribution may induce heterogeneities of inherited strain and crystal defects, which would result in variable threshold shear stresses for the different grain-size fractions.
Samples were cut with a low-speed diamond saw with dimensions of approximately 4 × 4 mm2 for the compression faces and 8 mm in length. All the surfaces were carefully ground and polished. The observation lateral face was further mirror polished using colloidal silica. The finish was obtained with broad ion beam polishing in the central area of the observation area, in order to remove any cold worked zone.
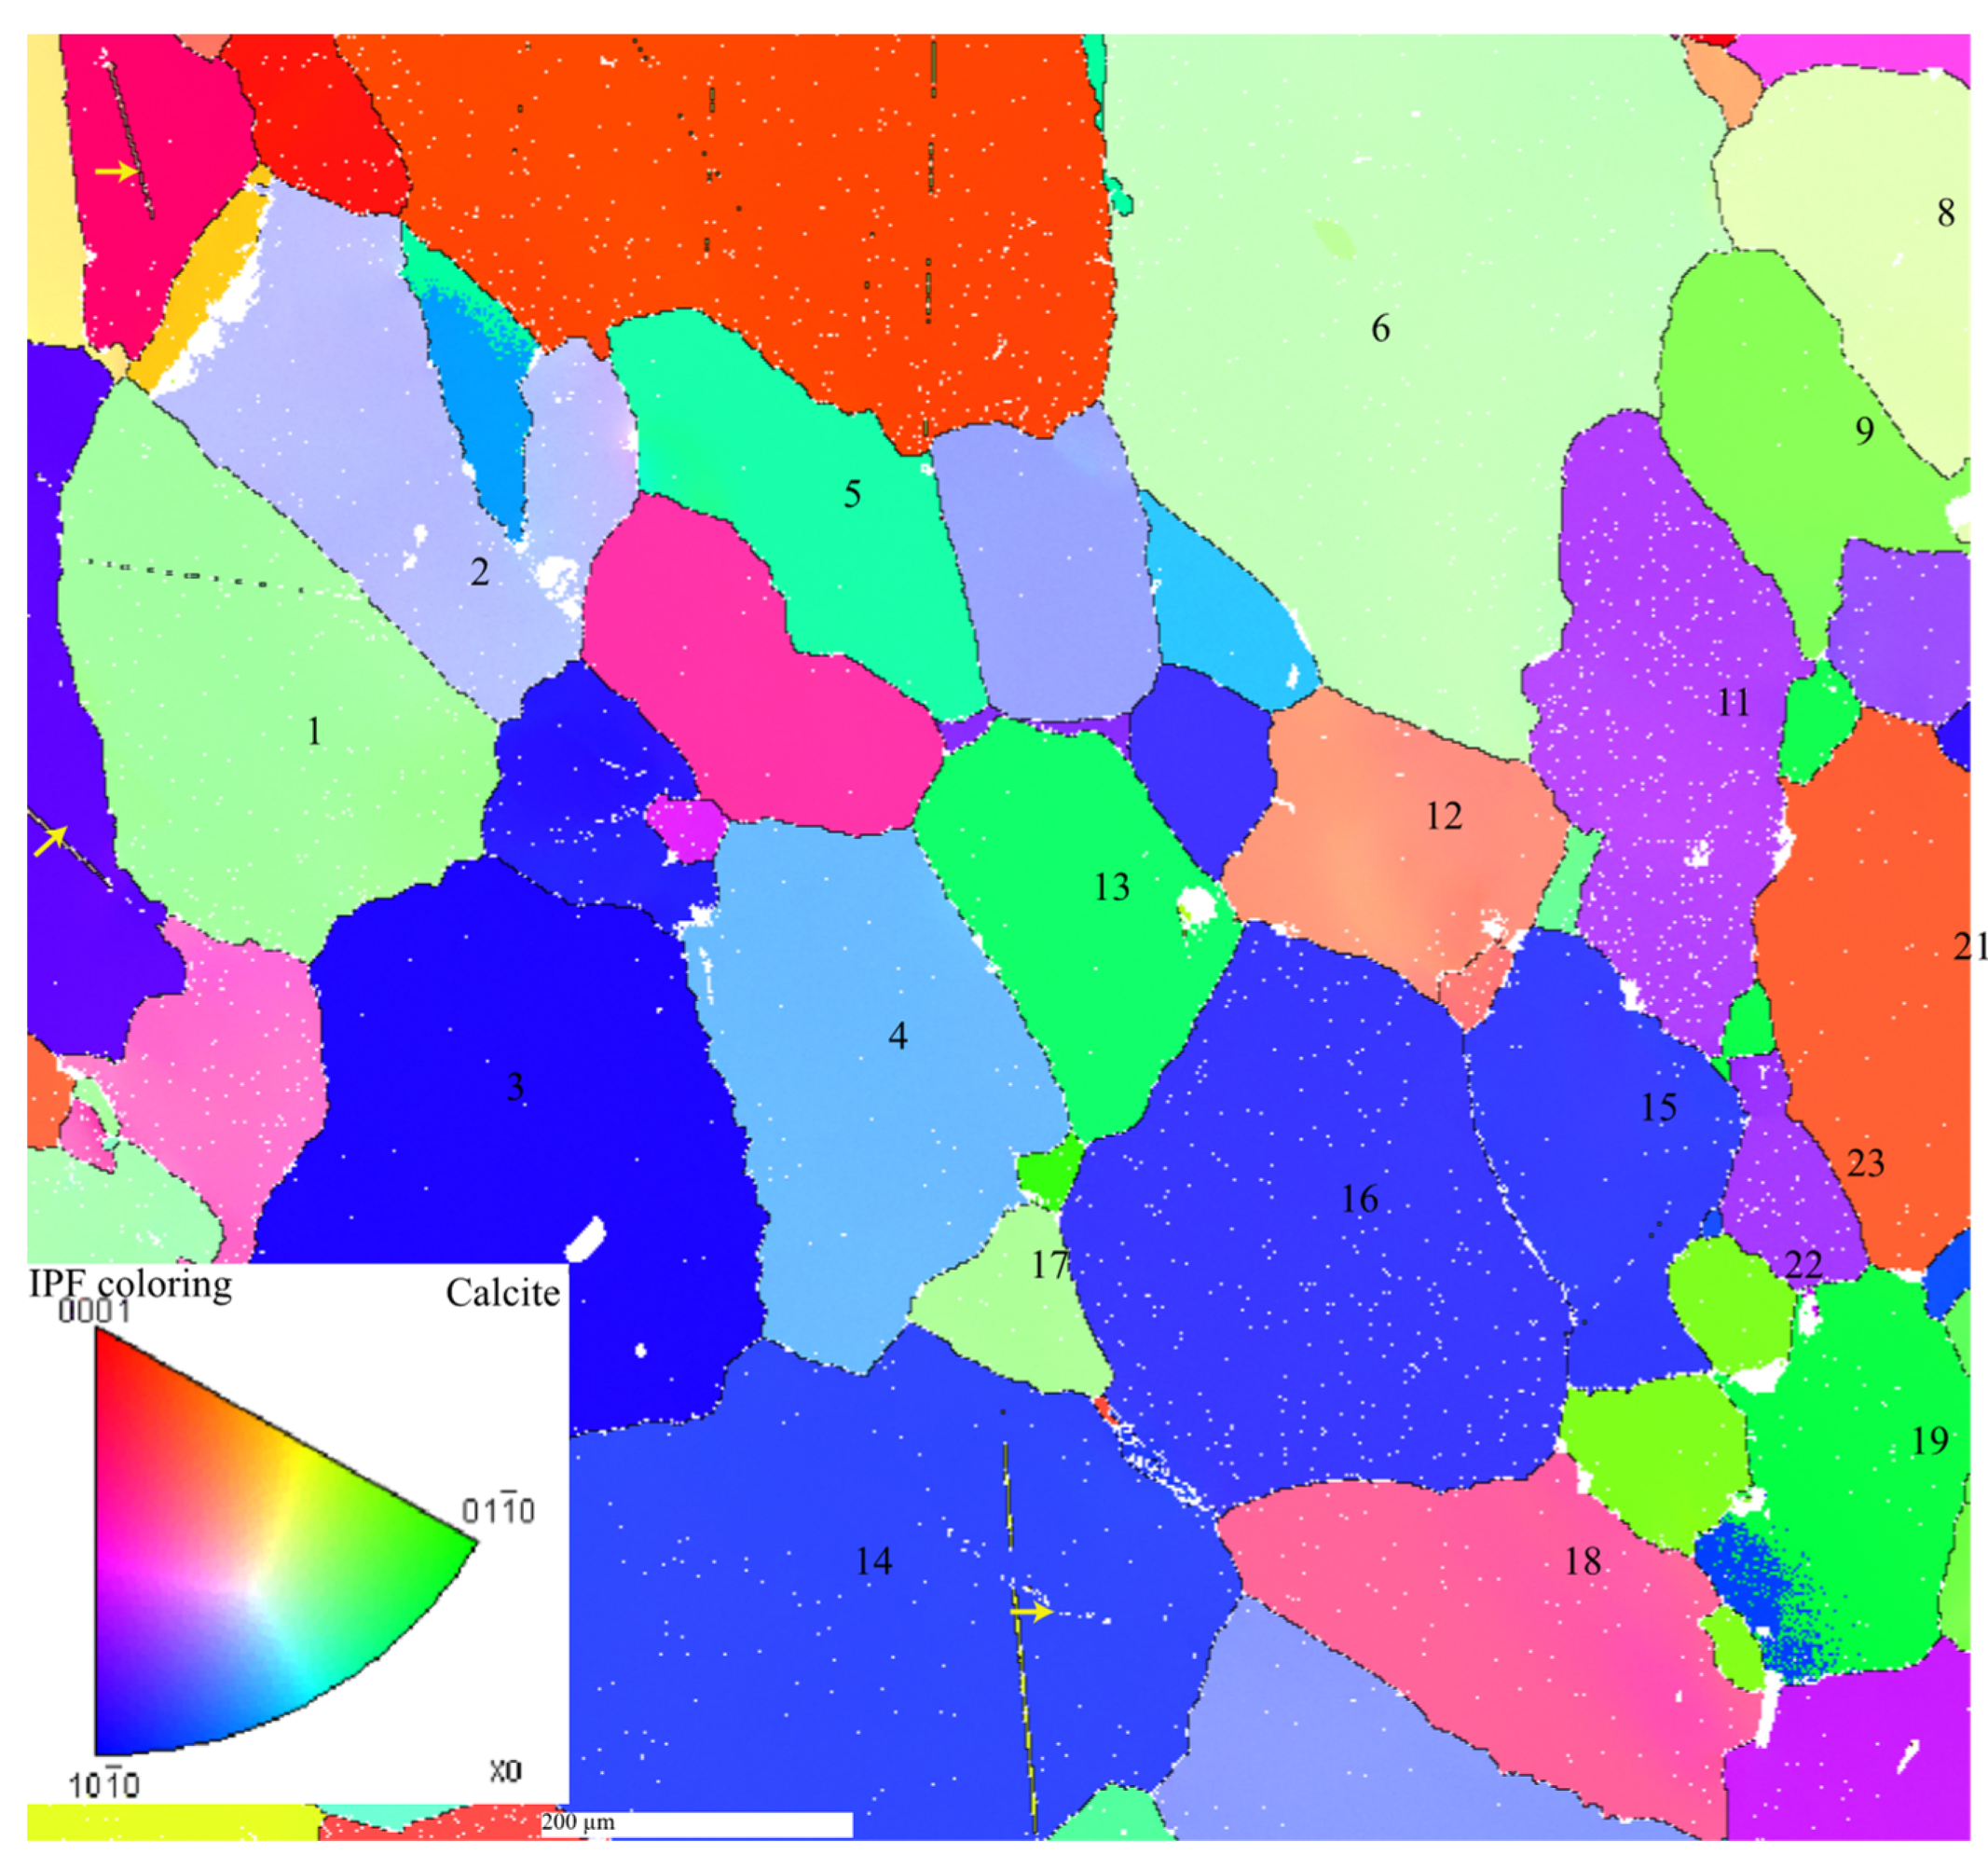
The observation sample surface was analysed by EBSD (Electron Back-Scatter Diffraction) in order to determine the individual crystallographic orientations of the constitutive grains (Figure 1). This analysis is essential to obtain the orientations of the twinning systems and, thus, to calculate the related Schmid factors according to the orientation of the force applied to the sample. The SEM is a QUANTA 650 FEG-ESEM, equipped for EBSD analysis (HKL Nordlys II S camera is operated with Aztek 3.1 and data are post-processed with Channel 5 software).
2.2. Kinematic Markers and DIC Principles
The Digital Image Correlation (DIC) technique is based on the sequential comparison of images of the sample taken at different deformation stages. In practice, DIC compares an image representing an actual deformed state to an image representing a previous reference state. The procedure aims at the characterization of the mechanical transformation leading from the reference state to the actual one. In the present case, we applied simplified DIC, which implies solely the characterization of in-plane displacements (2D) and corresponding deformation.
The DIC method relies on the existence of local contrasts, which can be assigned to the surficial material points as characteristic signatures in terms of local grey-scale levels. The procedure aims to determine the surficial displacement field of material points distributed following a periodic pattern, like a grid. These measurement points are centred within restricted domains, called correlation domains, where grey-scale level is considered as the discriminative signature of the measurement point. The displacement field of the measurement points, corresponding to the mechanical transformation between the reference and the actual states, is obtained by the minimization of a correlation coefficient, defined on the basis of the grey-scale levels of the reference and the actual states. By definition, strain is an intrinsically discrete concept, which is inseparable from the choice of a gage length. The in-plane transformation gradient corresponding to the measured displacement field is, therefore, computed following different local integration schemes, based on a contour integral defined by a chosen number (usually from 2 to 8) of nearest neighbouring measurement points. The computation of the in-plane strain components depends on a strong hypothesis, such as volume conservation, or axisymmetric deformation. The accuracy of strain computation increases with the number of considered neighbouring points (large contour integral). Conversely, the resolution of the computed strain field decreases due to the increasing local gage length [36].
The surficial kinematic field associated to the deformation process is determined on the basis of the grey-scale levels of the correlation windows. Hence, the sample surface must offer adequate contrasts, which may for instance relate to the presence of different phases, or porosity. However, in the case of the dense and monophasic Carrara marble we must provide artificial surface contrasts. The techniques of artificial marking depend on the scale of observation and on the imaging technique. For optical monitoring, the kinematic markers may simply consist of paint-sprayed speckled pattern [2]. For SEM observation, the marking consists in the deposition of a thin metallic grid thanks to electron microlithography [37]. We applied the latter technique for the deposition of golden grid patterns onto the observed surfaces of the samples. The procedure consists of several steps. At first, a polymer layer is deposited on the sample surface. The polymer is then irradiated with the electron beam of the SEM following a specific pattern. The latter is usually a simple regular grid. Secondly, the samples are treated with a solvent that removes solely the irradiated polymer. A thin metallic film of a few nanometres is subsequently evaporated onto the sample, hence, filling out the formally etched grid-like pattern. At last, the original non-irradiated polymer is dissolved, leaving solely the metallic grid on the sample surface.
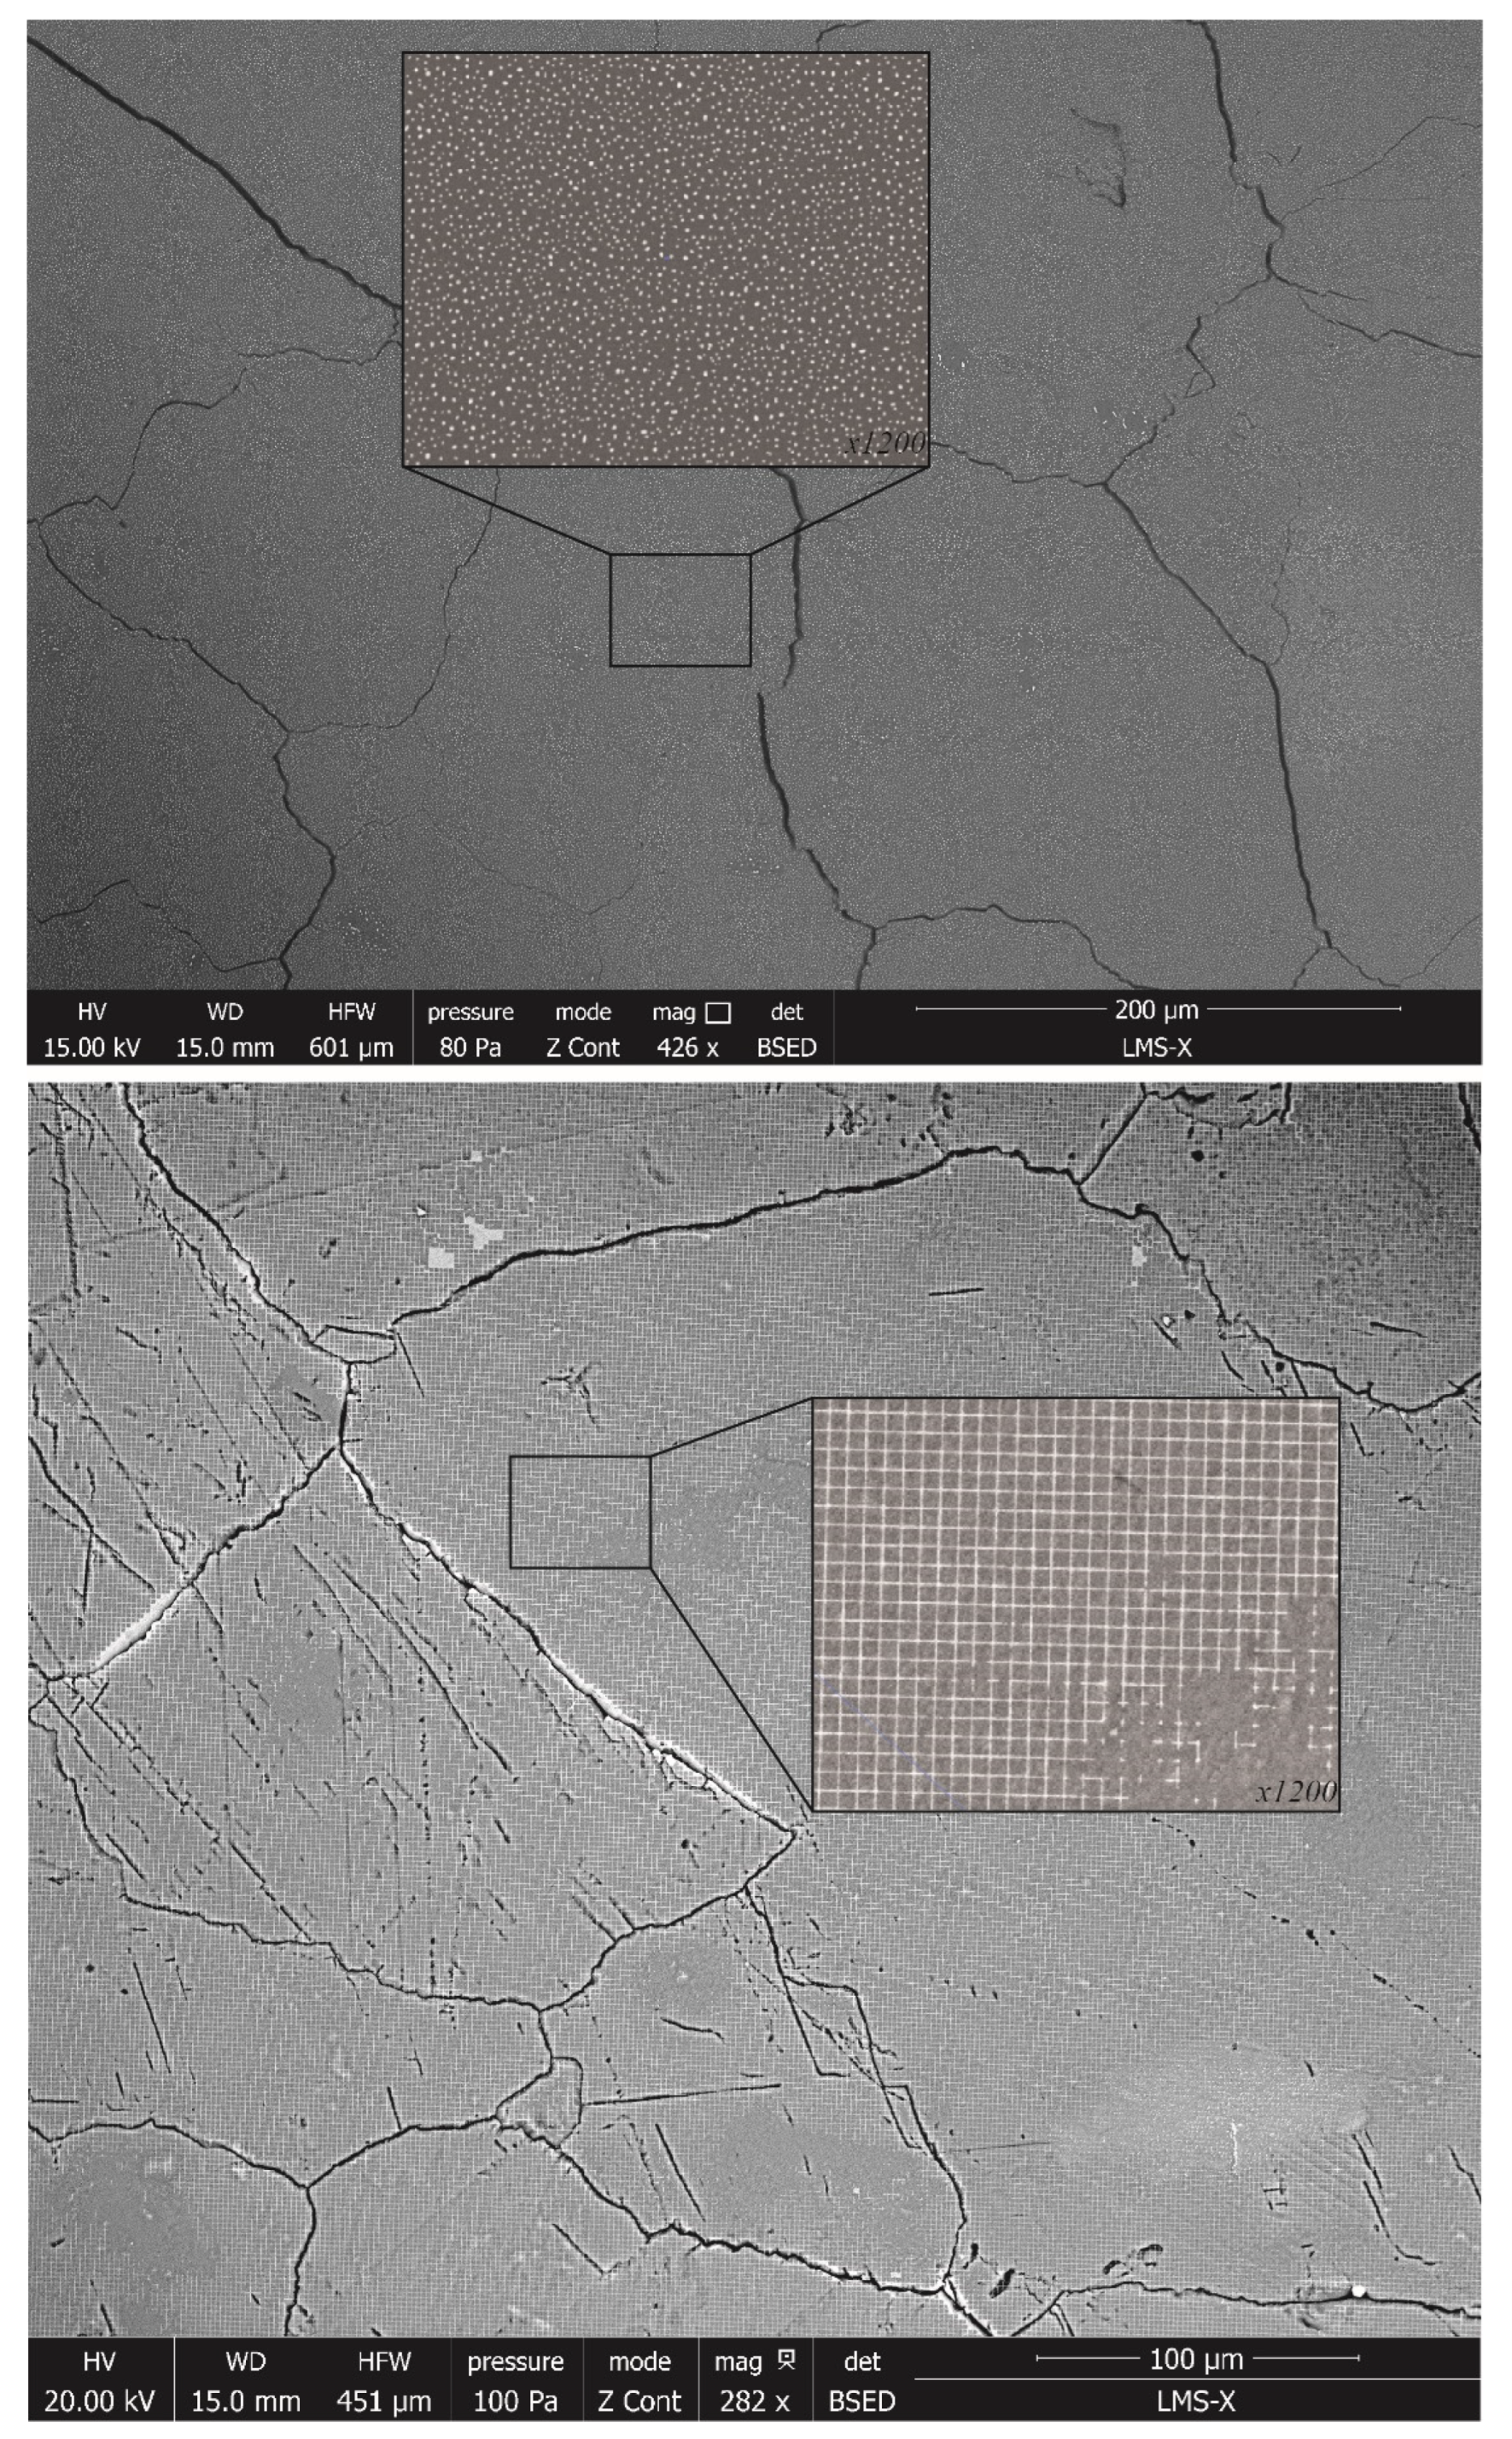
An alternative technique consists of high-temperature dewetting of thin (10–50 nm) metallic film, which results in the formation of tiny metallic spheroids dispersed over the sample surface [36]. The film thickness, temperature and annealing time must be adapted to the substrate material and its microstructure. The technique proved successful for coarse-grained (ca 300 µm) synthetic rock salt annealed at 450 °C, which resulted in micrometre-sized gold particle kinematic markers. In our case, temperature was limited to 220 °C in order to avoid thermal cracking. At these conditions a 20 nm thick gold film resulted in nm sized gold particles. The latter are much smaller than the grain size, which in turn precludes kinematic analysis at the aggregate scale, because the smaller the particles, the smaller the observation area. Indeed, in order to ensure an appropriate local grey-scale distribution a marker must contain several pixels. The electron microlithography was only partly successful. The protective polymer used to coat the sample surface prior to electron irradiation (see details in [37]) did not adequately adhere polished calcite surfaces onto the mirror. The polymerization process also needs heat treatment at 140 °C. However, the annealing procedures of both techniques proved problematic for our cm sized samples, because annealing resulted in pre-damage and grain boundary de-cohesion (Figure 2).
The anisotropic thermal expansion of calcite is a phenomenon that has been studied, particularly in architecture and for the purpose of conservation of historical monuments and sculptures subjected to thermic damage related to seasonal temperature variations [38]. The protocols described above imply heating the sample. The grains are easily discernible due to thermally pre-damaged and open grain boundaries (Figure 2).
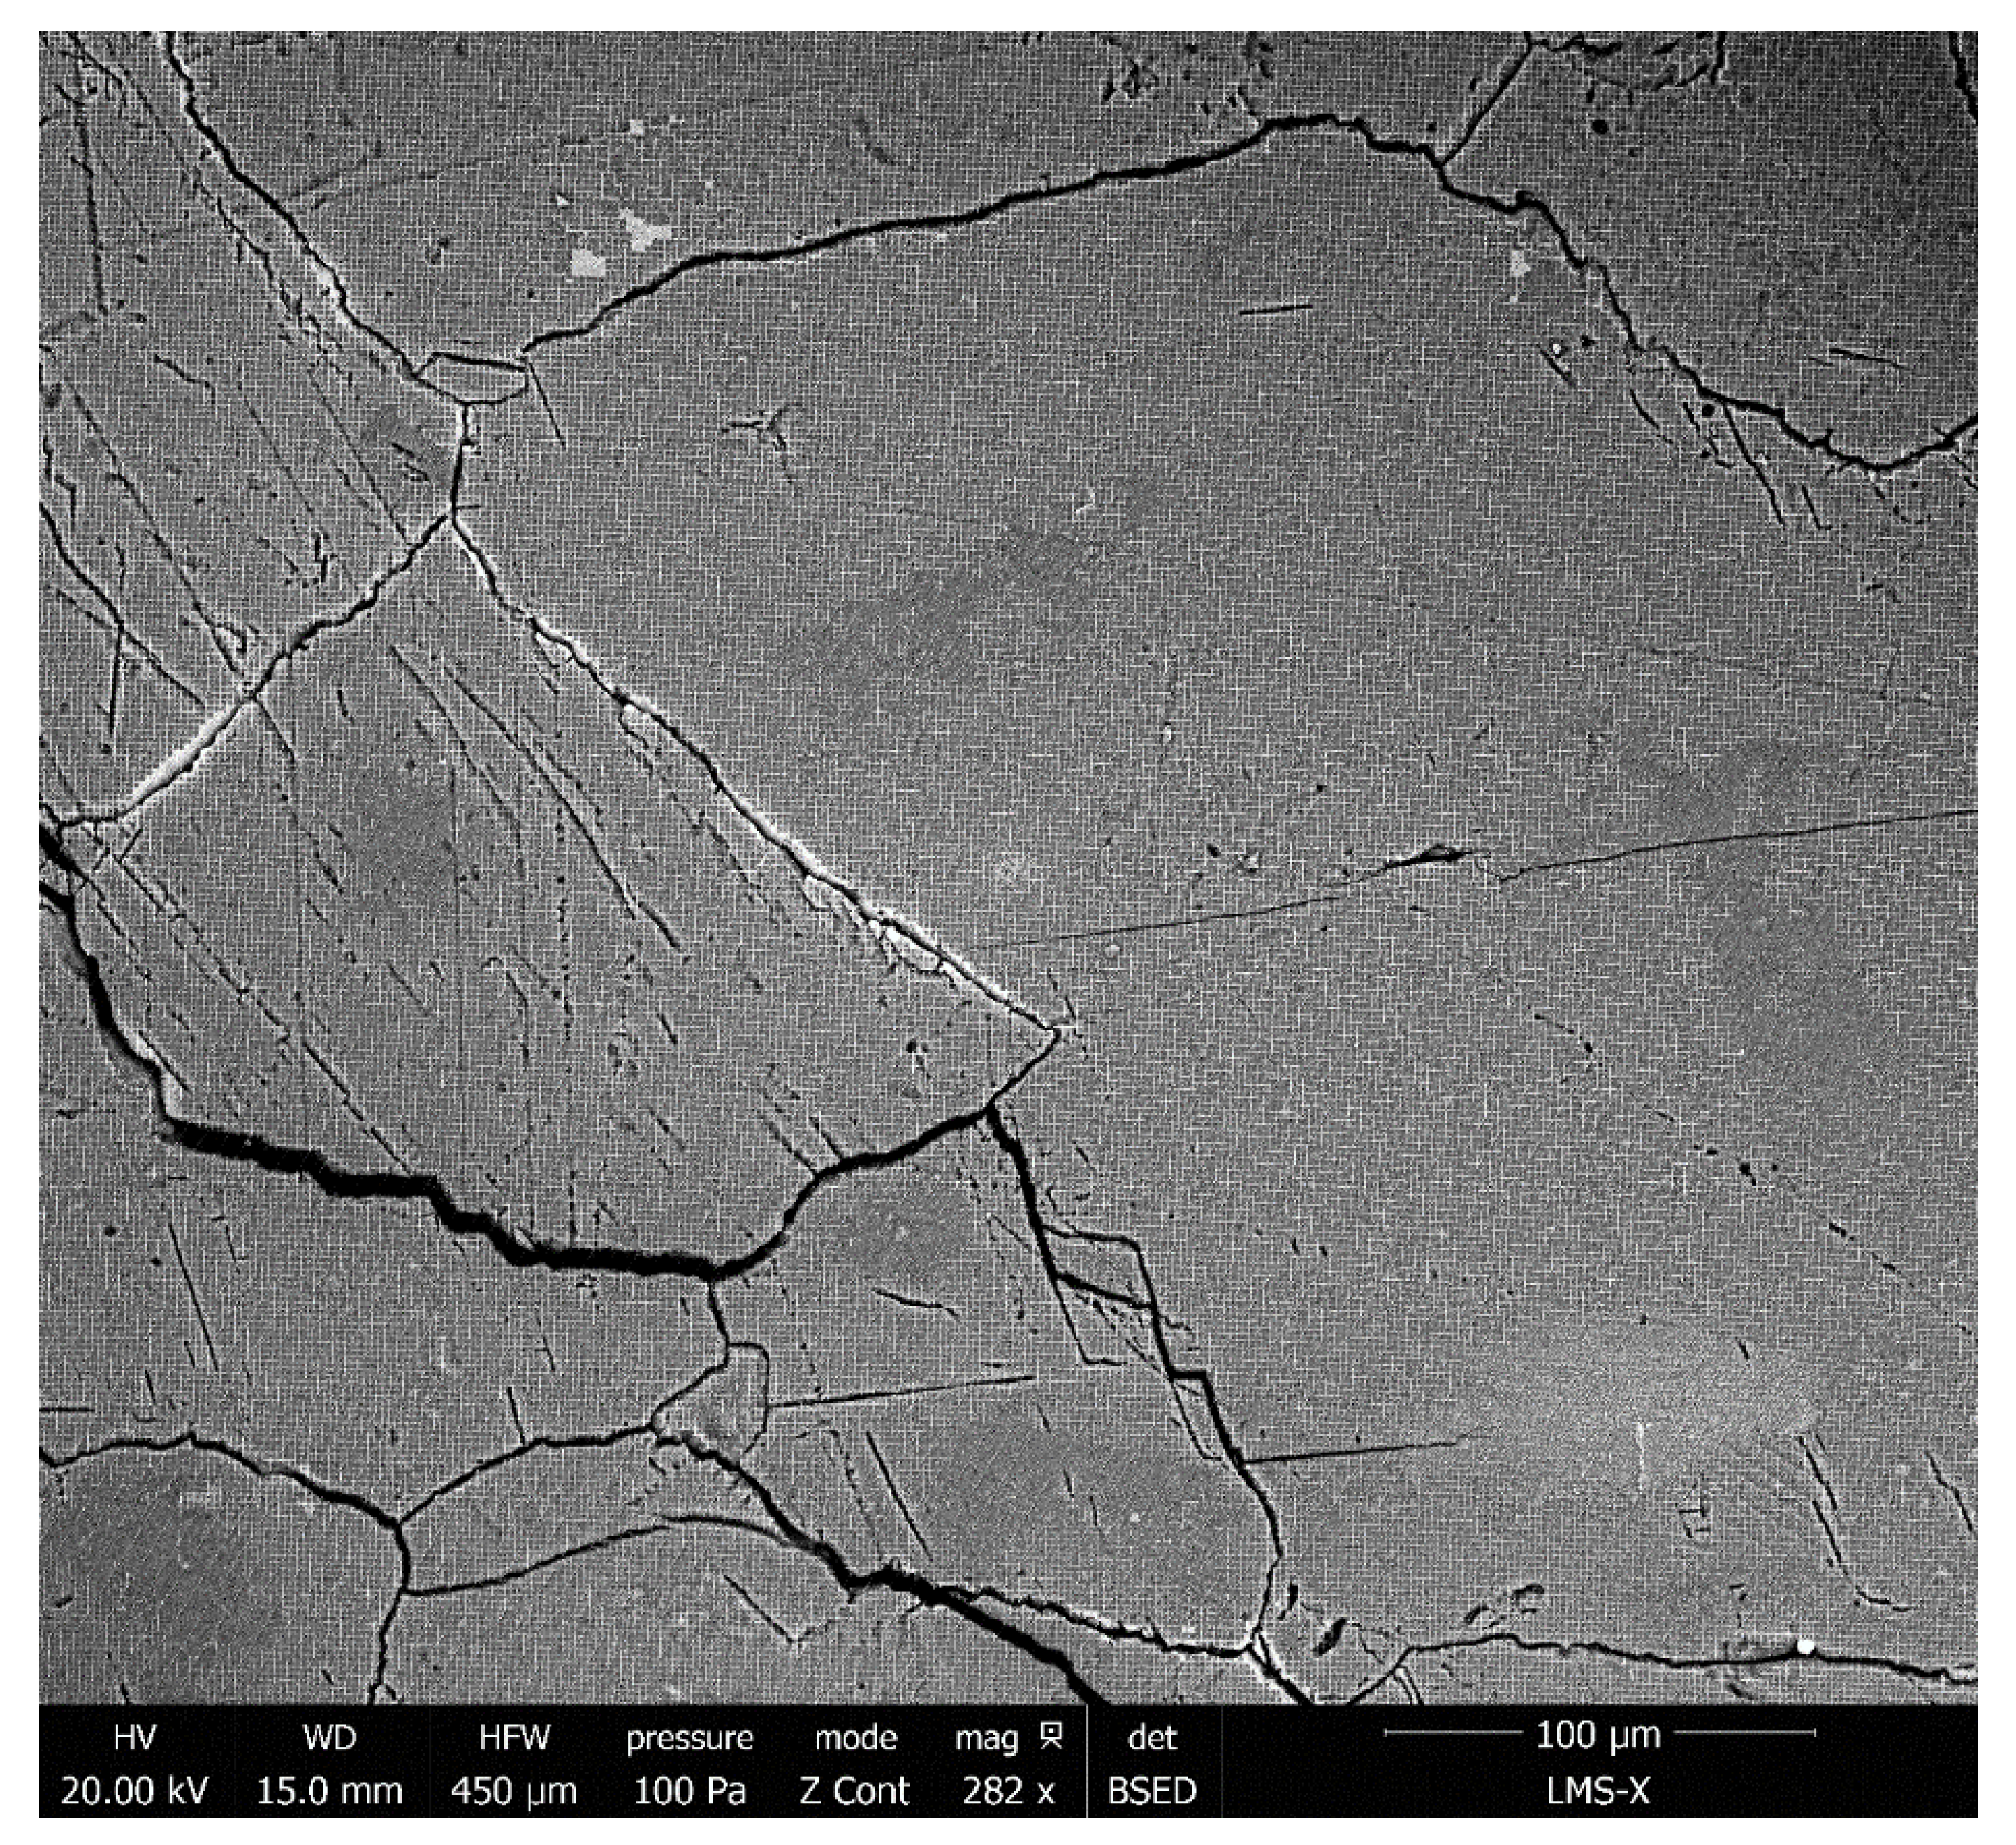
All the samples prepared using the microlithography method exhibited de-cohesive grain boundary sliding and rapid fracturing (Figure 3). The marking technique we finally approved was to use a stencil forming a grid of 12.7 µm sized squares. This stencil grid is placed onto the sample surface using silver lacquer, prior to deposition of approximately 15 nm gold by evaporation. After removing the stencil, the sample surface presents square-shaped gold markers (Figure 4).
2.3. In-Situ SEM Deformation
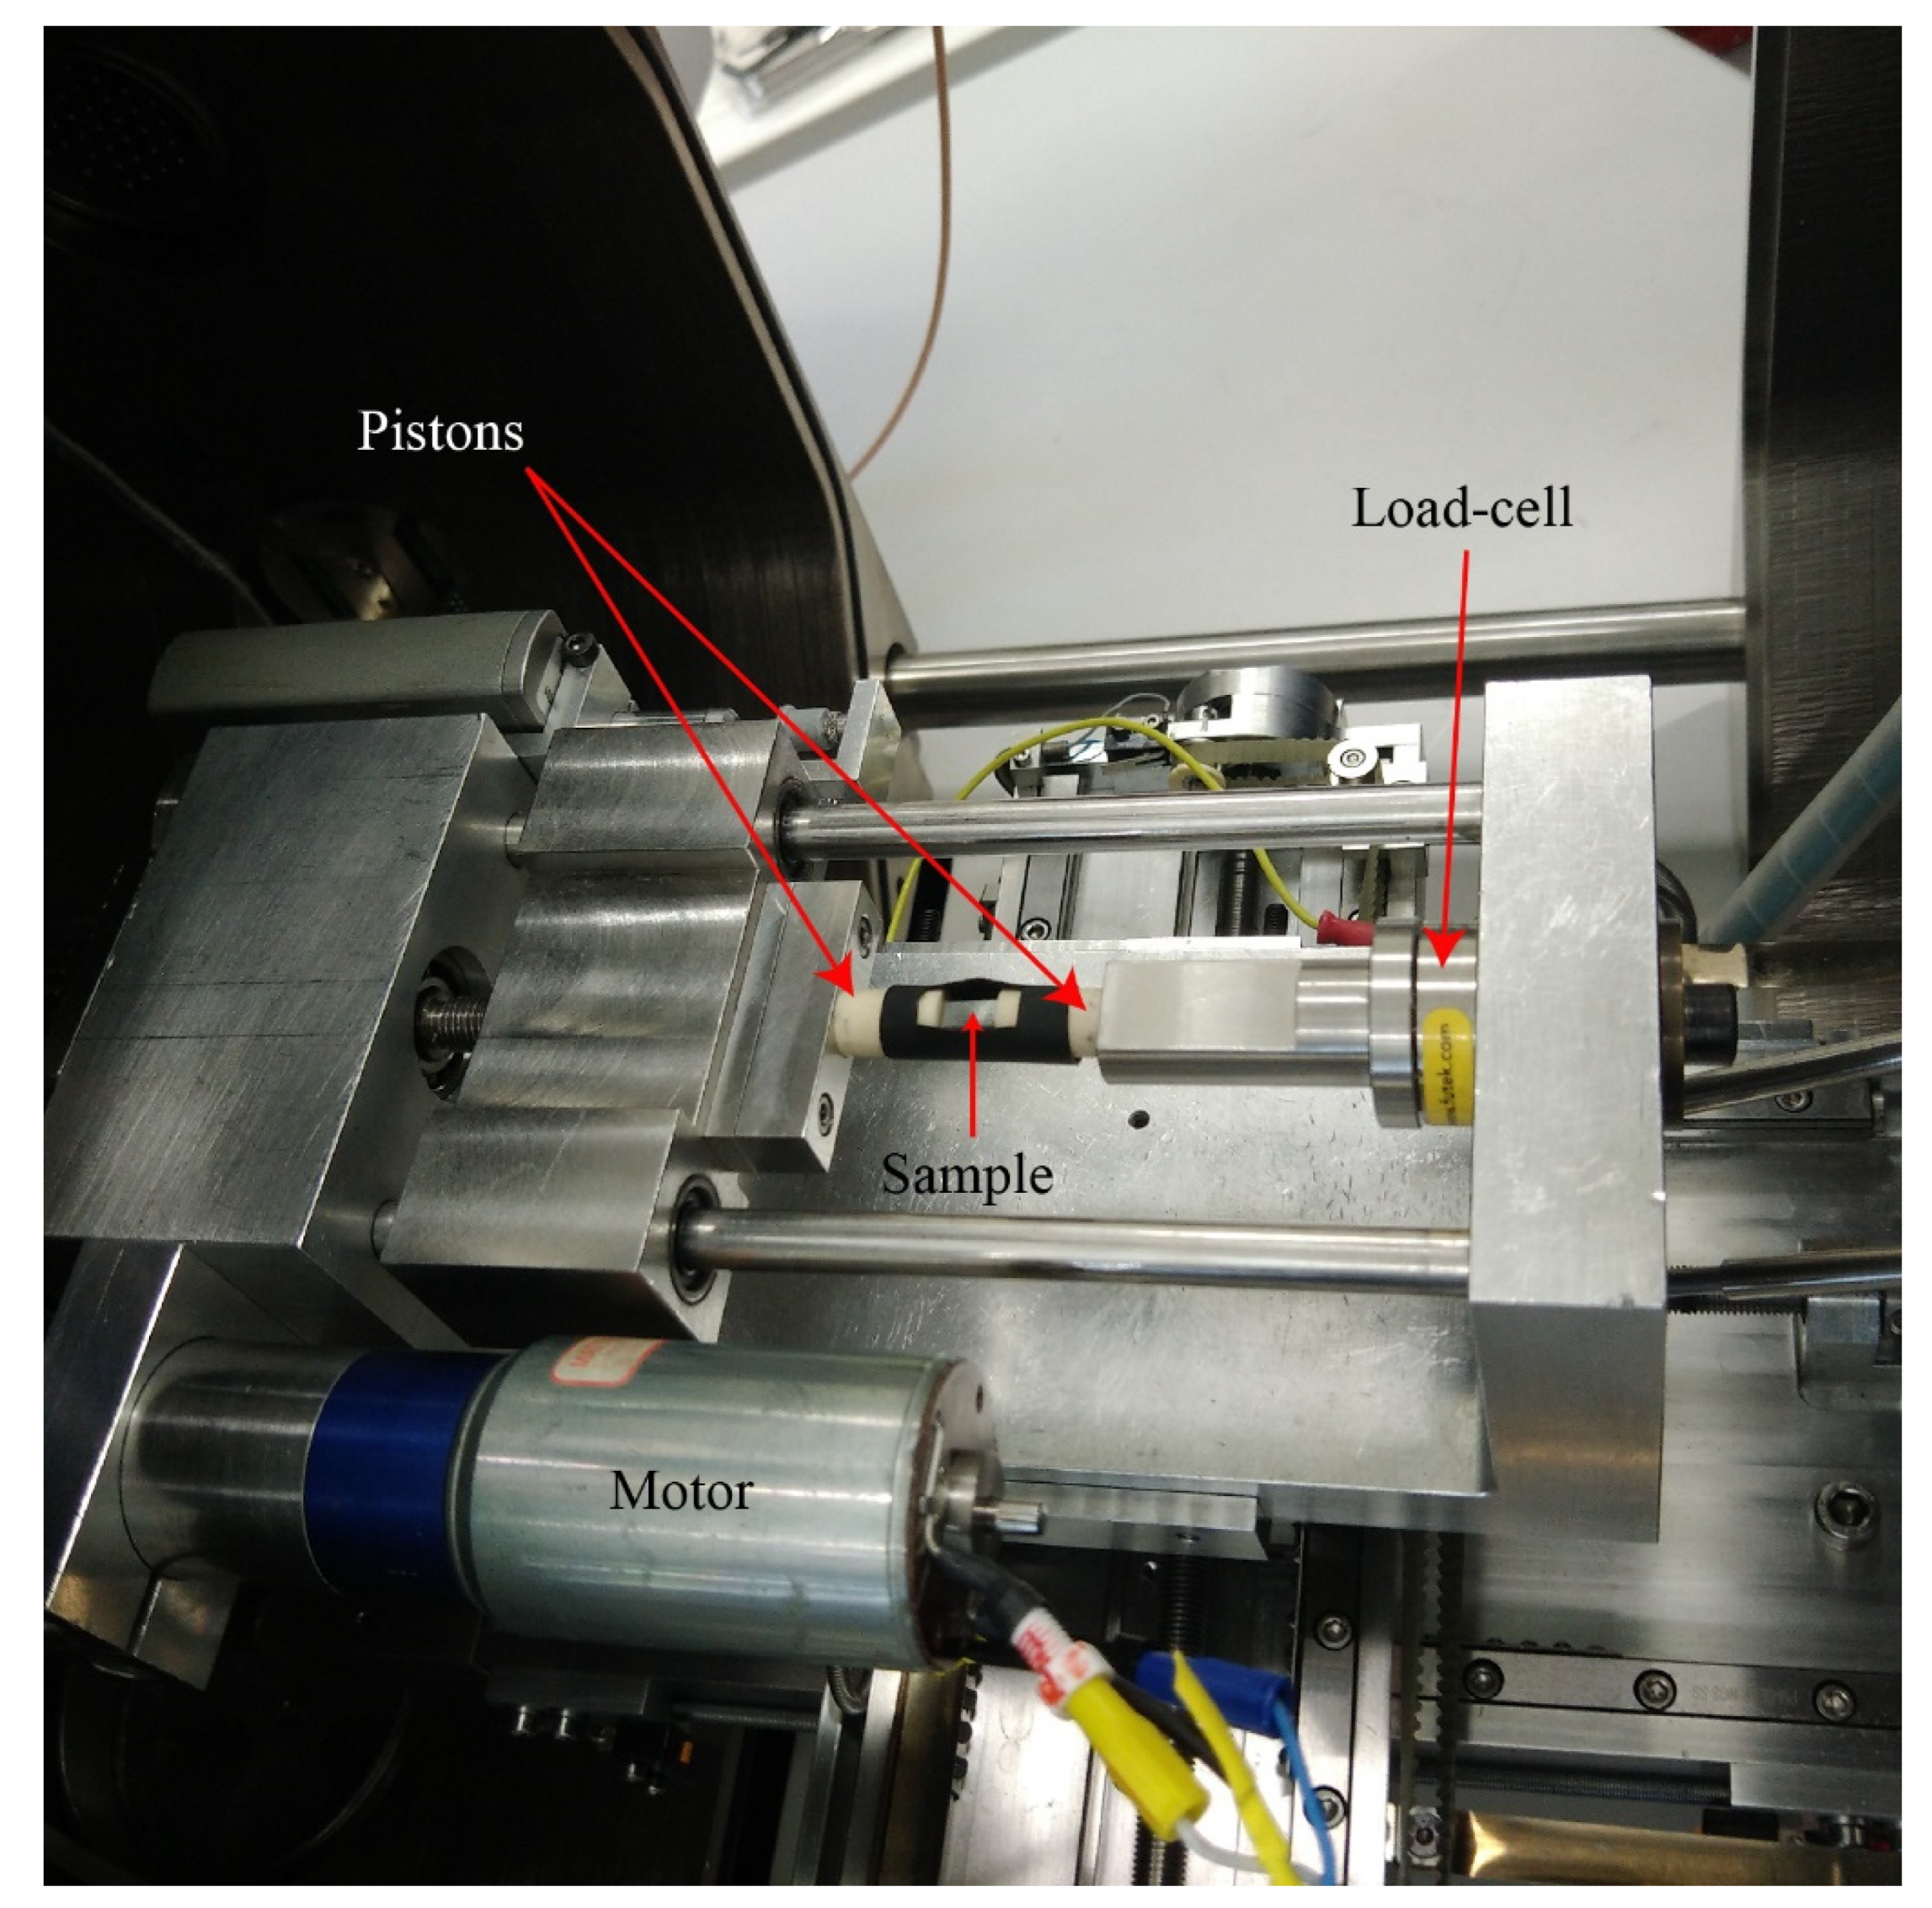
In-situ monitoring of the deformation was carried out using a scanning electron microscope (SEM), with a uniaxial compression rig specifically designed to fit the SEM chamber (Figure 5). After EBSD analysis the sample is placed in between the pistons of the uniaxial press (Figure 5). The basis of each piston has a conically machined shape and is in contact with a steel sphere allowing one to accommodate by small tilting potential imperfections of sample faces parallelism.
The rig frame is machined out of stainless steel and provides maximum accessibility to the loading column and the sample (Figure 5). Compression is driven by a conventional DC-motor Mattke 3557-K024C (nominal rotation speed and torque of 3000 rpm and 0.040 N.m, respectively). A gearbox reduces the rotation speed while increasing the torque. Rotation transforms into translation thanks to a screw nut system and the crosshead glides on linear ball bearing along two stainless steel shafts. The crosshead is instrumented with a linear displacement sensor (optical rule type from Solartron), which is fixed on the frame and measures the piston displacements in order to allow loading rate control. The loading capacity is 5 kN. The applied force is measured by a load cell from Ametek, inserted within the assembly of the loading column (Figure 5). The compression stroke ranges within 12 mm.
The in-situ SEM testing allows one to monitor the deformation process and to collect a series of images during stepwise uniaxial loading performed at constant displacement rate of 8.10–2 µm/s. In order to limit brittle fracturing, the chosen loading rate is the slowest possible value ensuring smooth displacement control. Indeed, the elastic-to-brittle transition of carbonate samples occurs very early in carbonate rocks, with the development of fractures sub-parallel to the applied force [39,40,41,42].
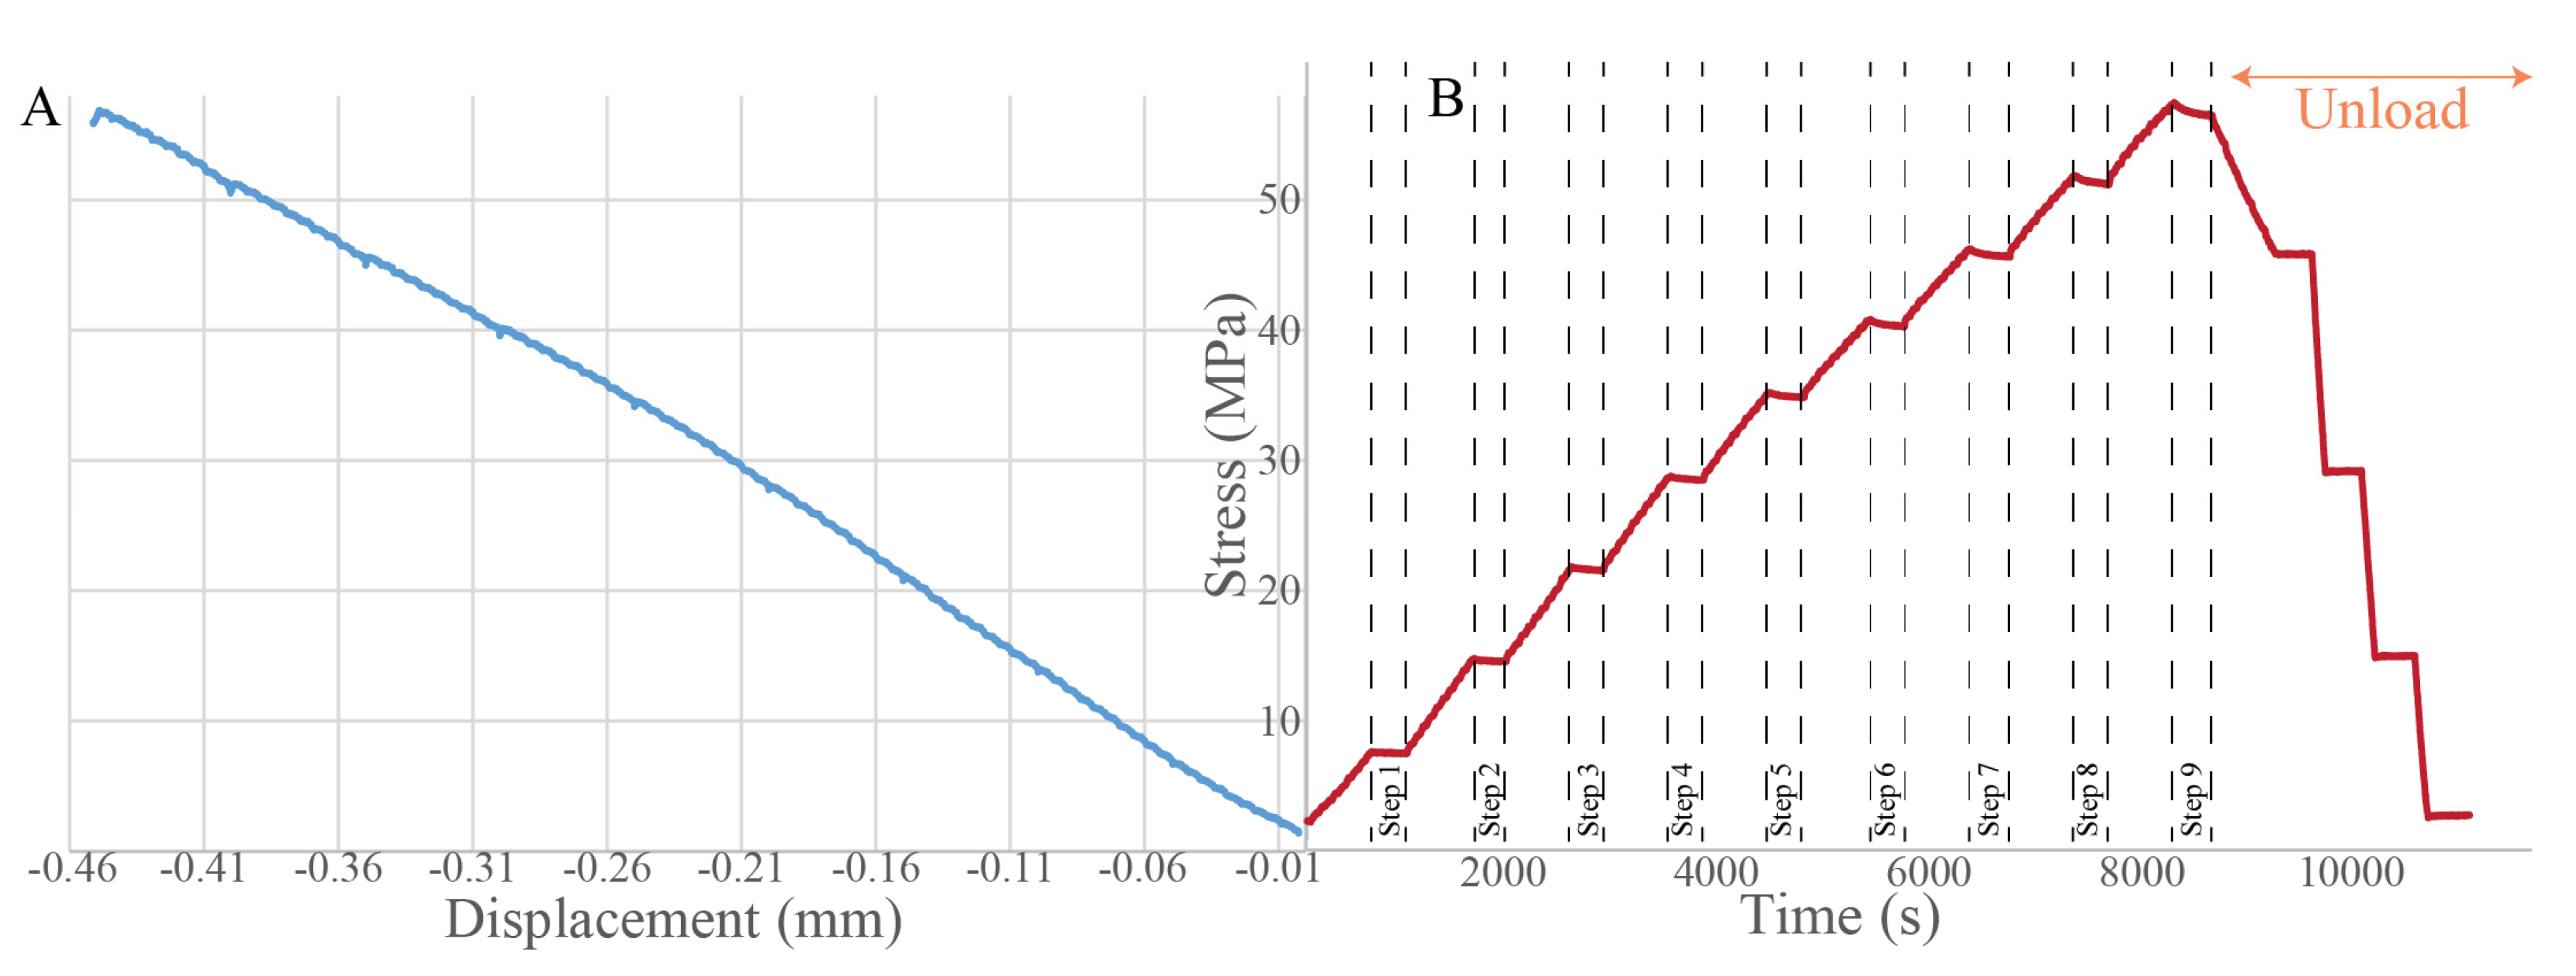
Figure 6 shows a typical example of the sample resistance as a function of time or piston displacement. Both curves show the stepwise loading stages and the periods of SEM imaging, which include focus processing and image acquisition. During these periods limited sample relaxation occurs, resulting in small progressive stress decrease.
3. Results
3.1. Overall Surface Observation
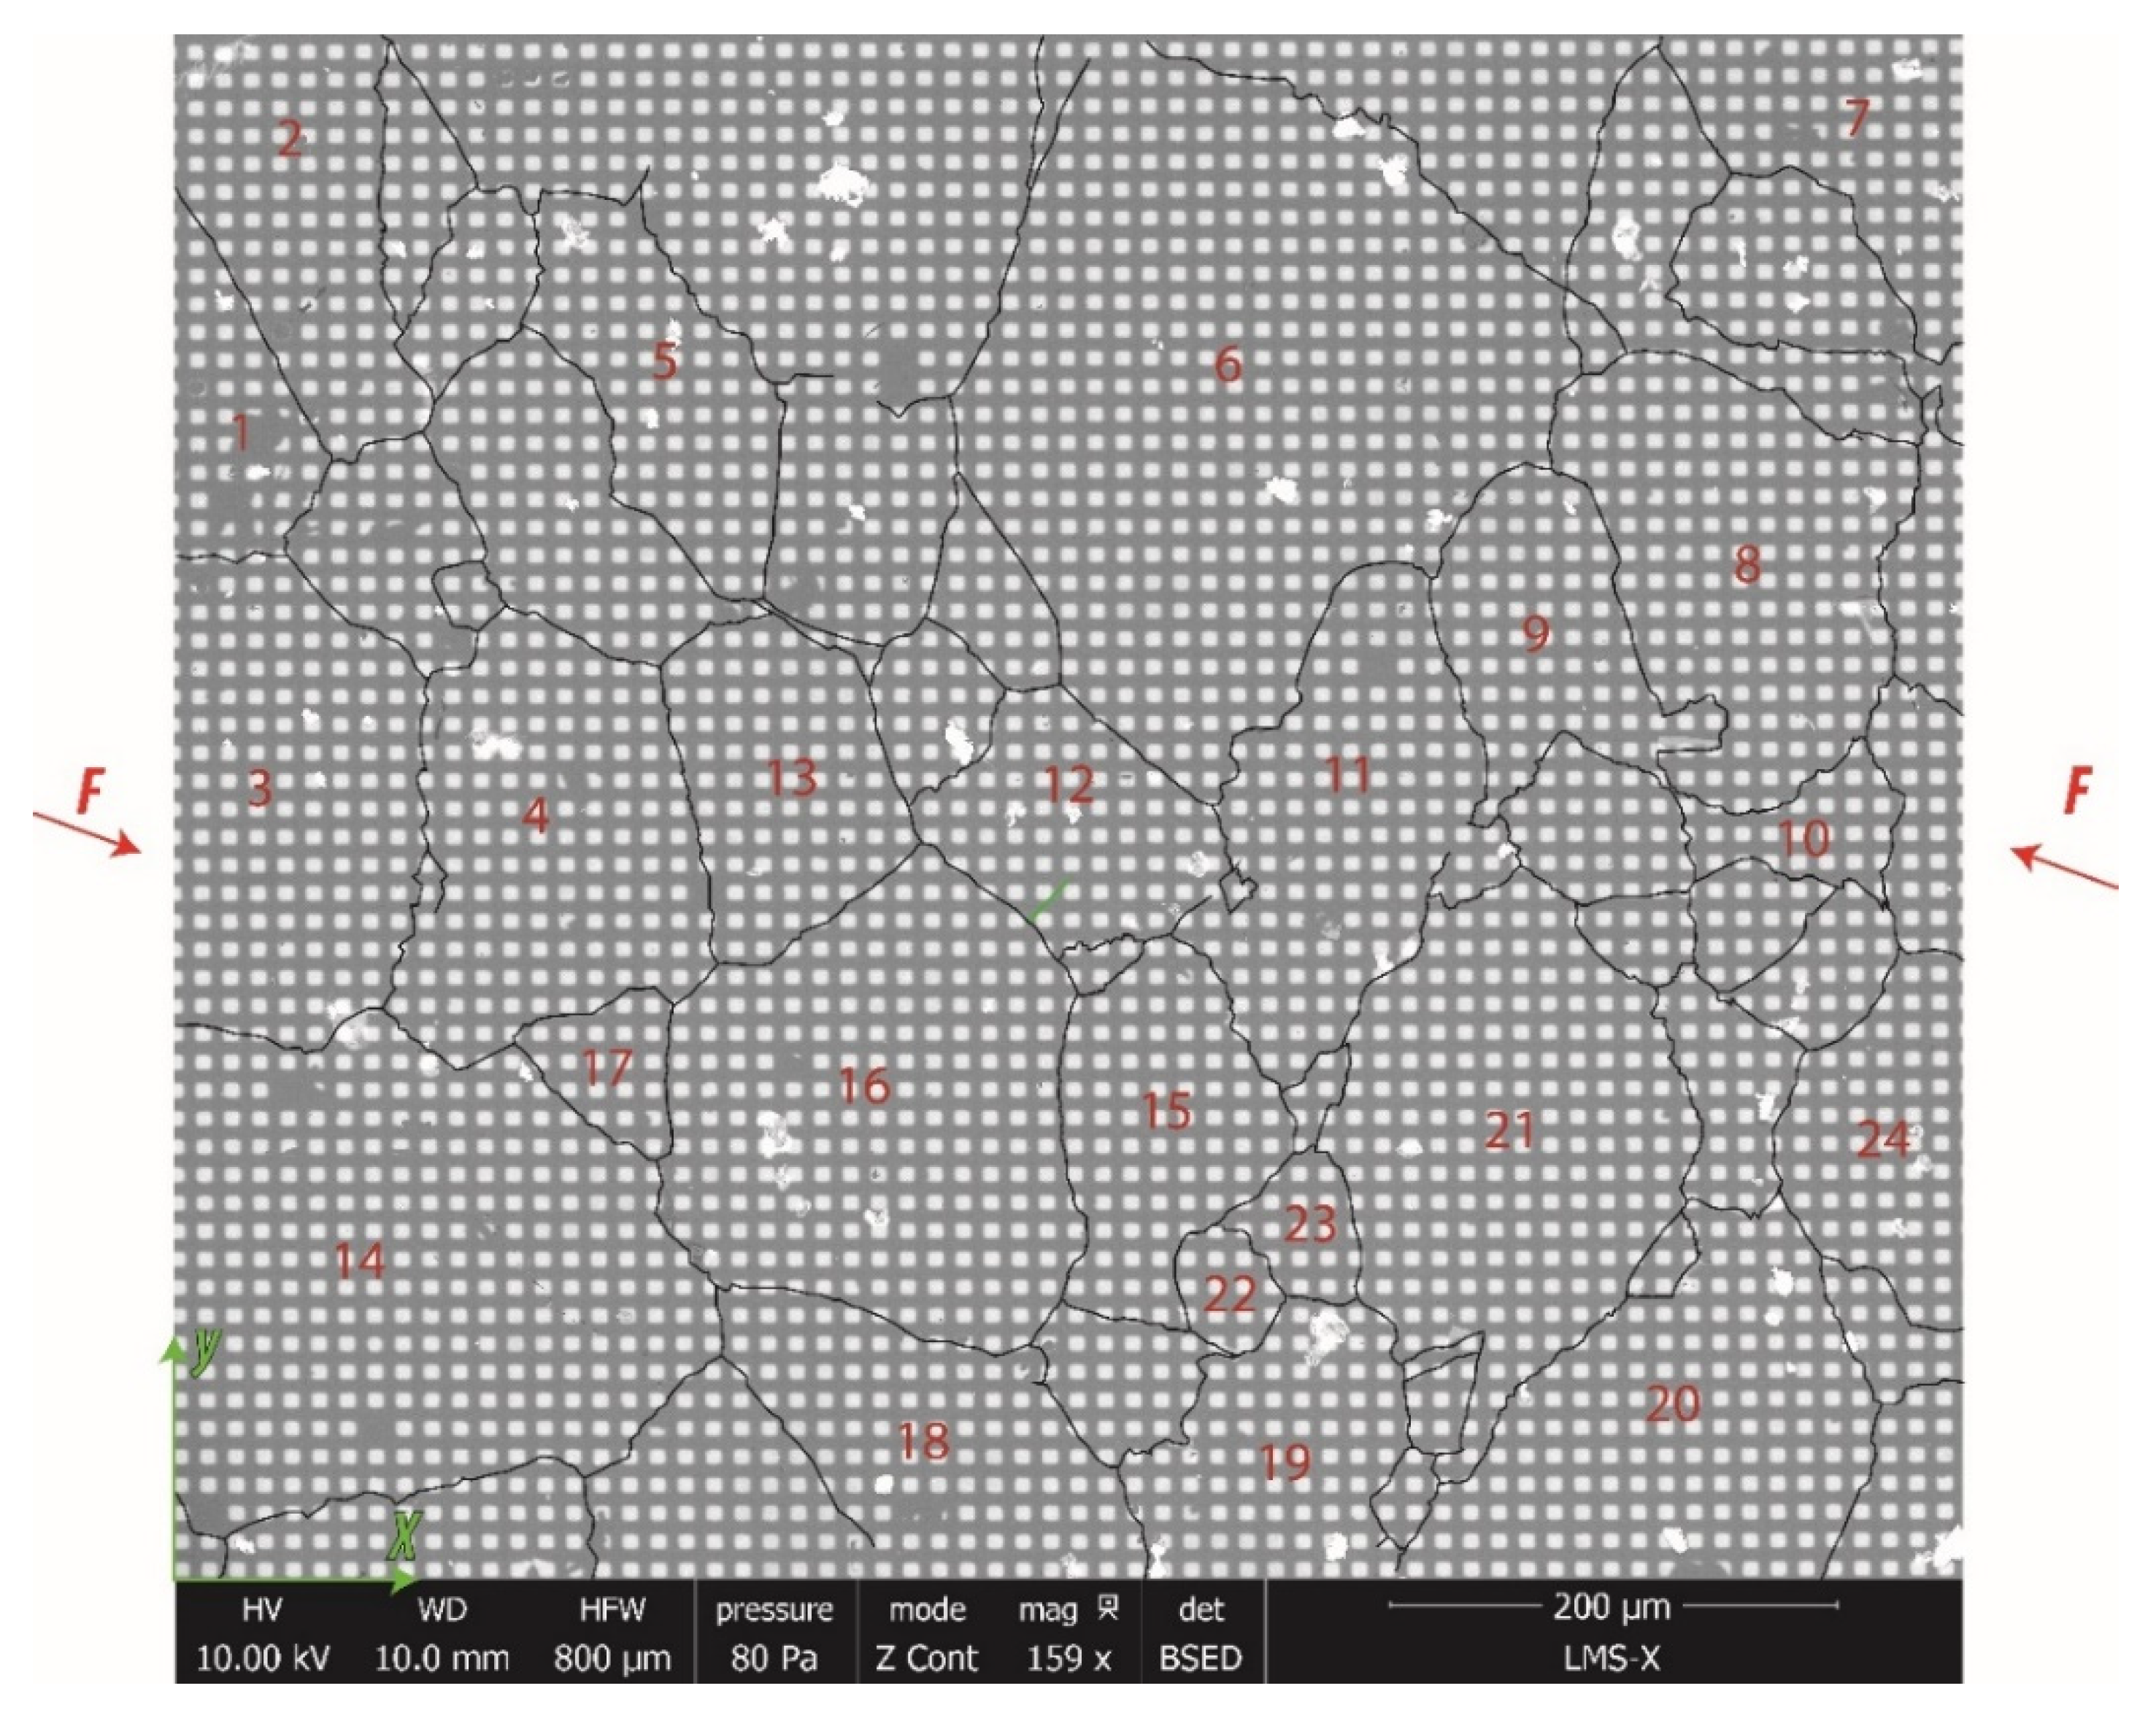
The initial state of the region of interest of the sample surface and the different constitutive crystals that could be observed and monitored is shown in Figure 4. These individual grains are numbered from 1 to 24. The force applied to the sample is rotated 20.3° downwards with respect to the X-axis of this picture, so that the positioning of the gold grid is optimal for image correlation. Grain boundaries identified from the EBSD analysis are drawn with solid black lines for clarity.
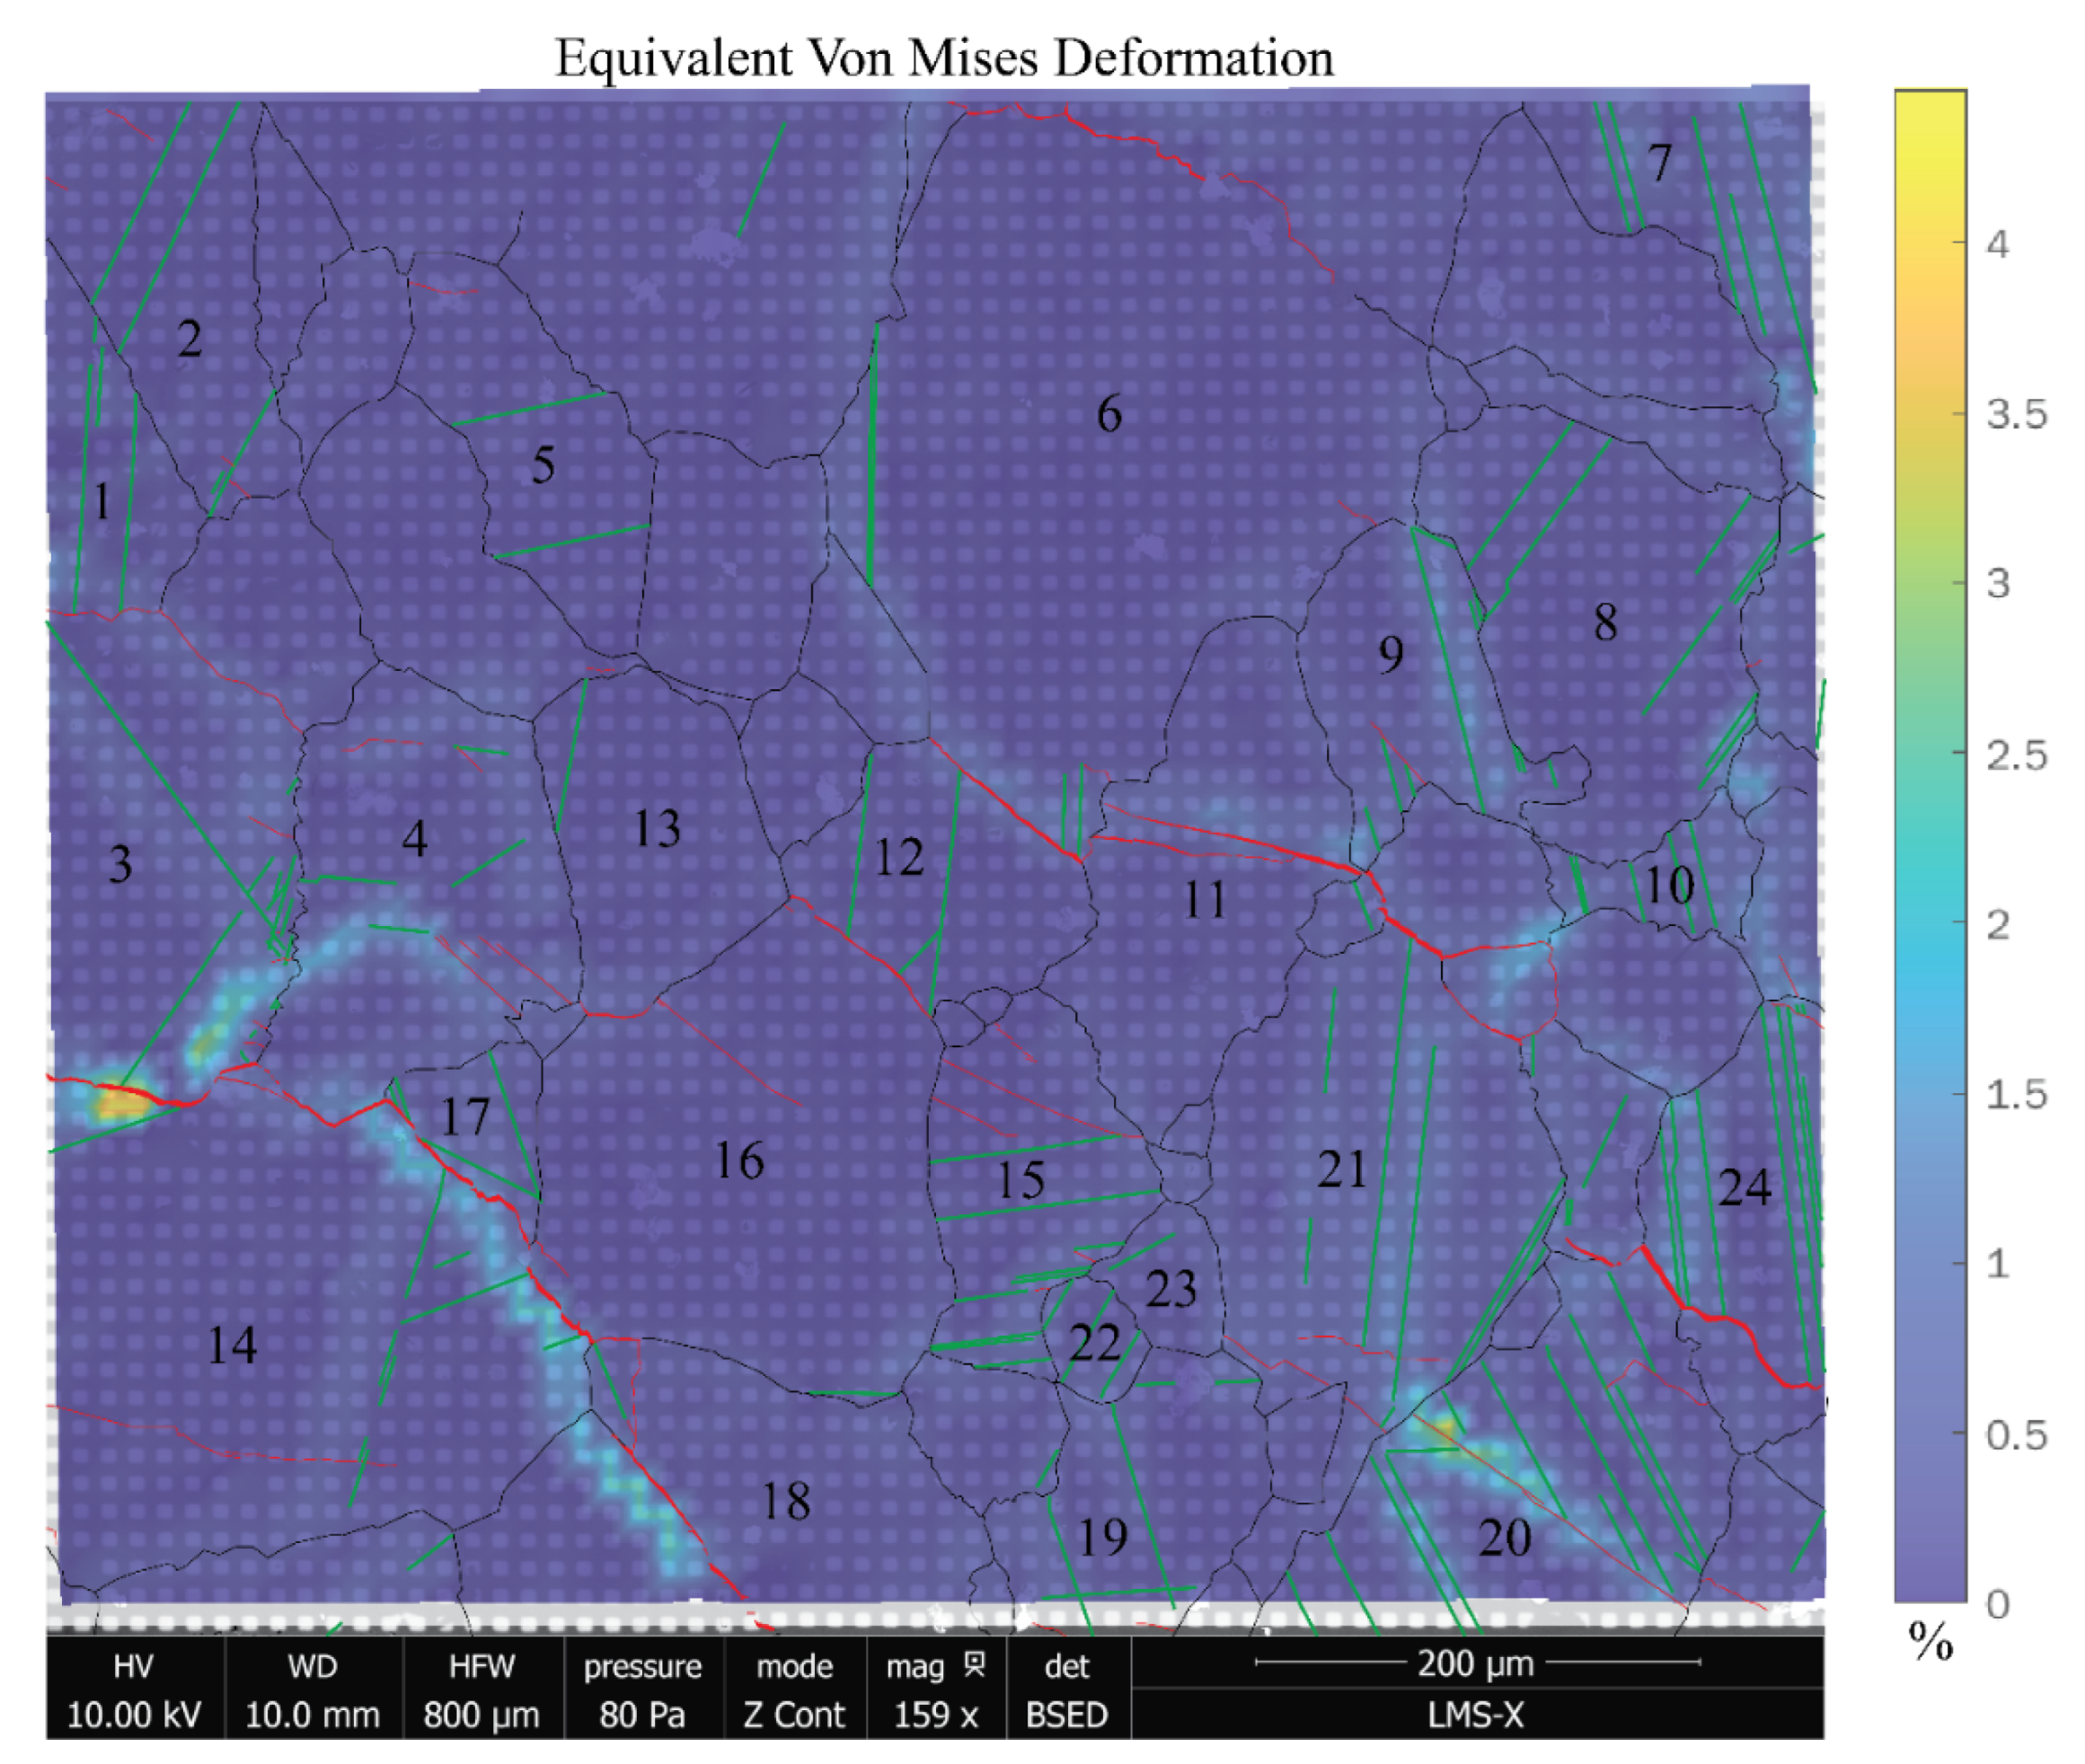
To quantify the deformations of the crystals, we used the DIC software CorrelManuV (Michel Bornert). The in-plane strain computation is performed assuming axisymmetric deformation, which is a reasonable hypothesis for a non-textured polycrystalline material. Figure 7 shows the equivalent strain map (second invariant of the in-plane strain tensor) obtained for loading step 6 and corresponding to sample resistance of 40.1 MPa (Figure 6). The largest plastic strains are localized at the grain boundaries, although plastic strain bands do cross some individual grains. Intra- and inter-granular micro-fracture opening is indicated in red, together with frictional sliding along de-cohesive grain boundaries. Both semi-brittle features are aligned sub-parallel to the compression direction. The marker size is not fine enough to obtain high spatial resolution; therefore, the ductile intra-granular localization bands, reaching about 2% strain, appear diffuse. The corresponding twinning activity, observed on the original SEM micrographs, is superimposed as green solid straight lines.
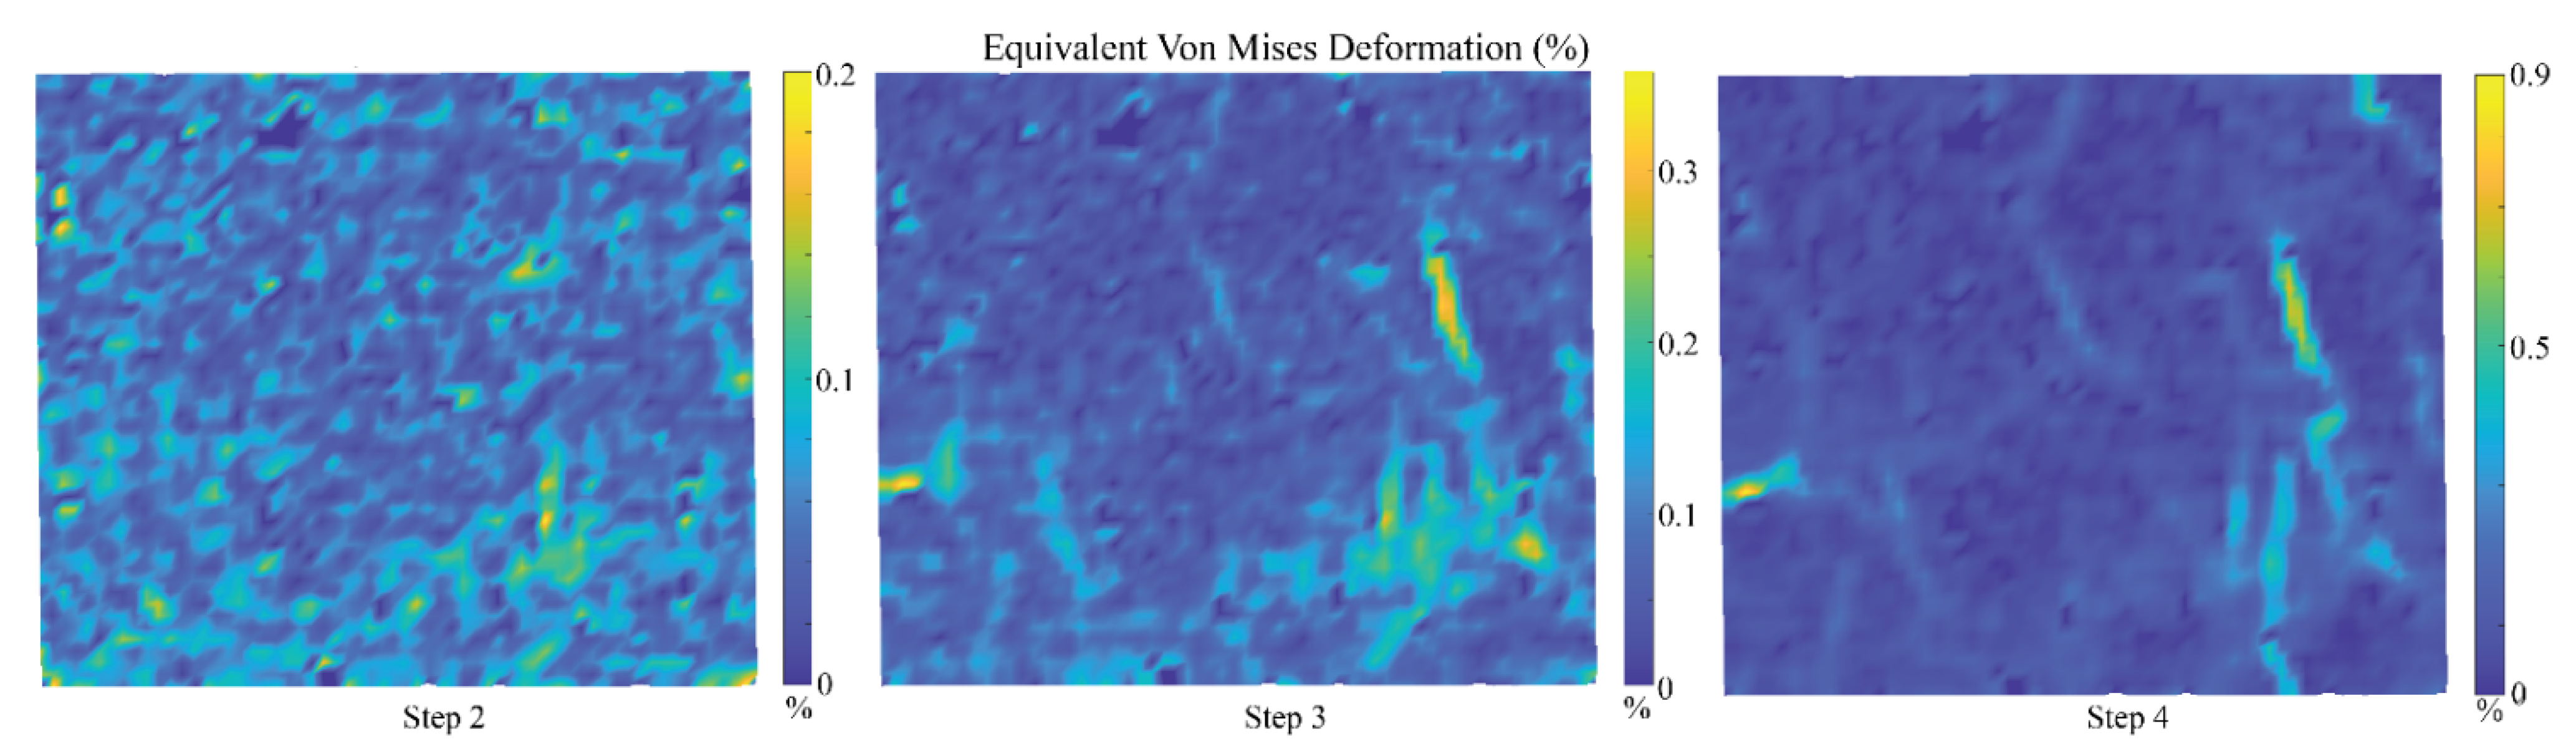
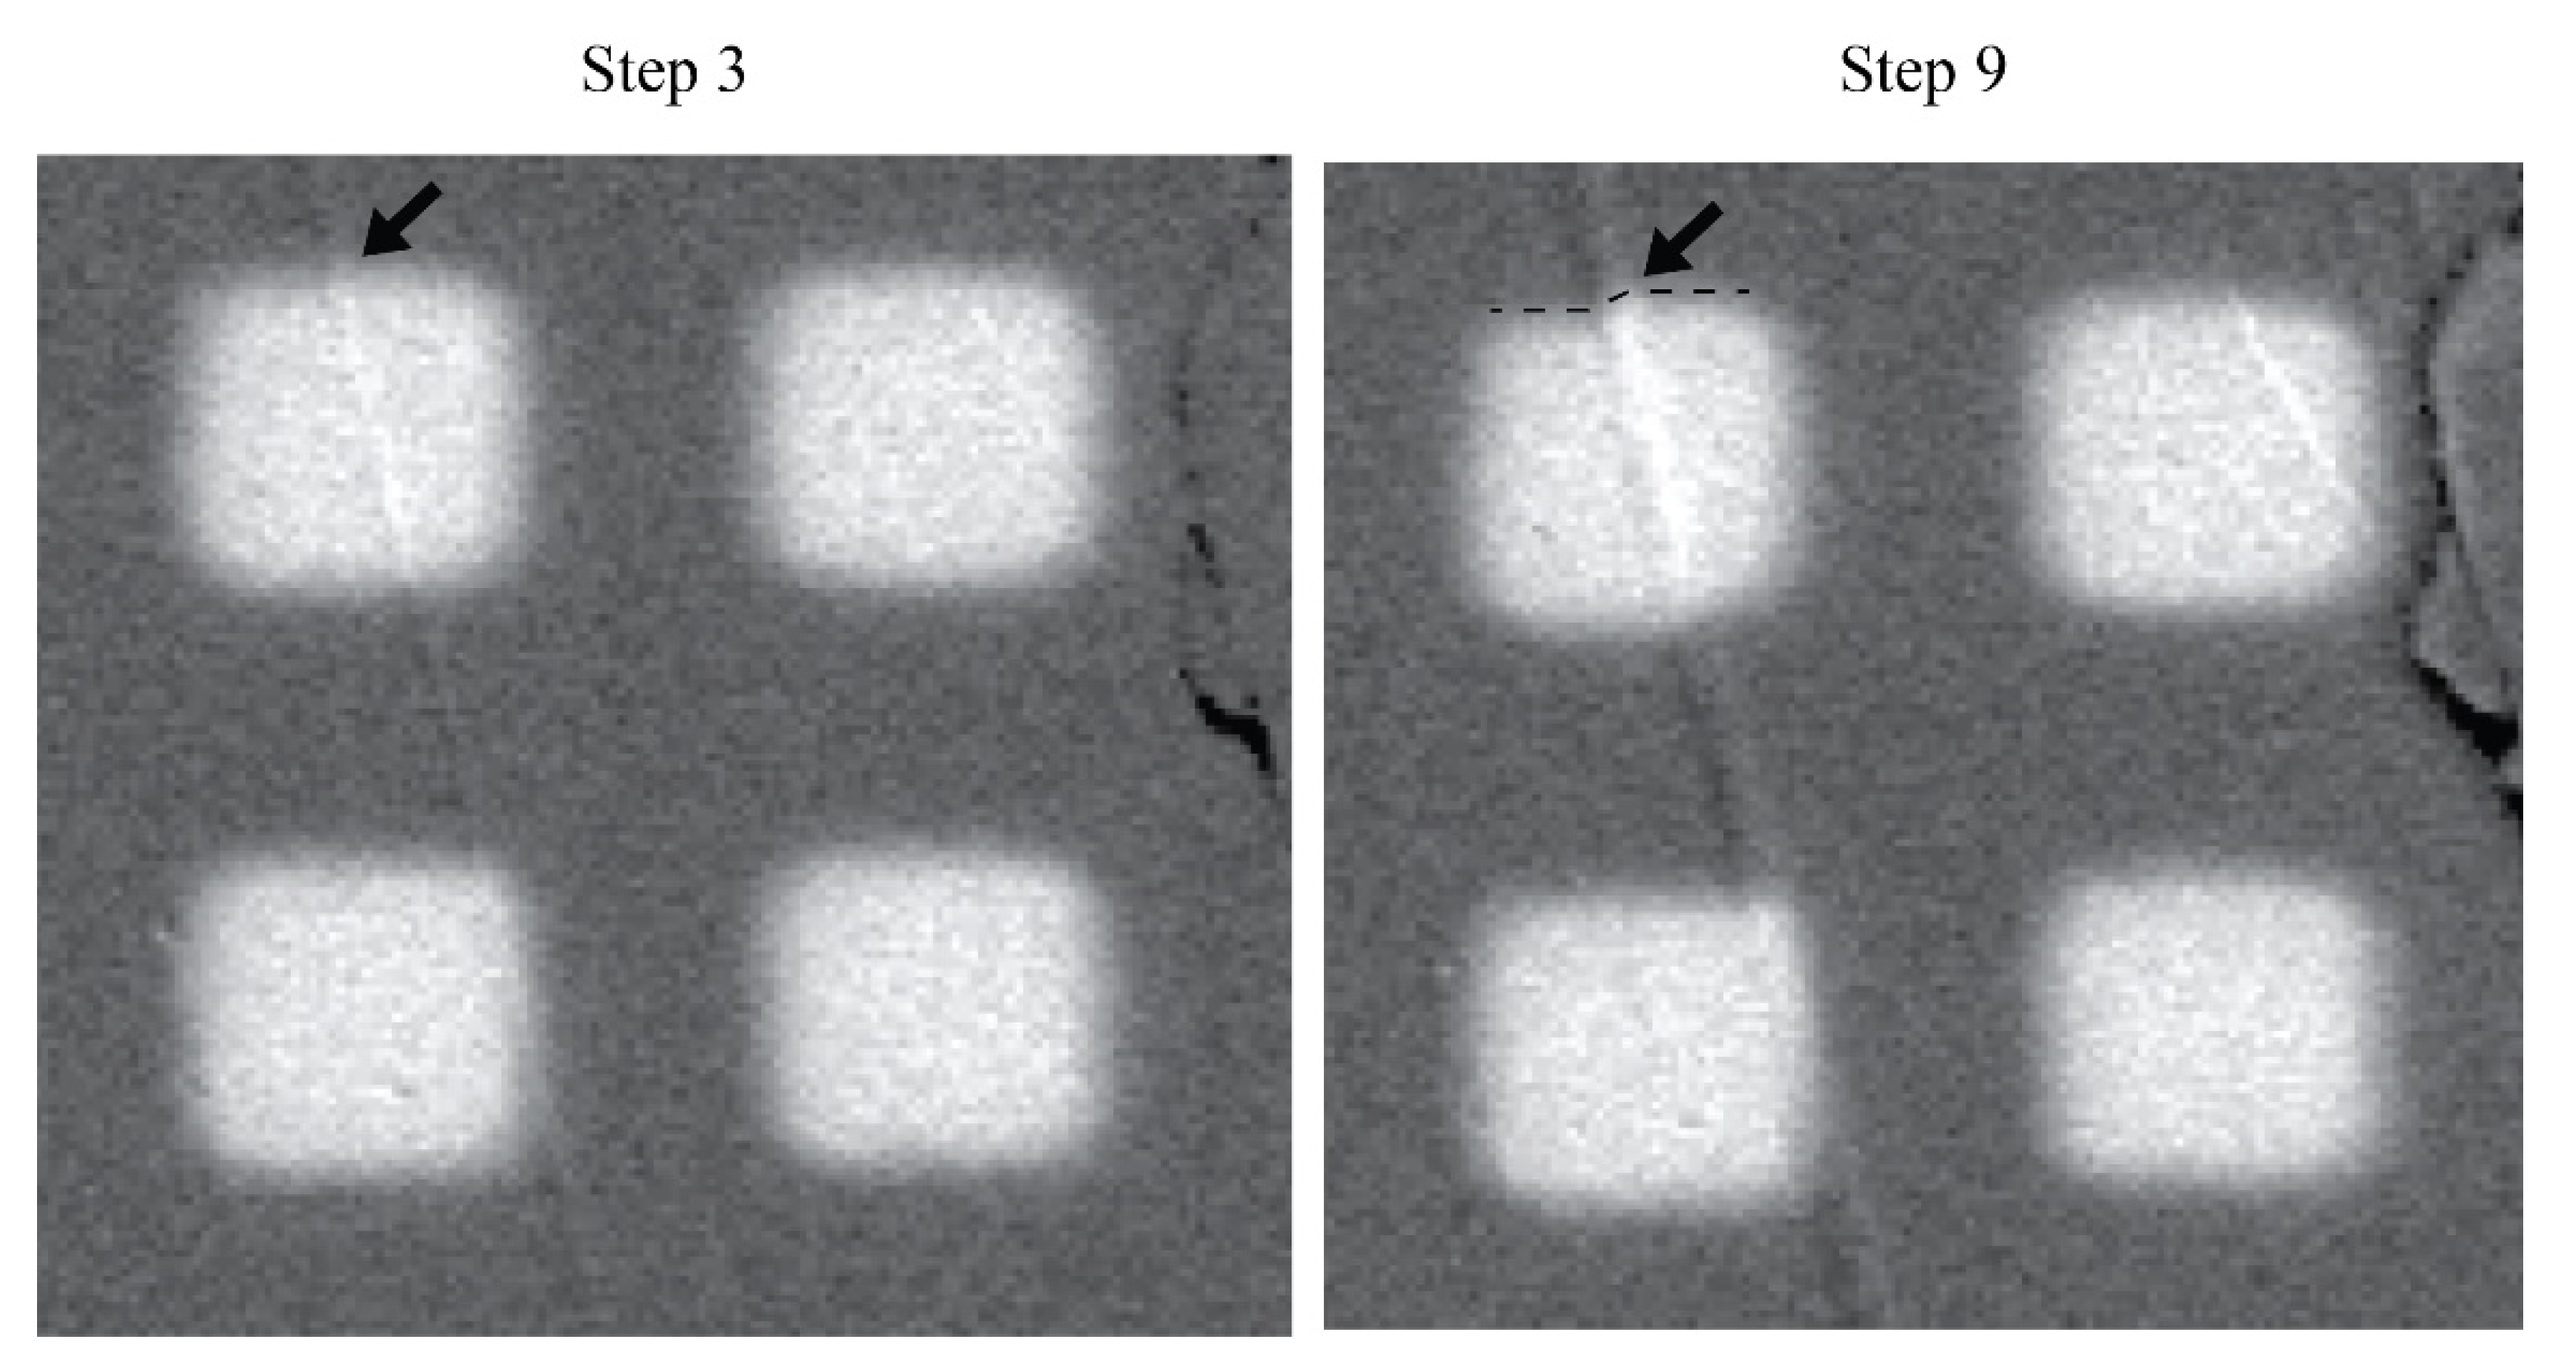
Strain localization, along the disjointed grain boundaries (Figure 8), occurs very early, at loading step 3. Shear localization related to the appearance of twin planes is also observed. The areas where early activated twinning is detected correspond to future densification of twins. In step 3 of the deformation (Figure 8), we find an early deformation of 0.35% in crystal 9 (Figure 6). In Figure 8, we can see the evolution of the deformation of the grain at steps 3, 6 and 9, showing the progressive localization of strain in the same shear zone where the initial twinning is observed at step 3 (0.35% strain). The twin planes activated at step 3 continue to thicken throughout the experiment until the final step (Figure 9), accumulating over 3% strain. This family of twin planes is the densest across the entire crystal surface. Similar thickening of early activated twins is observed in almost all crystals that twinned early in the experiment. Further, thickening of the early twins precedes the activation of new twins from the same family. Sometimes, a second family of twins can be activated but it never becomes dominant.
3.2. Observation of Individual Grains
DIC analysis was also used to quantify the intra-granular strain of the individual calcite grains constituting the region of interest. EBSD analysis subsequent to deformation allowed us to determine the orientation of the twin planes that were activated in the individual calcite crystals, based on their traces on the observation surface. In the following, we describe, in detail, the active deformation mechanisms for selected grains.
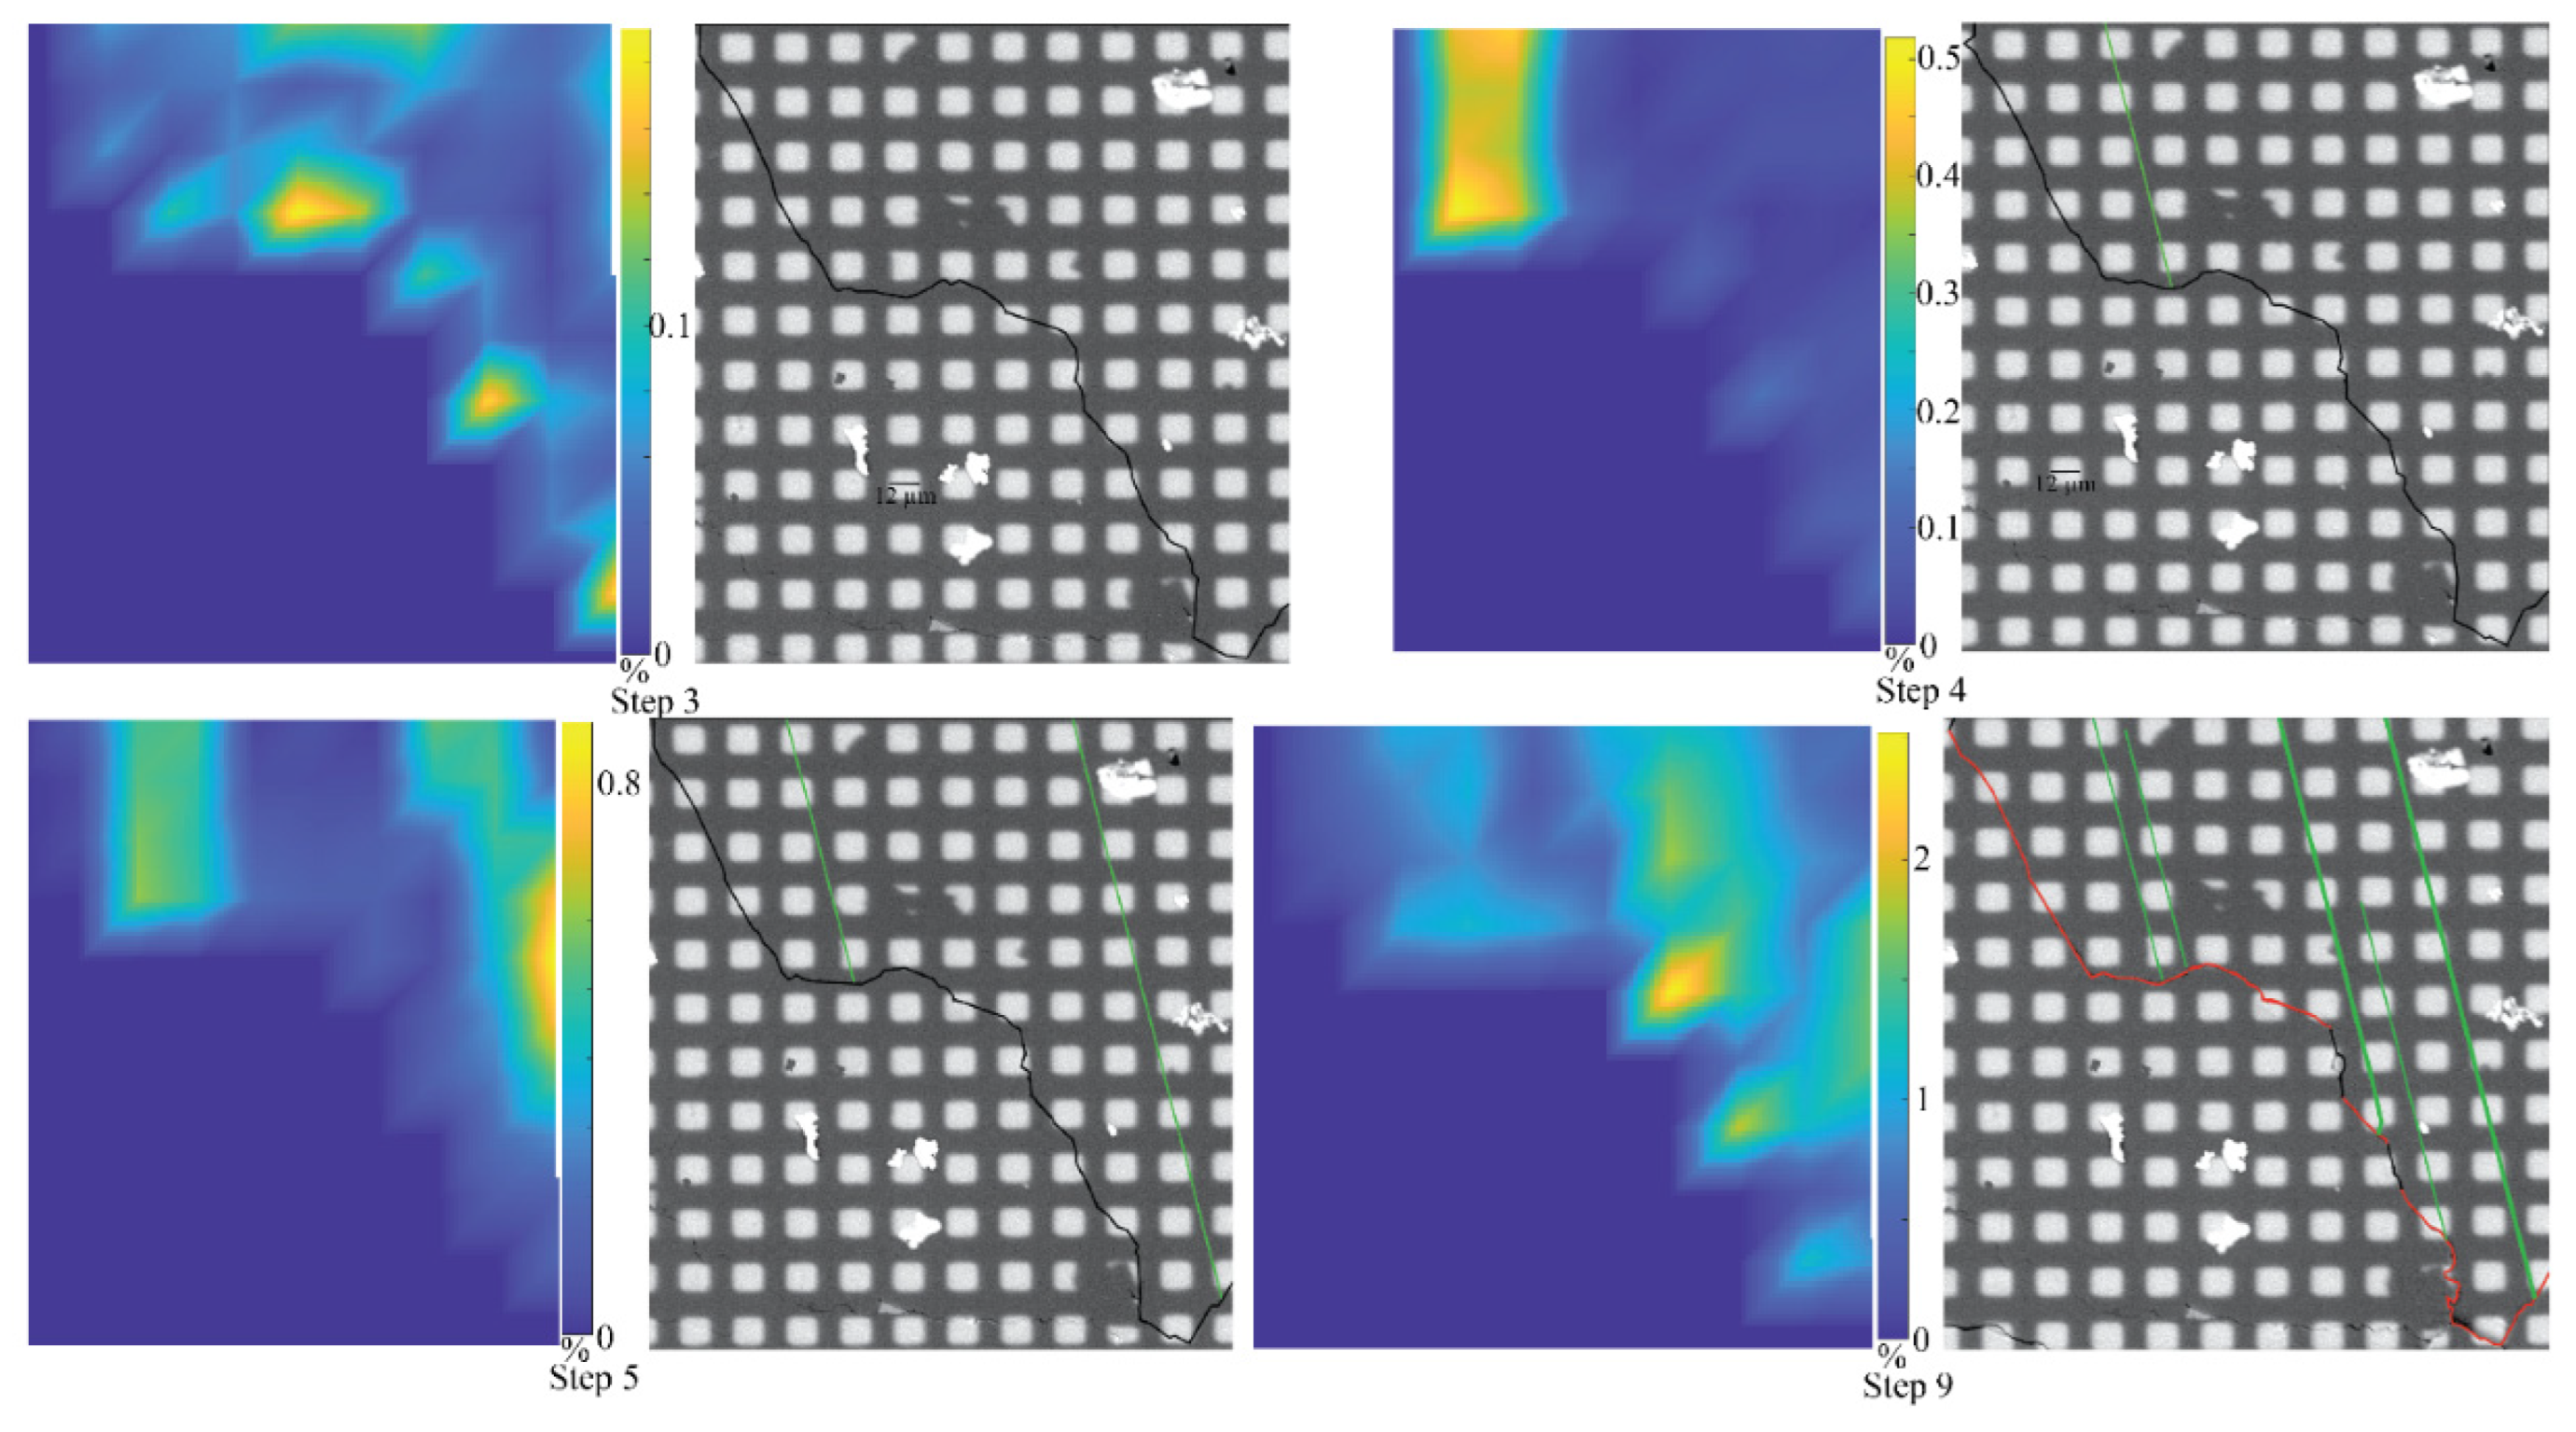
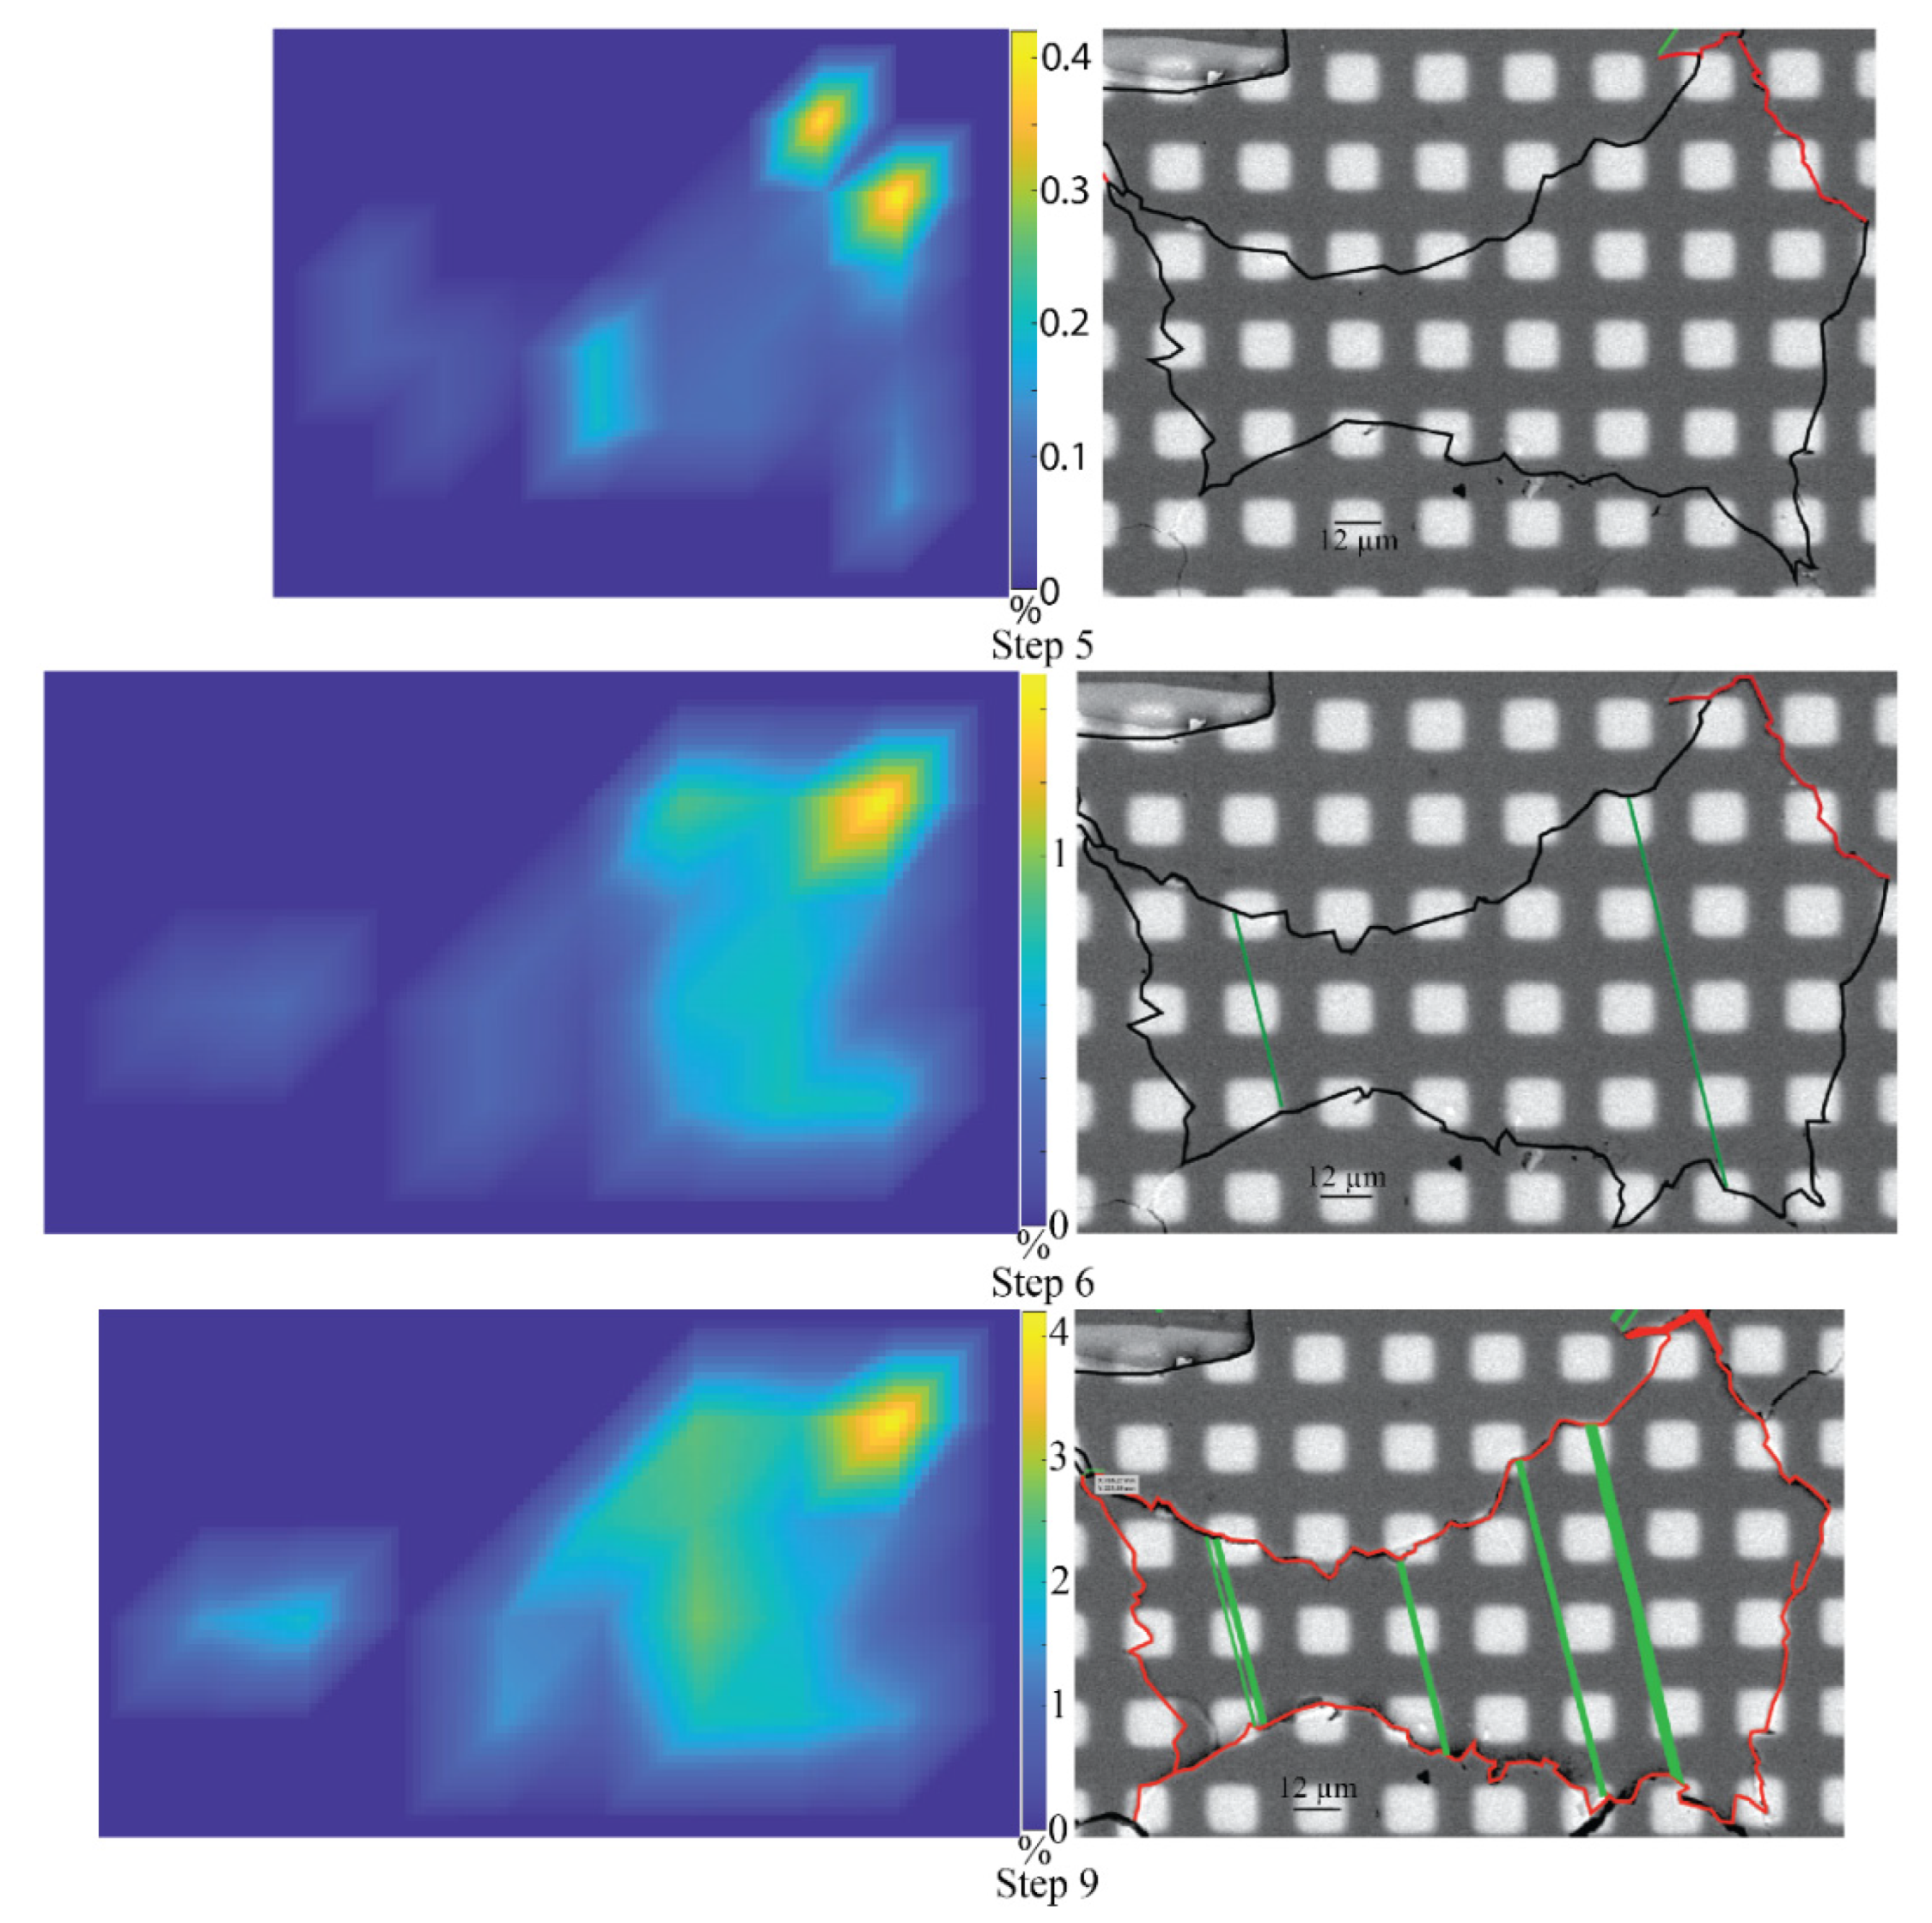
Crystal 1 is located at the left-edge limit of the observation surface. It is, therefore, not fully visible. Only one family of twin systems has been activated and is visible from step 5. It starts by activating only one twin lamella. As the load increases, twinning activity increases and the lamella thickens, as shown in Figure 9.
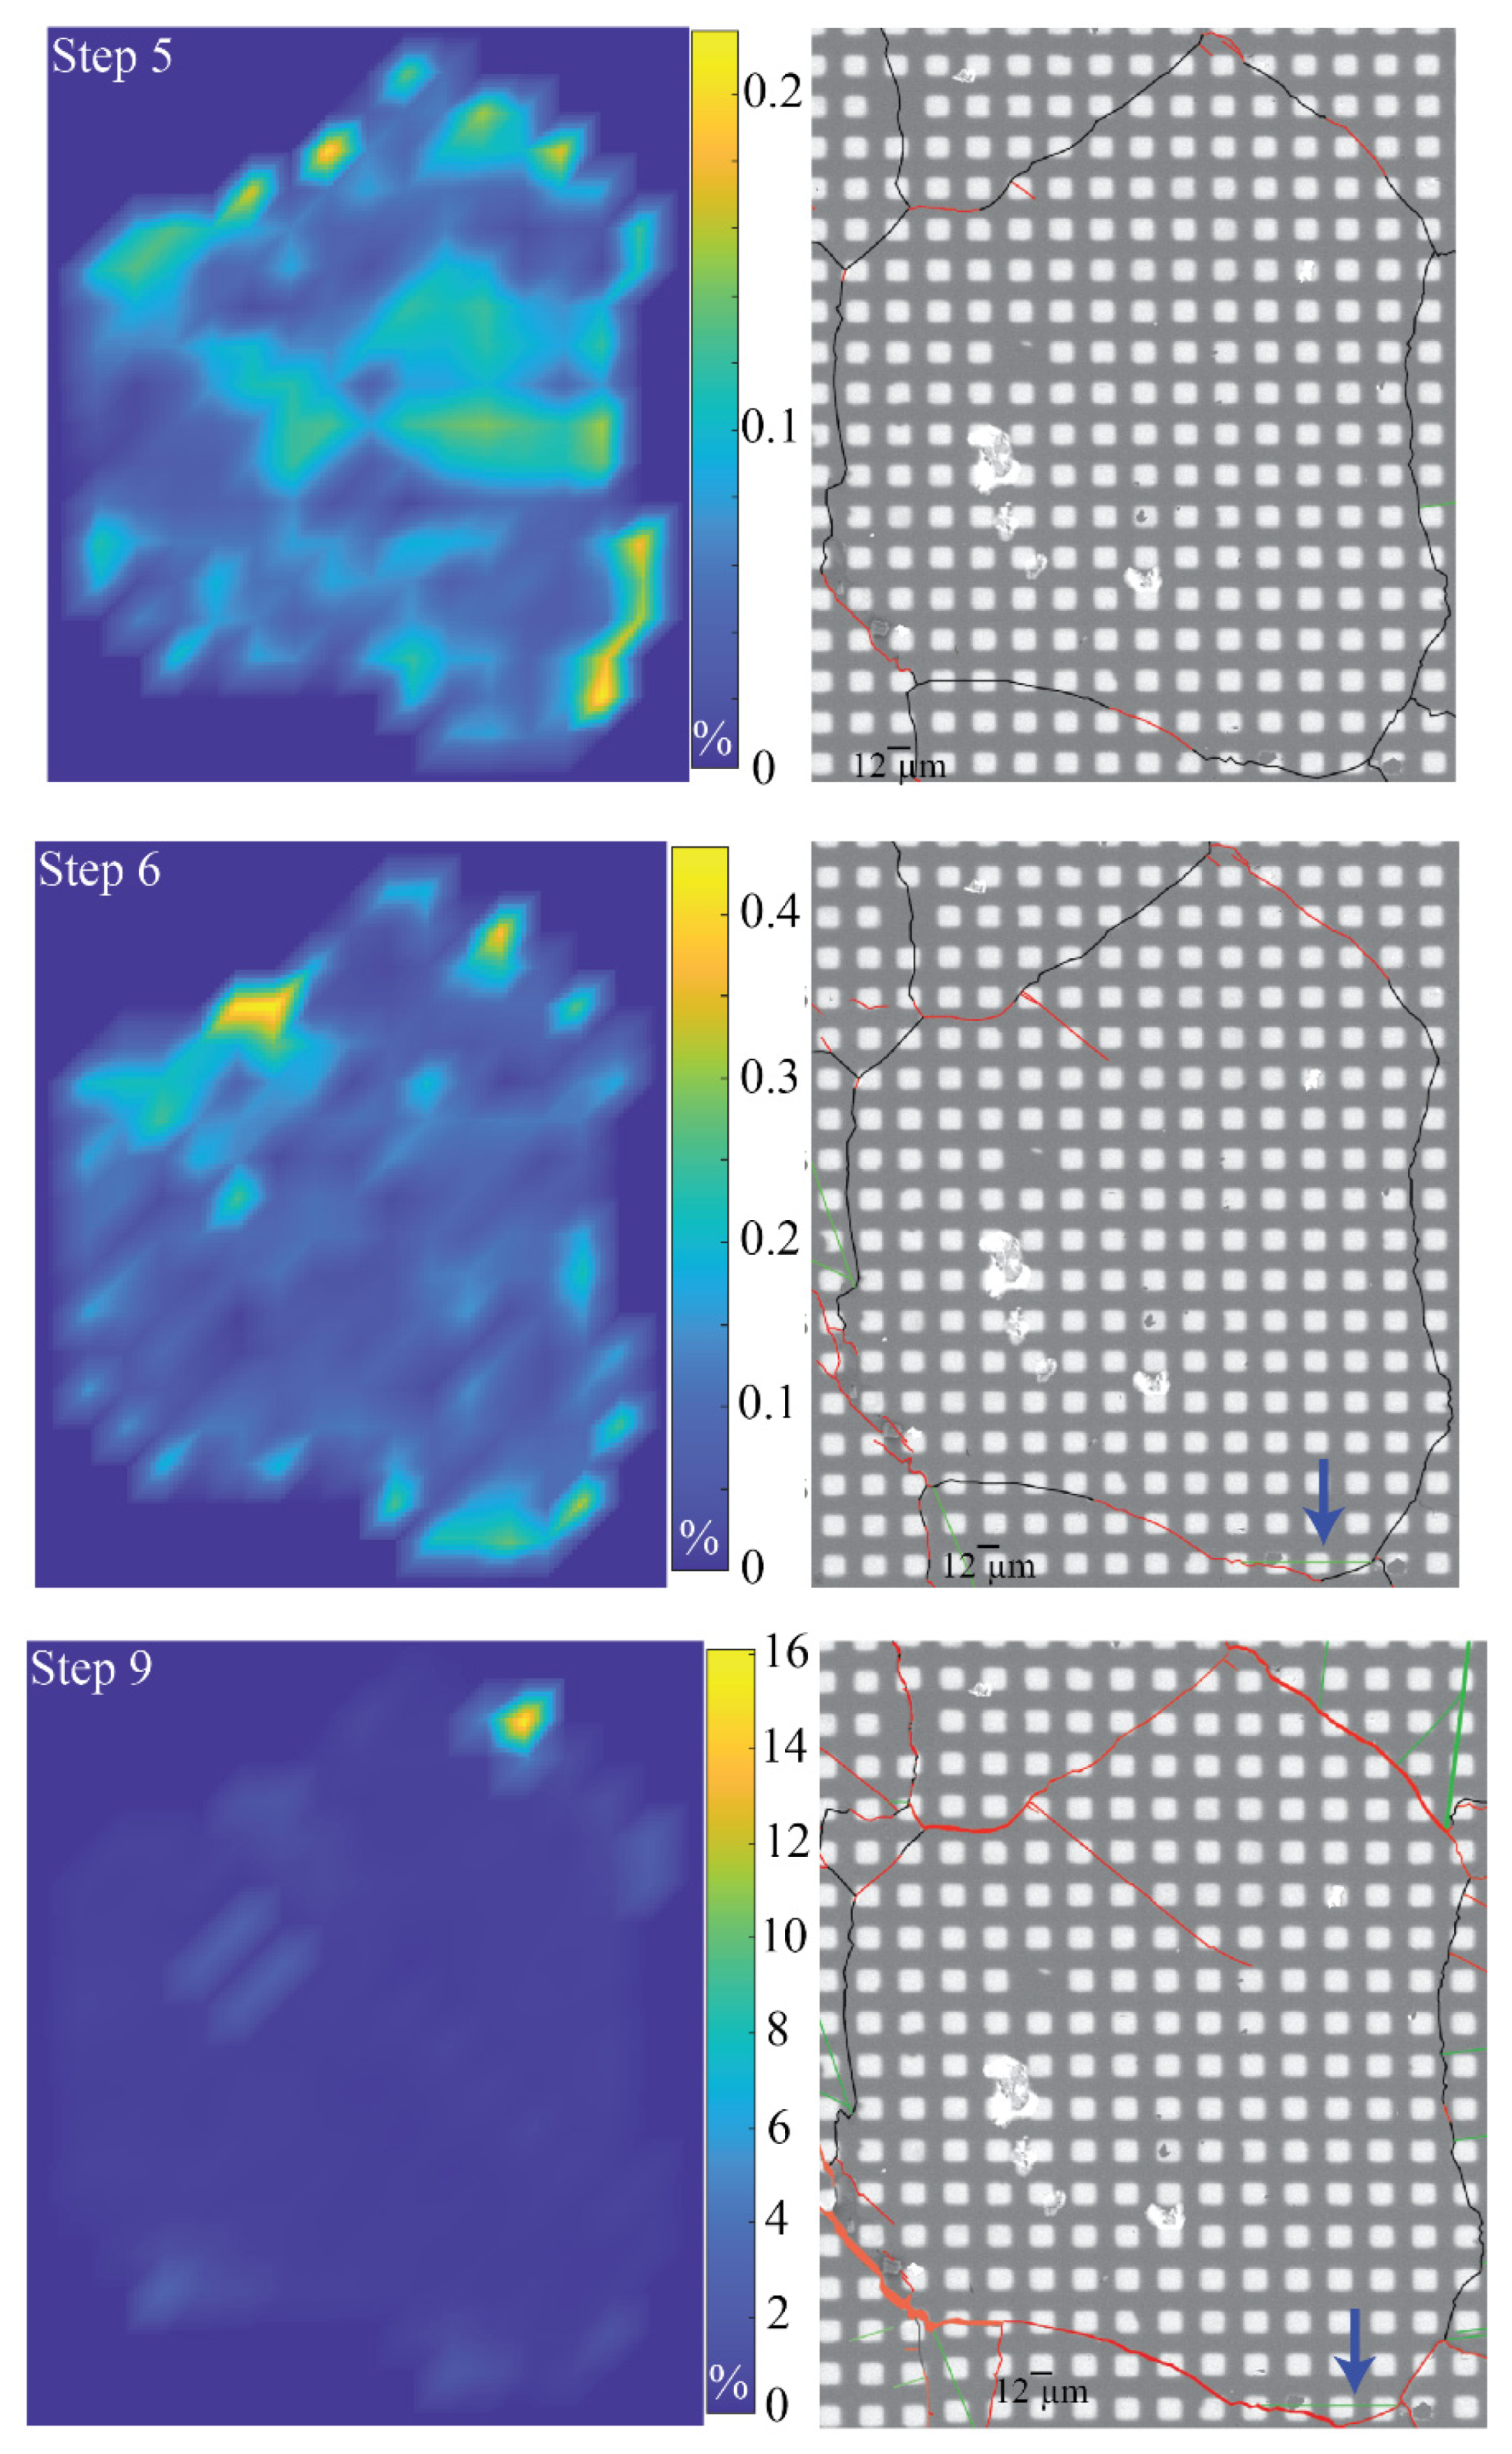
Crystal 2 (Figure 10) activates the twinning between steps 4 and 6, so that the trace of the twinned plane becomes visible on the surface of the sample from step 6. The DIC analysis shows that strain is first localized at the grain boundaries. At Step 6, up to 0.3% strain localizes as twinning. It is interesting to note that several twins originate from triple-grain junctions, which may act as stress concentration zones. A few intra-granular fractures remain limited, close to grain boundaries.
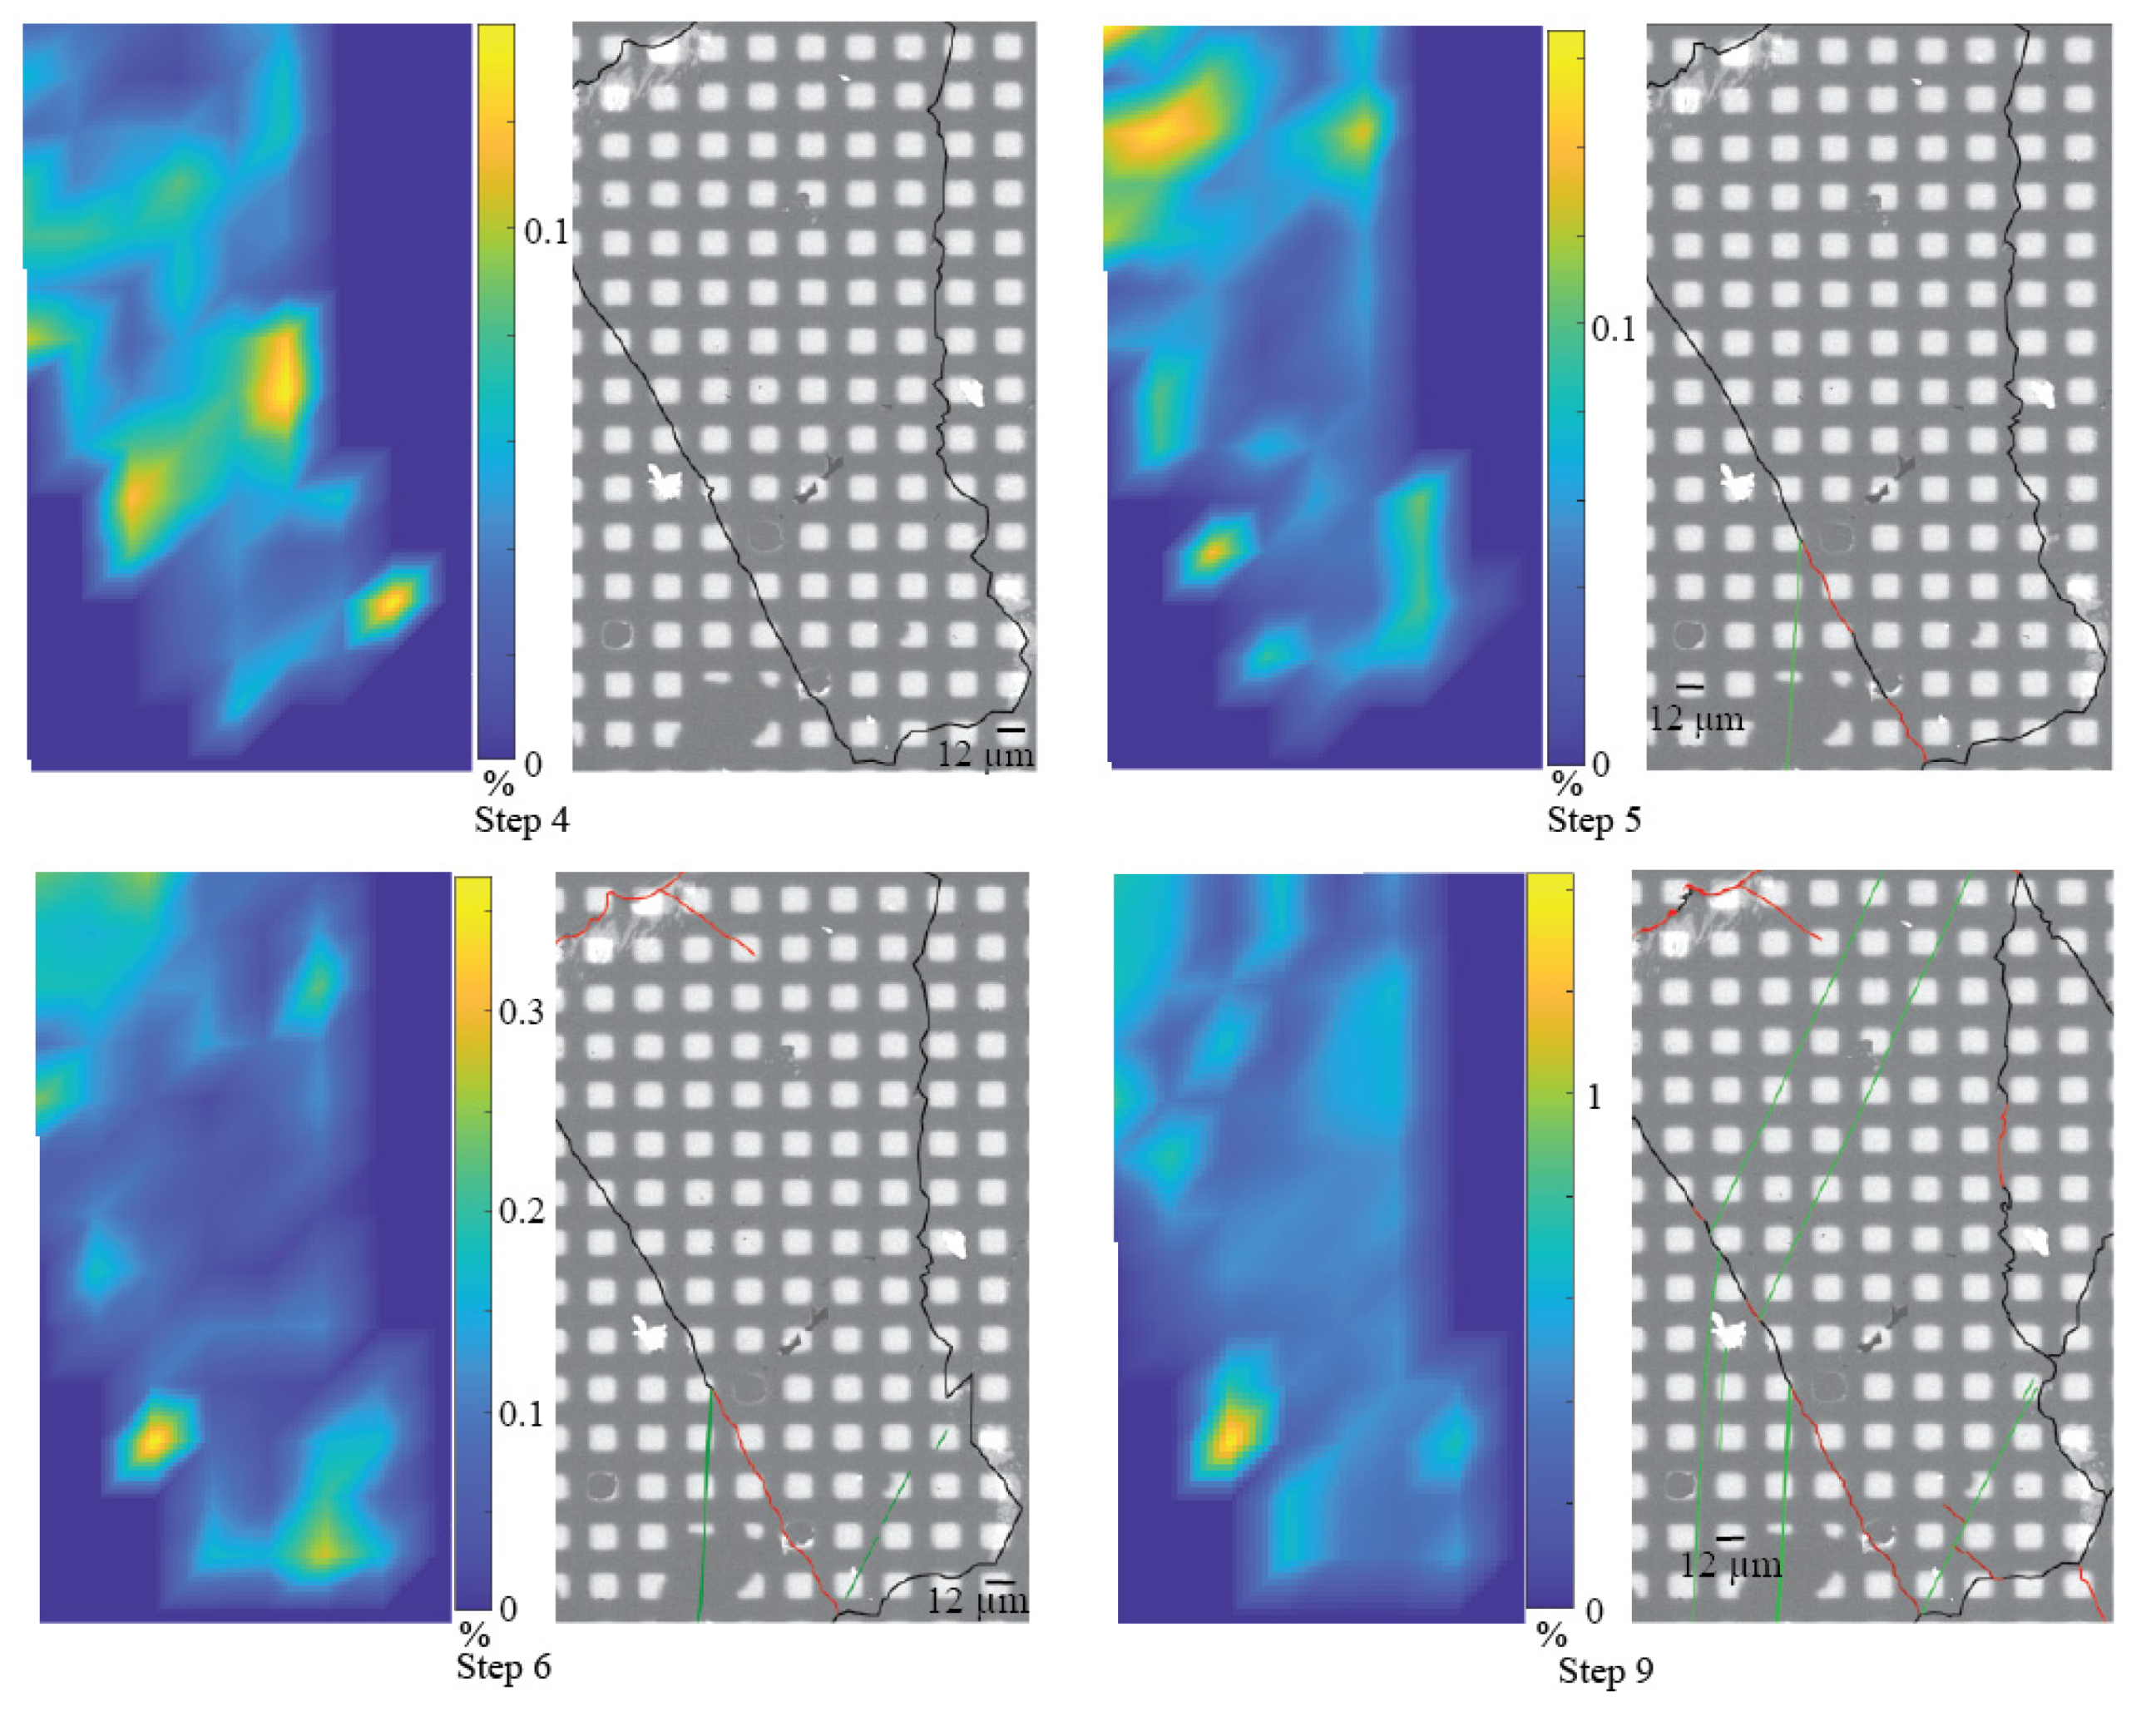
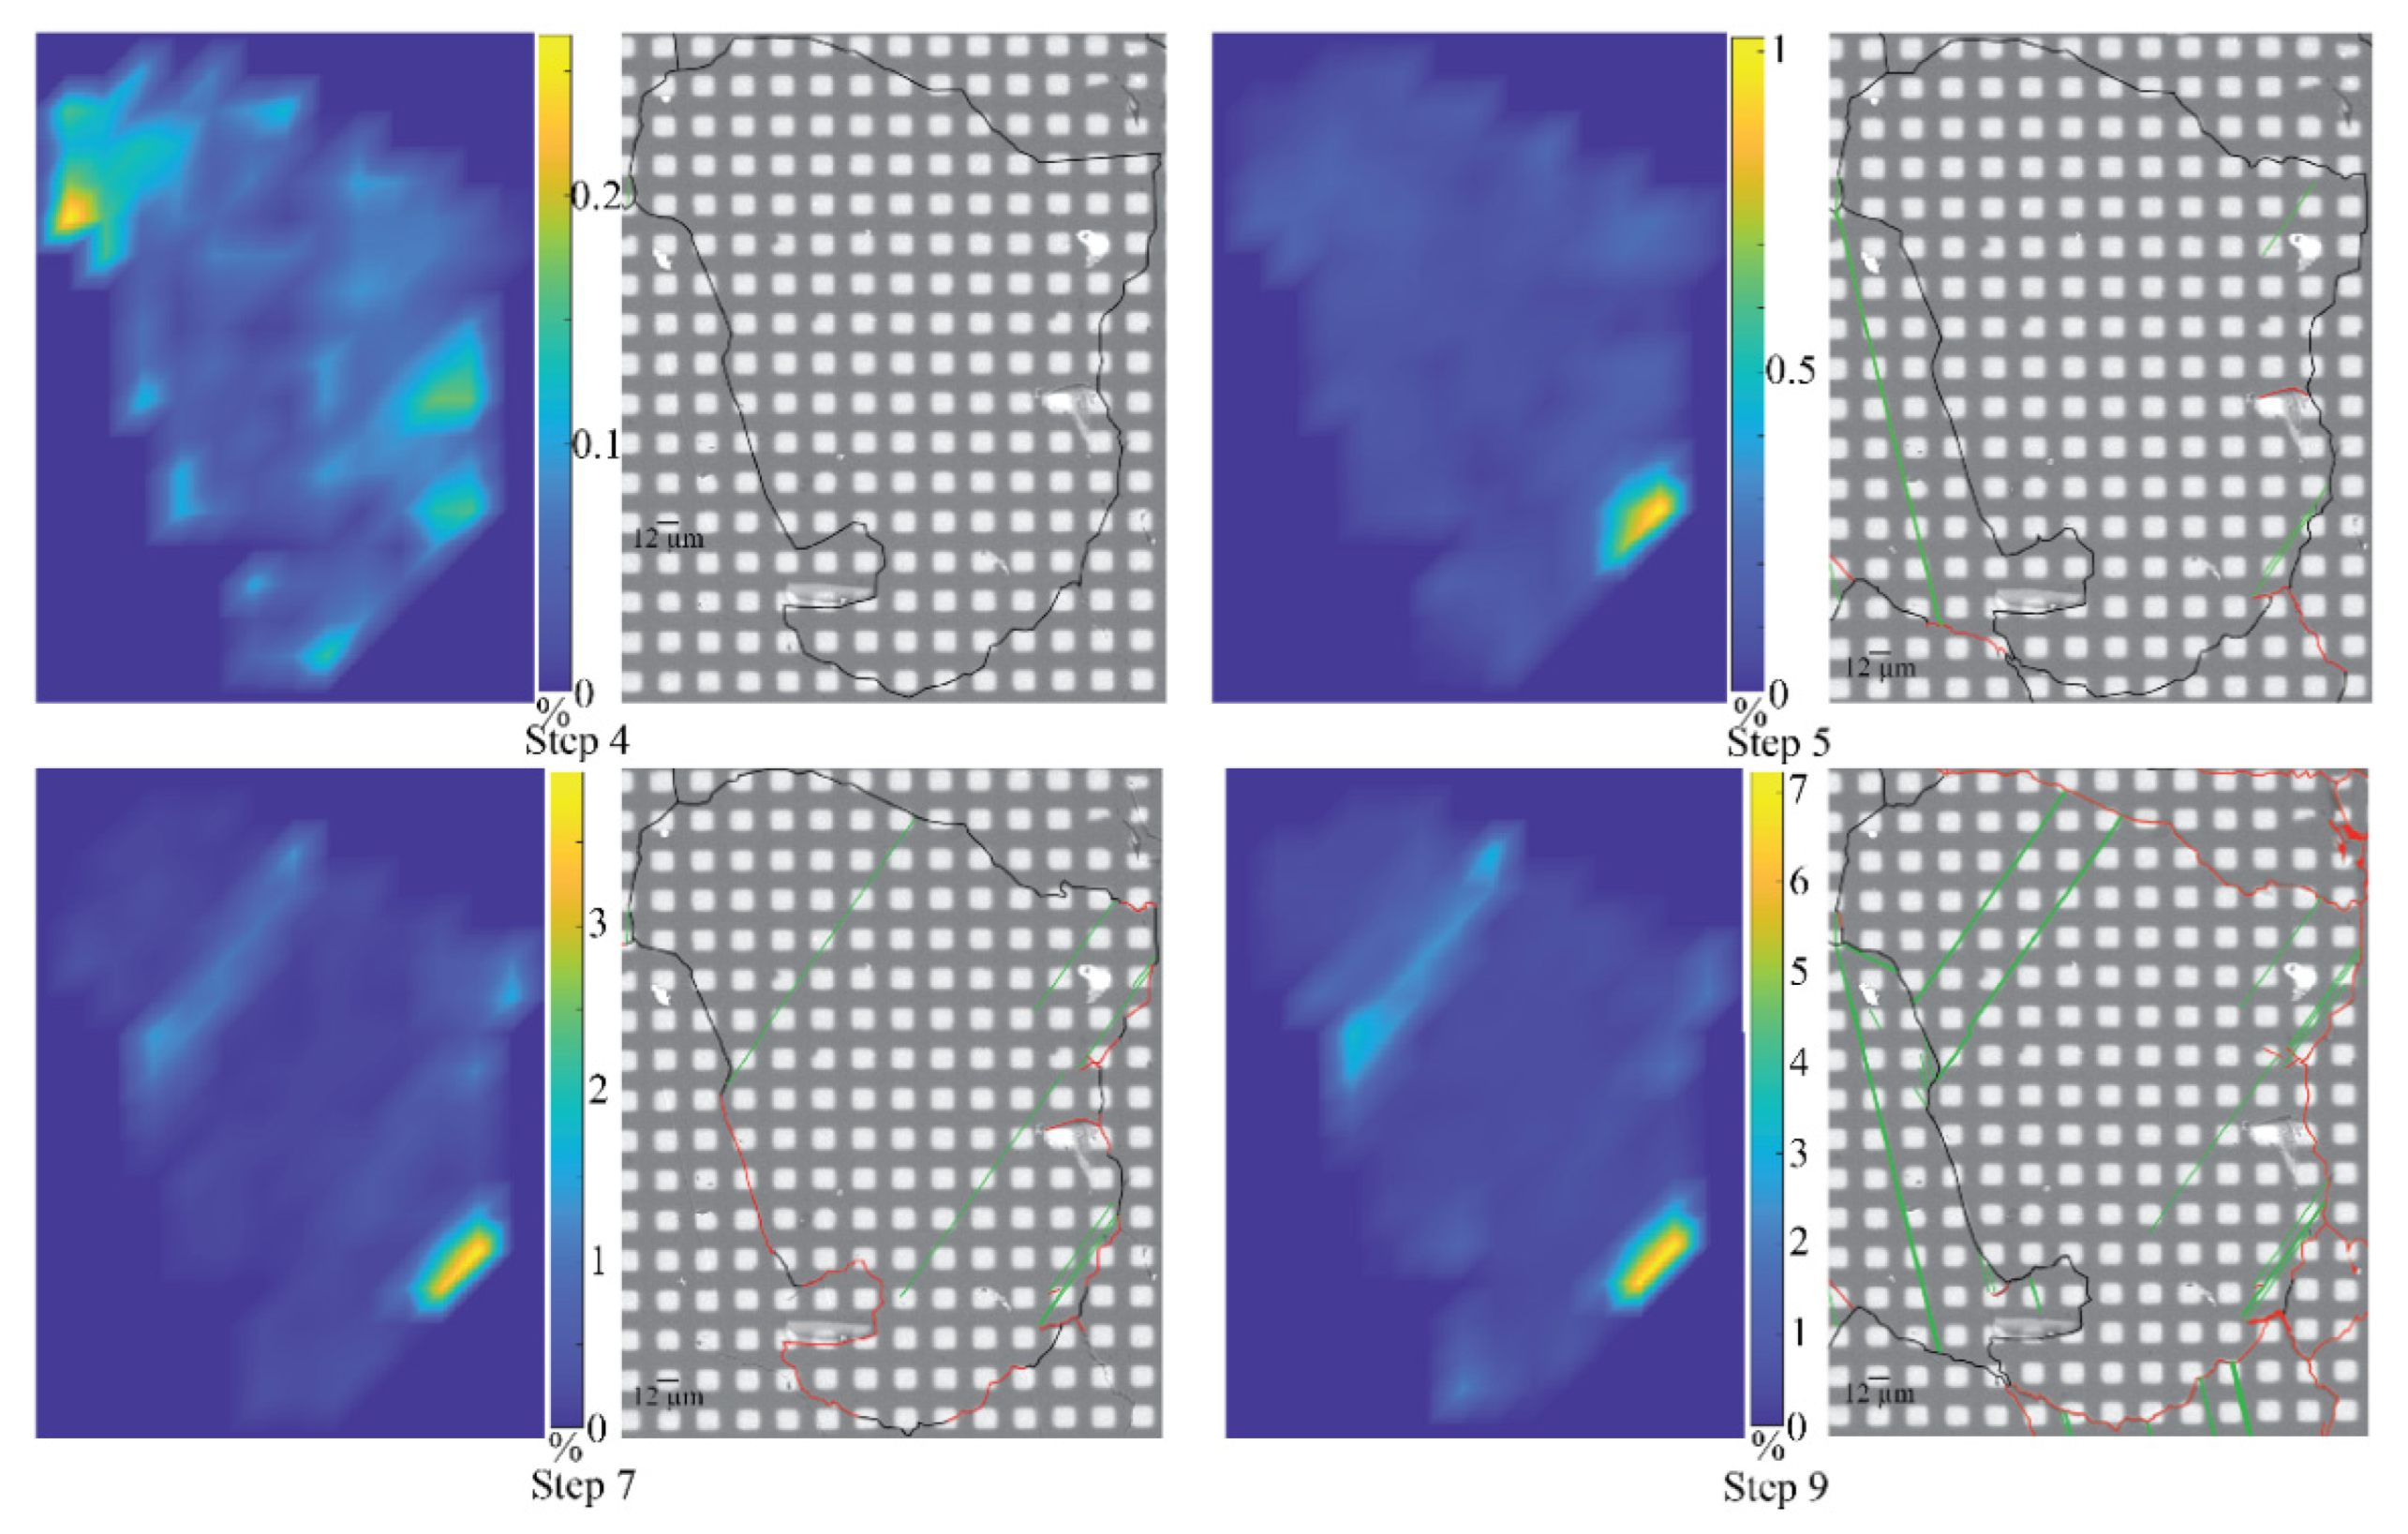
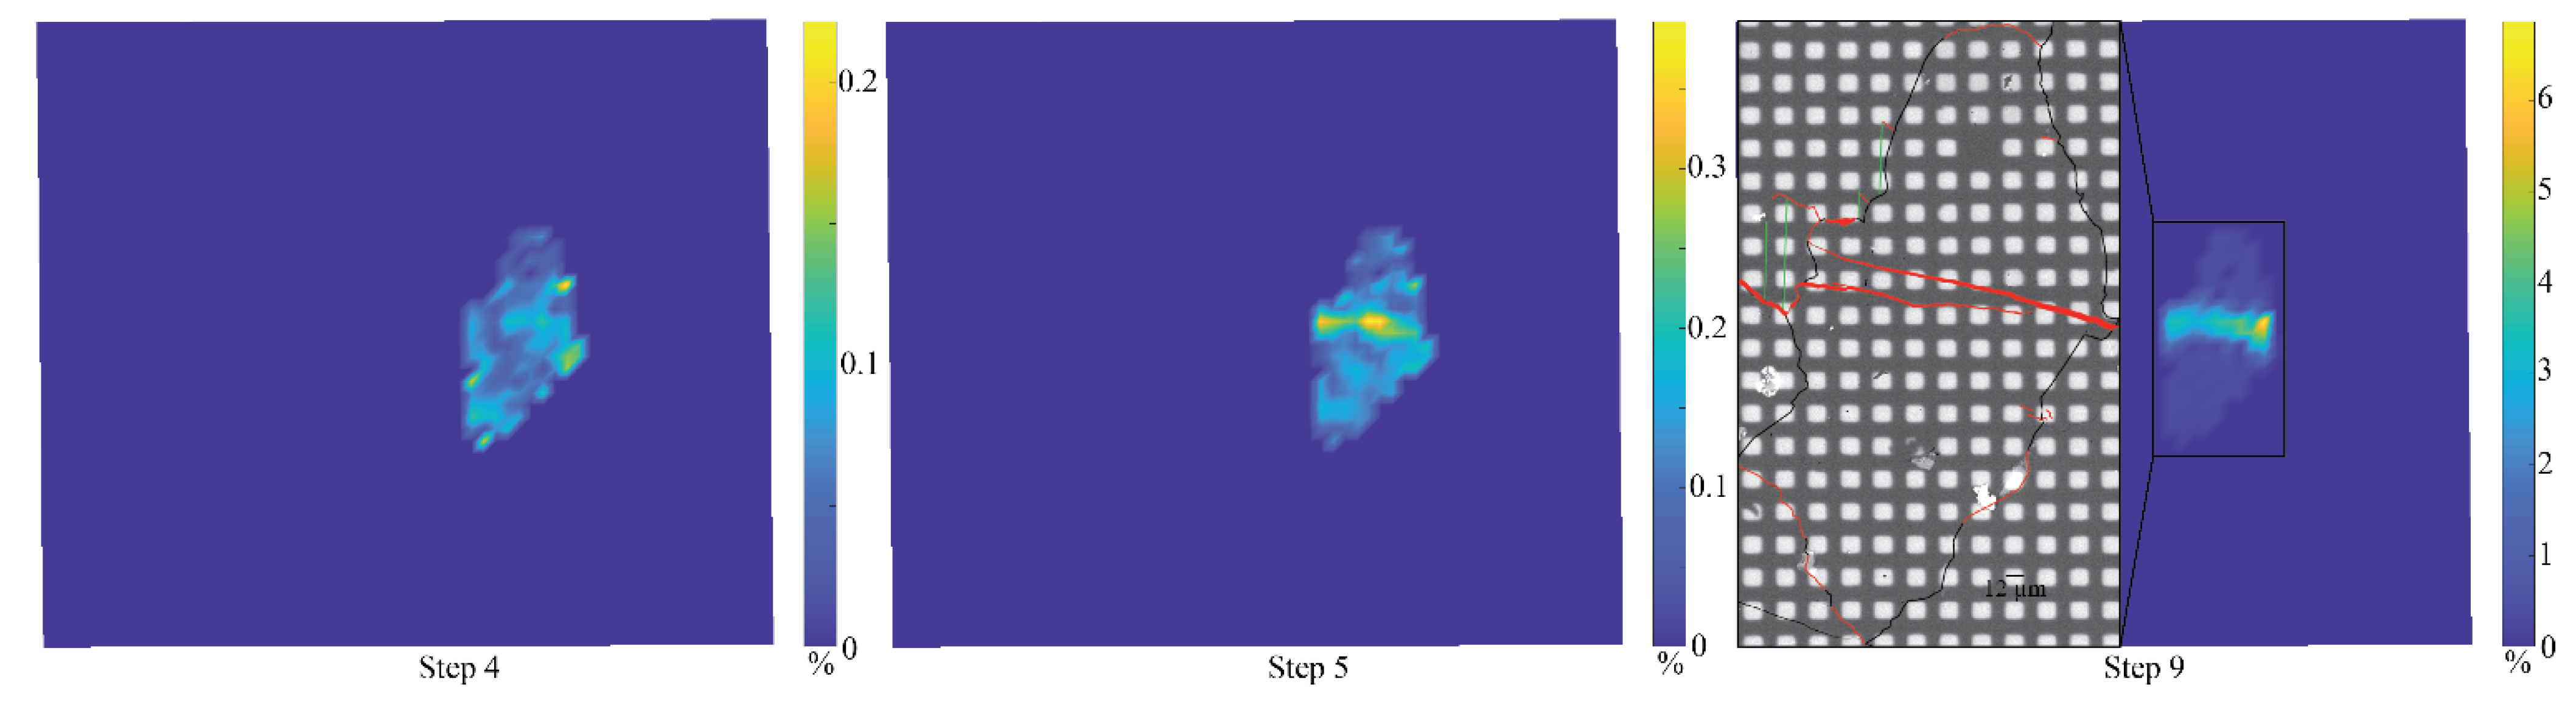
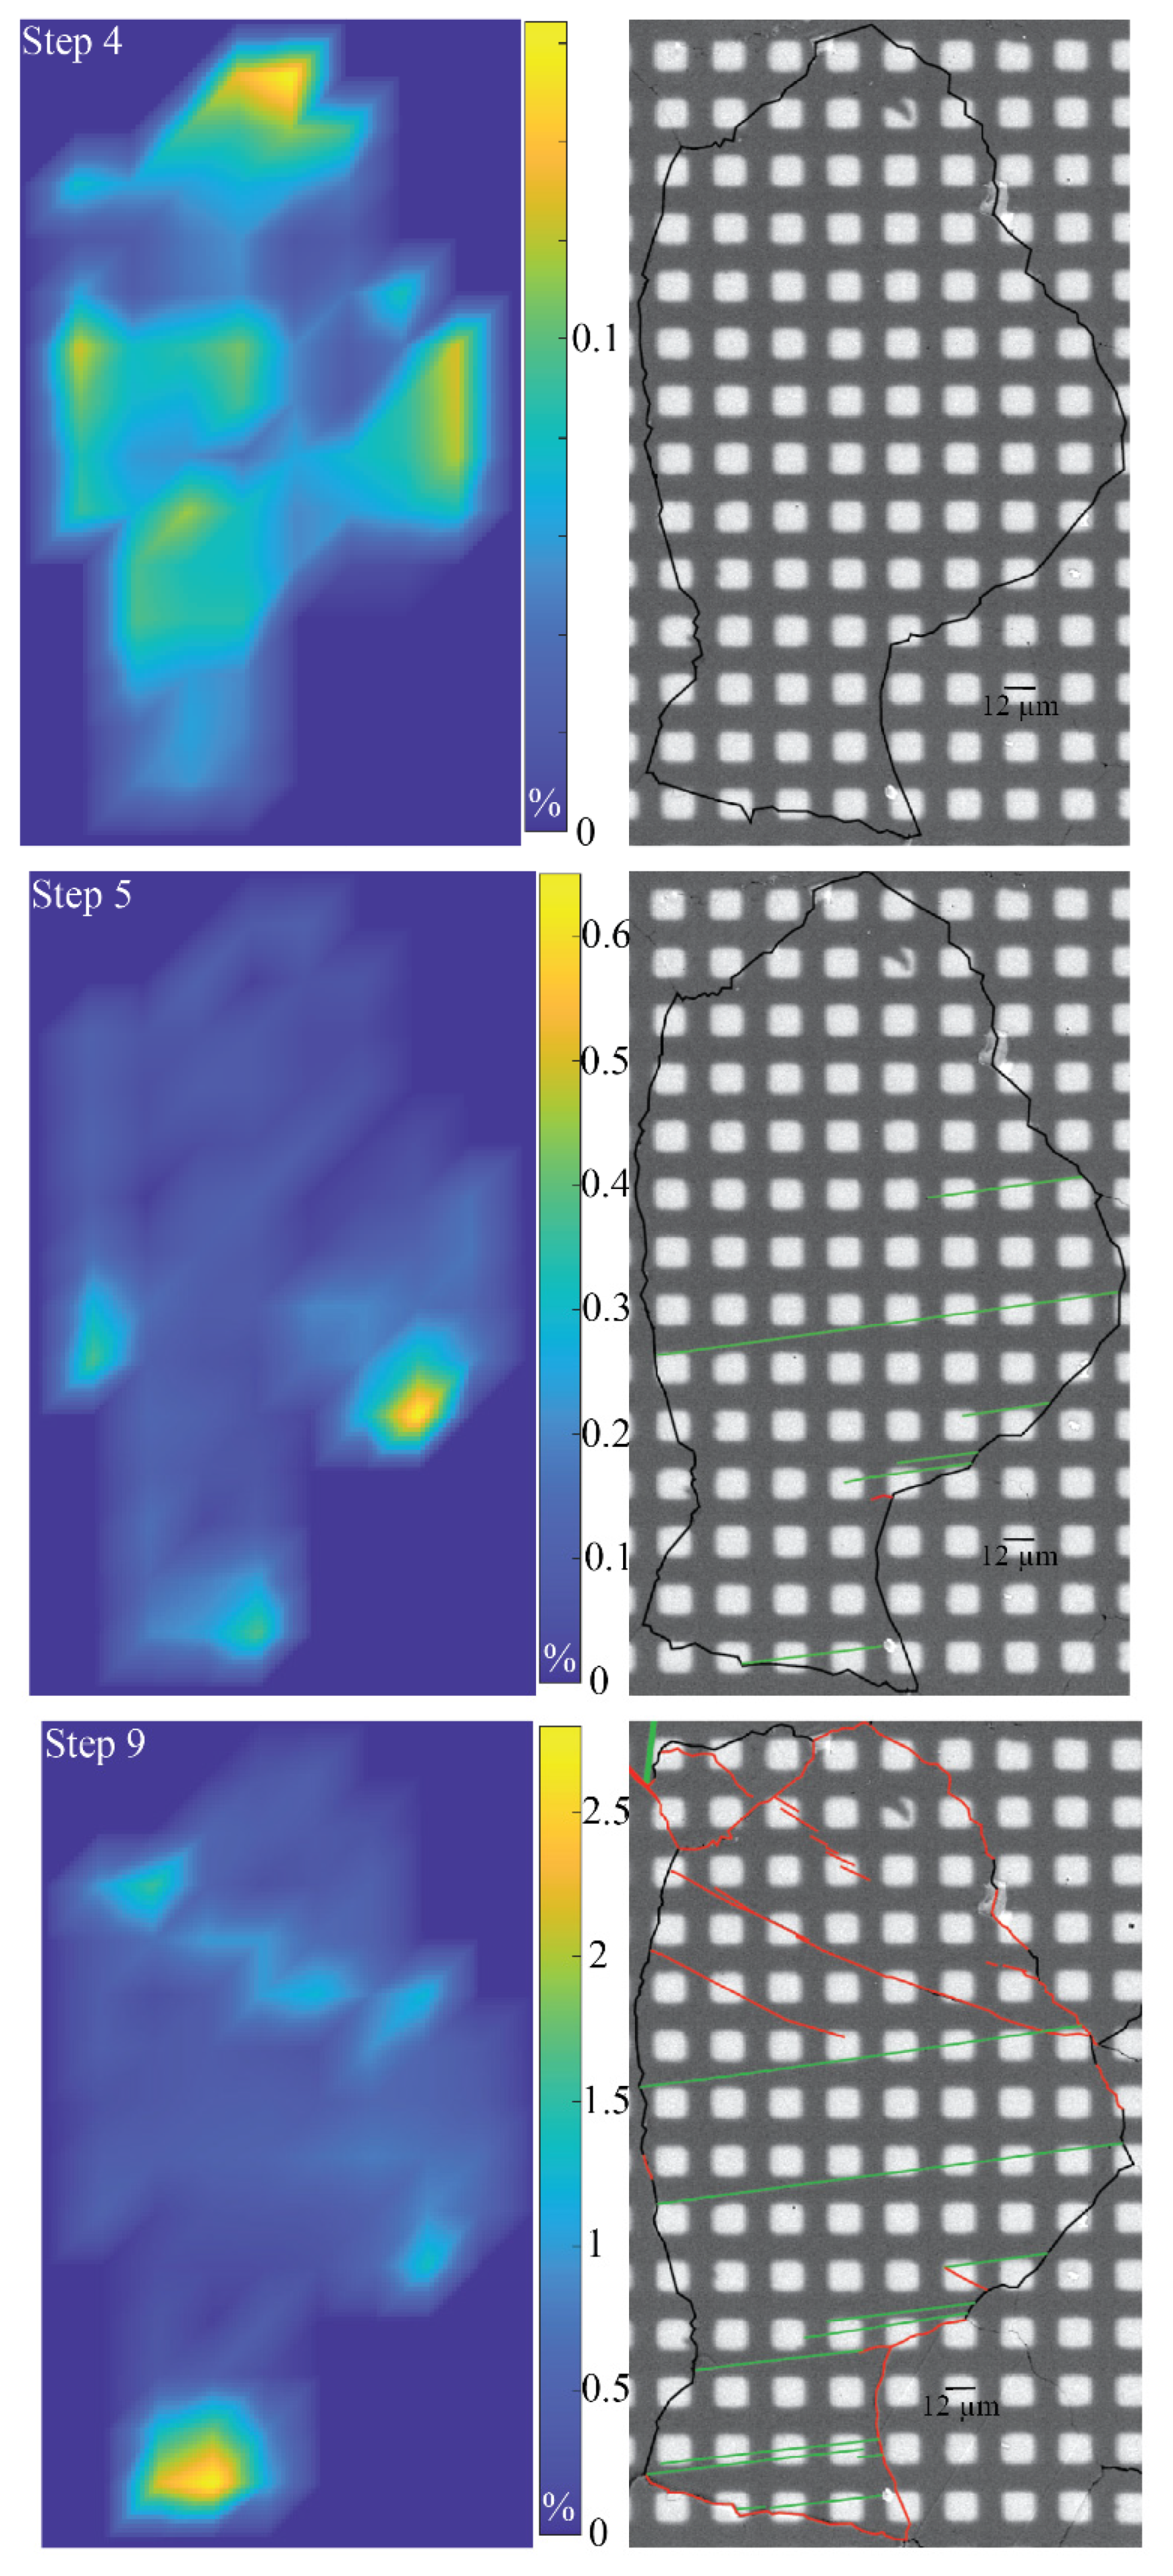
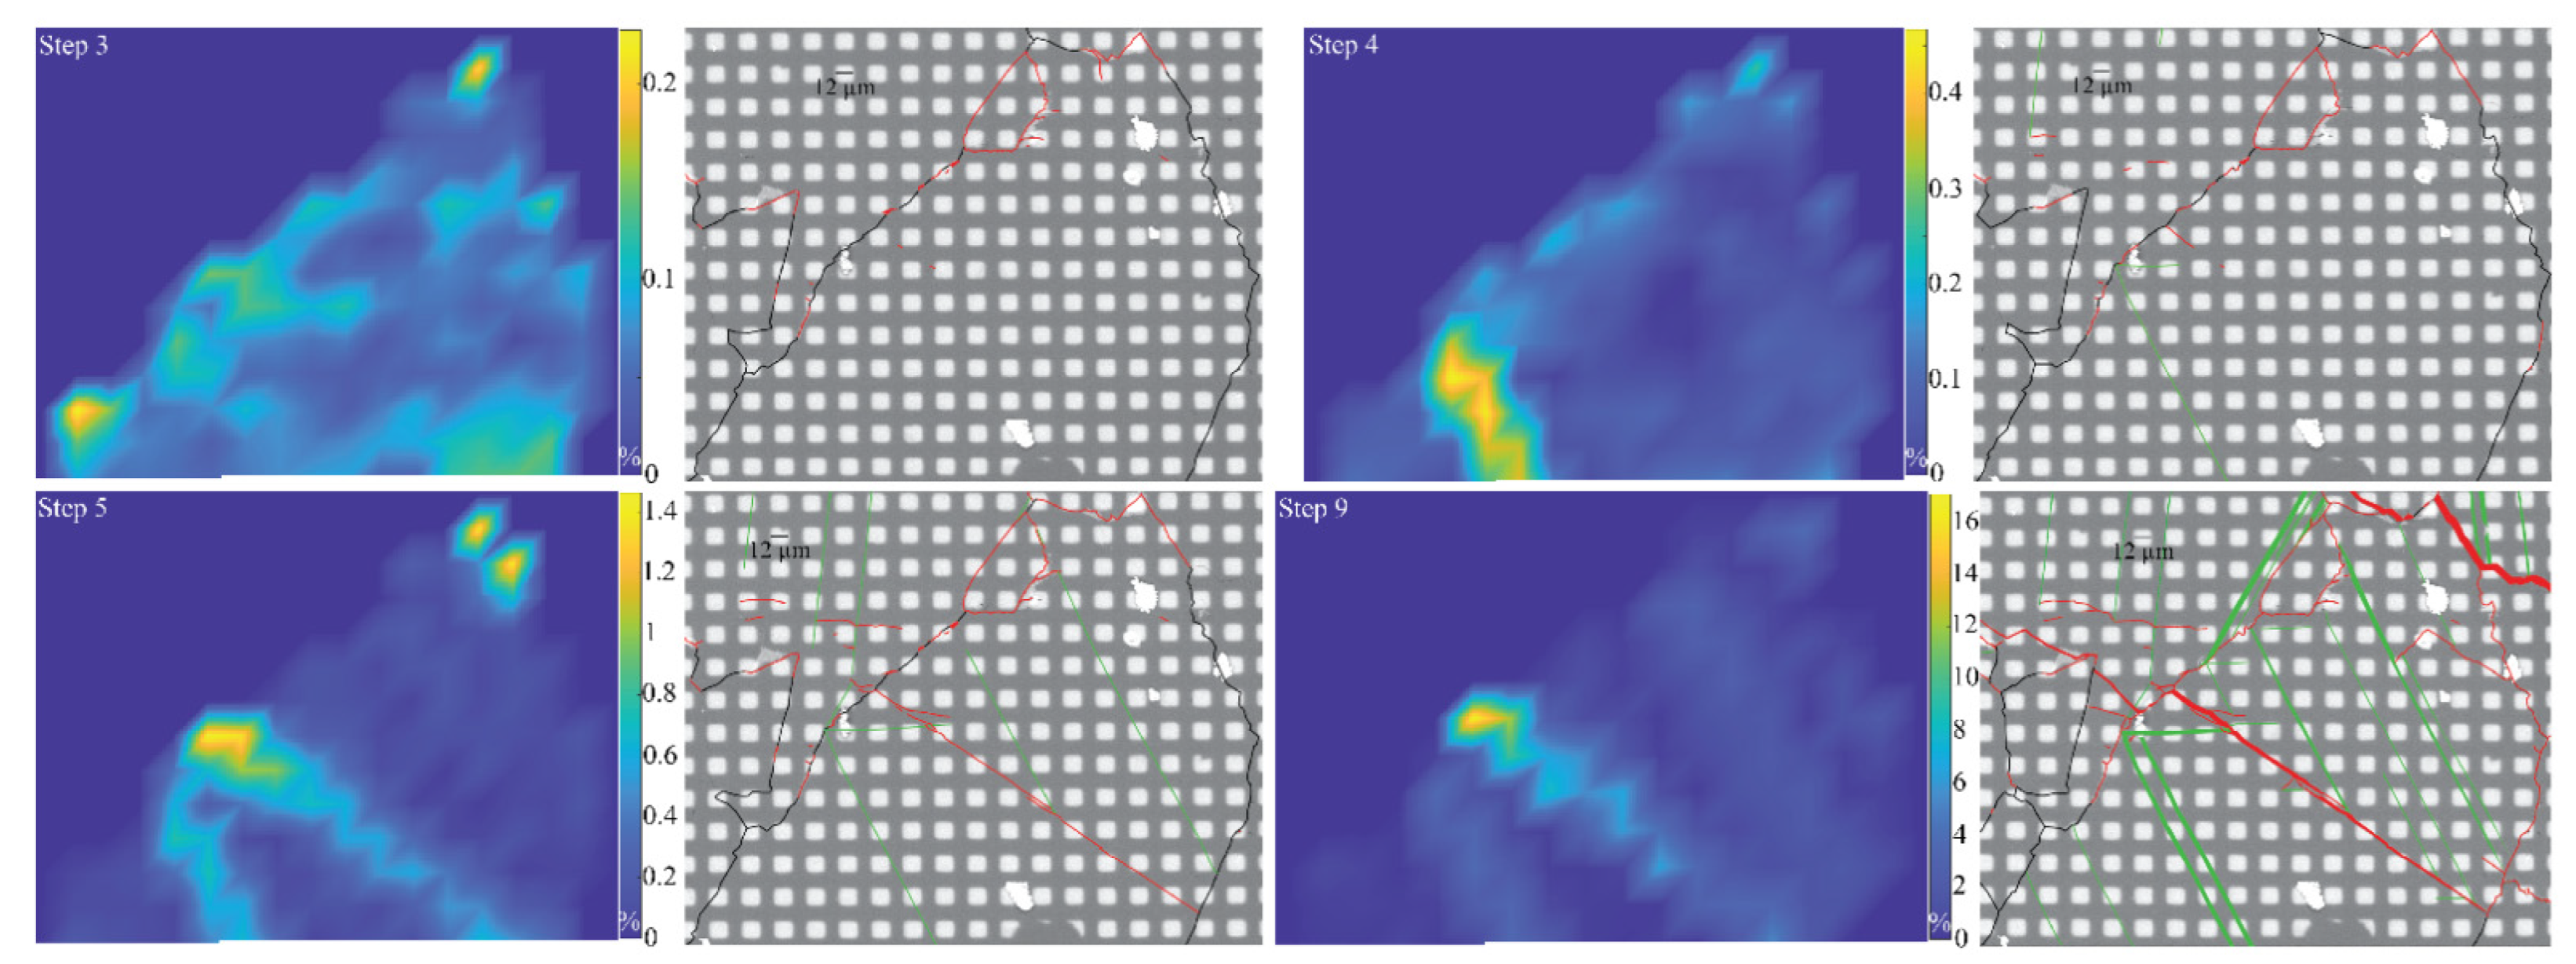
The strain map of crystal 4 in step 4 (Figure 11) shows no evidence of the fracturing that occurs in step 5. The strain is located preferentially at the grain boundaries. In step 5, a localized deformation band originates from the tip of the micro-crack initiated at step 5. It relates to the first twin lamella. In step 6, the associated strain becomes more pronounced and a second twin family is activated. Strain is essentially localized in the micro-fracture and along the first twinned planes of the crystal. The gold markers are sheared by the gliding movement of twinning, as shown in Figure 9. Step 9 summarises the total strain, including intra- and inter-granular fracturing and grain boundary opening (at the bottom interface). Densification and propagation of the twin planes are observed. The inter-granular fracturing is sub-parallel to the macroscopic applied stress.
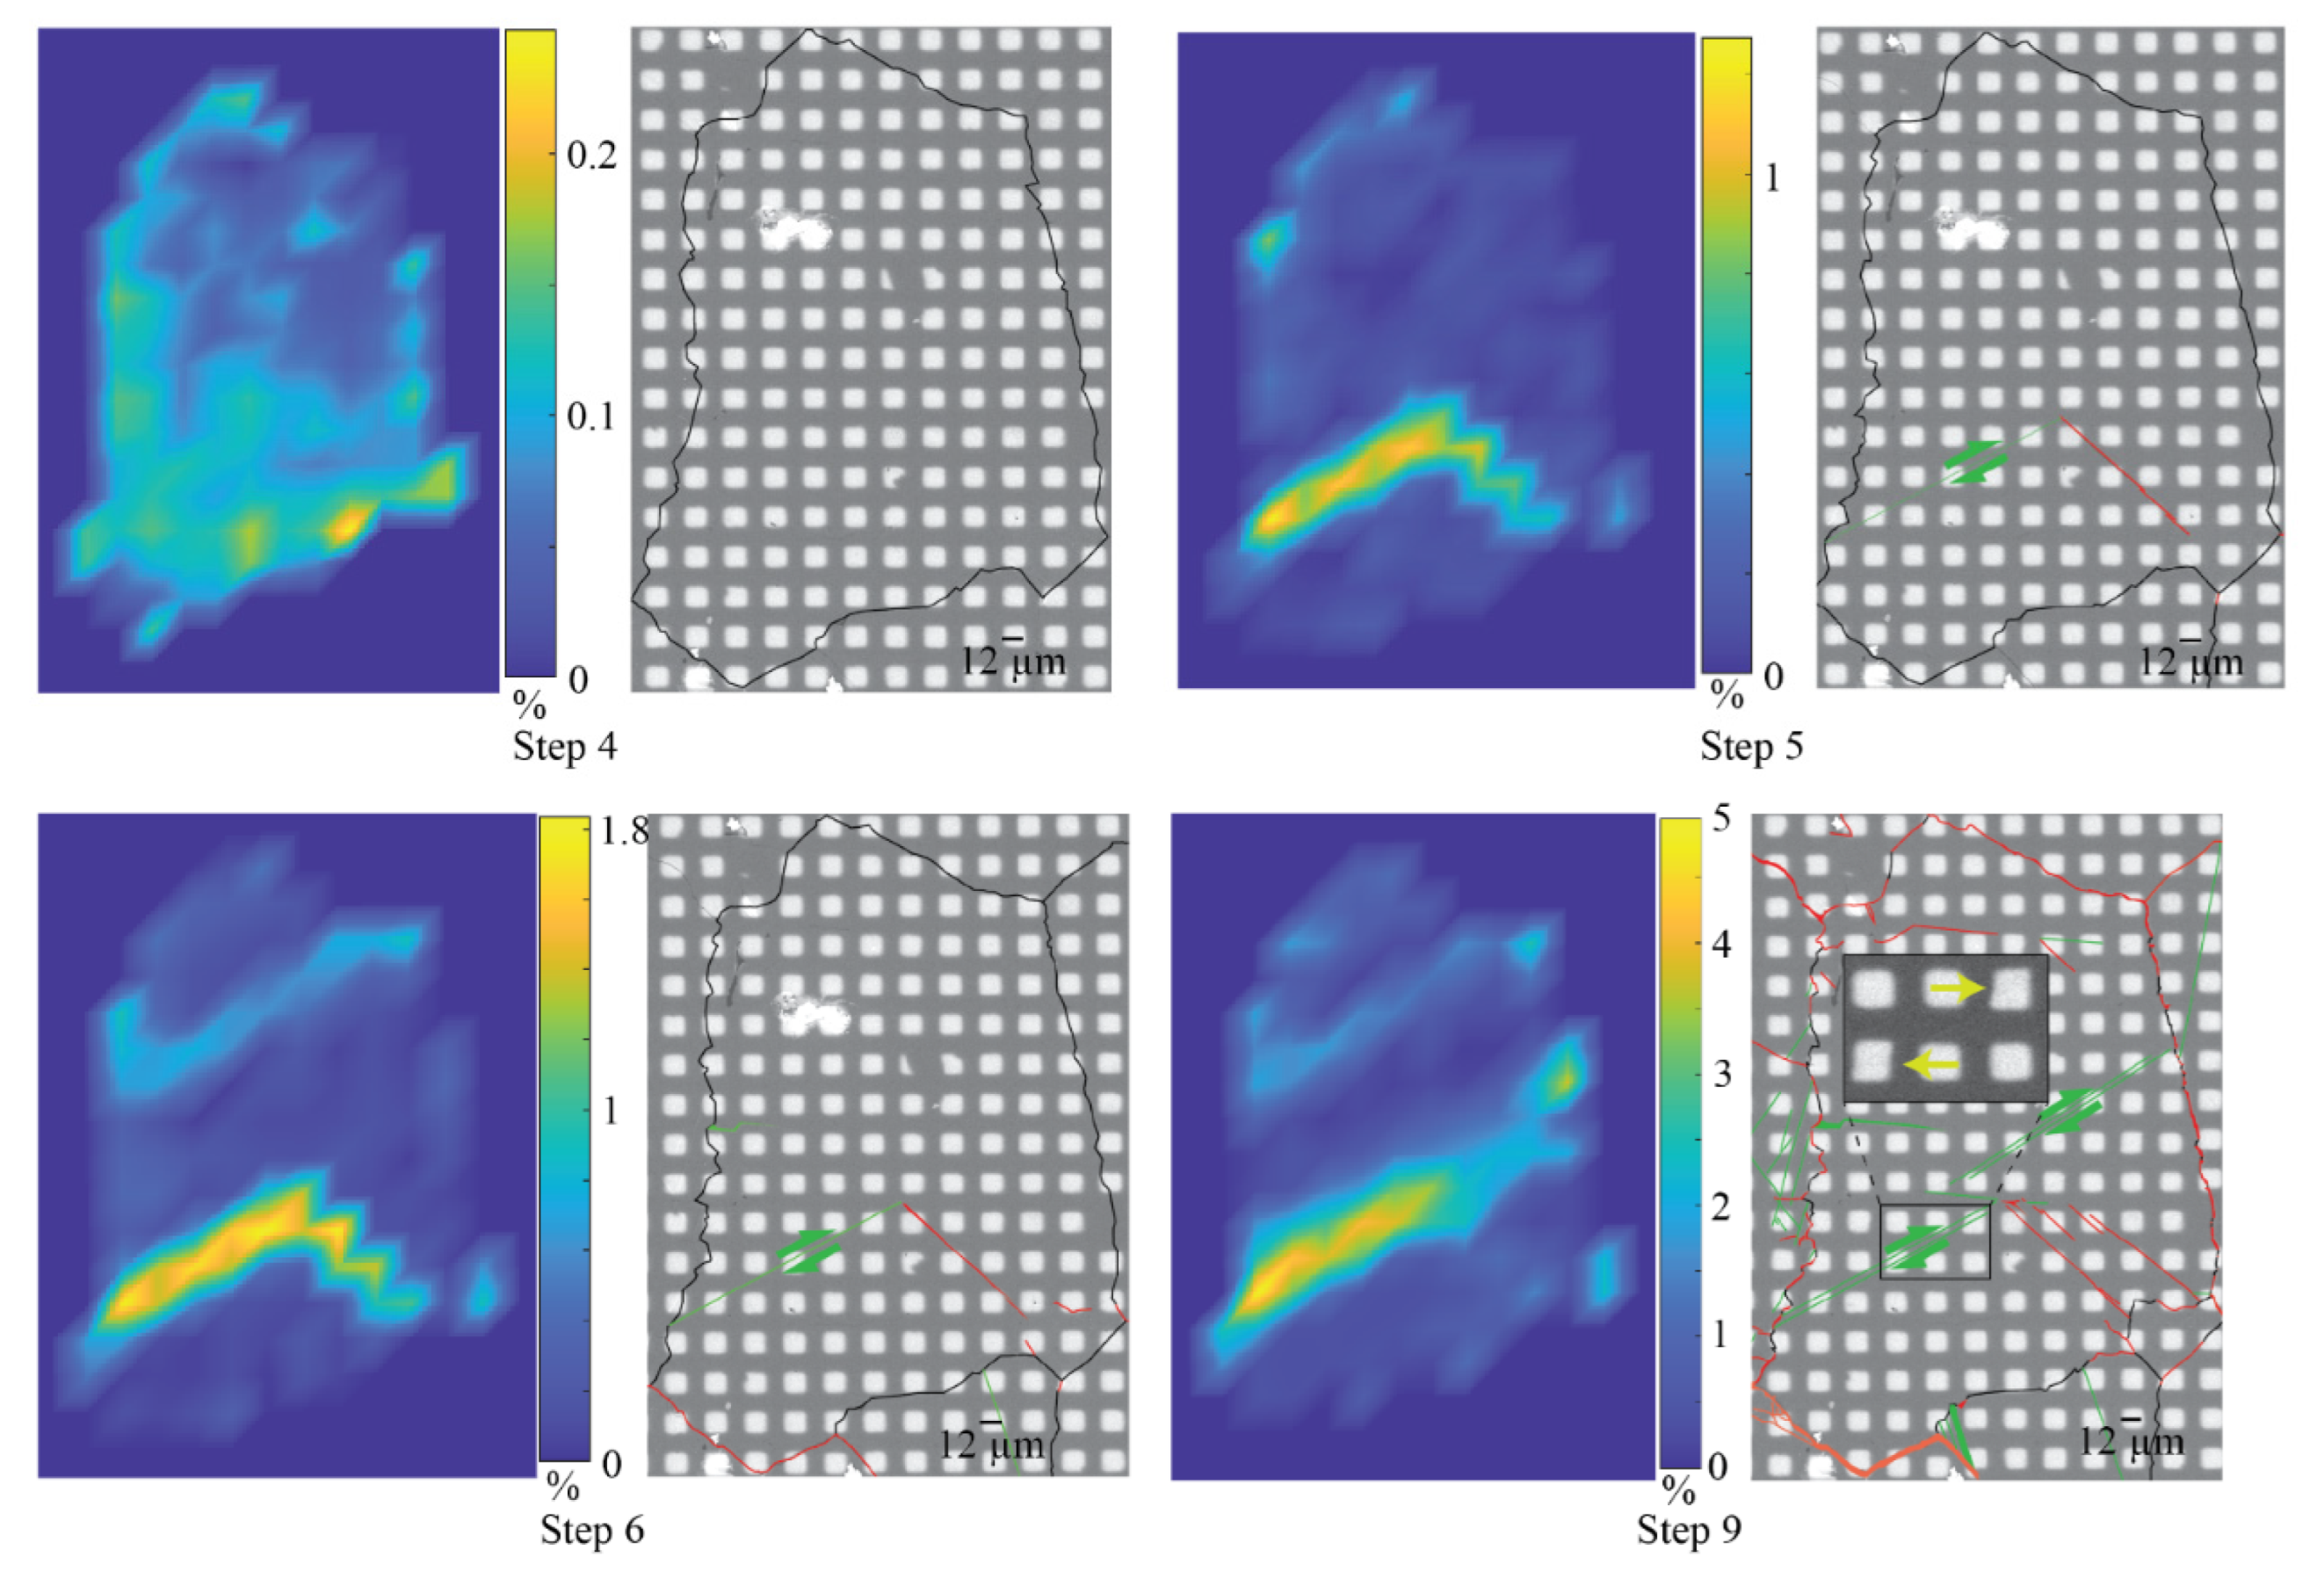
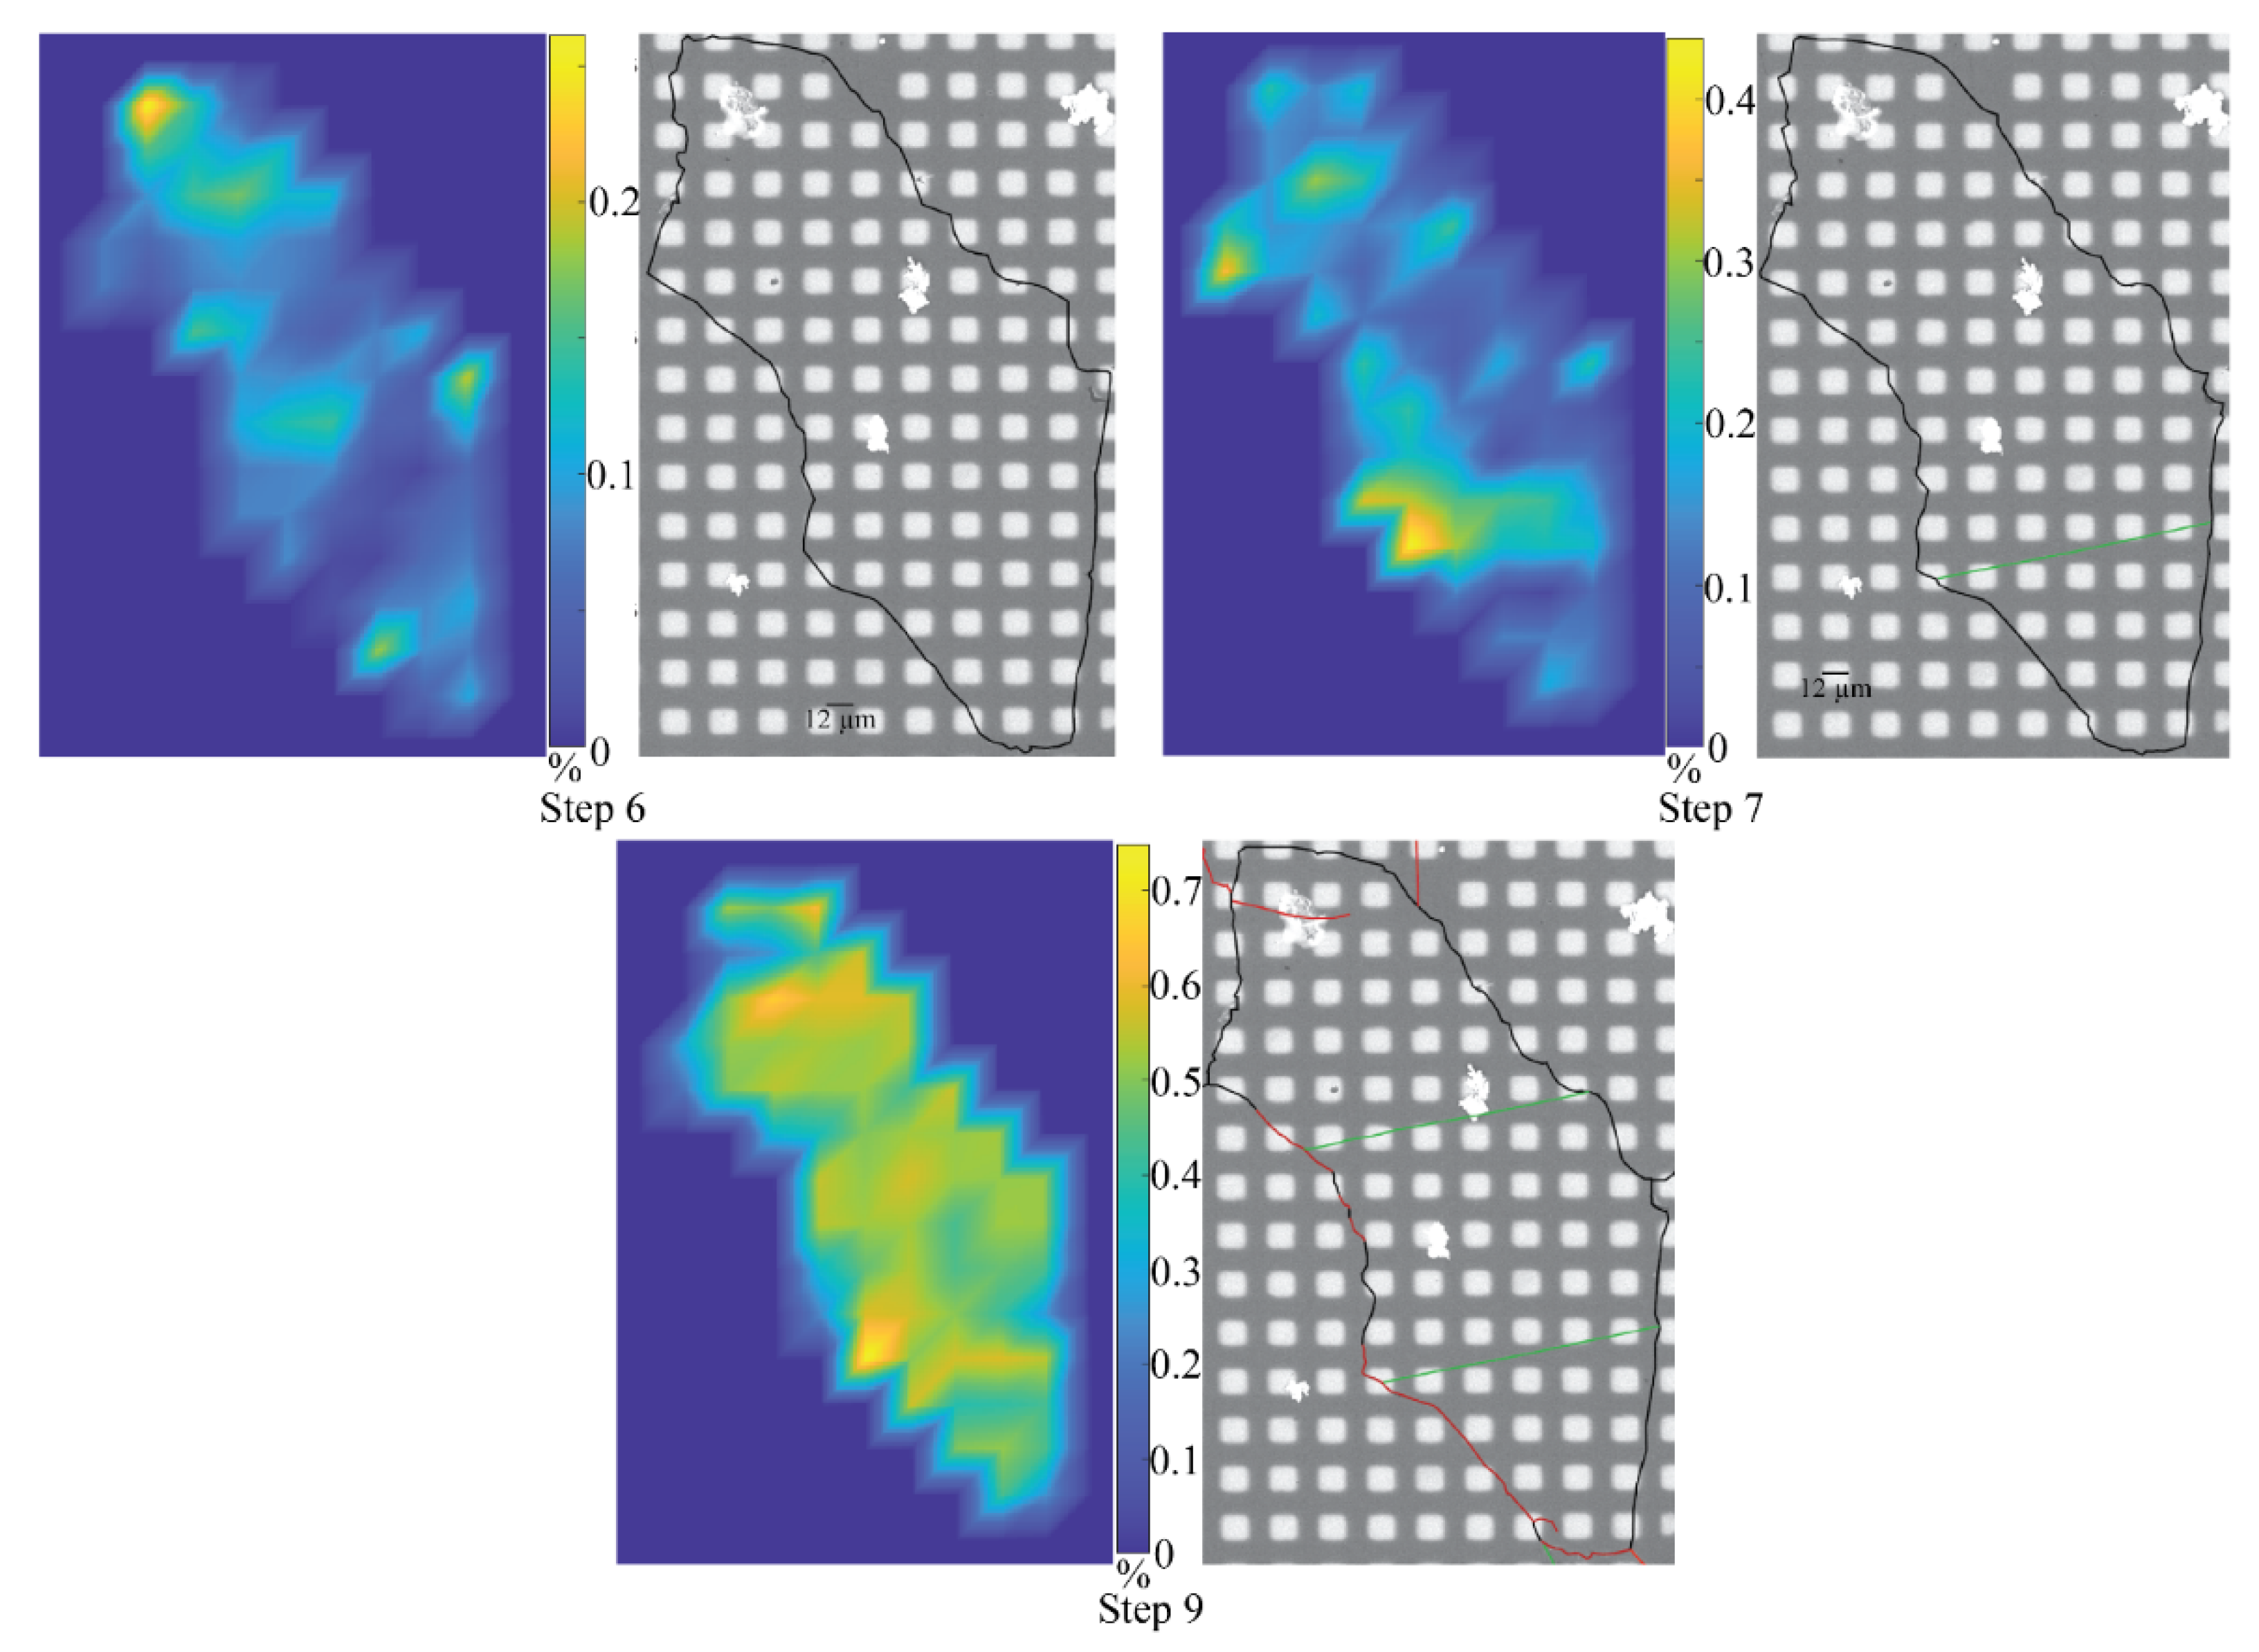
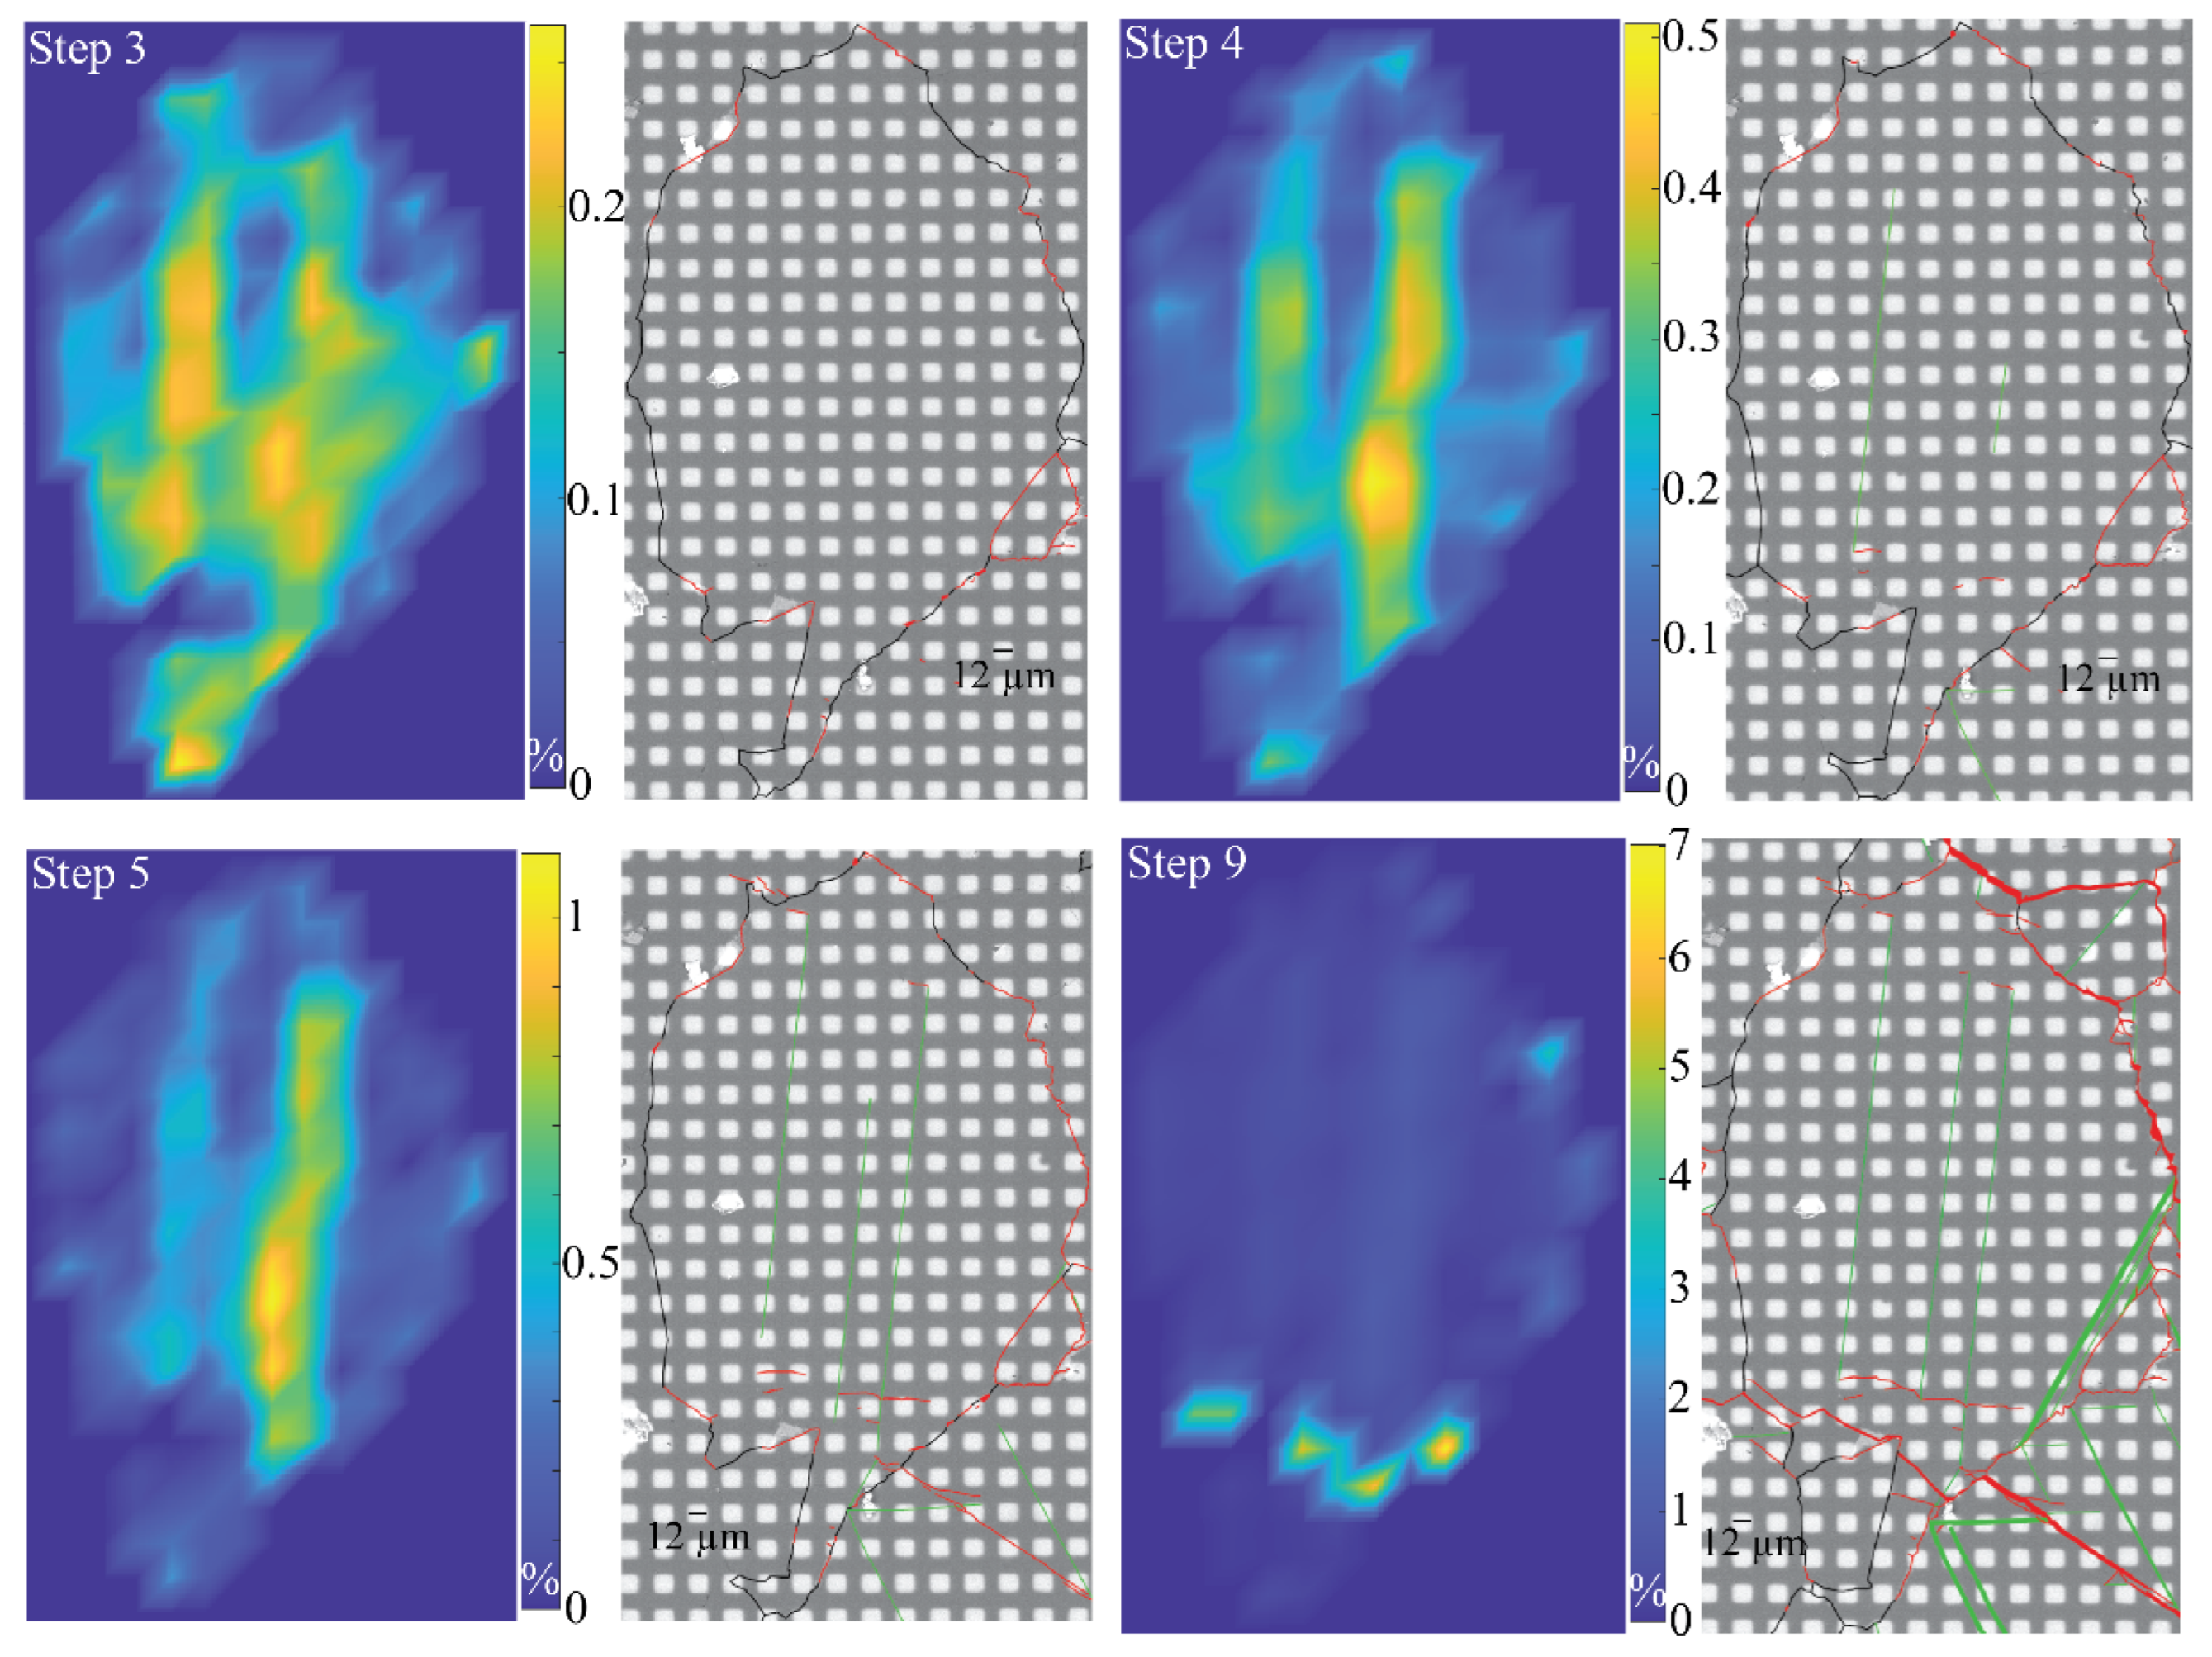
For crystal 5, strain is localized at the grain boundaries until step 6. The first twinned lamella appears at step 7 and localizes at about 0.25% strain. (Figure 12). The second twinning activation happens at step 8, where a new twinned lamella of the same family appears along with intra-granular fracturing. Step 9 shows no further evidence of twinning densification or thickening of the previously activated lamellae. The overall strain, however, intensifies up to 0.7% and is rather homogeneous over the entire grain. This is surprising when compared with the other grains, which show strong localizations at Step 9.
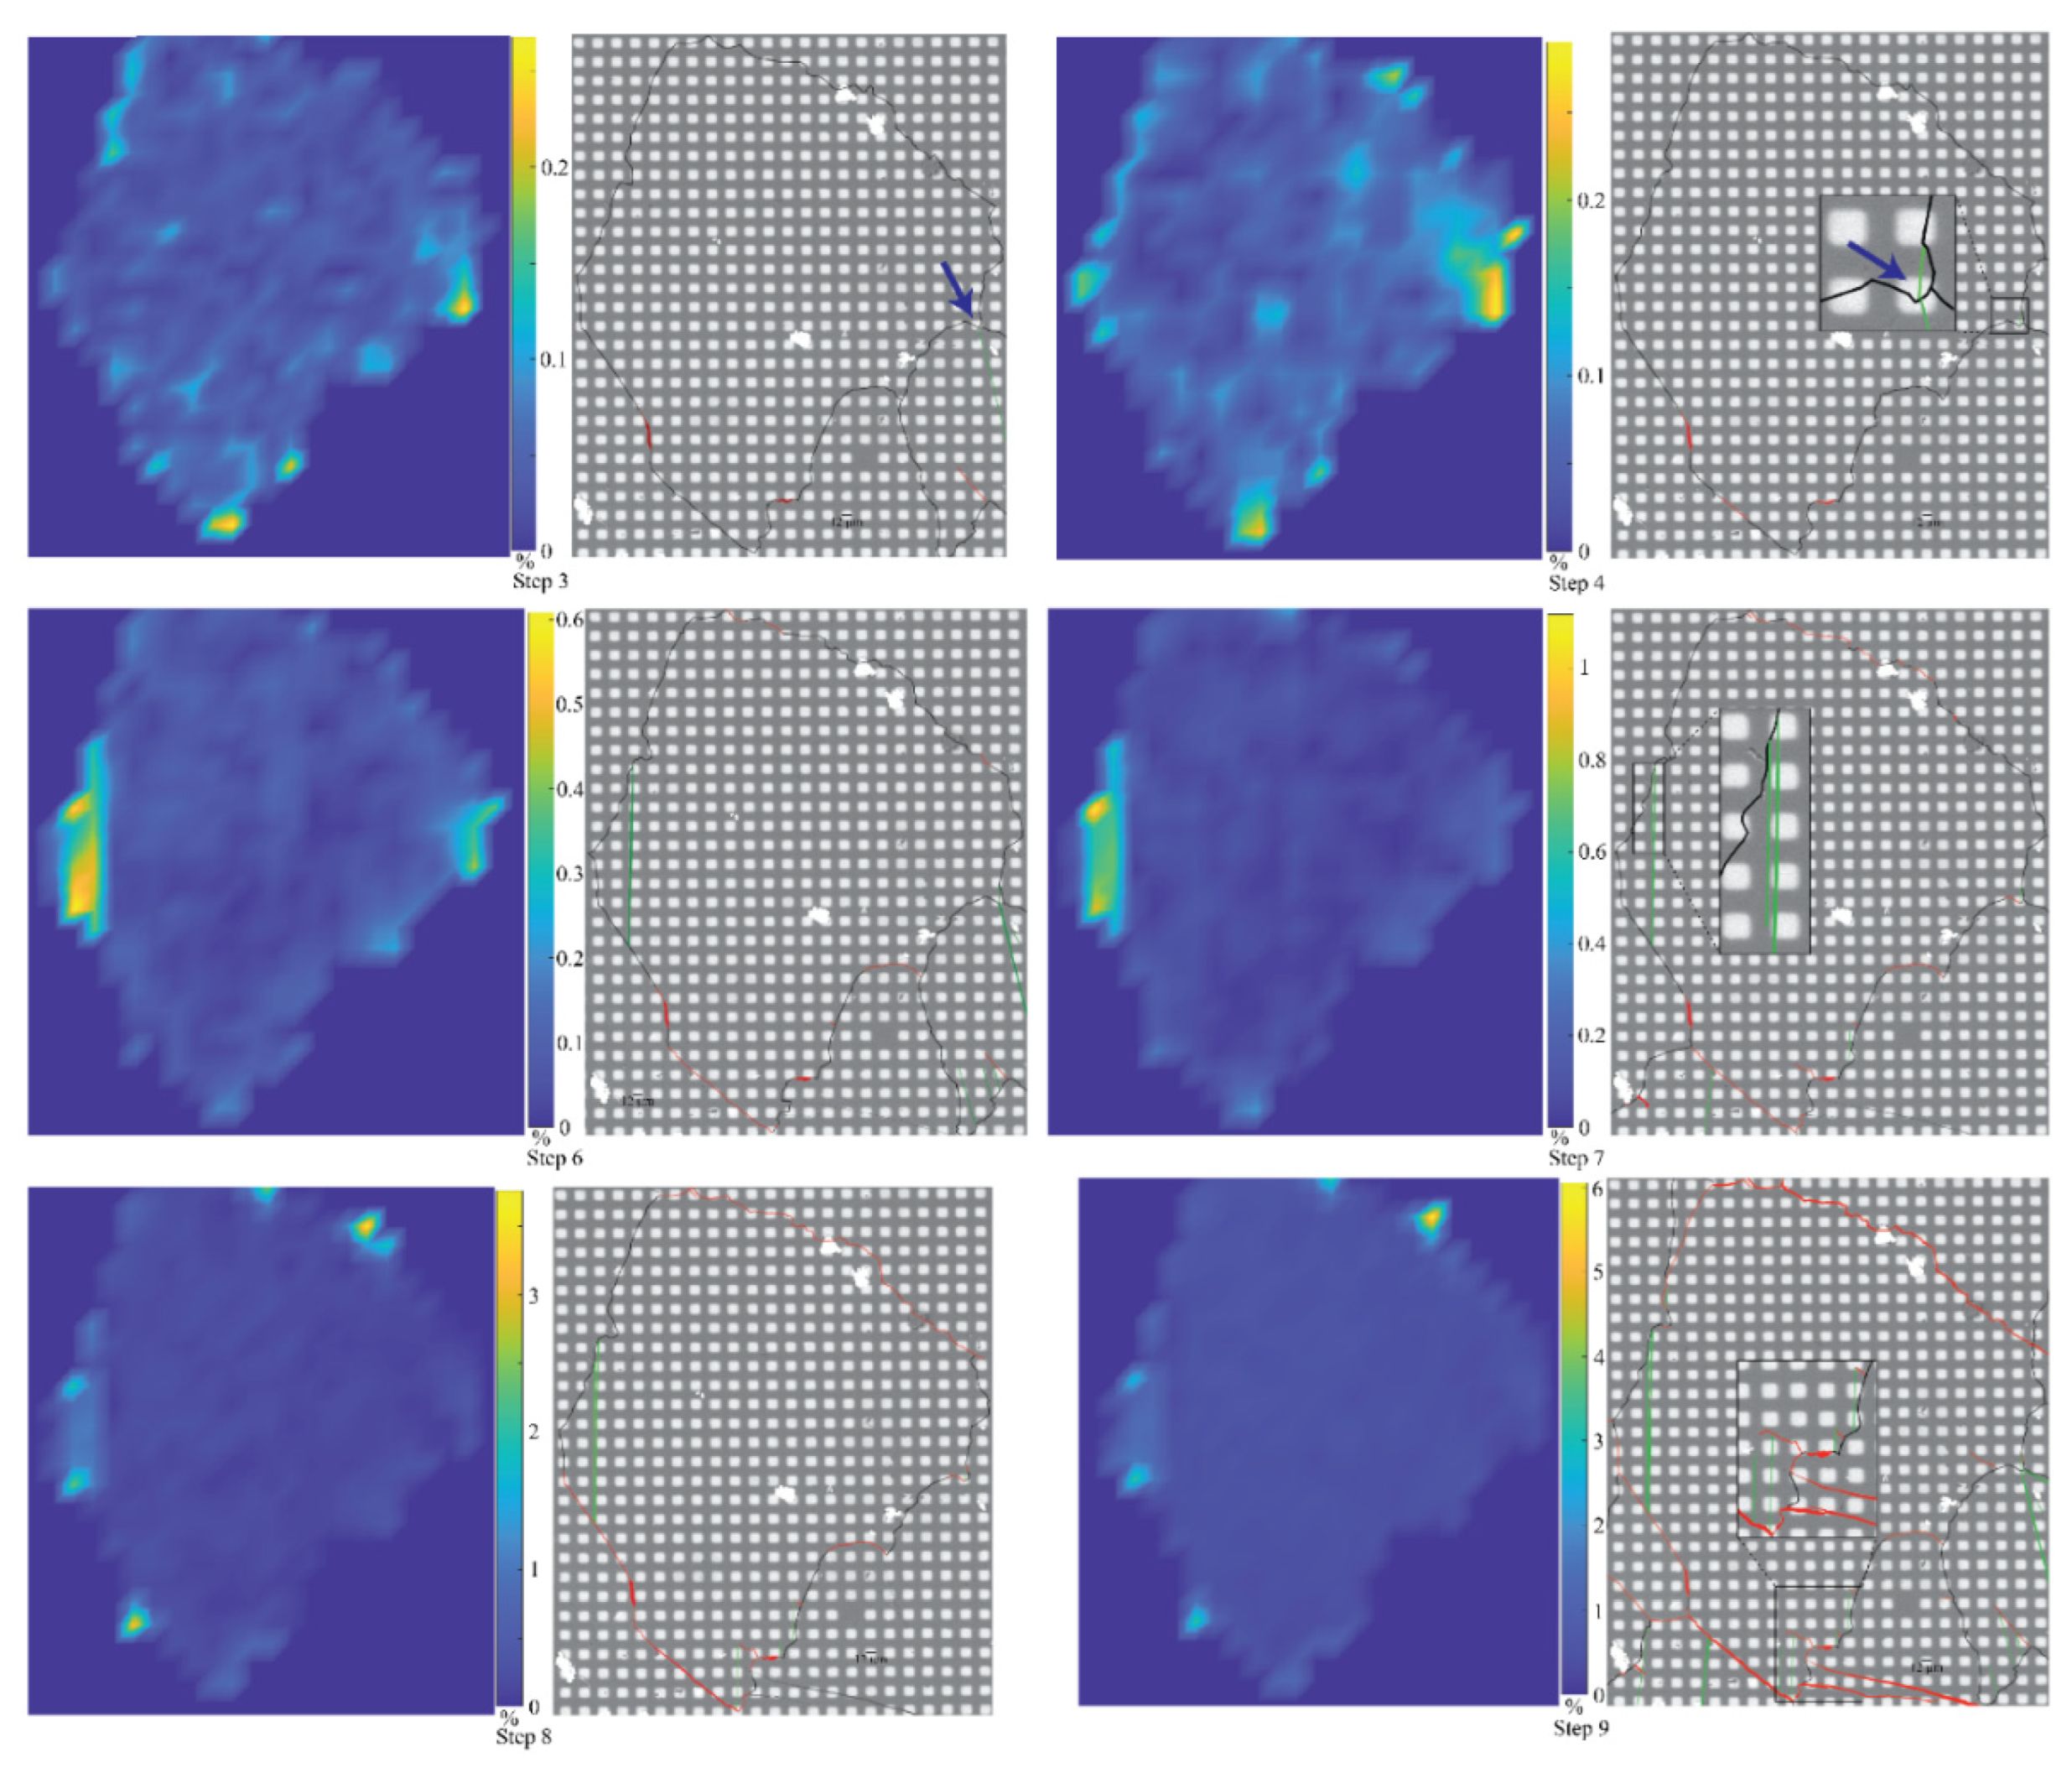
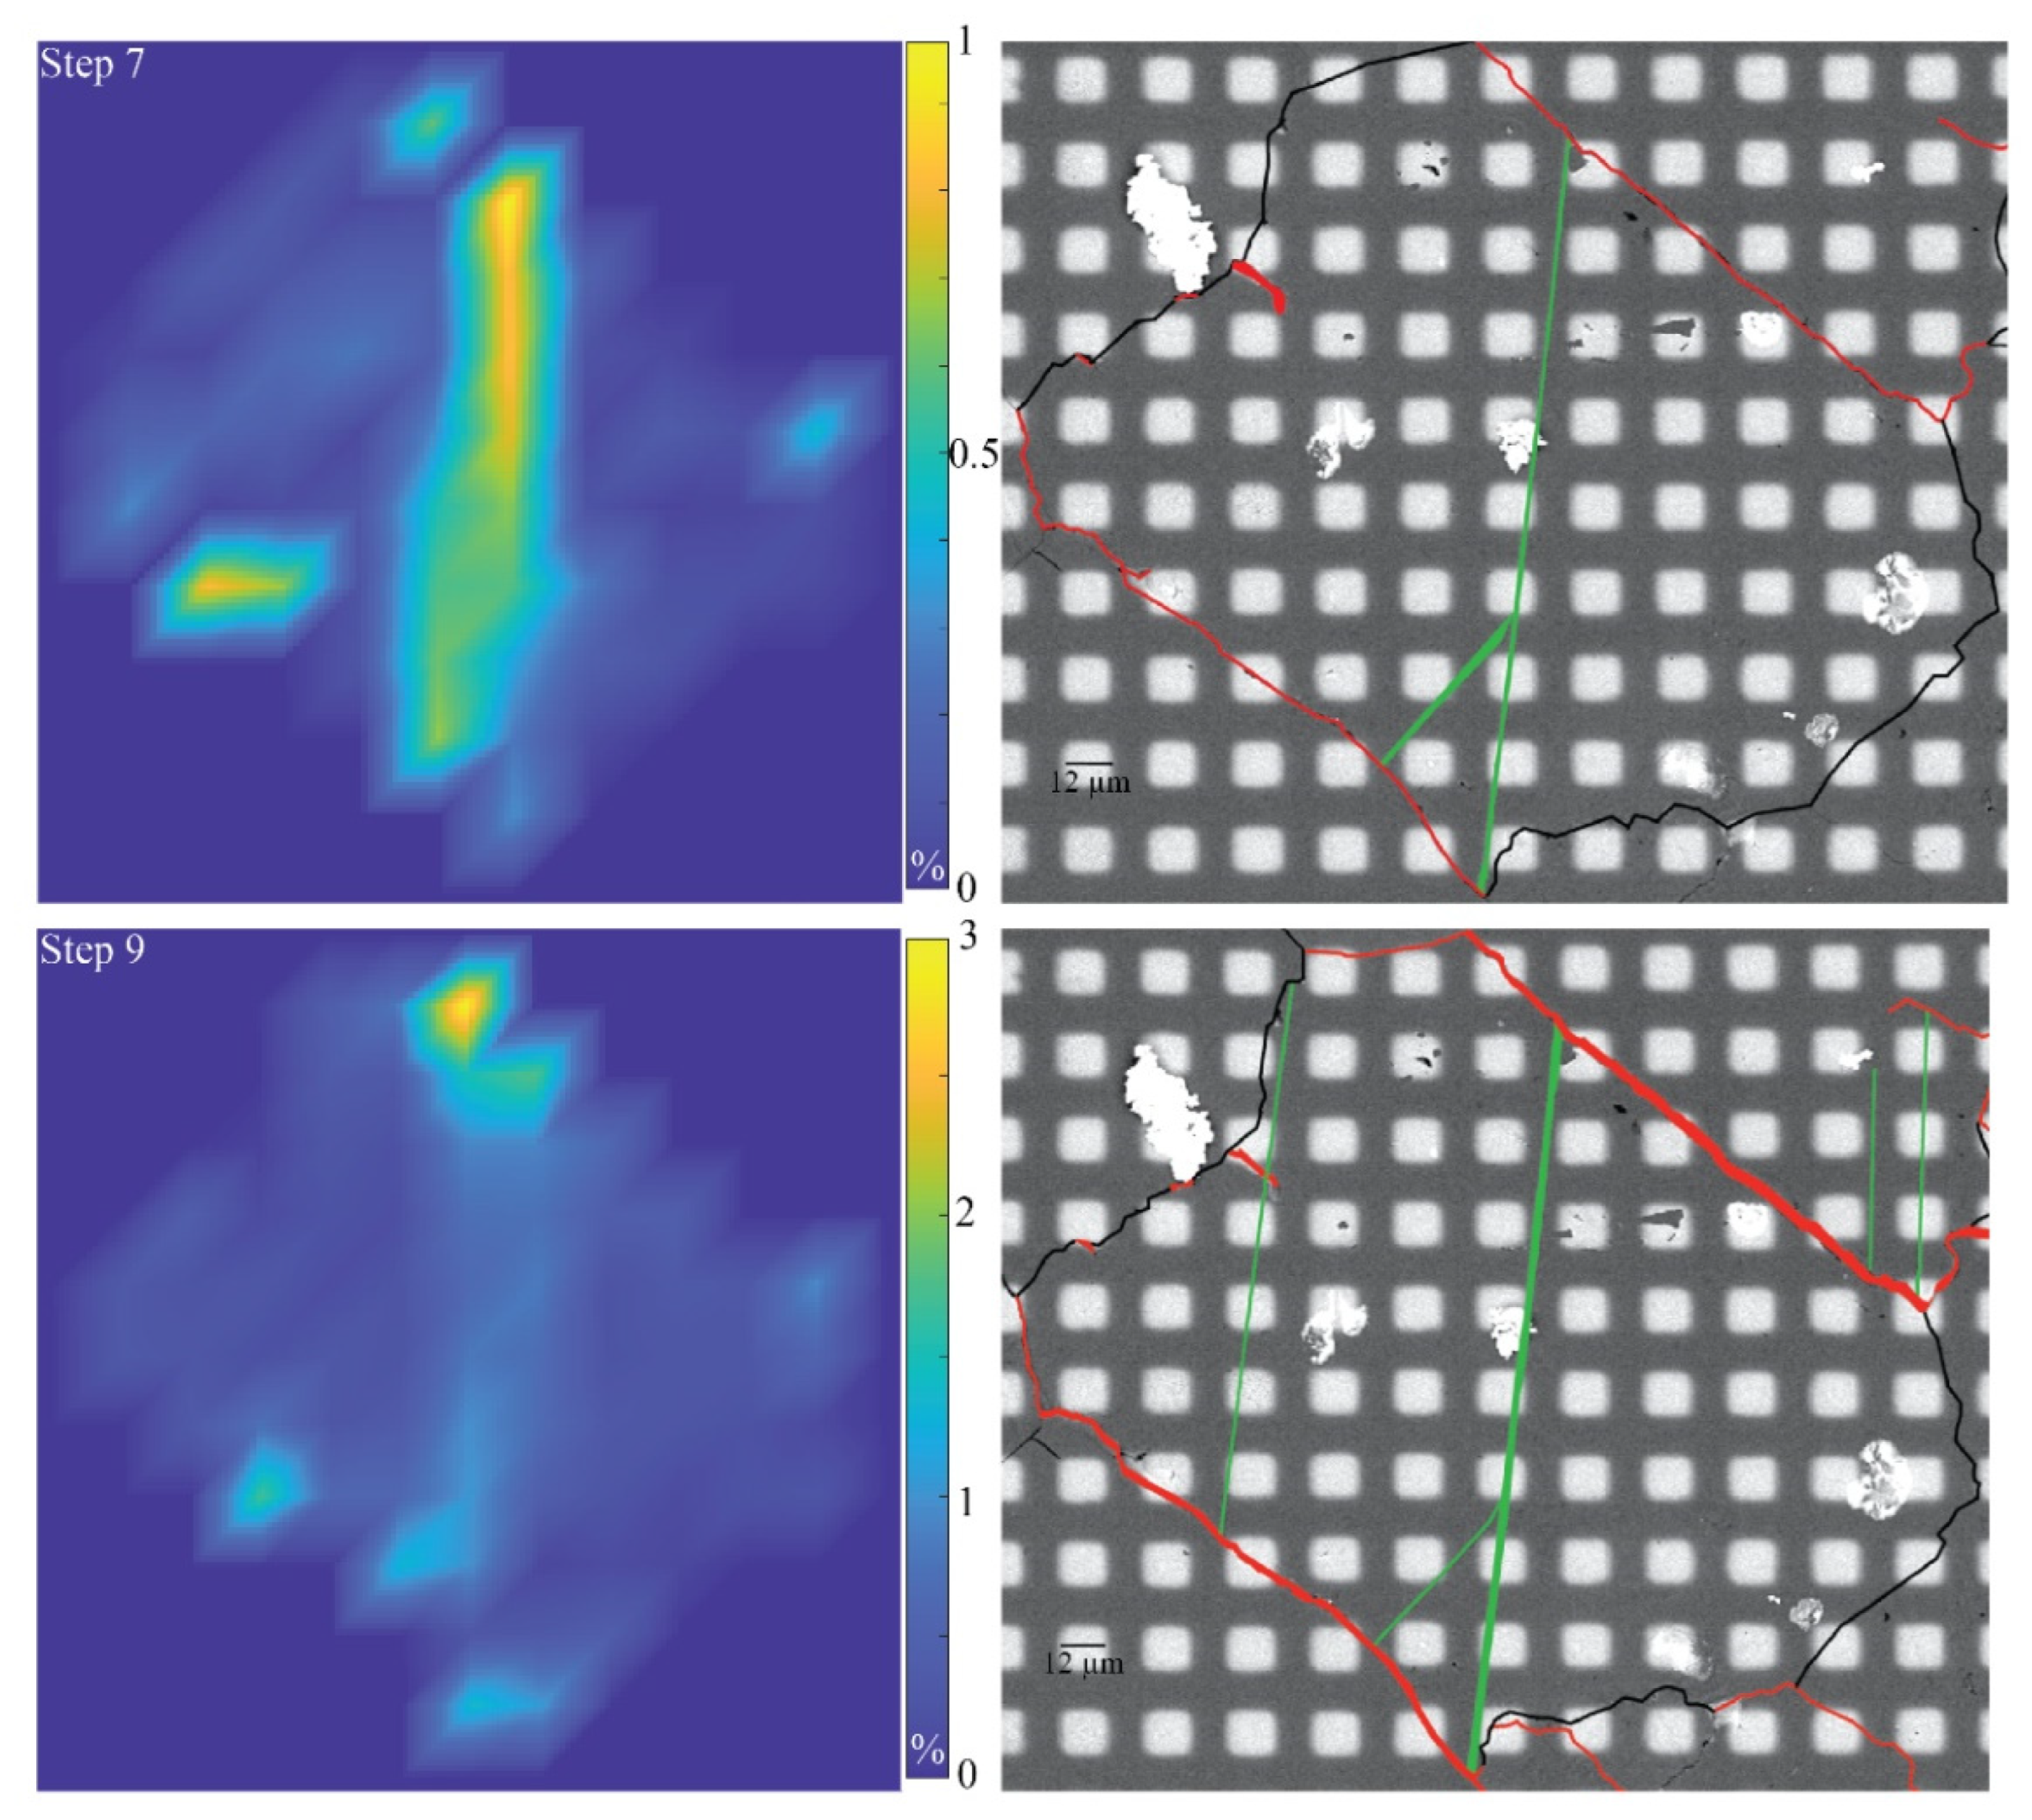
Along the loading history, crystal 6, like the other crystals, shows strain concentrations at grain boundaries (Figure 13). At step 3, the area of the strongest strain localization (arrow) coincides with a twin lamella emerging from the adjacent bottom-right grain. At step 4, the corresponding strain extends and a twinned plane appears (second arrow). At step 6, another localization is attributed to a second twinned plane. The very first twinned plane can be interpreted as being caused by shear transmission across the grain boundary by a twin lamellae, activated in an adjacent crystal. In step 7, a short segment of the twin appears next to a previous one. Other twinned planes also appear in the lower part of the crystal but they do not localise as much strain as the two long lamellae. At this stage, the micro-fracturing at the grain boundaries becomes more pronounced and continuously increases until the end of the experiment. The intra-grain micro-fracturing remains modest. Several fractures extend to the twin planes and mark the end of the lamellae. In steps 8 and 9, the late activated twin continues to progress until it reaches the opposite grain boundary. Between step 6 and step 9, the early activated twin thickens from about 0.95 µm to 1.80 µm (apparent thickness).
Crystal 7 is located at a border of the observation surface (Figure 14). As for the previous crystals, strain is first localized at the grain boundaries before twinning activation (step 3). The first twin lamella appears in step 4, followed by the same family of twins, densifying and thickening. In addition, fracturing and sliding at the grain boundaries occur in step 9. The observed crystal portion shows no evidence of internal fracturing.
For crystal 8, strain first localizes along grain boundaries. The first twin lamellae appear at step 5 (Figure 15). Limited intra-granular fracturing occurs at the same time. Later on, twinning densifies and lamellae thicken progressively and concomitantly, with further inter- and intra-granular micro-fracturing. It is noteworthy that twins often originate from irregularities at grain boundaries.
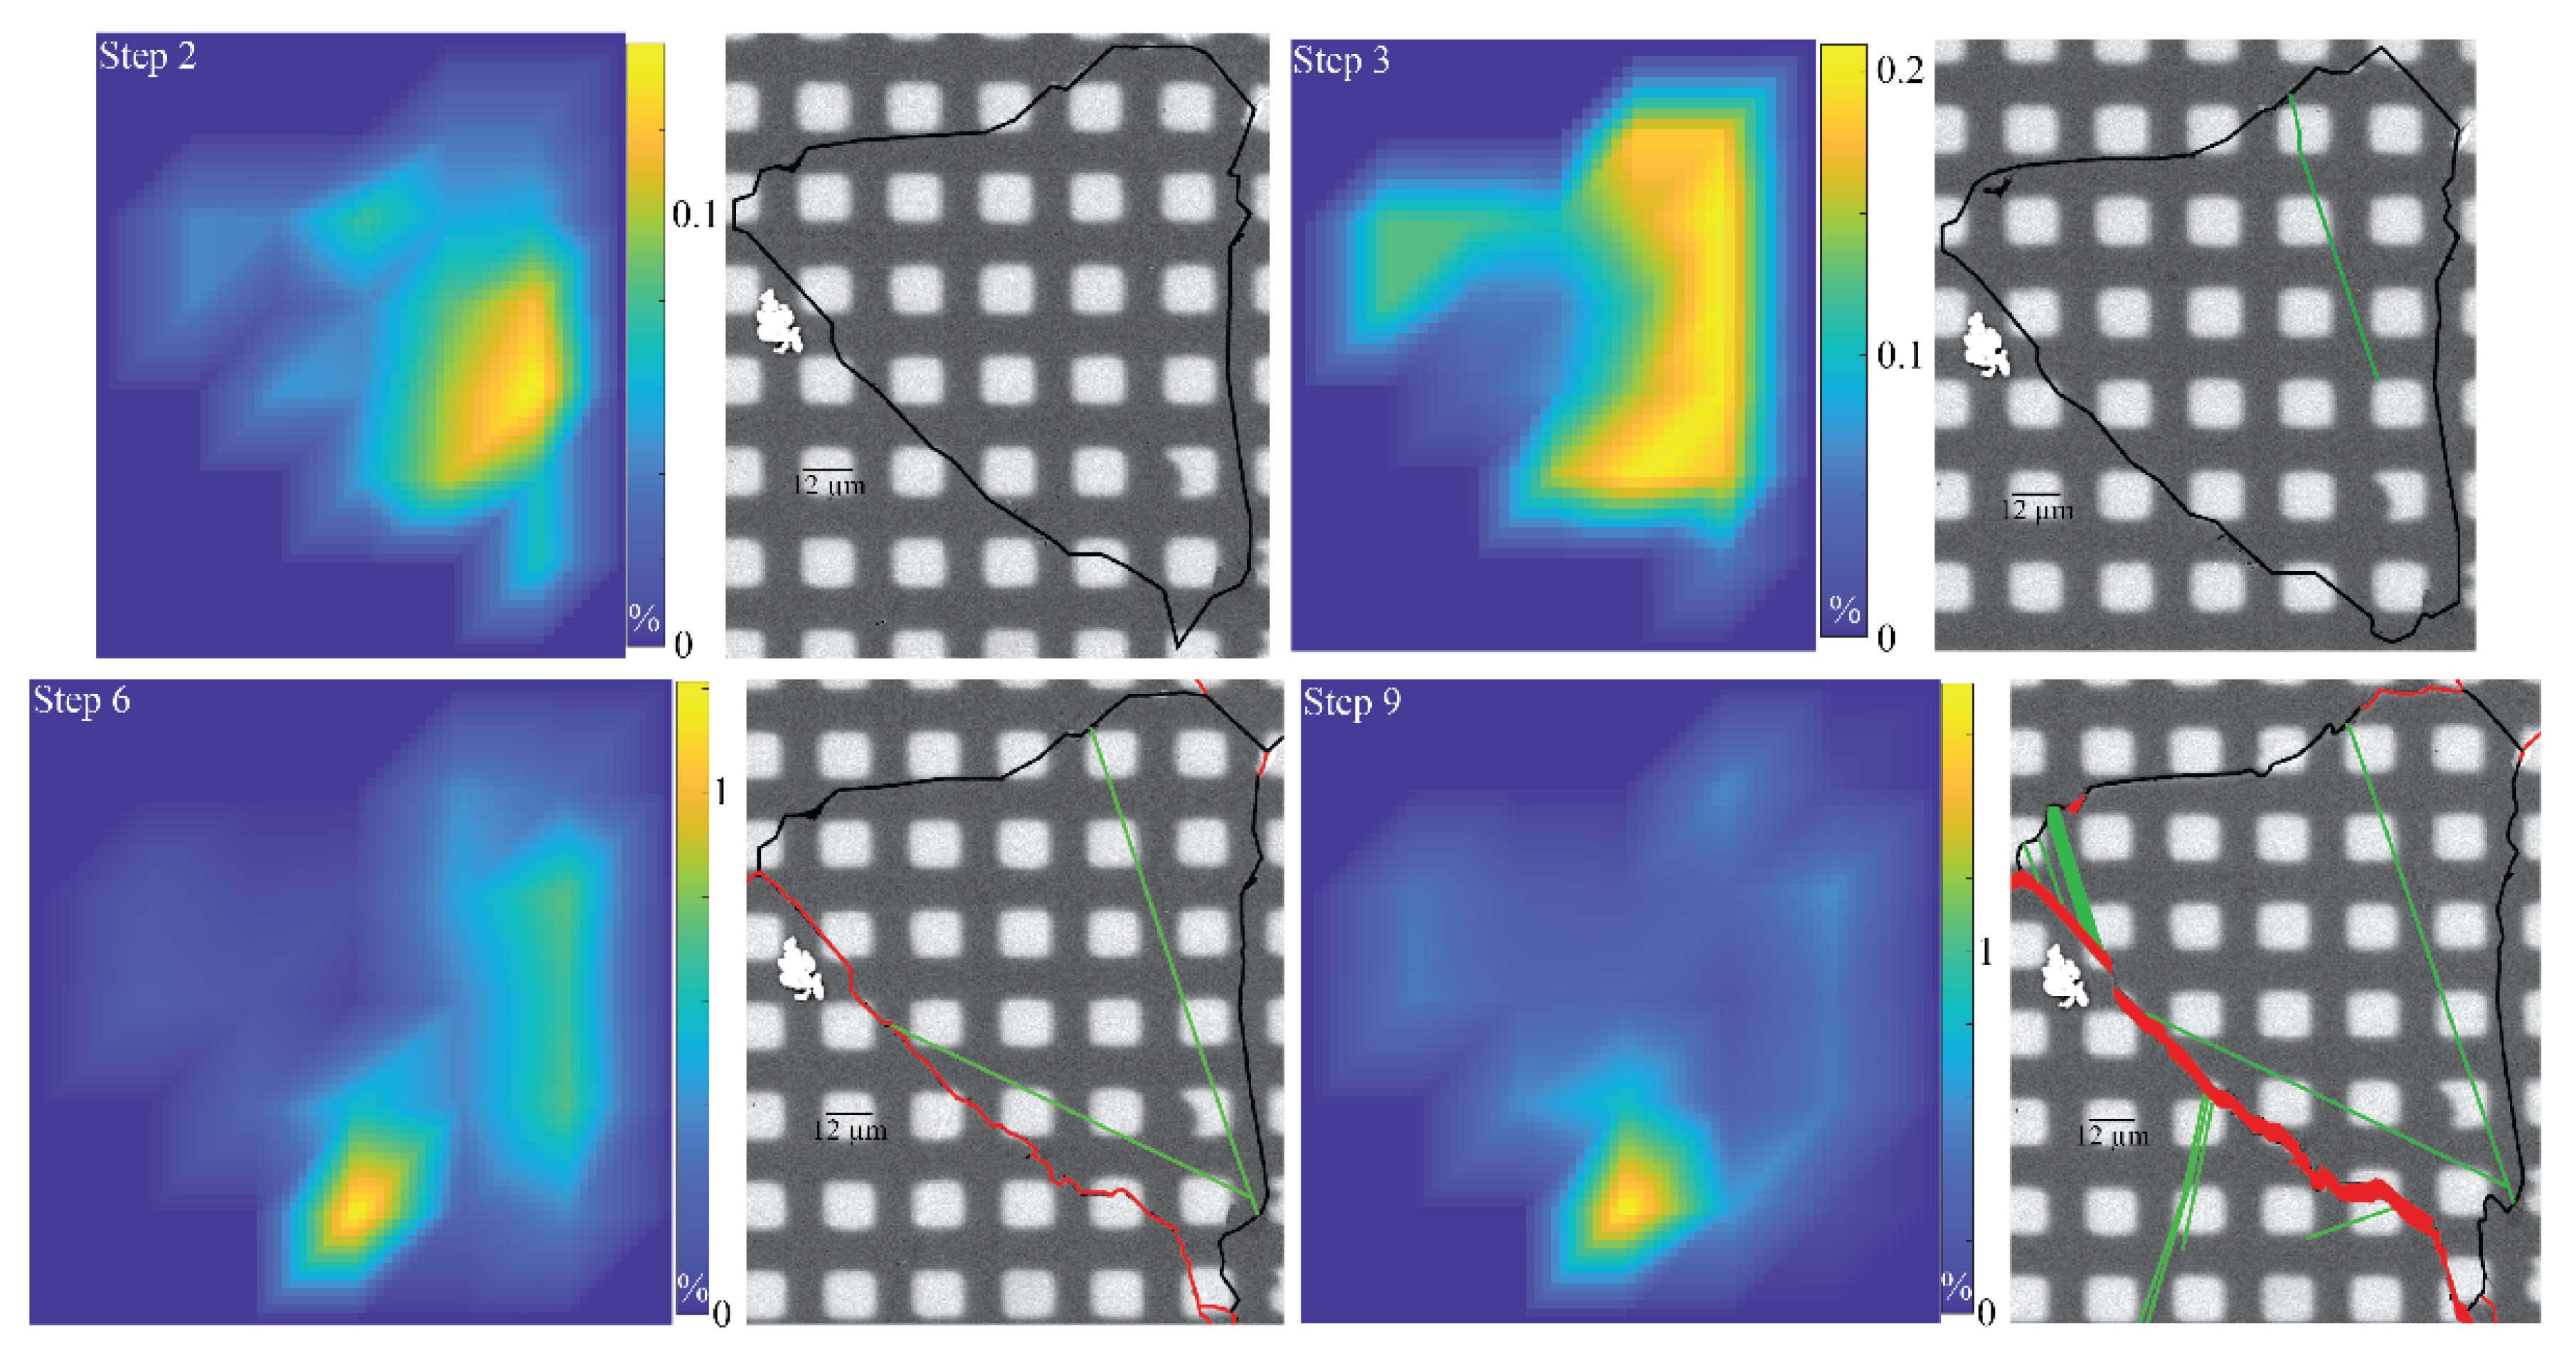
Crystal 9 (Figure 16) also shows localised strain at the grain boundaries before the appearance of the first twinned plane at step 3, which crosses the entire crystal. At step 6, after densification of the family of twins initially activated, a second family is activated but the lamella is incomplete, as shown by the dotted line along the crystal. The last family of twin planes is activated at the very end of the experiment, at step 8, and thickens very abruptly until it reaches the same thickness as the initially activated twinning. The two late active families do not dominate the overall crystal strain. Having a crystal twinning on its three families of twin planes is not an isolated phenomenon; it has also been observed in other crystals.
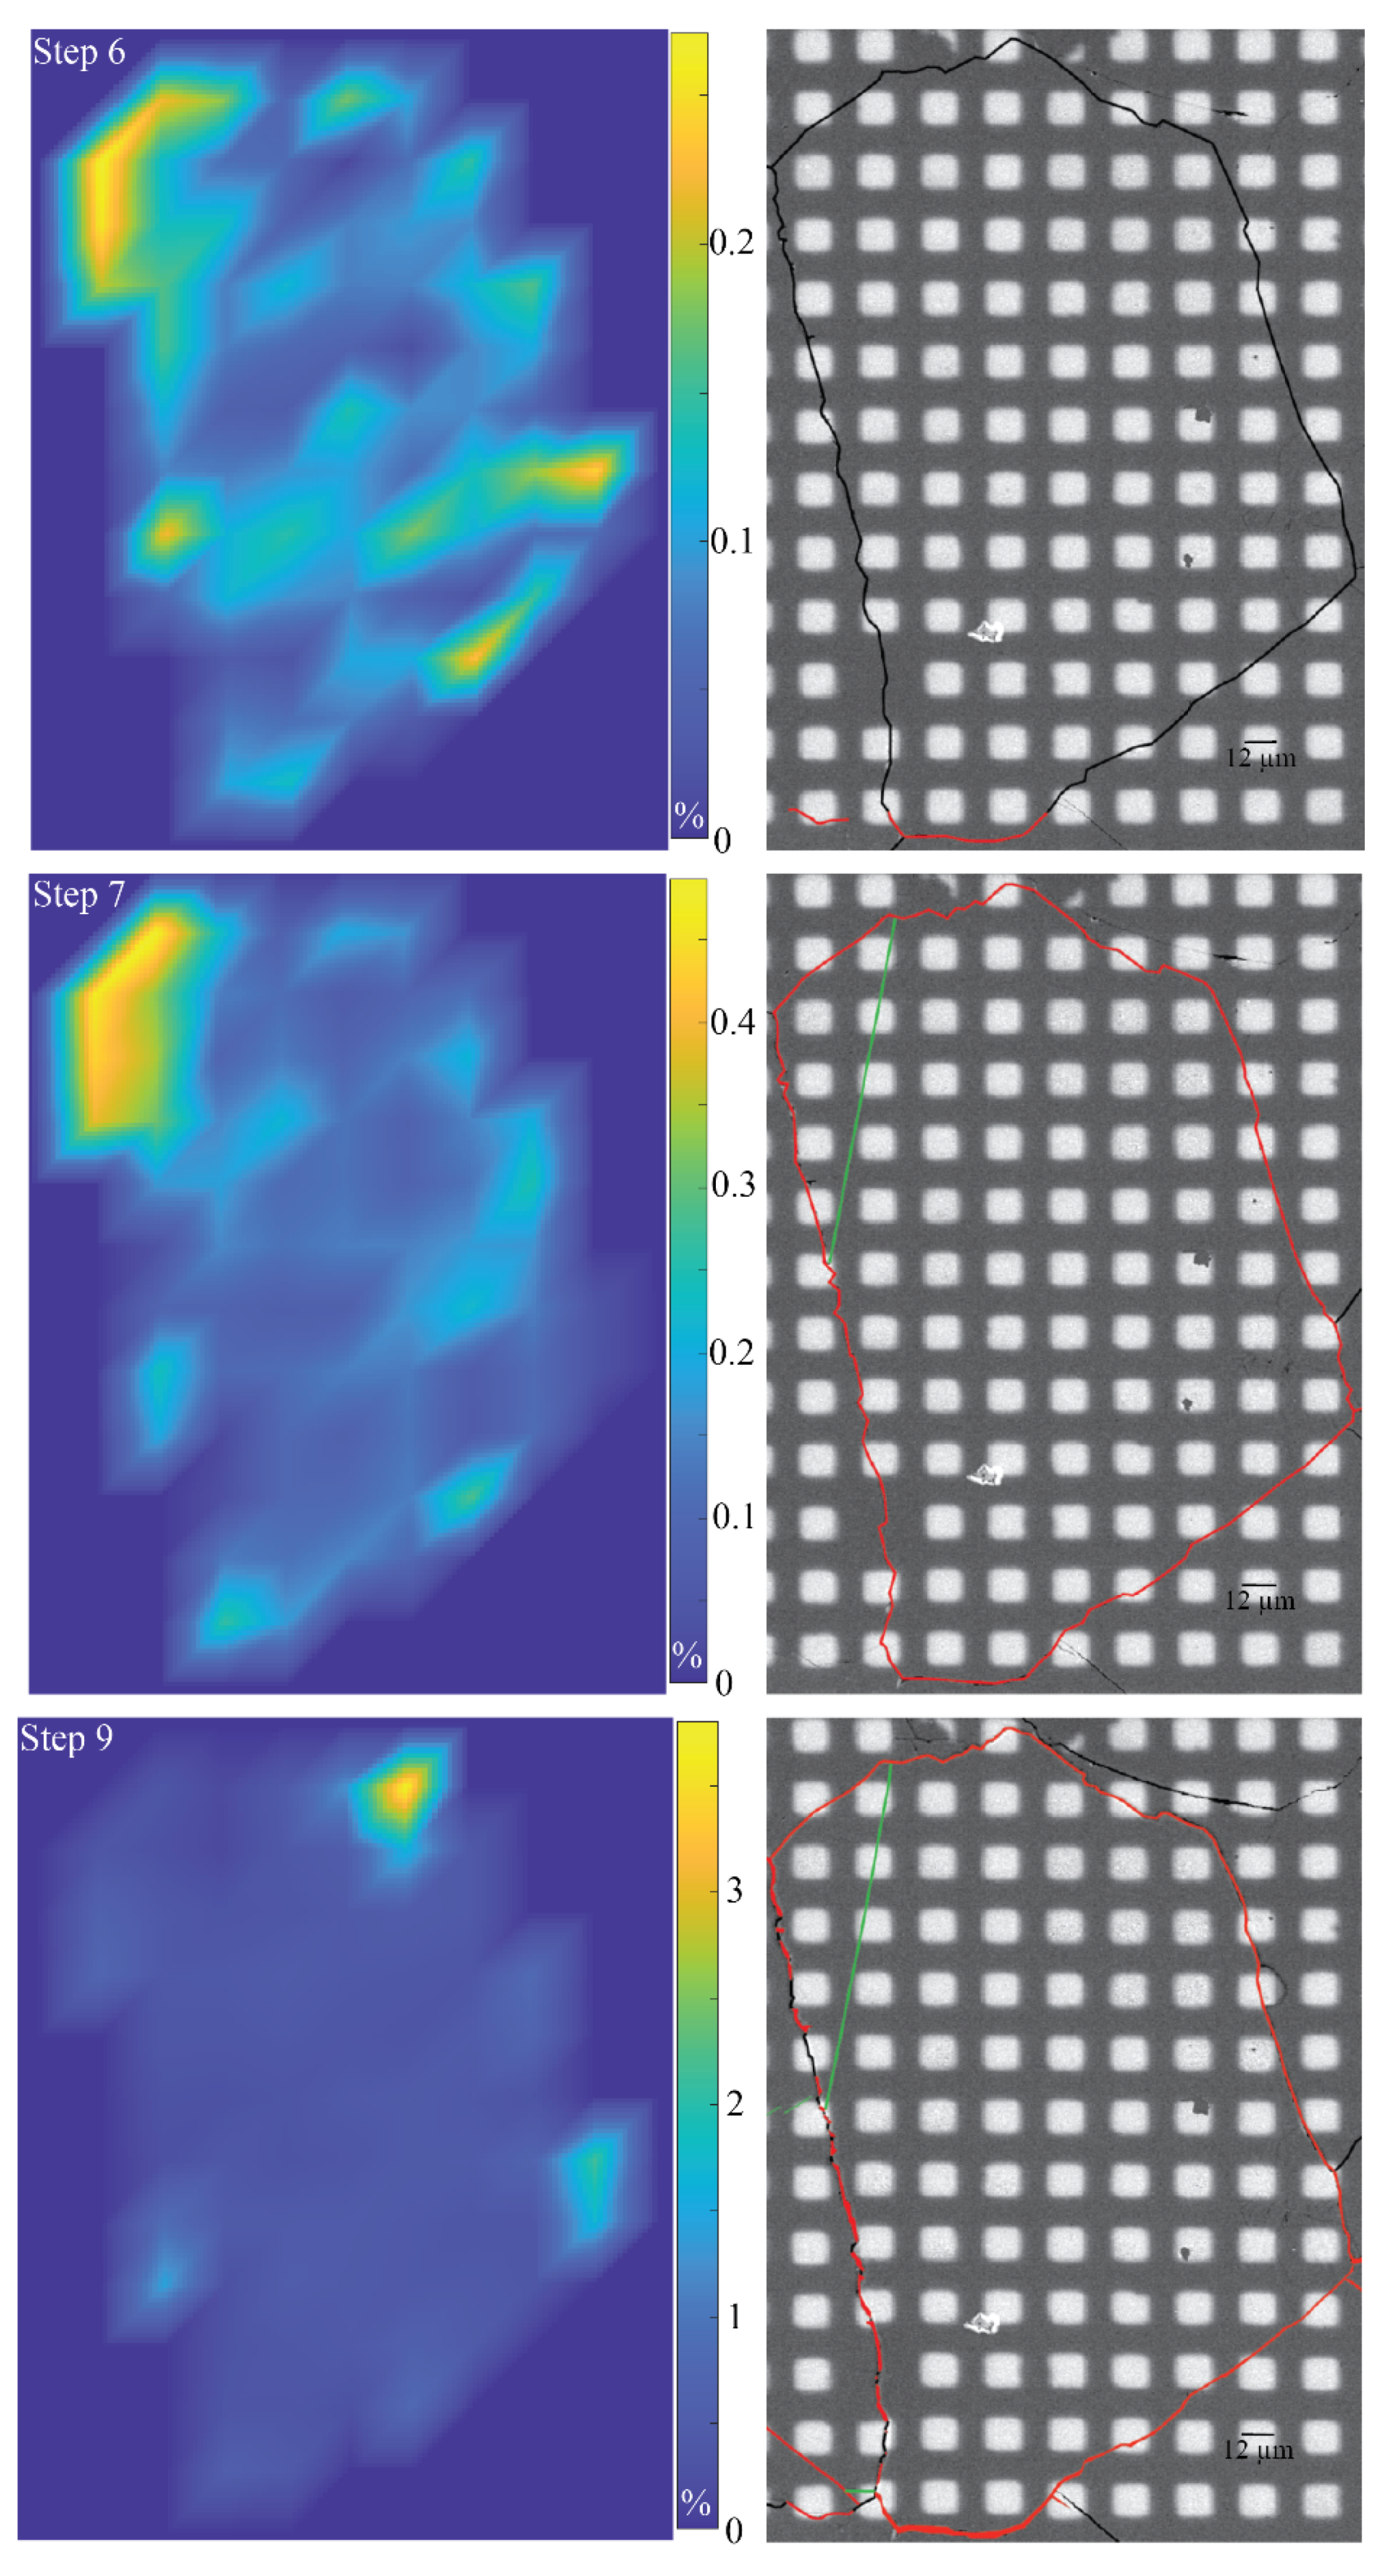
Crystal 10 shows the activation of a single family of twin planes at step 6 (Figure 17). The number and thickness of twin lamellae progressively increase with loading. The strain map shows the same evolution as for the previous crystals. The deformation is first localized at the grain boundaries before activating the accommodation of the deformation in the crystal via the twinning. The crystal does not show fracturing on its visible face.
Crystal 11 is among the crystals that did not twin (Figure 18). It did fracture at its centre along the axis of the applied macroscopic stress. This fracture connects the opening to the grain boundary locations adjacent to the crystal.
Crystal 12 was already pre-twinned with one twin lamella before the experiment started (Figure 19). This family of twins did not develop further during the experiment and another one prevailed in the accommodation of the crystal deformation during the loading. This second family of twin planes appeared between step 6 and 7. All the intra-crystalline deformation is located along the twinned plane at the moment of its activation. Only one other twin lamella from the same family activates later on and the thickening of the initial twin remains limited. No intra-grain fracturing occurs, but there is large opening at the grain boundaries.
Crystal 13 shows only one single twinned plane on its surface (Figure 20). The deformation seems to be mainly accommodated via sliding at the grain boundaries.
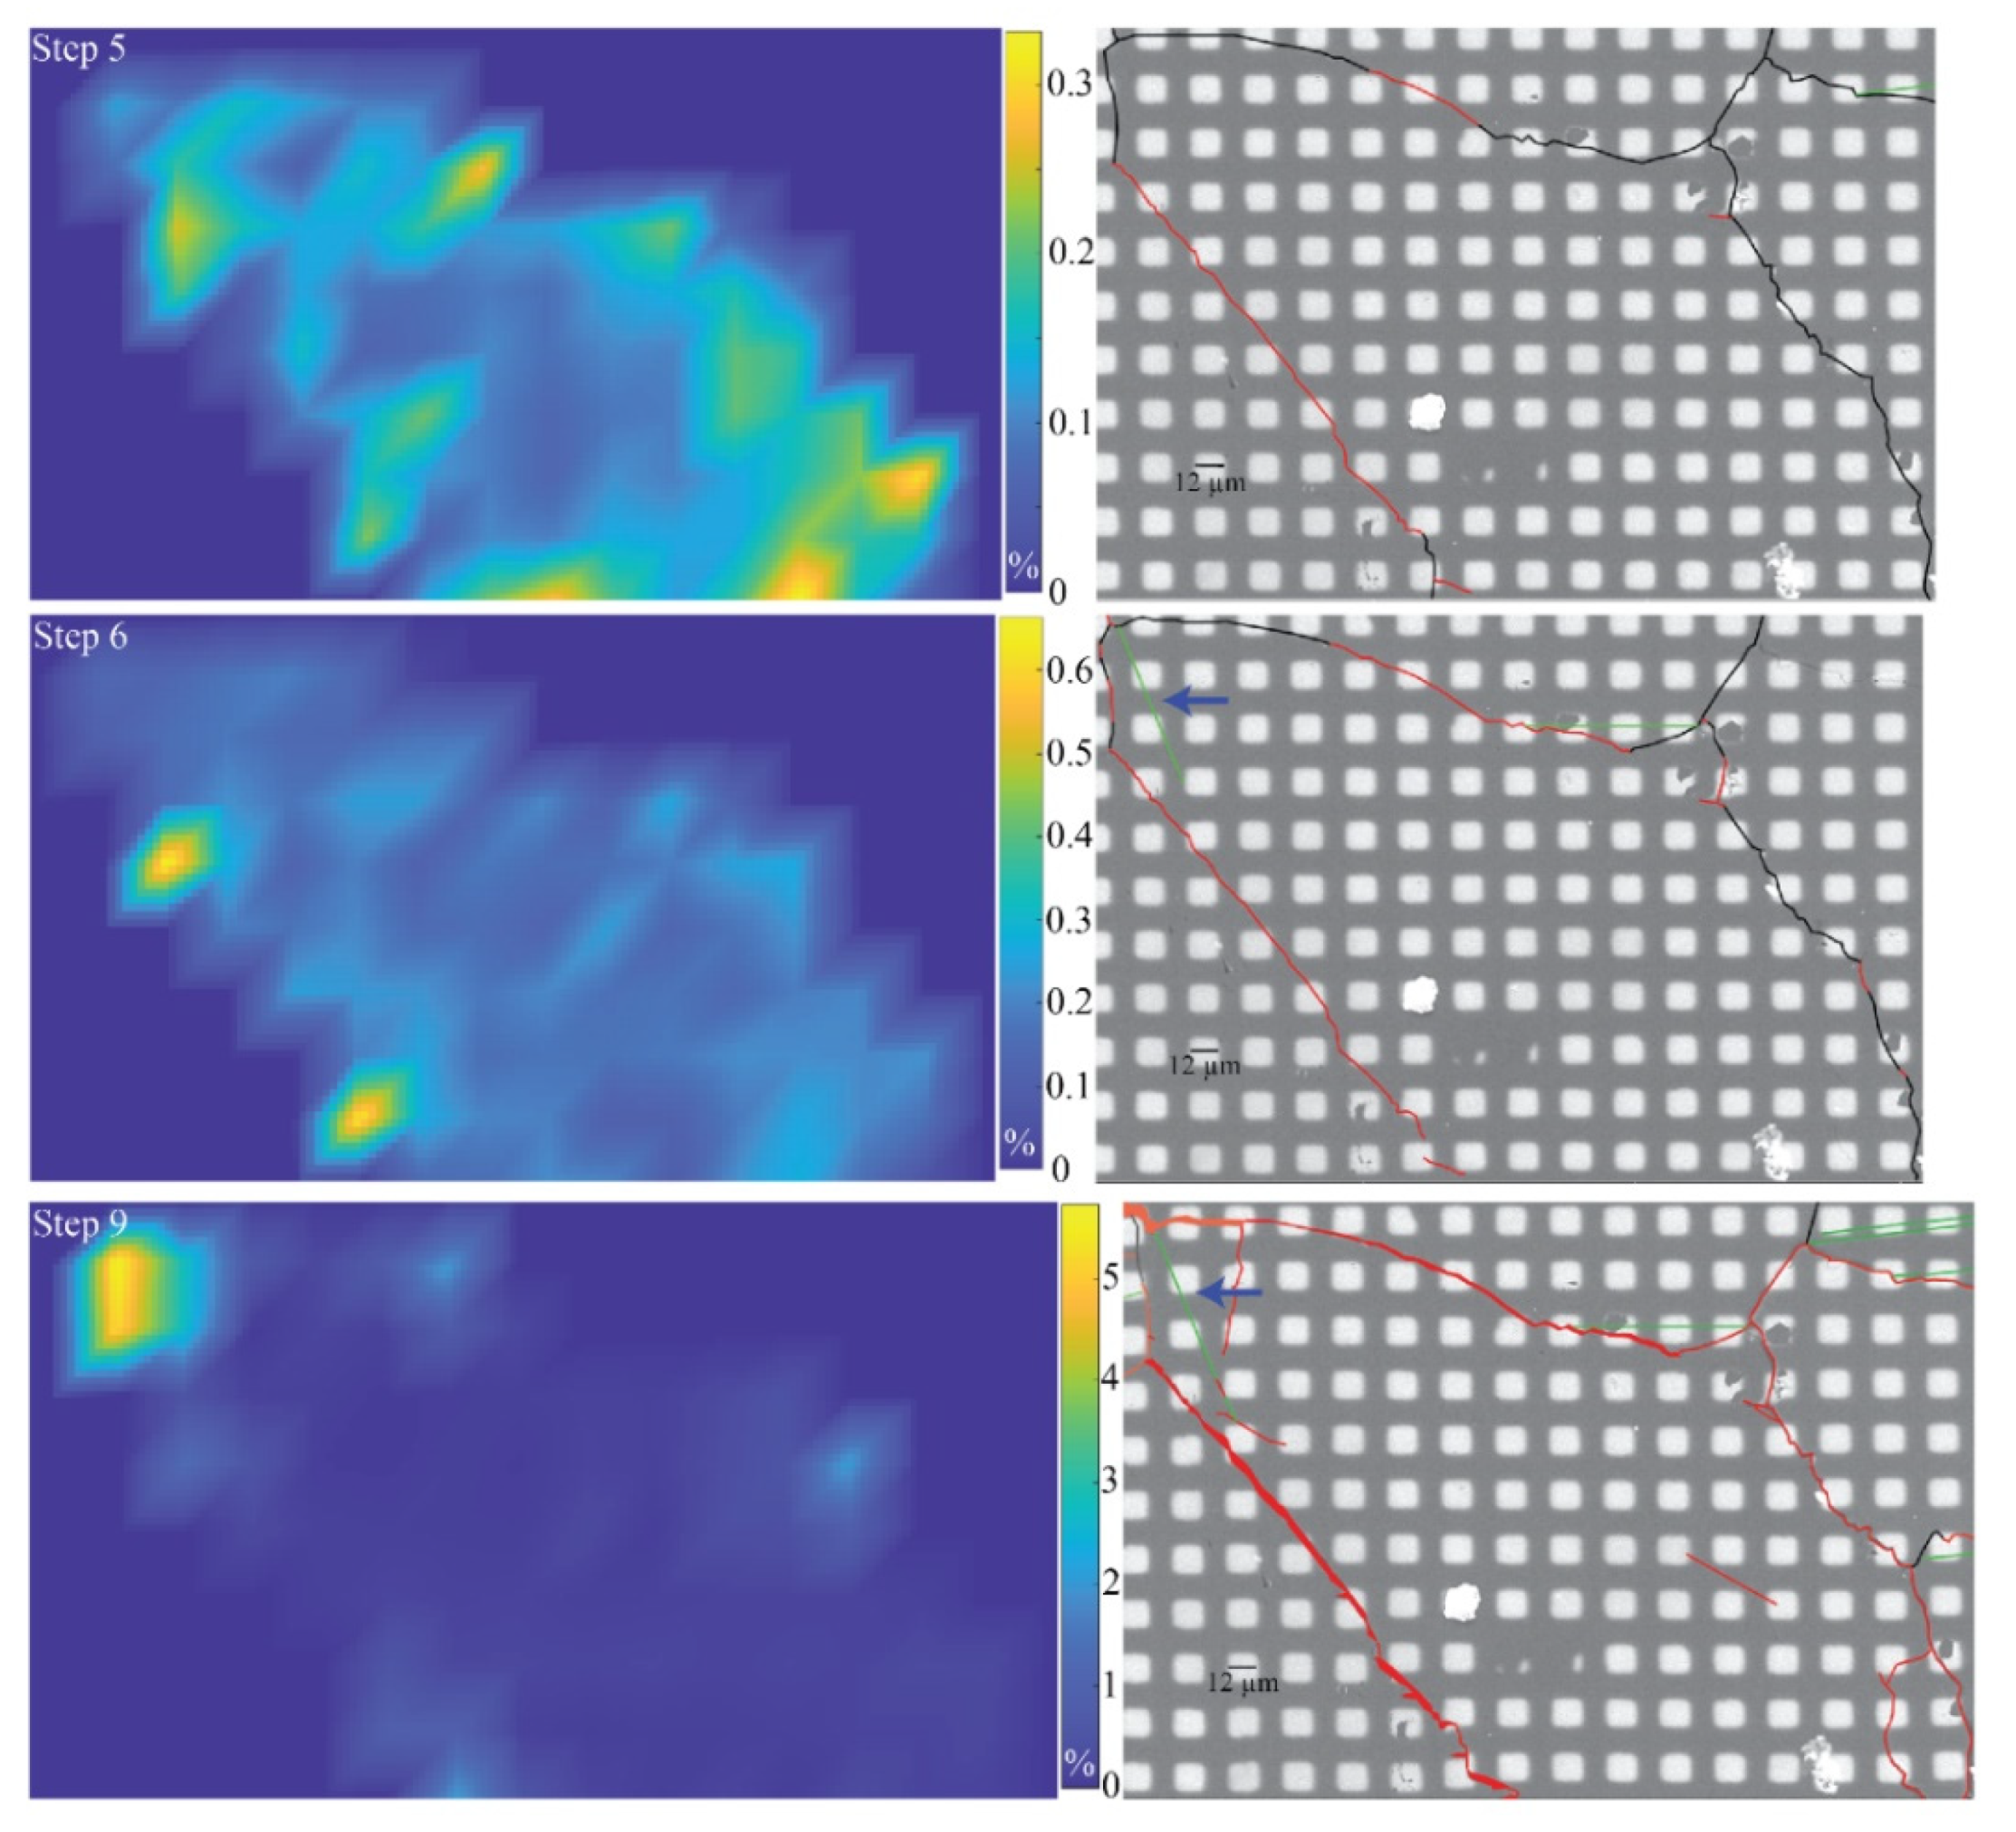
The deformation in crystal 15 (Figure 21) is localized at the grain boundaries before the first twins appear. Those emerge between step 4 and step 5. Some of these lamellae will not cross the whole crystal but will develop later. At step 9, the deformation by twinning and fracturing of the crystal is observed, as well as displacements at the grain boundaries.
Crystal 16 only activates a single twin lamella, and the strain is first mostly diffuse (Figure 22). This single twin plane is placed at the southern end of the crystal and appears very late (step 6). By the end, strain localizes close to the grain borders.
The deformation of crystal 17 takes place in several stages. A very early initiation of the first twin occurs at step 3 (21 MPa) (Figure 23). This is followed by the appearance of the second family of twins (step 6). The latter does not take over the evolution of the deformation accommodation. Thus, only the first family of twins continues to develop, producing more twin lamellae and thickening.
Crystal 18 shows only slight twinning with a single lamella that does not thicken. Most strain remains mainly at the grain boundaries, which is clearly visible at step 9 (Figure 24).
The deformation of crystal 20 begins at step 4 with the appearance of two joined twin lamellae (Figure 25). One crosses the entire crystal, while the other stops at the point where a fracture starts during the following loading step. It is at the point of fracturing that the final step records the maximum local strain, of more than 16%. The direction of this fracturing is sub-parallel to the overall stress applied. At steps 5 and 9, a single family of twin planes largely developed. It presents several thickened twin lamellae crossing the entire crystal. It seems that the twinned planes of the second family, which are less developed, are only initiated at the junction with the first family of twins. The percentage of deformation recorded within a twin lamella does not appear to exceed 1% deformation, even in the final phase before rupture and disaggregation.
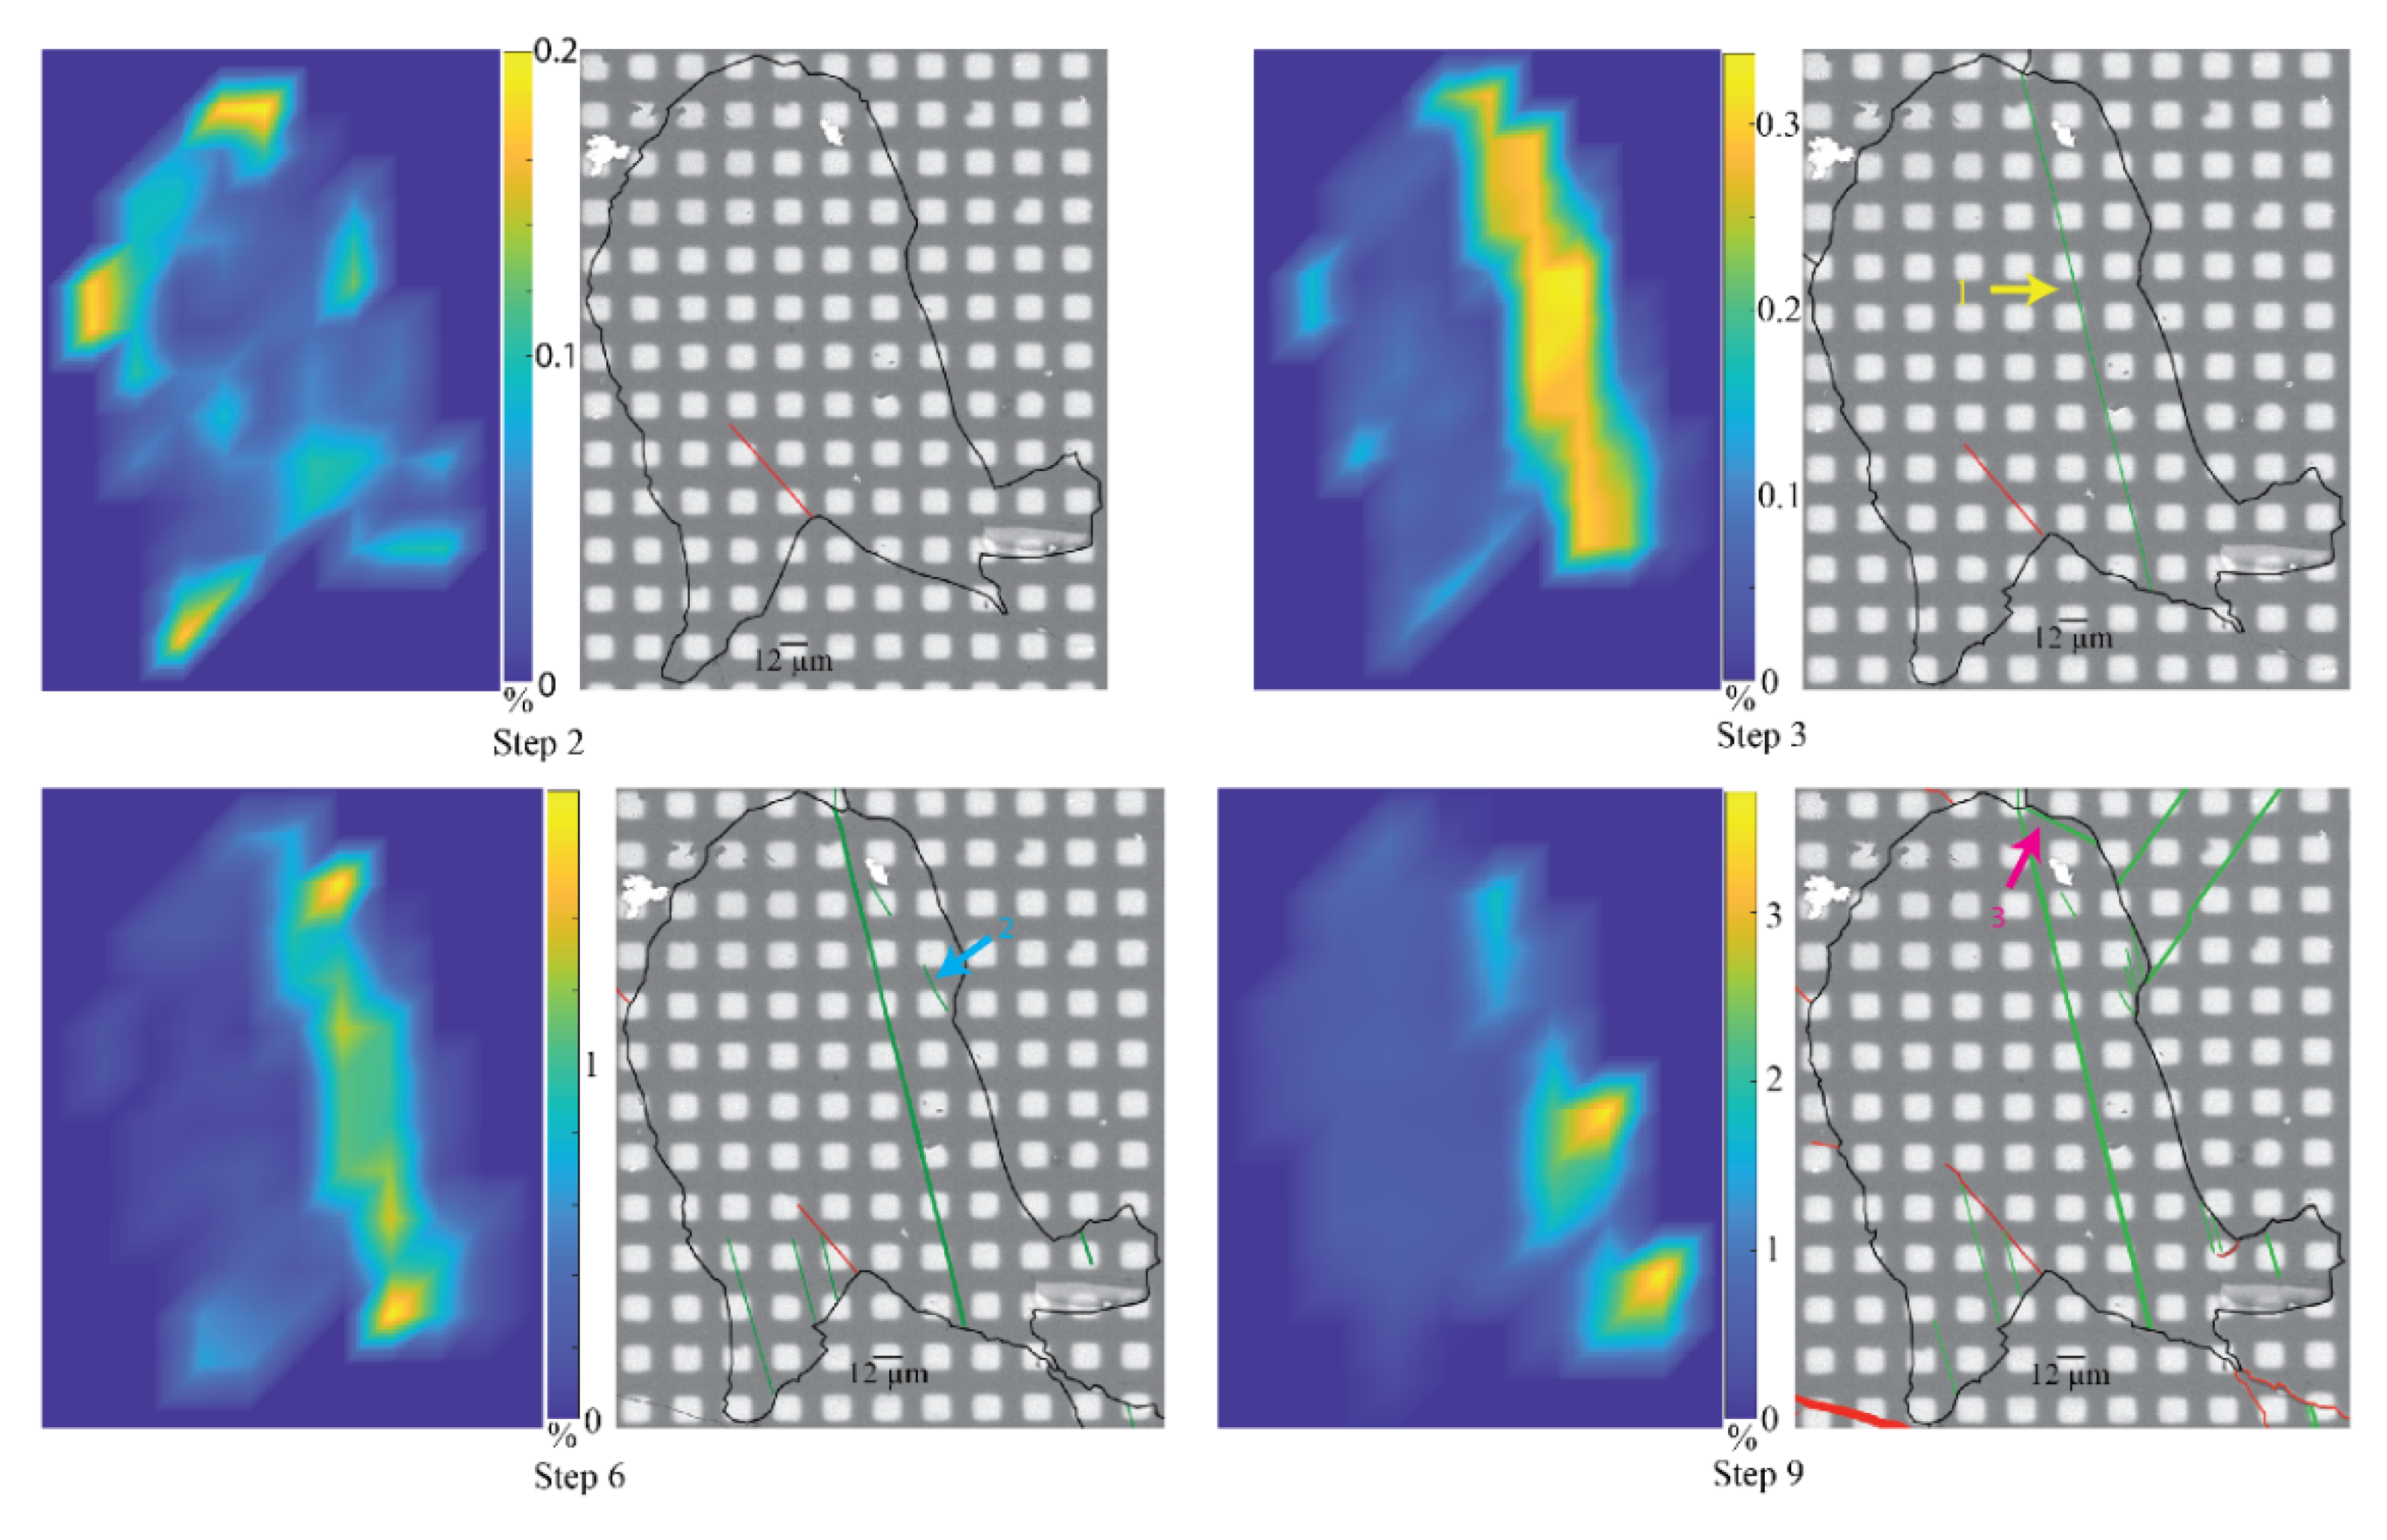
Figure 26 shows the evolution of the deformation of crystal 21. The North–South location on the deformation map marks the exact location of the appearance of twin lamellae (step 3). However, they are only visible in the next step. In step 5, a second family of twins becomes active. This is the only observation of a secondary twin family that activates in a later phase and that develops more than a previously activated family. The number of lamellae and their thickening increase rapidly.
Crystals 22 and 23 are side by side and each has activated a family of twin planes. Crystal 22 will twin at step 5 when the adjacent crystal 23 will deform at step 7. There was no thickening of the twin lamellae on these crystals and only a slight increase in the number of twinned planes.
To summarise, the deformation is often initially localised at the grain boundaries. Intragranular deformation via twinning occurs later. The families of twins activated early during loading evolve throughout the deformation process by multiplying the number of twinned planes and by their thickening. On the contrary, those that appear later do not evolve at all, or only slightly. Indeed, the intra-crystalline deformation is very quickly replaced by the activation of slip at the grain boundaries, which prefigures sample disaggregation. Intra-crystalline fracturing does not necessarily activate. Crystallographic orientation does not seem to influence the intra-crystalline micro-fracturing. Some fractures appear to be related to the twinned planes and are located at the end of the lamellae. These fractures do not cross the whole crystal. In opposition, the intra-crystalline fractures, which are aligned with the applied macroscopic stress, do cross the whole grain. It should be noted that the latter always link strongly opening grain boundaries and that the concerned crystals are usually elongated, with their long axis oriented perpendicular to macroscopic stress.
3.3. CSIT-2 Inversion
The study of the twinning-related deformation of natural calcite crystals is used to reconstruct the regional or local stress states at the origin of the deformation: orientations of the principal stress axes (σ₁, σ₂ and σ₃), stress ratios and stress differentials. For this purpose, data inversion analyses were developed in the past. The CSIT-2 [13] method of calcite twinning inversion is used in the present study and applied to the sample, for which twinning history was detailed above. CSIT-2 considers that the orientation data of the calcite twins will be obtained via a universal stage mounted on an optical microscope. This is the usual protocol used, giving a good ratio of measuring time/quantity. However, as this study requires samples of several-millimetre widths, it is impossible to use this protocol. The EBSD allowed us to overcome this problem by giving the orientation of the crystal lattice at a given point. For this purpose, a twin data collection code, using both EBSD analysis and SEM photography, was developed to determine the orientations of the twinned and untwinned planes on the surface of a sample. The new data inputs were implemented in CSIT-2, including information on the orientation of the crystal and whether or not the three twin planes are activated.
The force is applied along the long axis of the sample, defined as the X axis (east). The Y axis is defined as the north. The applied stress tensor is, therefore, defined as east–west. The Calcite Twin Inversion Method (CSIT-2) [13] was applied to the sample and gave the following tensor:
σ₁: N108-04
σ₂: N210-71
σ₃: N016-18
And a stress ratio of 0.39. The stress ratio is expressed as follows:
The overall stress tensor reconstructed from the whole data set is consistent with the uniaxial macroscopic stress applied to the sample, with a maximum stress in the east–west direction. In this study, the magnitude of σ₂ is considered to be equal to σ₃ at the sample scale. However, at the scale of the grain trapped in an aggregate with crystals surrounding it on all sides, σ₂ is not equal to σ₃. The stress ratio will necessarily increase. As for the orientation of the principal axes σ₃ and σ₂, it is difficult to forecast, for the same reasons.
The inversion method also allows for estimation of the resolved shear stresses experienced by every activated twin system. The code calculates the Schmid factors with respect to the macroscopic stress state for all possible twin planes, whether activated or not. Table 1 shows the results of the corresponding Schmid factors. From the inversion analysis of calcite twinning, the Carrara marble sample shows that 90% of the twinned planes have a positive Schmid factor value. It shows that the tensor can activate these twin planes. The twinned planes with a Schmidt factor of less than zero correspond to the uncertainty range of the inversion. Indeed, the inversion does not take into account the effect of the stress concentration at the grain boundaries. The stress can, therefore, be more or less deviated by the succession of deformations in the aggregate, which locally modify the orientation of the stress applied to a crystal.
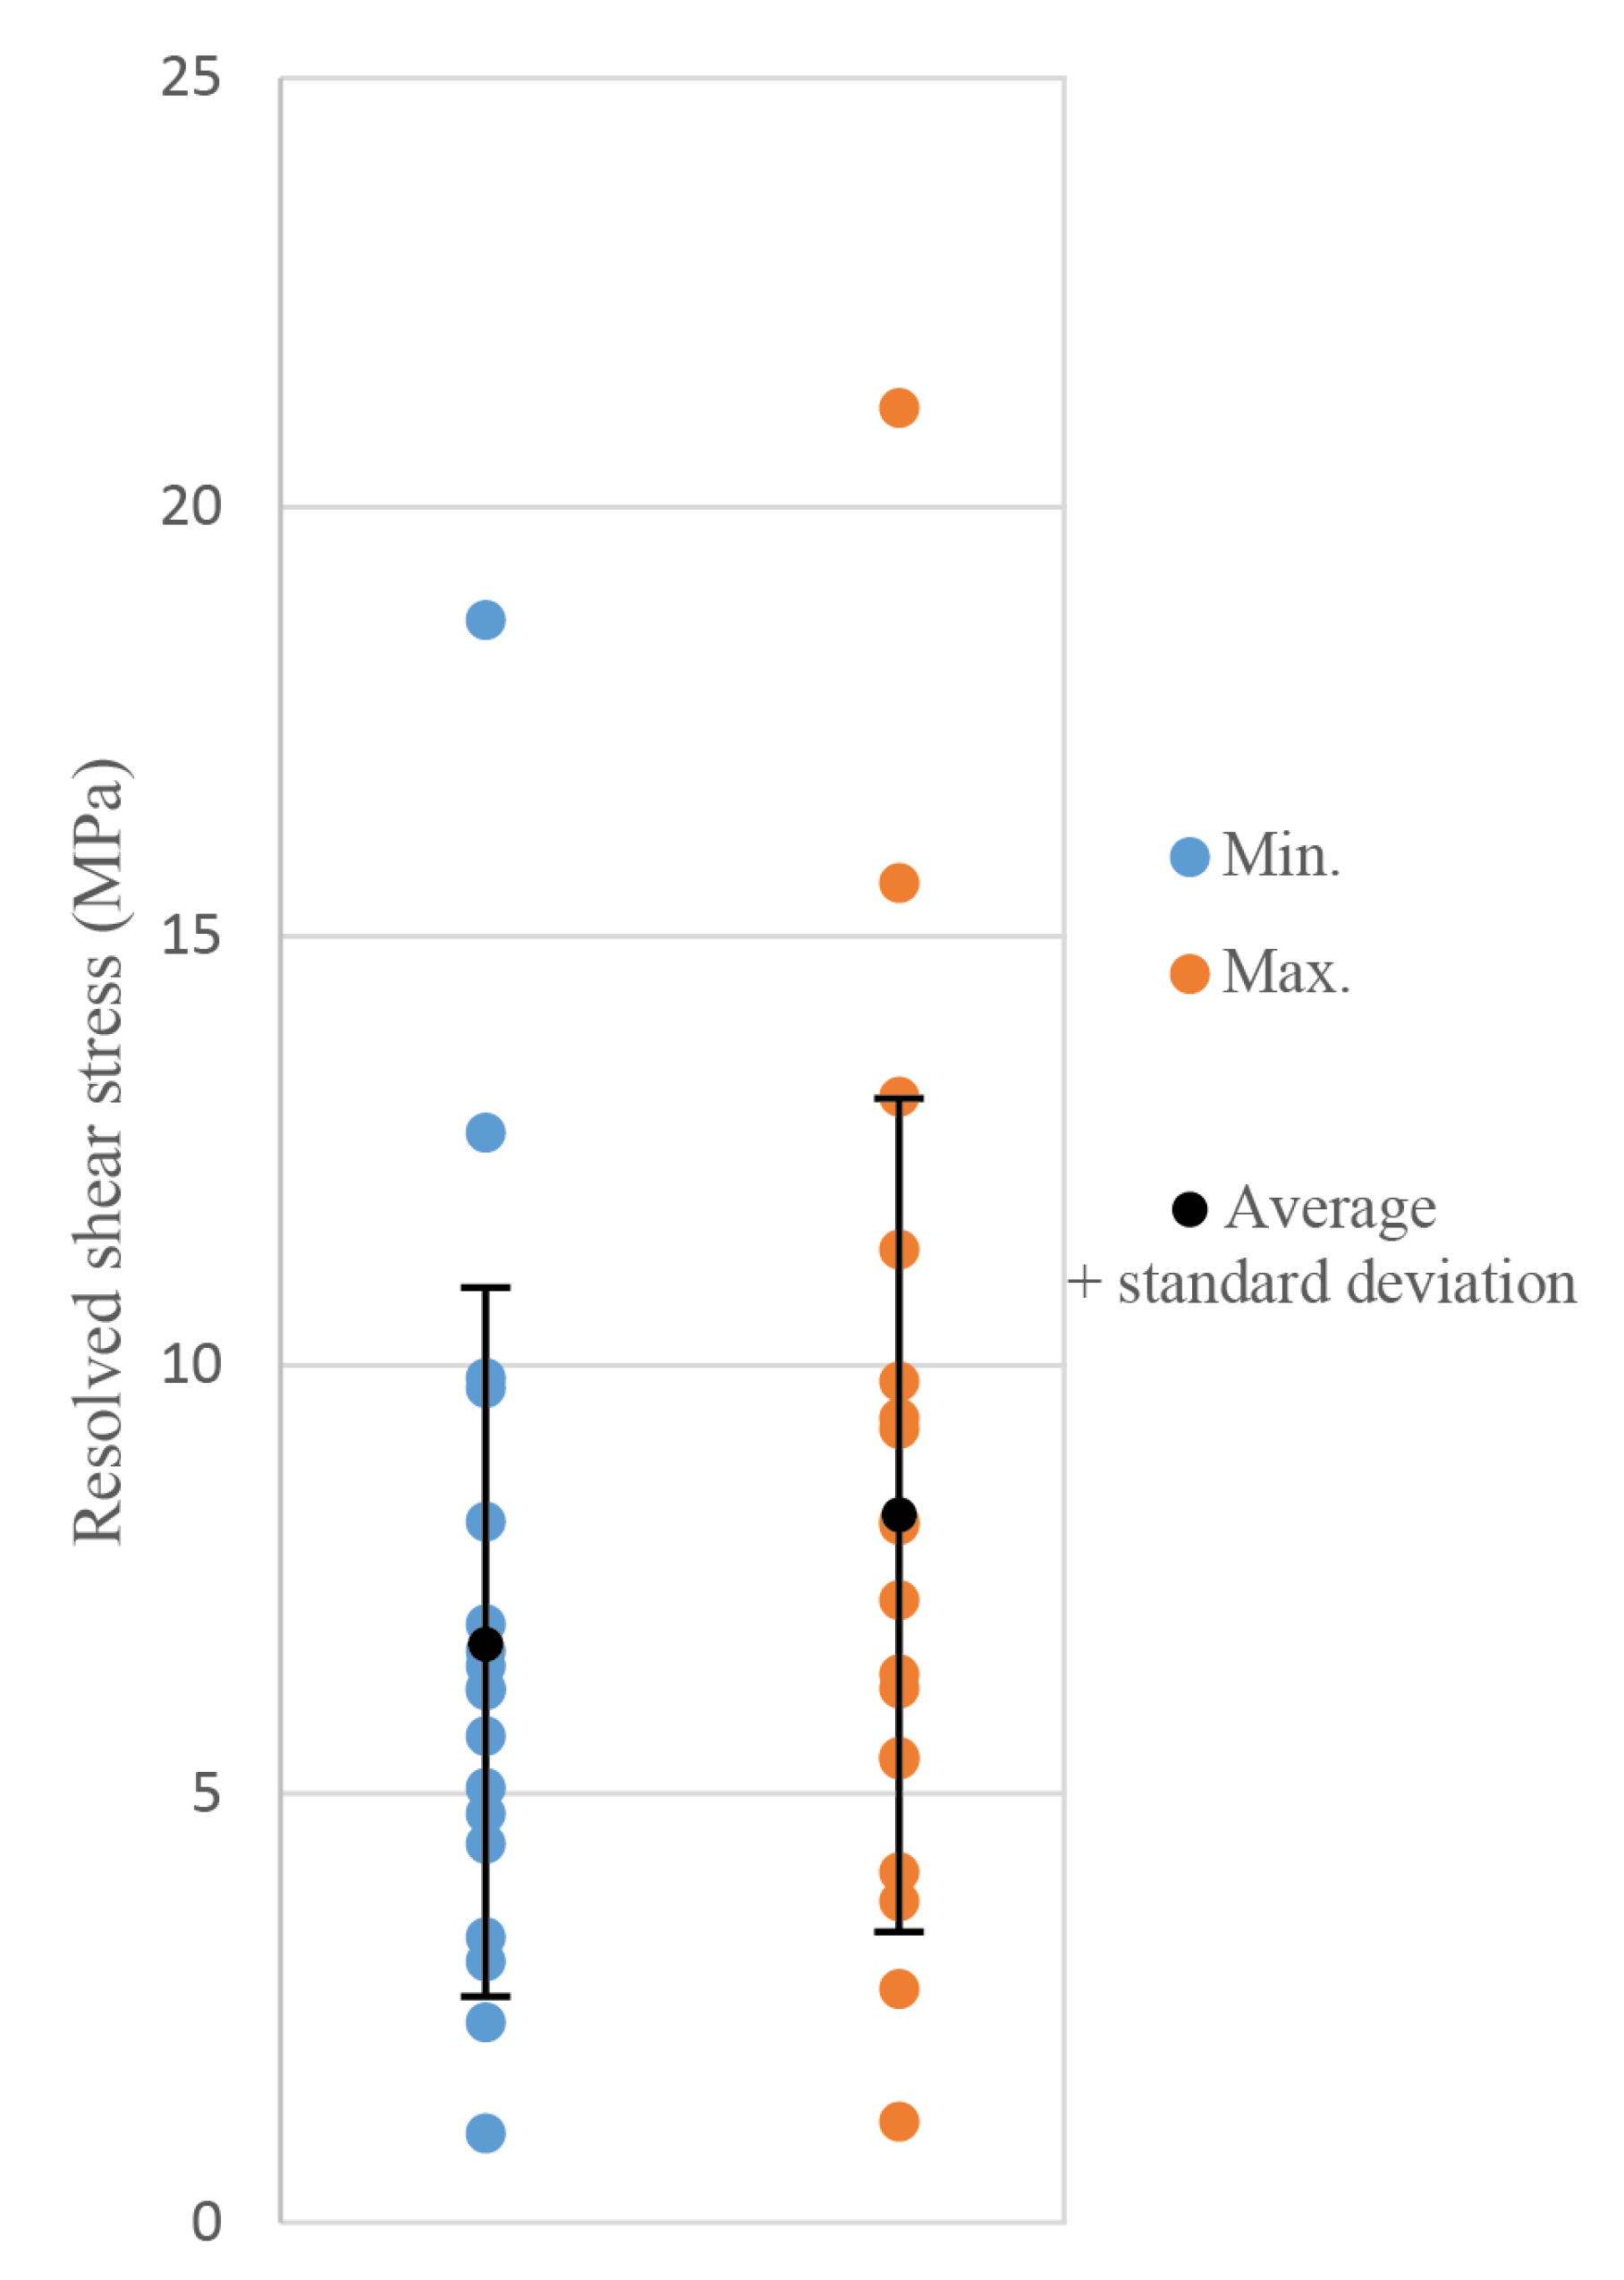
The previous analysis of the deformation for each crystal observed on the sample surface allowed for the determination of a range of applied stresses, for which twinned planes appear. The minimum and maximum applied stresses correspond to the stages of deformation, between which the SEM micrographs allowed us to detect the activation of the considered twinning system. From these extrema, we can infer a range of possible resolved shear stresses experienced by the activated twinning systems, with values between 6.75 MPa ± 4.13 MPa and 8.25 MPa ± 4.86 MPa (Figure 27).
4. Discussion
4.1. Crystal Deformation
Previous work on uniaxial compression of synthetic calcite single crystals [26] showed the following deformation evolution: (1) micro-fracturing at the sample ends and first twinned planes during the beginning of loading, with strain hardening. (2) Densification of the number of twinned planes and lamella thickening, during several percent macroscopic axial deformation, with a pseudo constant flow stress. (3) Rupture of the sample following a major fracture.
It was suggested that the presence of free lateral surfaces could be a facilitating factor for the thickening of the twin lamellae. The present study shows that thickening also occurs in the context of an aggregate, where each grain has only one free surface. With regard to the development of twins, a similar evolution is observed, with an initial twinned plane followed by an increase in the number of activated planes of the same family. Sometimes, a second family of twins can be activated, but only one accommodates most of the imposed strain by multiplication of the twinned planes and their thickening.
As with synthetic single crystals, the twins do not always develop instantaneously over the entire crystal. Instead, many twins propagate gradually through the crystal. Synthetic calcite single crystals were of optical quality, with no visible defects. This is not the case with the natural calcite aggregates in the present work. Defects, such as pre-existing micro-fractures or inclusions, may either initiate or hinder the propagation of twins. Some of the twinned planes finish at micro-fractures. This phenomenon has been observed before [39] and the twin planes are interpreted as causing the micro-fracturing. An obstacle to the propagation of the twin creates a stress concentration, inducing fracturing. These types of fractures were not observed in the synthetic single crystals.
The thickening of the twin lamellae in the Carrara marble is much less pronounced than that observed in single crystals of calcite. In the marble, the grain boundaries are not free surfaces. Most of the thickened lamellae are found at the edges of grain boundaries, which have shown inter-crystalline micro-fracturing, with either opening or sliding. It is not clear whether the thickening relates to a previously activated grain boundary, or if the grain boundary activates prior to twin thickening. The time lapse of SEM imaging and the sequential step-by-step loading do not allow one to precisely follow the temporal evolution. Optical microscopy allows for a high image acquisition rate [43], but the spatial resolution precludes the identification of twinning and the technique stems mostly for fracturing evolution.
The fracturing of calcite single crystals is progressive, but is not due to twinning. It occurs at a later stage, when large portions of the crystal have twinned. In the present case, intra-granular fracturing seems to relate to previously activated inter-granular fracturing.
4.2. Inversion and Critical Resolved Shear Stress
In the context of calcite twinning inversion, the value of the critical resolved shear stress for twinning is the key issue for calculating stress differentials. This was already addressed in the previous study on single crystals. However, these were far too large for the value to be used in a natural sampling context. Here, Carrara marble has crystal sizes that are much closer to what will be analysed and measured in the sedimentary basin problems. For the reasons mentioned above, it also avoids the debate on crystal sizes or crystal size distribution in the definition of a critical value.
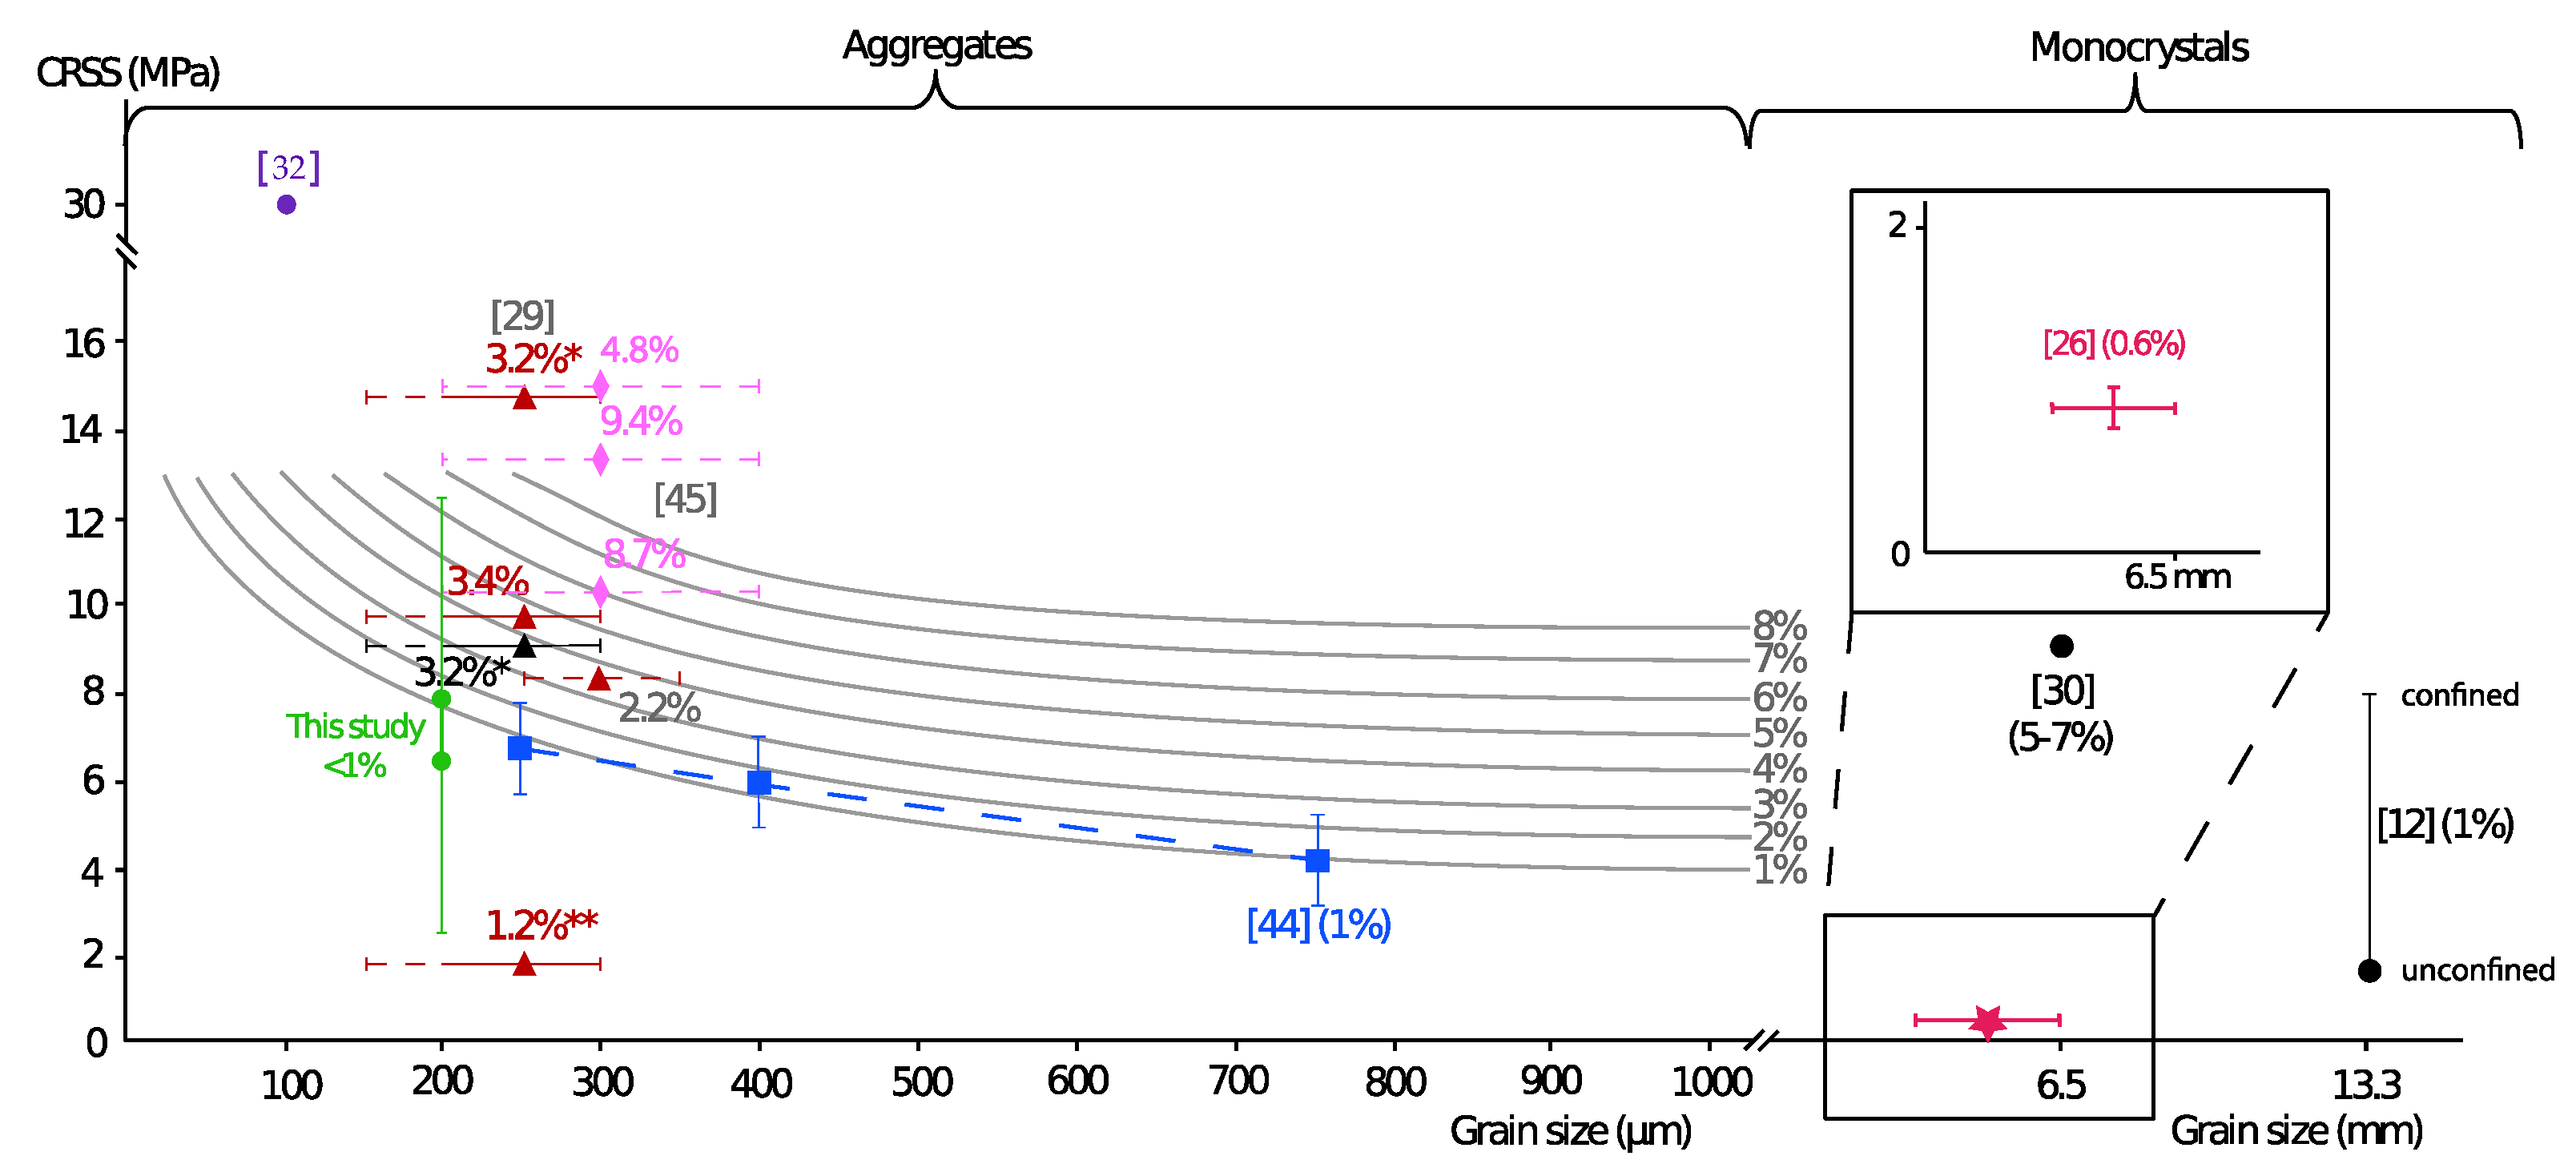
Analysis using CSIT-2 revealed a range of resolved shear stress values for the observed 200 µm-sized crystals: ≈6.75–8.25 MPa (±4.5 MPa) (Figure 28), constitutive of Carrara marble samples cumulating less than 1% macroscopic strain. The range of values for the same crystal size is, therefore, very wide and this is explained by the fact that the determination of the Schmid factors was established by taking into account only the macroscopic stress applied to the sample. Nothing is known about the stress concentration at the grain boundaries. It is clear from the observations that the strains are first localised at the grain boundaries before propagating into the crystal via twinning and then fracturing. Although SEM images were taken at regular and close intervals, the exact time of appearance of a twin plane has yet to be determined. In this study, it was only possible to determine a minimum and maximum range of values, in which the first twinned plane appears.
It would, therefore, be necessary to reduce this interval of shots, which requires stopping the loading more often. The sample preparation protocol is highly unrepeatable. The cohesion between the crystals is difficult to maintain. The polishing of the observation surface induces local variation in the temperature. Cold working of the surface during sample preparation is only poorly controllable by maintaining the sample under cold water during polishing. The natural porosity and permeability of the sample also play a major role. Some samples from the same marble block only used fracturing and slippage at the grain boundaries to accommodate deformation, despite a preparation protocol scrupulously identical to this one.
Another point concerned the appearance of a twinned plane on the surface. It has been found on several occasions that the planes of calcite twins do not necessarily cross the entire crystal as soon as they appear. It is, therefore, possible for the crystal to be partially twinned without being visible on the observation surface. This, again, questions the value given above. It should, therefore, be seen as a high value of the resolved shear stress for this crystal size range.
5. Conclusions
The evolution of the deformation within the calcite crystal showed a progressive propagation of the deformation with: (1) localisation of the strain at the grain boundaries, (2) appearance of the first twin planes, (3) densification and thickening of the twin lamellae and eventual fracturing of the crystal sub-parallel to the applied macroscopic stress, (4) fracturing and significant engagement of the deformation accommodation by sliding and opening at the grain boundaries.
This study confirms that the thickening of twin lamellae also occurs at low temperatures. The duration of application and the increase in stress have an impact on the thickness of the twins.
New values for the critical resolved shear stress were obtained for use in reconstructing stress tensors. Initially, the value used for 200–300 µm wide crystals was 10 MPa [45], which may be slightly overestimated, since we find values around 6–8 MPa for 200 µm sized crystals.
Author Contributions
Conceptualization, A.D. and C.P.; methodology, C.P. and S.H.; writing—original draft preparation, C.P.; writing—review and editing, C.P., and A.D.; supervision, A.D. All authors have read and agreed to the published version of the manuscript.
Funding
The experiments were financially supported by the LMS-Ecole Polytechnique and the Chaire Energies Durables (EDF foundation).
Data Availability Statement
The data are not available.
Acknowledgments
In this section, we would like to thank the reviewers that took time to read and comment the manuscript that helped to improve it.
Conflicts of Interest
The authors declare no conflict of interest.
References
- Abdallah, Y.; Sulem, J.; Bornert, M.; Ghabezloo, S.; Stefanou, I. Compaction banding in high-prosity carbonate rocks: 1. Experimental Observations. J. Geophys. Res. Solid Earth 2021, 126, e2020JB020538. [Google Scholar] [CrossRef]
- Dautriat, J.; Bornert, M.; Gland, N.; Dimanov, A.; Rphanel, J. Localized deformation induced by heterogeneities in porous carbonate analysed by multi-scale digital image correlation. Tectonophysics 2011, 503, 100–116. [Google Scholar] [CrossRef]
- Cilona, A.; Faulkner, D.; Tondi, E.; Agosta, F.; Mancini, L.; Rustichelli, A.; Baud, P.; Vinciguerra, S. The effects of rock heterogeneity on compaction localization in porous carbonates. J. Struct. Geol. 2014, 67, 75–93. [Google Scholar] [CrossRef]
- Baud, B.; Schubnel, A.; Wong, T.-F. Dilatancy, compaction, and failure mode in Solnhofen limestone. J. Geophys. Res. Solid Earth 2000, 105, 19289–19303. [Google Scholar] [CrossRef]
- Nicolas, A.; Fortin, J.; Regnet, B.; Verberne, A.; Plümper, O.; Dimanov, A. Brittle and semibrittle creep of Tavel limestone deformed at room temperature. J. Geophys. Res. Solid Earth 2017, 122, 4436–4459. [Google Scholar] [CrossRef]
- Kaga, H.; Gilman, J. Twinning and detwinning in calcite. J. Appl. Phys. 1969, 40, 3196–3207. [Google Scholar] [CrossRef]
- Barber, D.; Wenk, H. Deformation twinning in calcite, dolomite, and other rhomboedral carbonates. Phys. Chem. Miner. 1979, 5, 141–165. [Google Scholar] [CrossRef]
- Borg, I.; Turner, F. Deformation of Yule marble: Part VI—Identify and significance of deformation lamellae and parting in calcite grains. Bull. Geol. Soc. Am. 1953, 64, 1343–1352. [Google Scholar] [CrossRef]
- Bowden, F.; Cooper, R. Velocity of twin propagation in crystals. Nature 1962, 195, 1091–1092. [Google Scholar] [CrossRef]
- De Bresser, J. Steady state dislocation densities in experimentally deformed calcite materials: Single crystals versus polycrystals. J. Geophys. Res. 1996, 101, 22189–22201. [Google Scholar] [CrossRef]
- De Bresser, J. Intracrystalline Deformation of Calcite. Ph.D. Thesis, University Utrecht, Utrecht, The Netherlands, 1991. [Google Scholar]
- Turner, F. Nature and dynamic interpretation of deformation lamellae in calcite of three marbles. Am. J. Sci. 1953, 251, 276–298. [Google Scholar] [CrossRef]
- Parlangeau, C.; Lacombe, O.; Schueller, S.; Daniel, J. Inversion of calcite data for paleostress orientations and magnitudes: A new technique tested and calibrated on numerically-generated and natural data. Tectonophysics 2018, 722, 462–485. [Google Scholar] [CrossRef] [Green Version]
- Groshong, R. Experimental test of least-squares strain calculations using twinned calcite. Geol. Soc. Am. Bull. 1974, 85, 1855–1864. [Google Scholar] [CrossRef]
- Rez, J. TwinCalc: A multitool for calcite twinning based stress analysis. Appl. Comput. Geosci. 2020, 5, 100020. [Google Scholar] [CrossRef]
- Etchecopar, A. Etude des Etats de Contraintes en Tectonique Cassante et Simulation de Deformations Plastiques (Approche Mathematique). Ph.D. Thesis, Université Sciences et Techniques du Languedoc, Montpellier, France, 1984; 270p. [Google Scholar]
- Yamaji, A. Generalized Hough transform for the stress inversion of calcite twin data. J. Struct. Geol. 2015, 80, 2–15. [Google Scholar] [CrossRef] [Green Version]
- Shan, Y.; Zheng, J.; Liang, X. Inversion of polyphase calcite twin data for deviatoric stress tensors: 1. Anovel numerical approach. J. Struct. Geol. 2019, 128, 103873. [Google Scholar] [CrossRef]
- Lacombe, O.; Amrouch, K.; Mouthereau, F.; Dissez, L. Calcite twinning constraints on late Neogene stress patterns and deformation mechanisms in the active Zagros collision belt. Geology 2007, 35, 263–266. [Google Scholar] [CrossRef]
- Amrouch, K.; Lacombe, O.; Bellahsen, N.; Daniel, J.M.; Callot, J.P. Stress and strain patterns, kinematics and deformation mechanisms in a basement-cored anticline: Sheep Mountain Anticline, Wyoming. Tectonics 2010, 29, TC1005. [Google Scholar] [CrossRef] [Green Version]
- Beaudoin, N.; Koehn, D.; Lacombe, O.; Lecouty, A.; Billi, A.; Aharonov, A.; Parlangeau, C. Fingerprinting stress: Stylolite and calcite twinning paleopiezometry revealing the complexity of progressive stress patterns during foldings—The case of the Monte Nero anticline in the Apennines, Italy. Tectonics 2016, 35, 1687–1712. [Google Scholar] [CrossRef] [Green Version]
- Beaudoin, N.; Lacombe, O. Recent and future trends in paleopiezometry in the diagenetic domain: Insights into the tectonic paleostress and burial depth history of fold-and-thrust belts and sedimentary basins. J. Struct. Geol. 2018, 114, 357–365. [Google Scholar] [CrossRef]
- Lacombe, O.; Parlangeau, C.; Beaudoin, N.; Amrouch, K. Calcite twins: Formation, measurement and use as stress-strain indicators. A review of progress over the last decade. Geosciences 2021, 11, 445. [Google Scholar] [CrossRef]
- Burkhard, M. Calcite twins, their geometry, appearance and significance as stress-strain markers and indicators of tectonic regime: A review. J. Struct. Geol. 1993, 15, 351–368. [Google Scholar] [CrossRef] [Green Version]
- Olsson, W. Grain size dependence of yield stress in marble. J. Geophys. Res. 1974, 79, 4859–4862. [Google Scholar] [CrossRef]
- Parlangeau, C.; Dimanov, A.; Lacombe, O.; Hallais, S.; Daniel, J.M. Uniaxial compression of calcite crystals at room temperature: Insights into twinning activation and development. Solid Earth 2019, 10, 307–316. [Google Scholar] [CrossRef] [Green Version]
- Newman, J. The influence of grain size and grain size distribution on methods for estimating paleostresses from twinning in carbonates. J. Struct. Geol. 1994, 16, 1589–1601. [Google Scholar] [CrossRef]
- Rowe, K.; Rutter, E. Paleostress estimation using calcite twinning: Experimental calibration and application to nature. J. Struct. Geol. 1990, 12, 1–17. [Google Scholar] [CrossRef]
- Lacombe, O.; Laurent, P. Determination of deviatoric stress tensors based on inversion of calcite twin data from experimentally deformed monophase samples: Preliminary results. Tectonophysics 1996, 255, 189–202. [Google Scholar] [CrossRef]
- De Bresser, J.H.P.; Spiers, C.J. Strength characteristics of the r, f, and c slip systems in calcite. Tectonophysics 1997, 272, 1–23. [Google Scholar] [CrossRef]
- Ferrill, D.A. Critical re-evaluation of differential stress estimates from calcite twins in coarse-grained limestone. Tectonophysics 1998, 285, 77–86. [Google Scholar] [CrossRef]
- Covey-Crump, S.J.; Schofield, P.F.; Oliver, E.C. Using neutron diffraction to examine the onset of mechanical twinning in calcite rocks. J. Struct. Geol. 2017, 100, 77–97. [Google Scholar] [CrossRef] [Green Version]
- Tullis, T. The use of mechanical twinning in minerals as a measure of shear stress magnitudes. J. Geophys. Res. 1980, 85, 6263. [Google Scholar] [CrossRef]
- Ferrill, D.A.; Morris, A.P.; Evans, M.A.; Burkhard, M.; Groshong, R.H.; Onasch, C.M. Calcite twin morphology: A low temperature deformation geothermometer. J. Struct. Geol. 2004, 26, 1521–1529. [Google Scholar] [CrossRef] [Green Version]
- Ferrill, D.A. Calcite twin widths and intensities as metamorphis indicators in natural low-temperature deformation of limestone. J. Struct. Geol. 1991, 13, 667–675. [Google Scholar] [CrossRef]
- Bourcier, M.; Bornert, M.; Dimanov, A.; Héripré, E.; Raphanel, J.L. Multiscale experimental investigation of crystal plasticity and grain boundary sliding in synthetic halite using digital image correlation. J. Geophys. Res. Solid Earth 2013, 118, 511–526. [Google Scholar] [CrossRef] [Green Version]
- Quintanilla-Terminel, A.; Zimmerman, M.; Evans, B.; Kohlstedt, D. Microscale and nanoscale strain mapping techniques applied to creep of rocks. Solid Earth 2017, 8, 751–765. [Google Scholar] [CrossRef]
- Luzin, V.; Nikolayev, D.; Siegesmund, S. Temperature induced internal stress in Carrara marble. Mater. Sci. Forum 2014, 777, 148–154. [Google Scholar] [CrossRef]
- Frederich, J.; Evans, B.; Wong, T.-F. Micromechanics of the brittle to plastic transition in Carrara marble. J. Geophys. Res. 1989, 94, 4129–4145. [Google Scholar] [CrossRef]
- Renner, J.; Rummel, F. The effect of experimental and microstructural parameters on the transition from brittle to cataclastic flow of carbonate. Tectonophysics 1996, 258, 151–169. [Google Scholar] [CrossRef]
- Amrouch, K. Apport de L’analyse Microstructurale à la Comprehension des Mécanismes de Plissement: Exemples de Structures Plissées aux USA (Wyoming) et en Iran (Zagros). Ph.D. Thesis, Pierre and Marie Curie University, Paris, France, 2010. [Google Scholar]
- Robertson, E. Experimental study of the strength of rocks. Geol. Soc. Am. Bull. 1955, 66, 1275–1314. [Google Scholar] [CrossRef]
- Tal, Y.; Brian, E.; Mok, U. Direct observations of damage during unconfined brittle failure of Carrara marble. J. Geophys. Res. Solid Earth 2016, 121, 1584–1609. [Google Scholar] [CrossRef] [Green Version]
- Rocher, M.; Cushing, M.; Lemeille, F.; Lozac’h, Y.; Angelier, J. Intraplate paleostresses reconstructed with calcite twinning and faulting: Improved method and application to the eastern Paris Basin (Lorraine, France). Tectonophysics 2004, 387, 1–21. [Google Scholar] [CrossRef]
- Laurent, P.; Kern, H.; Lacombe, O. Determination of deviatoric stress tensors based on inversion of calcite twin data from experimentally deformed monophase samples. Part II. Axial and triaxial stress experiments. Tectonophysics 2000, 327, 131–148. [Google Scholar] [CrossRef]
Figure 1.
Result of EBSD analysis of a Carrara marble sample. Some twin planes are already distinguished. In this example, the analysis step is quite large, 1.1 µm. The yellow arrows indicate the EBSD-indexed twinned planes.
Figure 1.
Result of EBSD analysis of a Carrara marble sample. Some twin planes are already distinguished. In this example, the analysis step is quite large, 1.1 µm. The yellow arrows indicate the EBSD-indexed twinned planes.

Figure 2.
SEM photograph of Carrara marble samples with gold marking of the surface. (The top photograph) shows the result of the gold dewetting protocol. (The second photograph) illustrates the result of marking using the lithography technique.
Figure 2.
SEM photograph of Carrara marble samples with gold marking of the surface. (The top photograph) shows the result of the gold dewetting protocol. (The second photograph) illustrates the result of marking using the lithography technique.

Figure 3.
SEM photograph of Carrara marble samples with lithography gold marking of the surface. The photograph is the last one taken before the sample was completely disintegrated during the loading experiment.
Figure 3.
SEM photograph of Carrara marble samples with lithography gold marking of the surface. The photograph is the last one taken before the sample was completely disintegrated during the loading experiment.

Figure 4.
Step 0 shot of the deformation of a Carrara marble sample. The SEM parameters of the image are indicated at the bottom of the image. The gold marking is visible with the grid of squares highlighted. The grain boundaries have been redrawn to better distinguish them. The numbering corresponds to the crystals that were twinned during the experiment. The red arrow indicates the direction of the applied force.

Figure 5.
Photograph of the installation of the sample in the uniaxial press. The whole set up is mounted on the scanning electron microscope stand. The black rubber sheath partially surrounding the sample placed between the pistons is used to avoid, as much as possible, the pollution of the SEM chamber by the calcite fragments detached from the sample.

Figure 6.
Example of a curve obtained during an in-situ SEM experiment of a Carrara marble sample. The displacement speed of the piston is constant during the whole loading period at 8.10−5 mm/s. (A) Loading curve of the stress applied on the sample surfaces as a function of the piston displacement. (B) Curve of stress versus time.

Figure 7.
Map of the percentage of deformation at Step 6 of the deformation superimposed on the grain boundaries (in black), fractures (in red) and twin planes (in green).
Figure 7.
Map of the percentage of deformation at Step 6 of the deformation superimposed on the grain boundaries (in black), fractures (in red) and twin planes (in green).

Figure 8.
Map of the percentage of deformation from steps 2, 3, 4 of the experiment. The applied force being at 20.3° downward along the x-axis. Each picture is 800 µm wide.
Figure 8.
Map of the percentage of deformation from steps 2, 3, 4 of the experiment. The applied force being at 20.3° downward along the x-axis. Each picture is 800 µm wide.

Figure 9.
SEM image of the first twin lamella appearing in crystal 9 and its thickening with the progressive increase in the deformation. A square in the image is 12 µm wide.
Figure 9.
SEM image of the first twin lamella appearing in crystal 9 and its thickening with the progressive increase in the deformation. A square in the image is 12 µm wide.

Figure 10.
Equivalent Von Mises deformation map of crystal 2 at different steps of sample deformation. The black lines represent the grain boundaries. The green lines show the twinned planes. The red lines show the fracture zones.
Figure 10.
Equivalent Von Mises deformation map of crystal 2 at different steps of sample deformation. The black lines represent the grain boundaries. The green lines show the twinned planes. The red lines show the fracture zones.

Figure 11.
Equivalent Von Mises deformation map of crystal 4 at different steps of sample deformation. The black lines represent the grain boundaries. The green lines show the twinned planes. The red lines show the fracture zones. The yellow arrows show the stretched gold marks compared to the surrounding ones.

Figure 12.
Equivalent Von Mises deformation map of crystal 5 at different steps of sample deformation. The black lines represent the grain boundaries. The green lines show the twinned planes. The red lines show the fracture zones.
Figure 12.
Equivalent Von Mises deformation map of crystal 5 at different steps of sample deformation. The black lines represent the grain boundaries. The green lines show the twinned planes. The red lines show the fracture zones.

Figure 13.
Equivalent Von Mises deformation map of crystal 6 at different steps of sample deformation. The black lines represent the grain boundaries. The green lines show the twinned planes. The red lines show the fracture zones. The blue arrow points to the tiny twin planned that appeared step 4 due to the strain concentration of an adjacent twinned plane.

Figure 14.
Equivalent Von Mises deformation map of crystal 7 at different steps of sample deformation. The black lines represent the grain boundaries. The green lines show the twinned planes. The red lines show the fracture zones.
Figure 14.
Equivalent Von Mises deformation map of crystal 7 at different steps of sample deformation. The black lines represent the grain boundaries. The green lines show the twinned planes. The red lines show the fracture zones.

Figure 15.
Equivalent Von Mises deformation map of crystal 8 at different steps of sample deformation. The black lines represent the grain boundaries. The green lines show the twinned planes. The red lines show the fracture zones.
Figure 15.
Equivalent Von Mises deformation map of crystal 8 at different steps of sample deformation. The black lines represent the grain boundaries. The green lines show the twinned planes. The red lines show the fracture zones.

Figure 16.
Equivalent Von Mises deformation map of crystal 9 at different steps of sample deformation. The black lines represent the grain boundaries. The green lines show the twinned planes. The red lines show the fracture zones.
Figure 16.
Equivalent Von Mises deformation map of crystal 9 at different steps of sample deformation. The black lines represent the grain boundaries. The green lines show the twinned planes. The red lines show the fracture zones.

Figure 17.
Equivalent Von Mises deformation map of crystal 10 at different steps of sample deformation. The black lines represent the grain boundaries. The green lines show the twinned planes. The red lines show the fracture zones.
Figure 17.
Equivalent Von Mises deformation map of crystal 10 at different steps of sample deformation. The black lines represent the grain boundaries. The green lines show the twinned planes. The red lines show the fracture zones.

Figure 18.
Equivalent Von Mises deformation map of crystal 11 at different steps of sample deformation. The black lines represent the grain boundaries. The green lines show the twinned planes. The red lines show the fracture zones.
Figure 18.
Equivalent Von Mises deformation map of crystal 11 at different steps of sample deformation. The black lines represent the grain boundaries. The green lines show the twinned planes. The red lines show the fracture zones.

Figure 19.
Equivalent Von Mises deformation map of crystal 12 at different steps of sample deformation. The black lines represent the grain boundaries. The green lines show the twinned planes. The red lines show the fracture zones.
Figure 19.
Equivalent Von Mises deformation map of crystal 12 at different steps of sample deformation. The black lines represent the grain boundaries. The green lines show the twinned planes. The red lines show the fracture zones.

Figure 20.
Equivalent Von Mises deformation map of crystal 13 at different steps of sample deformation. The black lines represent the grain boundaries. The green lines show the twinned planes. The red lines show the fracture zones.
Figure 20.
Equivalent Von Mises deformation map of crystal 13 at different steps of sample deformation. The black lines represent the grain boundaries. The green lines show the twinned planes. The red lines show the fracture zones.

Figure 21.
Equivalent Von Mises deformation map of crystal 15 at different steps of sample deformation. The black lines represent the grain boundaries. The green lines show the twinned planes. The red lines show the fracture zones.
Figure 21.
Equivalent Von Mises deformation map of crystal 15 at different steps of sample deformation. The black lines represent the grain boundaries. The green lines show the twinned planes. The red lines show the fracture zones.

Figure 22.
Equivalent Von Mises deformation map of crystal 16 at different steps of sample deformation. The black lines represent the grain boundaries. The green lines show the twinned planes. The red lines show the fracture zones. The blue arrow is indicating the location of the twinned plane.
Figure 22.
Equivalent Von Mises deformation map of crystal 16 at different steps of sample deformation. The black lines represent the grain boundaries. The green lines show the twinned planes. The red lines show the fracture zones. The blue arrow is indicating the location of the twinned plane.

Figure 23.
Von Mises deformation map of crystal 17 at different steps of sample deformation. The black lines represent the grain boundaries. The green lines show the twinned planes. The red lines show the fracture zones.
Figure 23.
Von Mises deformation map of crystal 17 at different steps of sample deformation. The black lines represent the grain boundaries. The green lines show the twinned planes. The red lines show the fracture zones.

Figure 24.
Equivalent Von Mises deformation map of crystal 18 at different steps of sample deformation. The black lines represent the grain boundaries. The green lines show the twinned planes. The red lines show the fracture zones. The blue arrow is indicating the location of the twinned plane.
Figure 24.
Equivalent Von Mises deformation map of crystal 18 at different steps of sample deformation. The black lines represent the grain boundaries. The green lines show the twinned planes. The red lines show the fracture zones. The blue arrow is indicating the location of the twinned plane.

Figure 25.
Equivalent Von Mises deformation map of crystal 20 at different steps of sample deformation. The black lines represent the grain boundaries. The green lines show the twinned planes. The red lines show the fracture zones.
Figure 25.
Equivalent Von Mises deformation map of crystal 20 at different steps of sample deformation. The black lines represent the grain boundaries. The green lines show the twinned planes. The red lines show the fracture zones.

Figure 26.
Equivalent Von Mises deformation map of crystal 21 at different steps of sample deformation. The black lines represent the grain boundaries. The green lines show the twinned planes. The red lines show the fracture zones.
Figure 26.
Equivalent Von Mises deformation map of crystal 21 at different steps of sample deformation. The black lines represent the grain boundaries. The green lines show the twinned planes. The red lines show the fracture zones.

Figure 27.
Graph showing the relationship between the Schmid factor obtained after inversion of the twin data using CSIT2 and the range of global stresses at the time of twin appearance. The twinned planes with a negative Schmid factor have been removed. From the photographs taken throughout the experiment it is possible to determine a resolved shear stress for which the appearance of the twin plane can be seen. Thus, a twin appearing in a photo x appeared in the interval [x − 1; x]. In fact, the previous photo did not yet show a twin plane. Thus, the minimum value approximated in this graph corresponds to the resolved shear stress calculated for x − 1. The maximum value corresponds to that for step x.

Figure 28.
Summary of the current knowledge about the evolution of the CRSS value as a function of grain size and strain. The figure was modified from an initial drawing by Amrouch [41] on the basis of data by Rocher [44]. Constraints from the earlier and present studies are reported [12,26,29,30,36,44,45]. * Initial value from Lacombe and Laurent [29] re-evaluated by Rocher [44]. ** Outliers due to data issues.


Table 1.
In the first column is the numbering of the crystals that can be found in Figure 6. Columns E1, E2 and E3 represent the twin planes and their Schmid factors, which result from the inversion of the data. In green, the twinned planes compatible with the tensor and in red, the twinned planes incompatible with the tensor. The rest is the list of Schmid factors for the twin planes not activated in the experiment. The last column counts the number of families of activated twin planes.
| Schmid Factor (Tensor from the Inversion) | ||||
|---|---|---|---|---|
| Crystal | E1 | E2 | E3 | nb Activation |
| 1 | 0.454 | −0.249 | −0.062 | 1 |
| 2 | −0.35 | −0.099 | −0.089 | 1 |
| 4 | −0.45 | 0.119 | 0.283 | 2 |
| 5 | −0.044 | −0.047 | 0.466 | 1 |
| 6 | 0.469 | −0.275 | −0.079 | 1 |
| 8 | 0.181 | −0.171 | −0.316 | 1 |
| 9 | 0.467 | 0.181 | 0.125 | 3 |
| 11 | −0.191 | 0.127 | 0.047 | 0 |
| 12 | −0.299 | 0.204 | −0.118 | 2 |
| 13 | 0.026 | −0.124 | −0.175 | 1 |
| 15 | −0.399 | 0.158 | 0.146 | 1 |
| 16 | 0.17 | −0.032 | 0.266 | 1 |
| 17 | 0.447 | 0.193 | 0.203 | 2 |
| 18 | 0.287 | 0.068 | −0.179 | 1 |
| 21 | 0.109 | −0.243 | −0.283 | 2 |
| 22 | 0.238 | −0.106 | −0.232 | 1 |
| 23 | −0.16 | 0.119 | 0.058 | 1 |
| Total | 22 | |||
Publisher’s Note: MDPI stays neutral with regard to jurisdictional claims in published maps and institutional affiliations. |
© 2022 by the authors. Licensee MDPI, Basel, Switzerland. This article is an open access article distributed under the terms and conditions of the Creative Commons Attribution (CC BY) license (https://creativecommons.org/licenses/by/4.0/).
Share and Cite
MDPI and ACS Style
Parlangeau, C.; Dimanov, A.; Hallais, S. In-Situ Evolution of Calcite Twinning during Uniaxial Compression of Carrara Marble at Room Temperature. Geosciences 2022, 12, 233. https://0-doi-org.brum.beds.ac.uk/10.3390/geosciences12060233
AMA Style
Parlangeau C, Dimanov A, Hallais S. In-Situ Evolution of Calcite Twinning during Uniaxial Compression of Carrara Marble at Room Temperature. Geosciences. 2022; 12(6):233. https://0-doi-org.brum.beds.ac.uk/10.3390/geosciences12060233
Chicago/Turabian StyleParlangeau, Camille, Alexandre Dimanov, and Simon Hallais. 2022. "In-Situ Evolution of Calcite Twinning during Uniaxial Compression of Carrara Marble at Room Temperature" Geosciences 12, no. 6: 233. https://0-doi-org.brum.beds.ac.uk/10.3390/geosciences12060233
Note that from the first issue of 2016, this journal uses article numbers instead of page numbers. See further details here.