
Formation of the Lened W-(Be) Skarn Deposit by Neutralization of a Magmatic Fluid—Evidence from H3BO3-Rich Fluids

 , , , and
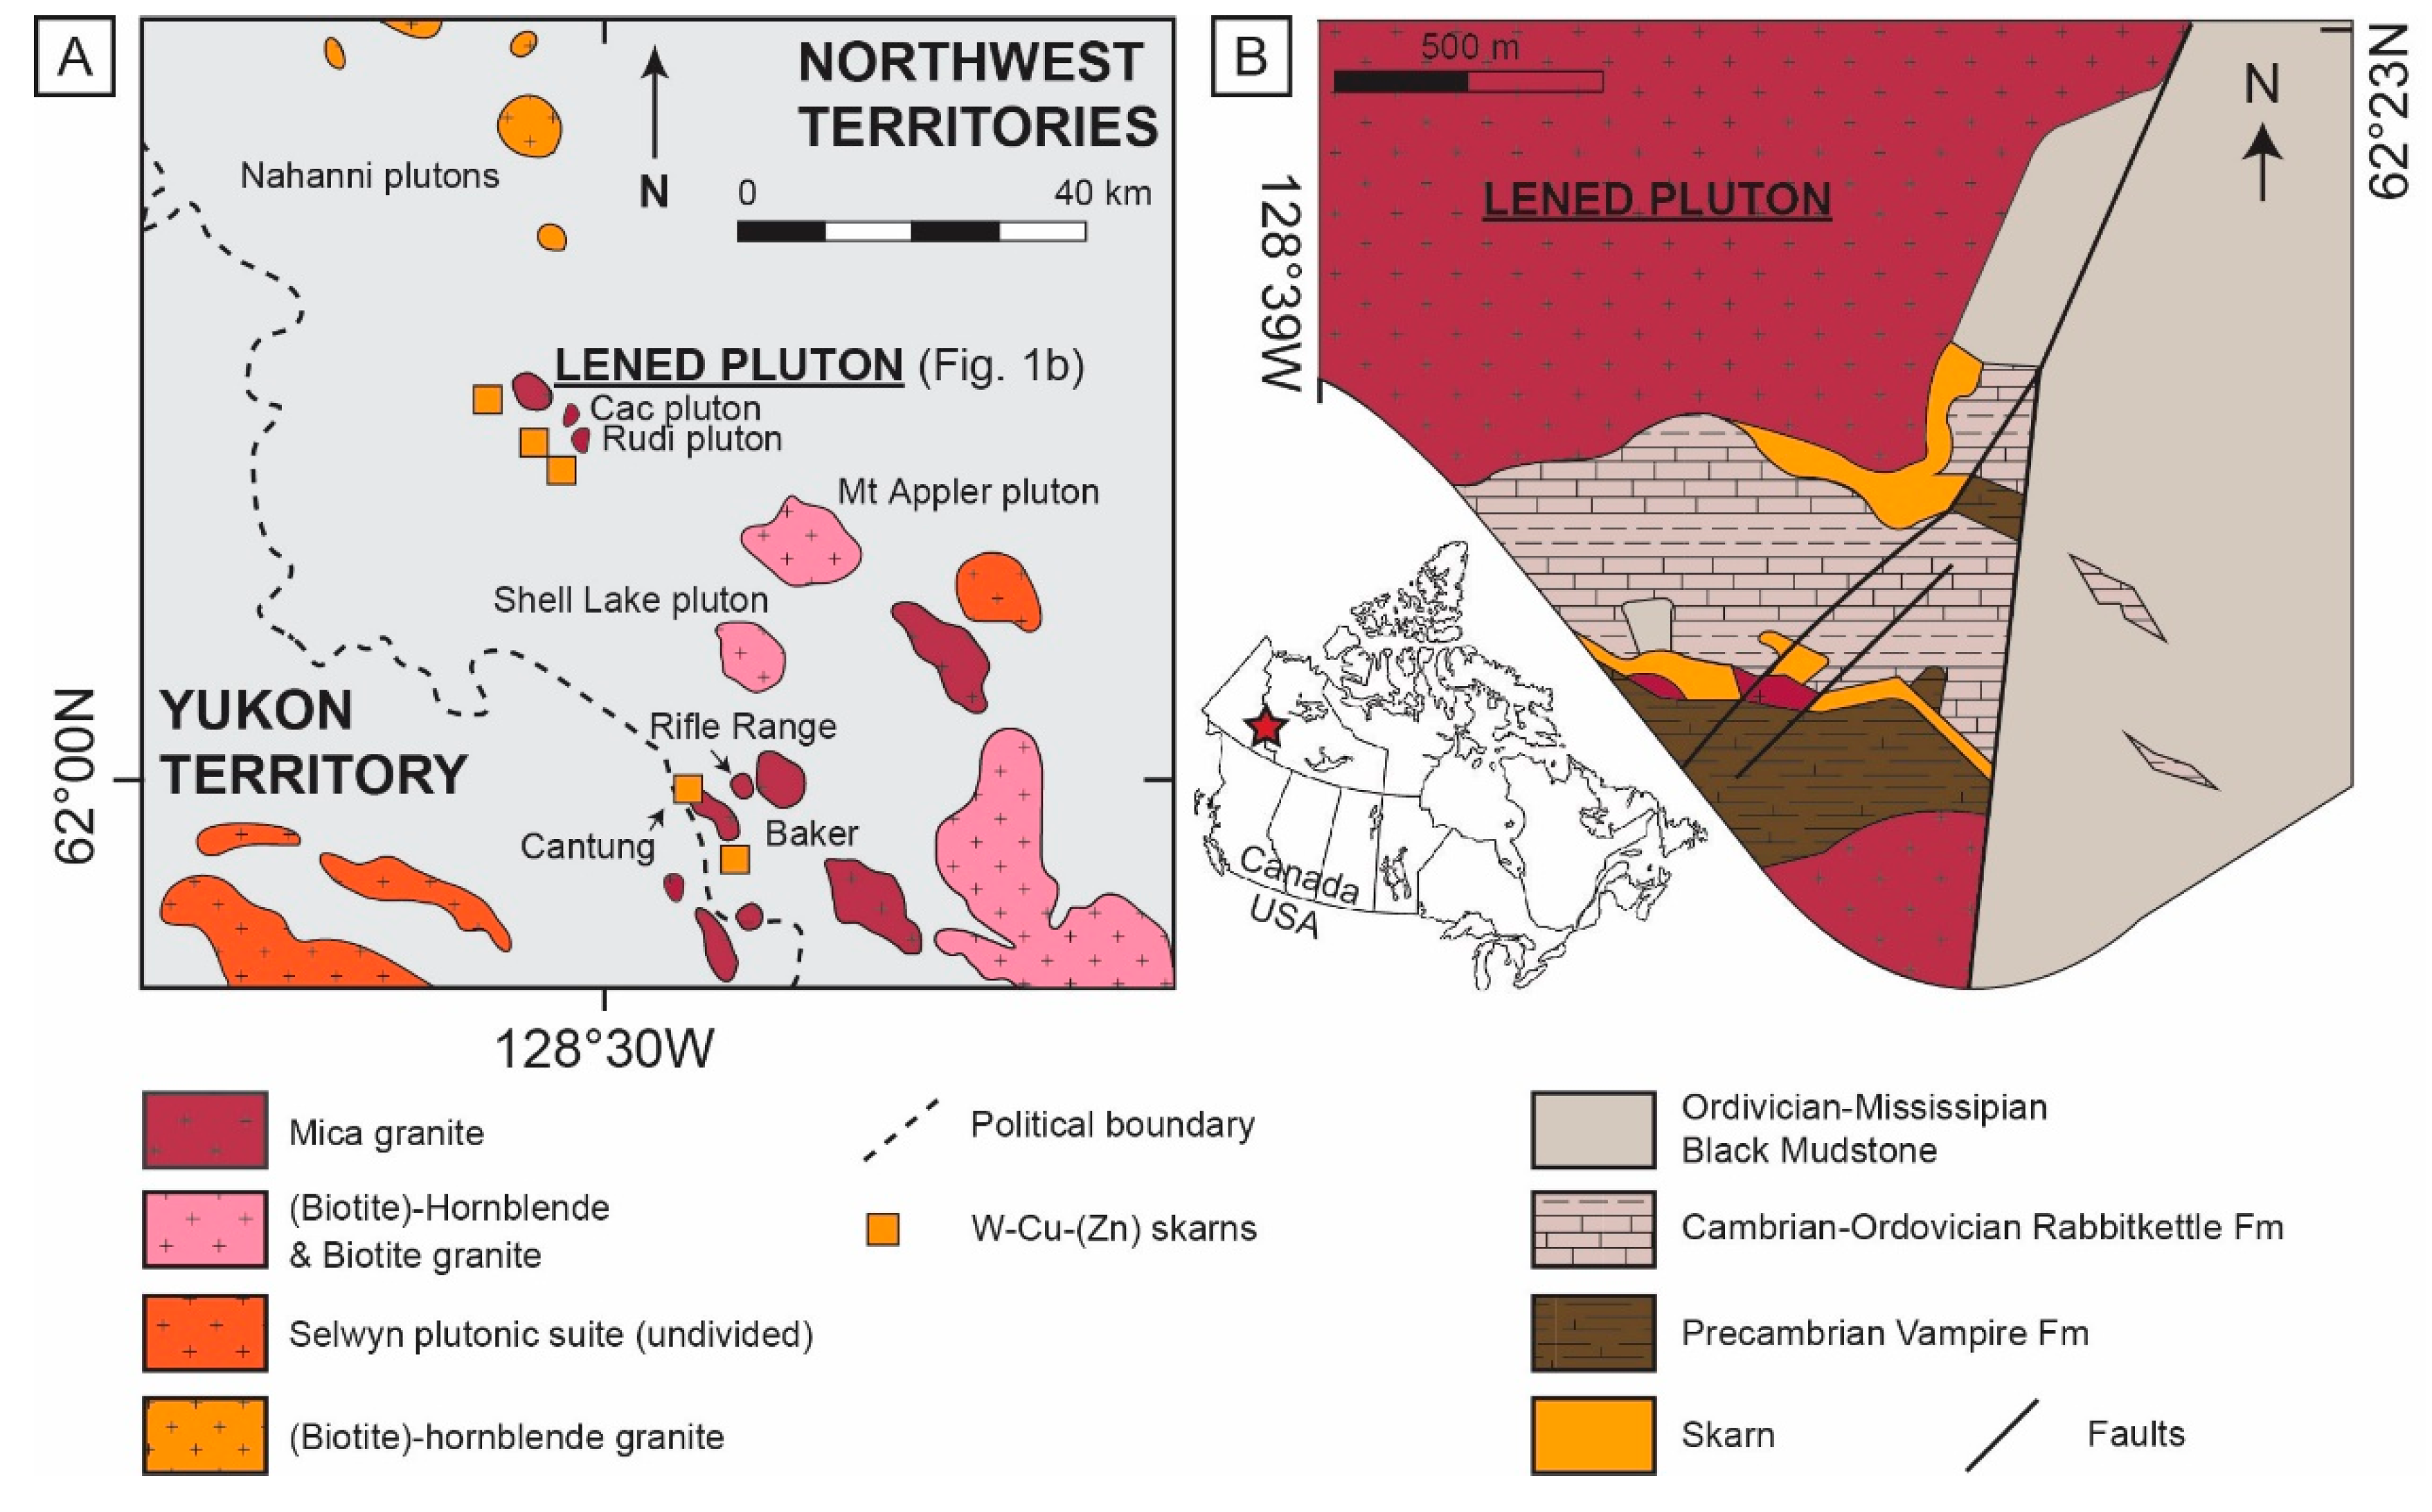
Abstract
:1. Introduction
2. Geological Setting of the Lened W-(Be) Deposit

3. Analytical Methods
3.1. Samples
3.2. Fluid Inclusion Petrographic and Microthermometric Investigations
3.3. Raman Spectroscopy
3.4. Laser Ablation Inductively Coupled Plasma Mass Spectrometry (LA-ICP-MS)
4. Results
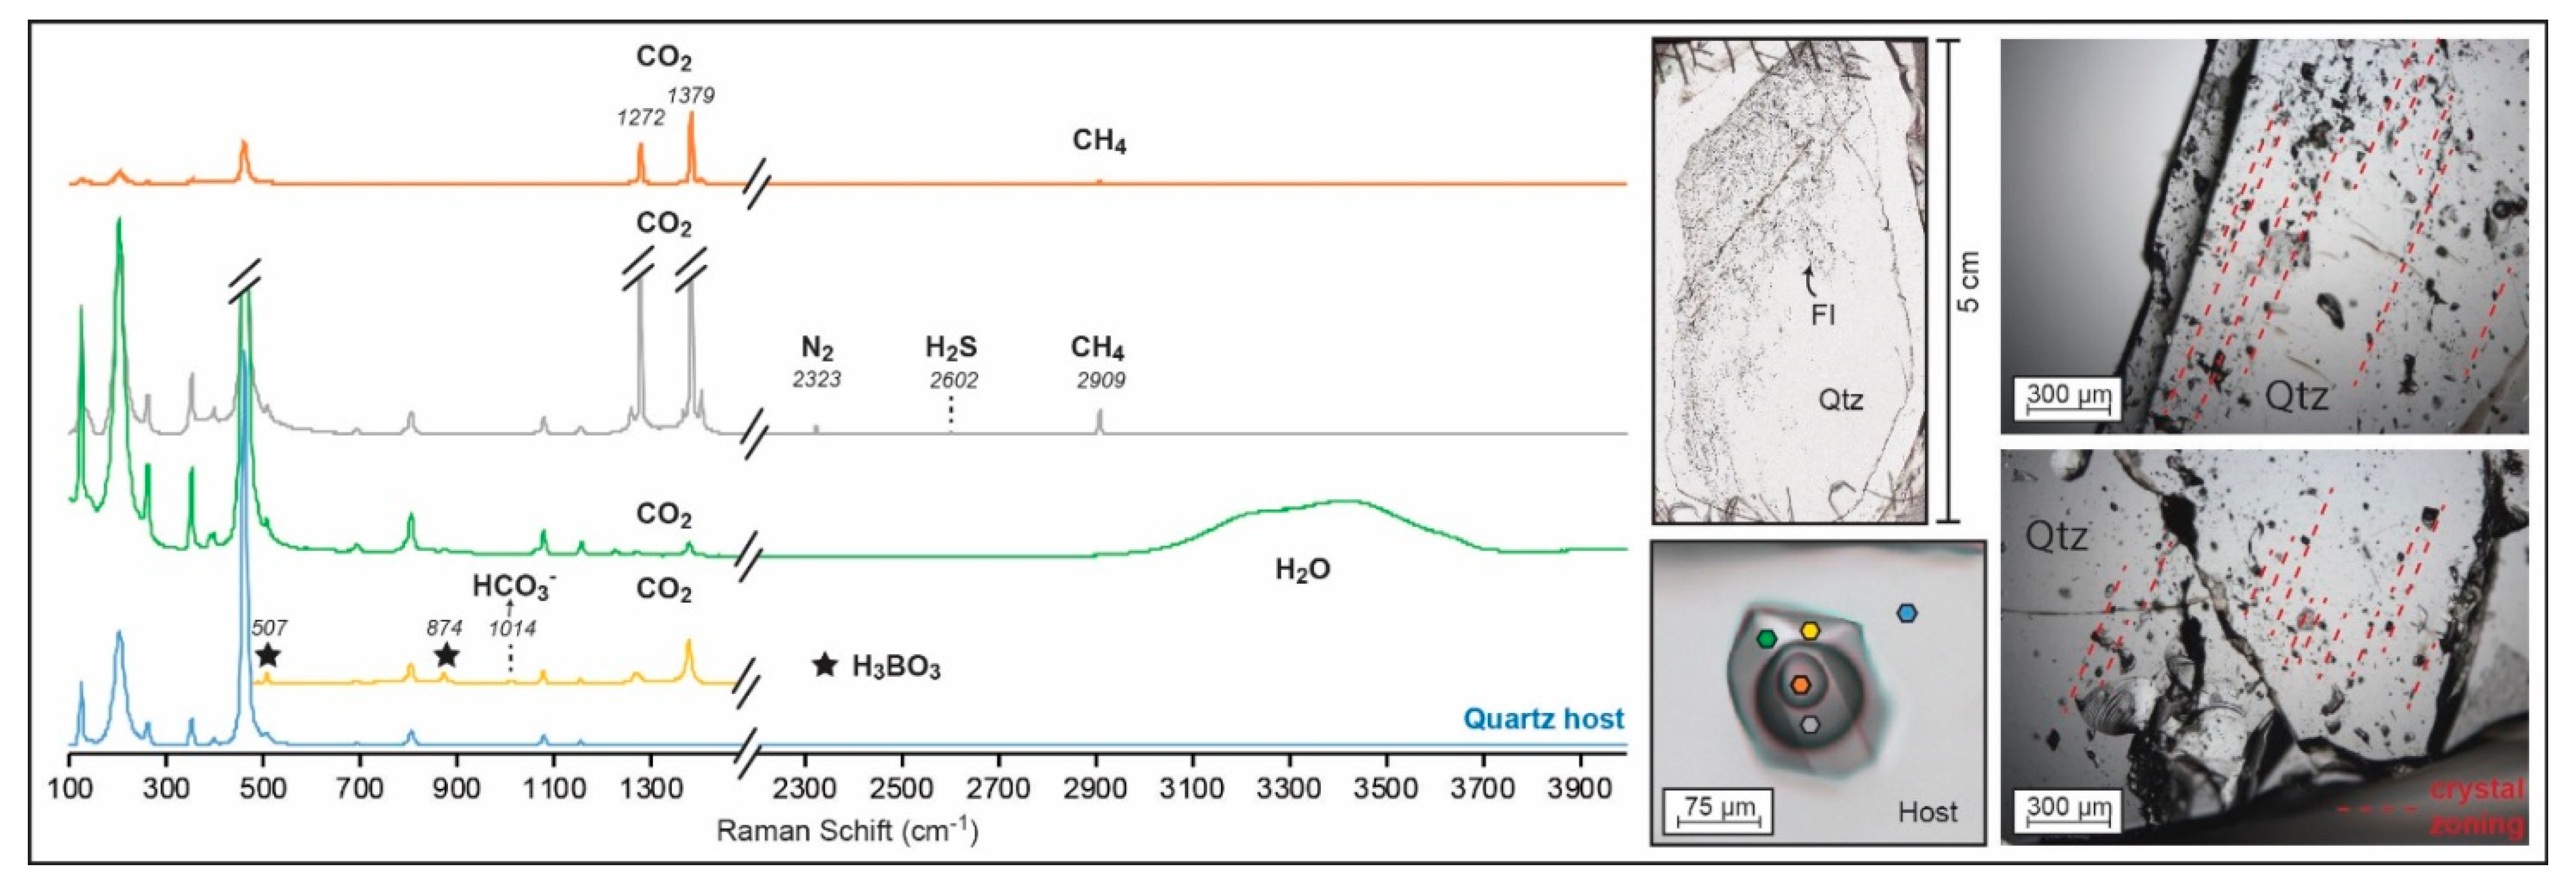
4.1. Fluid Inclusion Description and Raman Identification
4.2. Microthermometric Measurements and Boron Concentration Calculations
4.3. Trace Element Concentrations and Correlation
5. Discussion
5.1. Salinity Calculation in a Boron-Rich System
5.2. Magmatic Origin and Fluid-Rock Interaction
5.3. Fluid–Rock Interaction and Correlation to Fluid pH
6. Conclusions
Supplementary Materials
Author Contributions
Funding
Data Availability Statement
Acknowledgments
Conflicts of Interest
References
- Peretyazhko, I.S.; Prokof ev, V.Y.; Zagorskii, V.E.; Smirnov, S.Z. Role of Boric Acids in the Formation of Pegmatite and Hydrothermal Minerals: Petrologic Consequences of Sassolite (H~ 3BO~ 3) Discovery in Fluid Inclusions. Petrol. C/C Petrol. 2000, 8, 214–237. [Google Scholar]
- Sirbescu, M.-L.C.; Krukowski, E.G.; Schmidt, C.; Thomas, R.; Samson, I.M.; Bodnar, R.J. Analysis of Boron in Fluid Inclusions by Microthermometry, Laser Ablation ICP-MS, and Raman Spectroscopy: Application to the Cryo-Genie Pegmatite, San Diego County, California, USA. Chem. Geol. 2013, 342, 138–150. [Google Scholar] [CrossRef]
- Slack, J.F.; Trumbull, R.B. Tourmaline as a Recorder of Ore-Forming Processes. Elements 2011, 7, 321–326. [Google Scholar] [CrossRef]
- Hulsbosch, N.; Boiron, M.-C.C.; Dewaele, S.; Muchez, P. Fluid Fractionation of Tungsten during Granite–Pegmatite Differentiation and the Metal Source of Peribatholitic W Quartz Veins: Evidence from the Karagwe-Ankole Belt (Rwanda). Geochim. Cosmochim. Acta 2016, 175, 299–318. [Google Scholar] [CrossRef]
- Giuliani, G.; Groat, L.A.; Marshall, D.; Fallick, A.E.; Branquet, Y. Emerald Deposits: A Review and Enhanced Classification. Minerals 2019, 9, 105. [Google Scholar] [CrossRef] [Green Version]
- Meinert, L.D.; Dipple, G.M.; Nicolescu, S. World Skarn Deposits. In One Hundredth Anniversary Volume; Society of Economic Geologists: Littleton, CO, USA, 2005. [Google Scholar] [CrossRef]
- Kelly, W.C.; Rye, R.O. Geologic, Fluid Inclusion, and Stable Isotope Studies of the Tin-Tungsten Deposits of Panasqueira, Portugal. Econ. Geol. 1979, 74, 1721–1822. [Google Scholar] [CrossRef]
- Zhao, W.W.; Zhou, M.-F.; Li, Y.H.M.; Zhao, Z.; Gao, J.-F. Genetic Types, Mineralization Styles, and Geodynamic Settings of Mesozoic Tungsten Deposits in South China. J. Asian Earth Sci. 2017, 137, 109–140. [Google Scholar] [CrossRef]
- LeBoutillier, N.G.; Camm, G.S.; Shail, R.K.; Bromley, A.V.; Jewson, C.; Hoppe, N. Tourmaline-Quartz-Cassiterite Mineralization of the Land’s End Granite at Nanjizal, West Cornwall. Geosci. South-West Engl. 2002, 10, 312–318. [Google Scholar]
- Lecumberri-Sanchez, P.; Vieira, R.; Heinrich, C.A.; Pinto, F.; Wälle, M. Fluid-Rock Interaction Is Decisive for the Formation of Tungsten Deposits. Geology 2017, 45, 579–582. [Google Scholar] [CrossRef]
- Codeço, M.S.; Weis, P.; Trumbull, R.B.; Pinto, F.; Lecumberri-Sanchez, P.; Wilke, F.D.H. Chemical and Boron Isotopic Composition of Hydrothermal Tourmaline from the Panasqueira W-Sn-Cu Deposit, Portugal. Chem. Geol. 2017, 468, 1–16. [Google Scholar] [CrossRef]
- Neiva, A.M.R.; Silva, M.; Gomes, M.E.P. Crystal Chemistry of Tourmaline from Variscan Granites, Associated Tin-Tungsten-and Gold Deposits, and Associated Metamorphic and Metasomatic Rocks from Northern Portugal. Neues Jahrb. für Mineral. J. Mineral. Geochemistry 2007, 184, 45–76. [Google Scholar] [CrossRef]
- Codeço, M.S.; Weis, P.; Trumbull, R.B.; Van Hinsberg, V.; Pinto, F.; Lecumberri-Sanchez, P.; Schleicher, A.M. The Imprint of Hydrothermal Fluids on Trace-Element Contents in White Mica and Tourmaline from the Panasqueira W–Sn–Cu Deposit, Portugal. Miner. Depos. 2020, 56, 481–508. [Google Scholar] [CrossRef]
- Baksheev, I.A.; Trumbull, R.B.; Popov, M.P.; Erokhin, Y.V.; Kudryavtseva, O.E.; Yapaskurt, V.O.; Khiller, V.V.; Vovna, G.M.; Kiselev, V.I. Chemical and Boron Isotopic Composition of Tourmaline from the Mariinsky Emerald Deposit, Central Urals, Russia. Miner. Depos. 2018, 53, 565–583. [Google Scholar] [CrossRef]
- Arif, M.; Henry, D.J.; Moon, C.J. Cr-Bearing Tourmaline Associated with Emerald Deposits from Swat, NW Pakistan: Genesis and Its Exploration Significance. Am. Mineral. 2010, 95, 799–809. [Google Scholar] [CrossRef]
- Harlaux, M.; Kouzmanov, K.; Gialli, S.; Laurent, O.; Rielli, A.; Dini, A.; Chauvet, A.; Menzies, A.; Kalinaj, M.; Fontboté, L. Tourmaline as a Tracer of Late-Magmatic to Hydrothermal Fluid Evolution: The World-Class San Rafael Tin (-Copper) Deposit, Peru. Econ. Geol. 2020, 115, 1665–1697. [Google Scholar] [CrossRef]
- Korges, M.; Weis, P.; Lüders, V.; Laurent, O. Depressurization and Boiling of a Single Magmatic Fluid as a Mechanism for Tin-Tungsten Deposit Formation. Geology 2018, 46, 75–78. [Google Scholar] [CrossRef]
- Pan, J.-Y.; Ni, P.; Wang, R.-C. Comparison of Fluid Processes in Coexisting Wolframite and Quartz from a Giant Vein-Type Tungsten Deposit, South China: Insights from Detailed Petrography and LA-ICP-MS Analysis of Fluid Inclusions. Am. Mineral. J. Earth Planet. Mater. 2019, 104, 1092–1116. [Google Scholar] [CrossRef]
- Peretyazhko, I.S.; Zagorsky, V.Y.; Smirnov, S.Z.; Mikhailov, M.Y.; Ye, V.; Smirnov, S.Z.; Mikhailov, M.Y. Conditions of Pocket Formation in the Oktyabrskaya Tourmaline-Rich Gem Pegmatite (the Malkhan Field, Central Transbaikalia, Russia). Chem. Geol. 2004, 210, 91–111. [Google Scholar] [CrossRef]
- London, D. Internal Differentiation of Rare-Element Pegmatites: Effects of Boron, Phosphorus, and Fluorine. Geochim. Cosmochim. Acta 1987, 51, 403–420. [Google Scholar] [CrossRef]
- Pollard, P.J.; Pichavant, M.; Charoy, B. Contrasting Evolution of Fluorine- and Boron-Rich Tin Systems. Miner. Depos. 1987, 22, 315–321. [Google Scholar] [CrossRef]
- Pichavant, M.; Manning, D. Petrogenesis of Tourmaline Granites and Topaz Granites; the Contribution of Experimental Data. Phys. Earth Planet. Inter. 1984, 35, 31–50. [Google Scholar] [CrossRef]
- Peretyazhko, I.S. Genesis of Mineralized Cavities (Miaroles) in Granitic Pegmatites and Granites. Petrology 2010, 18, 183–208. [Google Scholar] [CrossRef]
- Legros, H.; Lecumberri-Sanchez, P.; Elongo, V.; Laurent, O.; Falck, H.; Adlakha, E.; Chelle-Michou, C. Fluid Evolution of the Cantung Tungsten Skarn, Northwest Territories, Canada: Differentiation and Fluid-Rock Interaction. Ore Geol. Rev. 2020, 127C, 103866. [Google Scholar] [CrossRef]
- Michallik, R.M.; Wagner, T.; Fusswinkel, T. Late-Stage Fluid Exsolution and Fluid Phase Separation Processes in Granitic Pegmatites: Insights from Fluid Inclusion Studies of the Luumäki Gem Beryl Pegmatite (SE Finland). Lithos 2021, 380, 105852. [Google Scholar] [CrossRef]
- Lake, D.J.; Groat, L.A.; Falck, H.; Mulja, T.; Cempírek, J.; Kontak, D.; Marshall, D.; Giuliani, G.; Fayek, M. Genesis of Emerald-Bearing Quartz Veins Associated with the Lened Wskarn Mineralization, Northwest Territories, Canada. Can. Mineral. 2017, 55, 561–593. [Google Scholar] [CrossRef]
- Wilson, B.S. Colored Gemstones from Canada. Rocks Miner. 2009, 85, 24–43. [Google Scholar] [CrossRef]
- Elongo, V.; Lecumberri-Sanchez, P.; Legros, H.; Falck, H.; Adlakha, E.; Roy-Garand, A. Paragenetic Constraints on the Cantung, Mactung and Lened Tungsten Skarn Deposits, Canada: Implications for Grade Distribution. Ore Geol. Rev. 2020, 125, 103677. [Google Scholar] [CrossRef]
- Glover, J.K. Geology of the Lened Tungsten Skarn Deposit, Logan Mountains, Northwest Territories. Miner. Depos. North. Cordillera. Canad. Inst. Min. Met. 1986, 37, 255–265. [Google Scholar]
- Rasmussen, K. The Timing, Composition, and Petrogenesis of Syn- to Post- Accretionary Magmatism in the Northern Cordilleran Miogeocline, Eastern Yukon and Southwestern Northwest Territories. Ph.D. Thesis, University of British Columbia, Vancouver, BC, Canada, 2013. [Google Scholar]
- Government of Northwest Territories. A Guide to Mineral Deposits in the Northwest Territories. 2016. Available online: https://www.iti.gov.nt.ca/sites/iti/files/mineraldeposites2-nocrops.pdf (accessed on 31 March 2022).
- Marshall, D.D.; Groat, L.A.; Falck, H.; Giuliani, G.; Neufeld, H. The Lened Emerald Prospect, Northwest Territories, Canada: Insights from Fluid Inclusions and Stable Isotopes, with Implications for Northern Cordilleran Emerald. Can. Mineral. 2004, 42, 1523–1539. [Google Scholar] [CrossRef]
- Gordey, S.P.; Anderson, R.G. Evolution of the Northern Cordilleran Miogeocline, Nahanni Map Area (105I), Yukon and Northwestern Territories; Minister of Supply and Services Canada: Ottawa, ON, Canada, 1993; Volume Memoir 428, ISBN 066014963X. [Google Scholar]
- Marshall, D.; Falck, H.; Mann, B.; Kirkham, G.; Mortensen, J. Geothermometry and Fluid Inclusion Studies of the E-Zone Biotite Skarn. Cantung Mine Tungsten NWT 2003, 60. [Google Scholar]
- Rasmussen, K.L.; Mortensen, J.K. Magmatic Petrogenesis and the Evolution of (F: Cl: OH) Fluid Composition in Barren and Tungsten Skarn-Associated Plutons Using Apatite and Biotite Compositions: Case Studies from the Northern Canadian Cordillera. Ore Geol. Rev. 2013, 50, 118–142. [Google Scholar] [CrossRef]
- Lambrecht, G.; Diamond, L.W. Morphological Ripening of Fluid Inclusions and Coupled Zone-Refining in Quartz Crystals Revealed by Cathodoluminescence Imaging: Implications for CL-Petrography, Fluid Inclusion Analysis and Trace-Element Geothermometry. Geochim. Cosmochim. Acta 2014, 141, 381–406. [Google Scholar] [CrossRef]
- Bakker, R. Re-Equilibration Processes in Fluid Inclusion Assemblages. Minerals 2017, 7, 117. [Google Scholar] [CrossRef] [Green Version]
- Schrötter, H.W.; Klöckner, H.W. Raman Scattering Cross Sections in Gases and Liquids. In Raman Spectroscopy of Gases and Liquids; Springer: Berlin/Heidelberg, Germany, 1979; pp. 123–166. [Google Scholar]
- Burke, E.A.J. Raman Microspectrometry of Fluid Inclusions. Lithos 2001, 55, 139–158. [Google Scholar] [CrossRef]
- Laetsch, T.; Downs, R.T. Software for identification and refinement of cell parameters from powder diffraction data of minerals using the RRUFF Project and American Mineralogist Crystal Structure Databases. In Proceedings of the 19th General Meeting of the International Mineralogical Association, Kobe, Japan, 23–28 July 2006; Volume 23, p. e28. [Google Scholar]
- Laurent, O.; Guillong, M.; Heinrich, C.A.; Neubauer, K.; Stephan, C. Advantages of a Fast-Scanning Quadrupole for LA-ICP-MS Analysis of Fluid Inclusions. J. Anal. At. Spectrom. 2021, 36, 2043–2050. [Google Scholar] [CrossRef]
- Schlöglova, K.; Wälle, M.; Heinrich, C.A. LA-ICP-MS Analysis of Fluid Inclusions: Contamination Effects Challenging Micro-Analysis of Elements Close to Their Detection Limit. J. Anal. At. Spectrom. 2017, 32, 1052–1063. [Google Scholar] [CrossRef] [Green Version]
- Jochum, K.P.; Weis, U.; Stoll, B.; Kuzmin, D.; Yang, Q.; Raczek, I.; Jacob, D.E.; Stracke, A.; Birbaum, K.; Frick, D.A. Determination of Reference Values for NIST SRM 610–617 Glasses Following ISO Guidelines. Geostand. Geoanalytical Res. 2011, 35, 397–429. [Google Scholar] [CrossRef]
- Seo, J.H.; Guillong, M.; Aerts, M.; Zajacz, Z.; Heinrich, C.A. Microanalysis of S, Cl, and Br in Fluid Inclusions by LA–ICP-MS. Chem. Geol. 2011, 284, 35–44. [Google Scholar] [CrossRef] [Green Version]
- Gagnon, J.E.; Samson, I.M.; Fryer, B.J.; Samson, I.M.; Anderson, A.J.; Marshall, D. LA-ICP-MS Analysis of Fluid Inclusions. Fluid Inclusions: Analysis and Interpretation. Mineral. Assoc. Can. Short Course 2003, 32, 291–318. [Google Scholar]
- Guillong, M.; Meier, D.L.; Allan, M.M.; Heinrich, C.A.; Yardley, B.W.D. Appendix A6: SILLS: A MATLAB-Based Program for the Reduction of Laser Ablation ICP-MS Data of Homogeneous Materials and Inclusions. Mineral. Assoc. Can. Short Course 2008, 40, 328–333. [Google Scholar]
- Pettke, T.; Oberli, F.; Audétat, A.; Guillong, M.; Simon, A.C.; Hanley, J.J.; Klemm, L.M. Recent Developments in Element Concentration and Isotope Ratio Analysis of Individual Fluid Inclusions by Laser Ablation Single and Multiple Collector ICP-MS. Ore Geol. Rev. 2012, 44, 10–38. [Google Scholar] [CrossRef] [Green Version]
- Frezzotti, M.L.; Tecce, F.; Casagli, A. Raman Spectroscopy for Fluid Inclusion Analysis. J. Geochem. Explor. 2012, 112, 1–20. [Google Scholar] [CrossRef]
- Caumon, M.-C.; Dubessy, J.; Robert, P.; Tarantola, A. Fused-Silica Capillary Capsules (FSCCs) as Reference Synthetic Aqueous Fluid Inclusions to Determine Chlorinity by Raman Spectroscopy. Eur. J. Mineral. 2013, 25, 755–763. [Google Scholar] [CrossRef]
- Steele-MacInnis, M.; Lecumberri-Sanchez, P.; Bodnar, R.J. HokieFlincs_H2O-NaCl: A Microsoft Excel Spreadsheet for Interpreting Microthermometric Data from Fluid Inclusions Based on the PVTX Properties of H 2O-NaCl. Comput. Geosci. 2012, 49, 334–337. [Google Scholar] [CrossRef]
- Steele-MacInnis, M. Fluid Inclusions in the System H2O-NaCl-CO2: An Algorithm to Determine Composition, Density and Isochore. Chem. Geol. 2018, 498, 31–44. [Google Scholar] [CrossRef]
- Thomas, R. Determination of the H3BO3 Concentration in Fluid and Melt Inclusions in Granite Pegmatites by Laser Raman Microprobe Spectroscopy. Am. Mineral. 2002, 87, 56–68. [Google Scholar] [CrossRef]
- Qiu, Y.; Zhang, R.; Chou, I.-M.; Wang, X.; Hu, W.; Zhang, W.; Lu, J.; Li, G.; Li, Z. Boron-Rich Ore-Forming Fluids in Hydrothermal W-Sn Deposits from South China: Insights from in Situ Raman Spectroscopic Characterization of Fluid Inclusions. Ore Geol. Rev. 2021, 104048. [Google Scholar] [CrossRef]
- Allan, M.M.; Yardley, B.W.D.; Forbes, L.J.; Shmulovich, K.I.; Banks, D.A.; Shepherd, T.J. Validation of LA-ICP-MS Fluid Inclusion Analysis with Synthetic Fluid Inclusions. Am. Mineral. 2005, 90, 1767–1775. [Google Scholar] [CrossRef]
- Large, S.J.E.; Bakker, E.Y.N.; Weis, P.; Wälle, M.; Ressel, M.; Heinrich, C.A. Trace Elements in Fluid Inclusions of Sediment-Hosted Gold Deposits Indicate a Magmatic-Hydrothermal Origin of the Carlin Ore Trend. Geology 2016, 44, 1015–1018. [Google Scholar] [CrossRef] [Green Version]
- Heinrich, C.A. The Chemistry of Hydrothermal Tin (-Tungsten) Ore Deposition. Econ. Geol. 1990, 85, 457–481. [Google Scholar] [CrossRef]
- Audétat, A. The Metal Content of Magmatic-Hydrothermal Fluids and Its Relationship to Mineralization Potential. Econ. Geol. 2019, 114, 1033–1056. [Google Scholar] [CrossRef]
- Legros, H.; Richard, A.; Tarantola, A.; Kouzmanov, K.; Mercadier, J.; Vennemann, T.; Marignac, C.; Cuney, M.; Wang, R.C.; Charles, N.; et al. Multiple Fluids Involved in Granite-Related W-Sn Deposits from the World-Class Jiangxi Province (China). Chem. Geol. 2019, 508, 92–115. [Google Scholar] [CrossRef]
- Lecumberri-Sanchez, P.; Bodnar, R.J. Halogen Geochemistry of Ore Deposits: Contributions Towards Understanding Sources and Processes. In The Role of Halogens in Terrestrial and Extraterrestrial Geochemical Processes; Springer: Cham, Switzerland, 2018; pp. 261–305. [Google Scholar] [CrossRef]
- Sciuba, M.; Beaudoin, G.; Grzela, D.; Makvandi, S. Trace Element Composition of Scheelite in Orogenic Gold Deposits. Miner. Depos. 2020, 55, 1149–1172. [Google Scholar] [CrossRef]
- Heinrich, C.A.; Gunther, D.; Audétat, A.; Ulrich, T.; Frischknecht, R. Metal Fractionation between Magmatic Brine and Vapor, Determined by Microanalysis of Fluid Inclusions. Geology 1999, 27, 755–758. [Google Scholar] [CrossRef]
- Landtwing, M.R.; Furrer, C.; Redmond, P.B.; Pettke, T.; Guillong, M.; Heinrich, C.A. The Bingham Canyon Porphyry Cu-Mo-Au Deposit. III. Zoned Copper-Gold Ore Deposition by Magmatic Vapor Expansion. Econ. Geol. 2010, 105, 91–118. [Google Scholar] [CrossRef]
- Fiedrich, A.; Laurent, O.; Heinrich, C.A.; Bachmann, O. Melt and Fluid Evolution in an Upper-Crustal Magma Reservoir, Preserved by Inclusions in Juvenile Clasts from the Kos Plateau Tuff, Aegean Arc, Greece. Geochim. Cosmochim. Acta 2020, 280, 237–262. [Google Scholar] [CrossRef]
- Long, Z.; Yu, X.; Zheng, Y. Ore Formation of the Dayakou Emerald Deposit (Southwest China) Constrained by Chemical and Boron Isotopic Composition of Tourmaline. Ore Geol. Rev. 2021, 135, 104208. [Google Scholar] [CrossRef]
- Rasbury, E.T.; Hemming, N.G. Boron Isotopes: A “Paleo-PH Meter” for Tracking Ancient Atmospheric CO2. Elements 2017, 13, 243–248. [Google Scholar] [CrossRef]
- Wang, X.-S.; Timofeev, A.; Williams-Jones, A.E.; Shang, L.-B.; Bi, X.-W. An Experimental Study of the Solubility and Speciation of Tungsten in NaCl-Bearing Aqueous Solutions at 250, 300, and 350 °C. Geochim. Cosmochim. Acta 2019, 265, 313–329. [Google Scholar] [CrossRef]
- Wood, S.A.; Samson, I.M. The Hydrothermal Geochemistry of Tungsten in Granitoid Environments: I. Relative Solubilities of Ferberite and Scheelite as a Function of T, P, PH, and m NaCl. Econ. Geol. 2000, 95, 143–182. [Google Scholar] [CrossRef] [Green Version]
- Wang, X.; Qiu, Y.; Chou, I.; Zhang, R.; Li, G.; Zhong, R. Effects of PH and Salinity on the Hydrothermal Transport of Tungsten: Insights from In Situ Raman Spectroscopic Characterization of K2WO4-NaCl-HCl-CO2 Solutions at Temperatures up to 400 °C. Geofluids 2020, 2020, 2978984. [Google Scholar] [CrossRef] [Green Version]
- Wang, X.; Qiu, Y.; Lu, J.; Chou, I.-M.; Zhang, W.; Li, G.; Hu, W.; Li, Z.; Zhong, R. In Situ Raman Spectroscopic Investigation of the Hydrothermal Speciation of Tungsten: Implications for the Ore-Forming Process. Chem. Geol. 2020, 532, 119299. [Google Scholar] [CrossRef]
- Wood, S.A. Experimental Determination of the Solubility of WO3 (s) and the Thermodynamic Properties of H2WO4 (Aq) in the Range 300–600 C at 1 Kbar: Calculation of Scheelite Solubility. Geochim. Cosmochim. Acta 1992, 56, 1827–1836. [Google Scholar] [CrossRef]


Publisher’s Note: MDPI stays neutral with regard to jurisdictional claims in published maps and institutional affiliations. |
© 2022 by the authors. Licensee MDPI, Basel, Switzerland. This article is an open access article distributed under the terms and conditions of the Creative Commons Attribution (CC BY) license (https://creativecommons.org/licenses/by/4.0/).
Share and Cite
Legros, H.; Elongo, V.; Laurent, O.; Adlakha, E.; Chelle-Michou, C.; Falck, H.; Lecumberri-Sanchez, P. Formation of the Lened W-(Be) Skarn Deposit by Neutralization of a Magmatic Fluid—Evidence from H3BO3-Rich Fluids. Geosciences 2022, 12, 236. https://0-doi-org.brum.beds.ac.uk/10.3390/geosciences12060236
Legros H, Elongo V, Laurent O, Adlakha E, Chelle-Michou C, Falck H, Lecumberri-Sanchez P. Formation of the Lened W-(Be) Skarn Deposit by Neutralization of a Magmatic Fluid—Evidence from H3BO3-Rich Fluids. Geosciences. 2022; 12(6):236. https://0-doi-org.brum.beds.ac.uk/10.3390/geosciences12060236
Chicago/Turabian StyleLegros, Hélène, Vanessa Elongo, Oscar Laurent, Erin Adlakha, Cyril Chelle-Michou, Hendrik Falck, and Pilar Lecumberri-Sanchez. 2022. "Formation of the Lened W-(Be) Skarn Deposit by Neutralization of a Magmatic Fluid—Evidence from H3BO3-Rich Fluids" Geosciences 12, no. 6: 236. https://0-doi-org.brum.beds.ac.uk/10.3390/geosciences12060236