
New Data of the 1755 Earthquake and Tsunami in Lisbon, Portugal


1
Centre for Geographical Studies and Associated Laboratory TERRA, Institute of Geography and Spatial Planning, University of Lisbon, Rua Branca Edmée Marques, 1600-276 Lisboa, Portugal
2
Câmara Municipal de Lisboa, Gabinete de Estudos Olisiponenses, Estrada de Benfica, Palácio Beau, Séjour, 368, 1500-100 Lisboa, Portugal
3
Centro de Investigação Transdisciplinar “Cultura, Espaço e Memória”, Faculdade de Letras da Universidade do Porto, Via Panorâmica s/n, 4150-564 Porto, Portugal
*
Author to whom correspondence should be addressed.
Geosciences 2022, 12(8), 286; https://0-doi-org.brum.beds.ac.uk/10.3390/geosciences12080286
Submission received: 13 June 2022
/
Revised: 19 July 2022
/
Accepted: 20 July 2022
/
Published: 24 July 2022
(This article belongs to the Special Issue Interdisciplinary Geosciences Perspectives of Tsunami Volume 4)
Abstract
:In spite of the significant number of studies focused on the 1755 earthquake and tsunami, there are still many unknowns regarding this event in Lisbon, Portugal. Thus, in this research the authors compiled historical documents, including some that had never been analyzed, complemented with a field survey and tsunami numerical modeling at the historical civil parish of Santo Estevão, Lisbon. It was possible to identify 13 buildings, including three religious buildings and five palaces. Furthermore, the new data showed that contradicting the general idea, the earthquake caused significant damage to the selected territory because the number of households decreased by 52%. The number of residents decreased to about 51%, and in 1756, 1041 residents were still living in 297 temporary shelters. There were more than 44 dead and 1122 residents were unaccounted for. The fire did not hit the area, and the tsunami numerical model results were validated by the historical accounts and cartography, which indicate that the coastal area of the studied area was not significantly inundated by the tsunami. The consultation of historical documents that had never been analyzed by contemporary researchers provides a breakthrough in the knowledge of the event since it allowed a very detailed analysis of the disaster impact.
1. Introduction
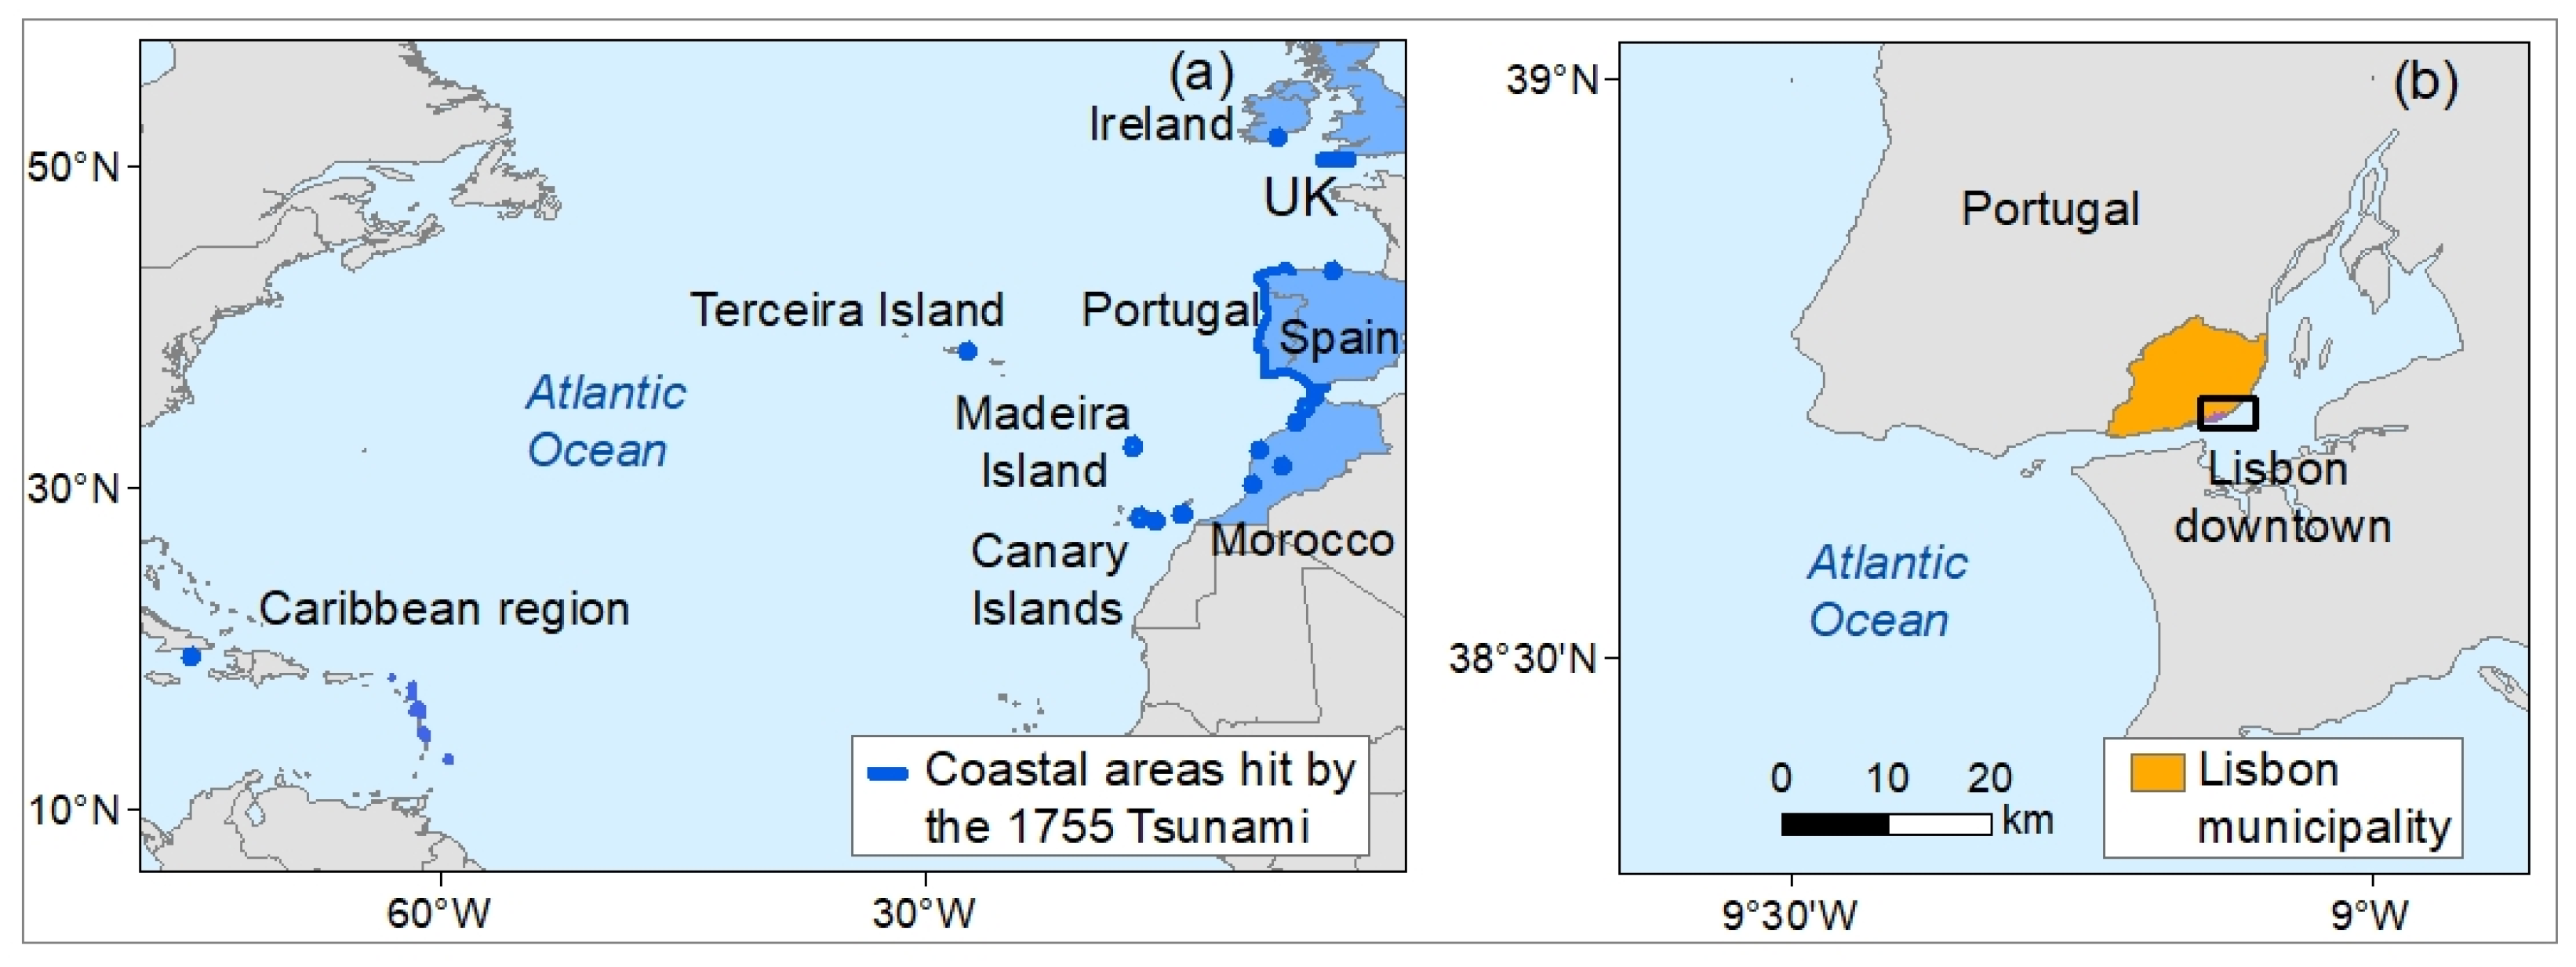
The 1755 Lisbon earthquake and tsunami are recognized as one of the worst natural disasters that have occurred, and for that reason have raised interest among many researchers. Since the tsunami hit the coastlines of several countries of the Atlantic Ocean, such as Portugal, Spain, Morocco, the United Kingdom, Ireland, and as far as the Caribbean region (Figure 1a), the study areas related to this historical event have been quite dispersed, from local to national regions. In addition, the studied topics focused on one or more scientific areas such as historical analysis and interpretation [1,2,3,4,5,6,7,8,9,10]; sediments and turbidity records [11,12,13,14,15]; seismotectonics offshore to Portugal [16,17,18,19,20,21,22,23,24,25,26]; seismic intensity analysis and modeling and seismic moment assessment [27,28,29,30]; tsunami numerical modeling [31,32,33,34,35,36], including tsunami evacuation planning [37]; and archeology and architecture [38,39,40,41]. In addition, books have been published on anniversary dates [42,43].
In spite of all the above publications, and the significant contributions that these authors have provided, many uncertainties about this historical event still remain, specifically in the city of Lisbon, Portugal. There are buildings that stand out from the urban fabric due to the type of construction, dimensions, and social and religious prestige, namely religious buildings, palaces, and government structures were subjected to a basic damage assessment in the first historical analysis of the impact of the 1755 disaster [1]. Then, a damage classification was used to assess the overall impact of the disaster in the historical civil parishes of Lisbon as “burned”, “ruined”, and “well preserved”. Later, another author [3] followed this criterion in the compilation and interpretation of the historical accounts in Lisbon, providing further dissemination of the data and knowledge of the disaster (as well as pointing out discrepancies and unknowns). A more recent study [44] focused on downtown Lisbon (Figure 1b and Figure 2), which corresponds to six historical coastal civil parishes (Figure 2). One of the main difficulties was the identification of the correct administrative limits of the civil parishes, since there have been changes over time. Still, Figure 2 presents the administrative limits of the civil parishes in 1770 [45]. These frequent modifications make the interpretation of the historical accounts even more difficult. In addition, the authors [44] proposed a more suitable classification: “total collapse”, “partial collapse”, “no or minor damage”, and “no information”, and separated the damage due to earthquake, fire, and tsunami, as presented on Figure 2. This research allowed a clearer interpretation of what happened in downtown Lisbon on the morning of 1 November 1755, with the chain of events between the earthquake, fire, and tsunami that has not been properly addressed until that time. In addition, in order to allow easy access to the data to the general public, a website was created [46] on which a WebGIS and the animation of the tsunami numerical model results are available.
The authors [44] identified 32 main buildings, among them 13 religious buildings (Figure 2). Although the population data compiled previously [1,3,44] have some discrepancies, it was summarized that before the earthquake, the downtown area of Lisbon had 24,030–28,371 residents, and after the disaster had 5983–8783. Regarding the habitations, there are also discrepancies. The data indicate “households” instead of buildings. It was common in historic demography to indicate the habitation unit where a family would live. One building could have many households, and at the present day these could be referred to as “apartments” or “units”. Thus, the data show that before the earthquake, there were 5226–5666 households in the six historical civil parishes, and after the earthquake, they were reduced to only 10, which does not represent the reality, and the research for missing records should continue. The data also indicate that the number of dead varies between 920 and 1343.
The research [44] also provided a very important step to understanding the impact of the 1755 disaster on Lisbon downtown. Still, the remaining territory of Lisbon municipality has not been studied yet, to the authors’ knowledge. At the present, the territory of the historical civil parish of Santo Estevão covers part of the Alfama neighborhood, which is indeed characterized by an Islamic-medieval matrix, clearly evident by the confused and disorganized urban fabric with a significant density of many small streets and alleys. Most buildings have two or three floors, with architecture typical of the construction pre-earthquake [47]. Thus, these clues indicate that apparently the historical civil parish of Santo Estevão suffered no damage, or at most only minor damage, due to the 1755 earthquake, fire, and tsunami. Nevertheless, this territory has never been studied, with the loss assessment of the main and residential buildings, service, and commercial areas being completely unknown. For these reasons, the objective of this study is to compile the original documents reporting the disaster, including documents that have never been analyzed before, to the authors’ knowledge. This will be complemented with a field survey and the tsunami numerical model. The goal is to identify the impact of the 1755 earthquake, fire, and tsunami on the main buildings, streets (including residential buildings), and residential population. With this research, the authors’ intent is to contribute to the knowledge of this historical event and create awareness for future disasters on the territory.
2. Materials and Methods
2.1. Compilation of Written Documents
The historical documents reporting the 1755 disaster that were analyzed in this study are the List of the Confessed [48], Parochial Memories [49], and the Books of the Registered Dead of Santa Engrácia [50] and Santo Estevão [51] civil parishes. These documents are first-hand accounts written in Portuguese by the priests who witnessed the disaster. Another first-hand account is a report written in Portuguese by Mendonça [52]. Although [52] is quite known by the scientific community, the other four documents have never been studied before, to the authors’ knowledge. Furthermore, the cross information between the historical civil parish of Santo Estevão and its adjacent civil parishes has also never been conducted. Thus, the new approach carried out in this study is important because the administrative limits of the civil parishes have changed over time, as already discussed by [44].
The List of the Confessed [48] is a relevant document to be studied because it contains detailed data about the resident population, and therefore it allows for a more realistic statistical analysis of the disaster’s impact on a local scale. In spite of the importance of its content, this document was never studied in detail, being one of the first-hand historical documents that were lost or missed by all contemporary researchers, to the authors’ knowledge. This document provides new data of the 1755 disaster, on which the available variables are the number of residents and the number of households existing on each street in 1755 and 1756. Moreover, to accommodate the population that became homeless after the disaster, it was necessary to construct temporary shelters. Although the number of barracks and the population that was temporarily living in them were recorded, the location of the barracks is not available. Hence, the historical-demographical impact of the 1755 disaster at Santo Estevão is based on the calculations of the differences in data between 1755 and 1756.
In addition, other documents were also compiled by Castro [1], who conducted the first study and compilation of documents of the 1755 disaster; and Sousa [3] who made the most complete compilation of original accounts and comprehensive analysis. On the other hand, the architectural and heritage context was put together by comparison between the present-day urban fabric of the Alfama neighborhood and the information related to buildings before the disaster [47], combined with the second author’s experience and historical knowledge of the territory.
2.2. Compilation of Historical Cartography
Several historical maps were compiled in order to understand the accounts and to reproduce as accurately as possible the urban fabric of the historical civil parish of Santo Estevão in 1755, and how it changed in 1756. Although the authors did not find cartography for the time period of 1755 and 1756, there were maps published several centuries before the disaster [53], several years after the disaster (including the Lisbon city civil parishes’ limits) [45], or decades [54] and even about 100 years [55] after the disaster. The last map was the first accurate reproduction of the city’s urban fabric with adequate triangulation, precise topography, and high graphical representation [56].
2.3. Field Survey
Although some documents are already available online, access to most written documents and cartography is still restricted. In some local and national archives, the consultation must be conducted on-site, without the possibility of free reproduction, which was a challenge, and simultaneously a very slow process of research. Thus, the consultation of those documents occurred in situ at the Arquivo Histórico do Patriarcado de Lisboa, Gabinete de Estudos Olisiponenses, National Library of Portugal, and in the Torre do Tombo. However, the lockdown and restrictions due to the COVID-19 pandemic in Portugal [57,58,59] caused a significant delay in the research since access to those documents was not available or limited for many months. In addition, the authors found an unexpectedly large number of documents with much more information than anticipated, which made it overwhelming to process the new data. Therefore, the field survey was carried out on several occasions from September 2020 until May 2022, which was an unusually long period of time.
Moreover, a field survey was also conducted on the territory of the historical civil parish of Santo Estevão, which today covers part of the Alfama neighborhood, in order to identify and register on camera buildings and streets that might still exist today.
2.4. Tsunami Numerical Modeling
The tsunami modeling was carried out by using the TUNAMI-N2 code of Tohoku University, which considers the nonlinear shallow water equations, discretized with a staggered leapfrog finite difference scheme [60]. The governing equations, written in Cartesian coordinates, are:
where
M and N are the discharge fluxes and u and v are the velocities in the x and y directions, respectively. D is the total water depth, η is the sea surface elevation, h is the still water depth, and g is the acceleration due to gravity. The bottom friction was considered with Manning’s roughness coefficient of n = 0.025.
The equations were applied to a nesting of six regions, where the regions have progressively smaller areas and finer grid cell sizes and are included in the previous region, as shown in Figure 3. The first region is the largest and has a cell size of 729 m (Figure 3a). Then, regions two, three, four, and five have cell sizes of 243 m, 81 m, 27 m, and 9 m, respectively. Finally, region six has cell size of 3 m. Regions four, five, and six (Figure 3b) include details of the coastal areas and topography. During the construction of each region, several historical bathymetry charts and topographic maps were used combined with previous digital elevation models [44,53,54,55,56,61], in order to reproduce, as accurately as possible, the Portuguese coastline and the city of Lisbon’s layout before the earthquake. In addition, in region six (Figure 3c), a 3 m cell size is suitable for the study area because it accurately reproduces local natural topography variations as well as urban structures such as buildings and streets in the Lisbon riverside before the earthquake. In computational region 6, tsunami inundation allows the tsunami run-up to be calculated. The numerical model setting is similar to the one used by [44]; however, in this study the territory of Santo Estevão was added in computational region six. In addition, the numerical model passes data from the larger computational region into the next region by using boundary conditions, on which the calculated water level height at the boundary of the largest computational region is picked up and used as input at the boundary of the next region.
On the other hand, the co-seismic displacement of the seafloor is transferred to the sea-surface displacement because the rupture process of an earthquake is usually much shorter than the tsunami wave period. The source model of the 1755 tsunami considered the earthquake fault parameters proposed by [29,30], located on the Gorringe Bank [13,14], with length = 200 km, width = 80 km, strike = 60°, dip = 40°, slip = 12.1 m, and focal depth = 8 km. These parameters are in agreement with the seismotectonics of the area [16,17,18,19,20,21,22,23,24,25,26] and consistent with the seismic intensity analysis [27,28], as has previously been discussed by [29,30,35,36,37,44]. The tsunami source model has been validated by reproduction of the tsunami parameters reported by the historical accounts and water level waveforms at regional level (propagation) [35], and at the local level (inundation) in Vila do Bispo [36] and Lisbon [44] coastal areas, both in Portugal. Then, the initial sea-surface displacement of the tsunami was calculated by using the Okada formulas [62] on region 1, which conducted to a maximum uplift of about 6 m and a subsidence of 0.4 m (Figure 3a).
3. Results and Discussion
3.1. Main Buildings
The Hermitage of Our Lady of Remédios (building 17, in Figure 2, Figure 4 and Figure 5) was already identified by [44], belonging to the historical civil parish of São Miguel. However, after investigating the toponymy of 1755 [1,3,48,49], it was clear that the Hermitage was located on the territory of the historical civil parish of Santo Estevão. This discrepancy is due to the modifications of the administrative civil parish’s limits, as already pointed out in the Introduction Section. The accounts report that the Hermitage was reduced to “a pile of rocks” and many people died under the debris [3] while attending Mass. What remained was mostly the Manuelino Door, which still exists today (Photo in Figure 6a), but the building was restored in 1757 [3]. Therefore, the earthquake’s impact on the Hermitage is classified as “total collapse” (Figure 7a). Moreover, according to the general descriptions of the 1755 disaster [1,3,49,52] the fire did not reach the historical civil parishes of São Miguel (Figure 2) and Santo Estevão (Figure 7b).
There were nine buildings that suffered partial damage due to the earthquake (Figure 7a): the Church of Santo Estevão (18 in Figure 4 and Figure 5) [1,3,49,52] of which a photo of the main entrance is shown in Figure 6b; the Palace of Sequeira or Condes de São Martinho (Q in Figure 4 and Figure 5) also suffered significant damage [1,3], and a photo of the building is presented in Figure 6e; the Palace of Azevedo Coutinho (R), of which a photo of the building shown in Figure 6f, had 32 residents and was abandoned after the earthquake. Neither the details of the damage nor the location of where the family moved to are known, but they returned in 1760 [48]; the Hospital of Espírito Santo (S) was severely damaged due to the earthquake but it did not stop receiving patients, and more than 10 people died in 1756 but for reasons not related to the 1755 disaster [51]; the Upper Iron Foundry (T), and the Palace of Teles Melo (W) (Photo in Figure 6h) had some damage [1,3]; The Prison of Galé (X) suffered some damage [63]; the Downer Iron Foundry (Y) suffered significant damage due to the earthquake [1,3] but it was repaired in 1760 [64], and the pier was completely destroyed by the combined effects of the earthquake and tsunami (Figure 6c).
There were two buildings with no damage or minor damage: the Hermitage of Boa Nova (19) [1,3] (Photo of the building in Figure 6c) and the Tobacco Warehouse (V). The fire did not reach São Miguel civil parish (Figure 2), but the propagation of the fire due to projections was a real threat to the Tobacco Warehouse (V), and although there was no damage due to the earthquake and tsunami (Figure 6), fire prevention measures were conducted [65]. No information has been found related to the Palace of Albergaria Freire (P) (Photo in Figure 6d) and the Palace of Dona Rosa (U) (Photo in Figure 6g).
3.2. Number of Households in 1755 and 1756
The urban fabric of Santo Estevão is quite dense, with small and narrow streets and many alleys (Figure 4 and Figure 5). The analysis of the List of Confessed [48] allowed the identification of 45 streets and land uses, including two commercial areas (S22 and S39) that in 1755 had 10 and 3 households, respectively. In 1755, before the earthquake, most of the households were concentrated on streets S9 and S10 (red streets in Figure 4a), while the beaches had 20 or fewer households (S24, S41, S42, S43, and S44). In total, before the earthquake, there were 1129 households in Santo Estevão (Table 1), which was about 25% higher than the average of the six civil parishes studied by [44] (Figure 2).
After the earthquake, in 1756, the number of households was reduced to 536 (Table 1), indicating severe damage due to the earthquake. This represents a decrease of about 52%, which is quite significant, and clearly contradicts the general thinking that Santo Estevão was “well preserved” [1,3]. Although there are no details about the damage to the residential buildings, whether they suffered a partial or total collapse, the data only indicate that the households became inhabitable. There are records, however, indicating that there were interventions and repairs on 16 properties [67,68]. Thus, it is not clear if the buildings that were lost suffered total collapse due to the earthquake and the aftershocks, or if they suffered partial collapse, being demolished later. Nevertheless, they suffered at least partial collapse (Figure 7a).
The comparison between Figure 4a,b shows that the earthquake caused damage to 78% of the streets; eight streets had a reduction of more than 70% in the number of households (S3, S5, S10, S23, S30, S31, S34, and S45). Four streets had 100% of damage, meaning that there were zero households in 1756 (S7, S14, S25, and S35). These places still exist today and are open areas. The Alley of Recamera (S35) also had 100% of damage; however, its location has been lost and the authors could not identify its location.
Only three streets did not suffer any change in the number of households (S12, S15, and S24), being classified as no damage (Figure 7a). The beaches (S41, S42, S43, and S44) are also classified as having no damage, due to the earthquake (Figure 7a) and tsunami (Figure 7b) since the number of households increased significantly in 1756 (Figure 4c). For these reasons, the overall impact of the earthquake in Santo Estevão must be reclassified as partial collapse (Figure 7a).
3.3. Number of Residents in 1755 and 1756, and Relocation
In 1755 most residents were living on the longest streets (S9, S10, and S16), presented in red, in Figure 5a. The total number of residents was 4325 (Table 2), which is only about 2% lower than the average of the six civil parishes studied by [44] (Figure 2). However, in 1756 there were 2,118 residents living in 536 households, representing a decrease in the population of about 51%, which is a significant impact on the community. In addition, the records show that 1,041 residents were relocated to 297 temporary shelters (Table 1 and Table 2), although the location of those shelters is not known.
The Book of Registered Dead [51] indicates that 44 people died directly due to the earthquake. The comparison between these data with the number of residents before and after the disaster (Table 2) leads to about 1,122 residents that were unaccounted for. Moreover, Table 1 and Table 2 present some discrepancies in the original data of the List of Confessed [48] and this study. These discrepancies are mainly due to the frequent mobility of the residents between the original households (that needed repairs), the temporary shelters, and the new households that were built.
Without the modern technology of communications and big data management, the priests could not keep up with the alterations or did not have access to the data of the other parishes. Examples of the errors found in the List of Confessed [48] that were corrected: (a) residents moved within Santo Estevão from households to barracks, but the data were not updated; (b) people and families were simultaneously registered on several barracks, not only in Santo Estevão, but also in the other adjacent civil parishes; (c) residents returned to the original household in Santo Estevão, but they were still registered on barracks, and vice-versa; (d) residents from other civil parishes occupied the new households built on the Beach of Galé (#S42), but the data were not updated.
These inconsistencies and the number of residents unaccounted for show the chaotic scenario that people in Santo Estevão, as well as the other residents in Lisbon, were trying to survive, and find shelter, in spite of their daily lives being disrupted. Nevertheless, the meticulous work of the priests to record everything is commendable and shows that despite the combined effect of the earthquake, fire, and tsunami, there was a significant effort to try to restore order as soon as possible.
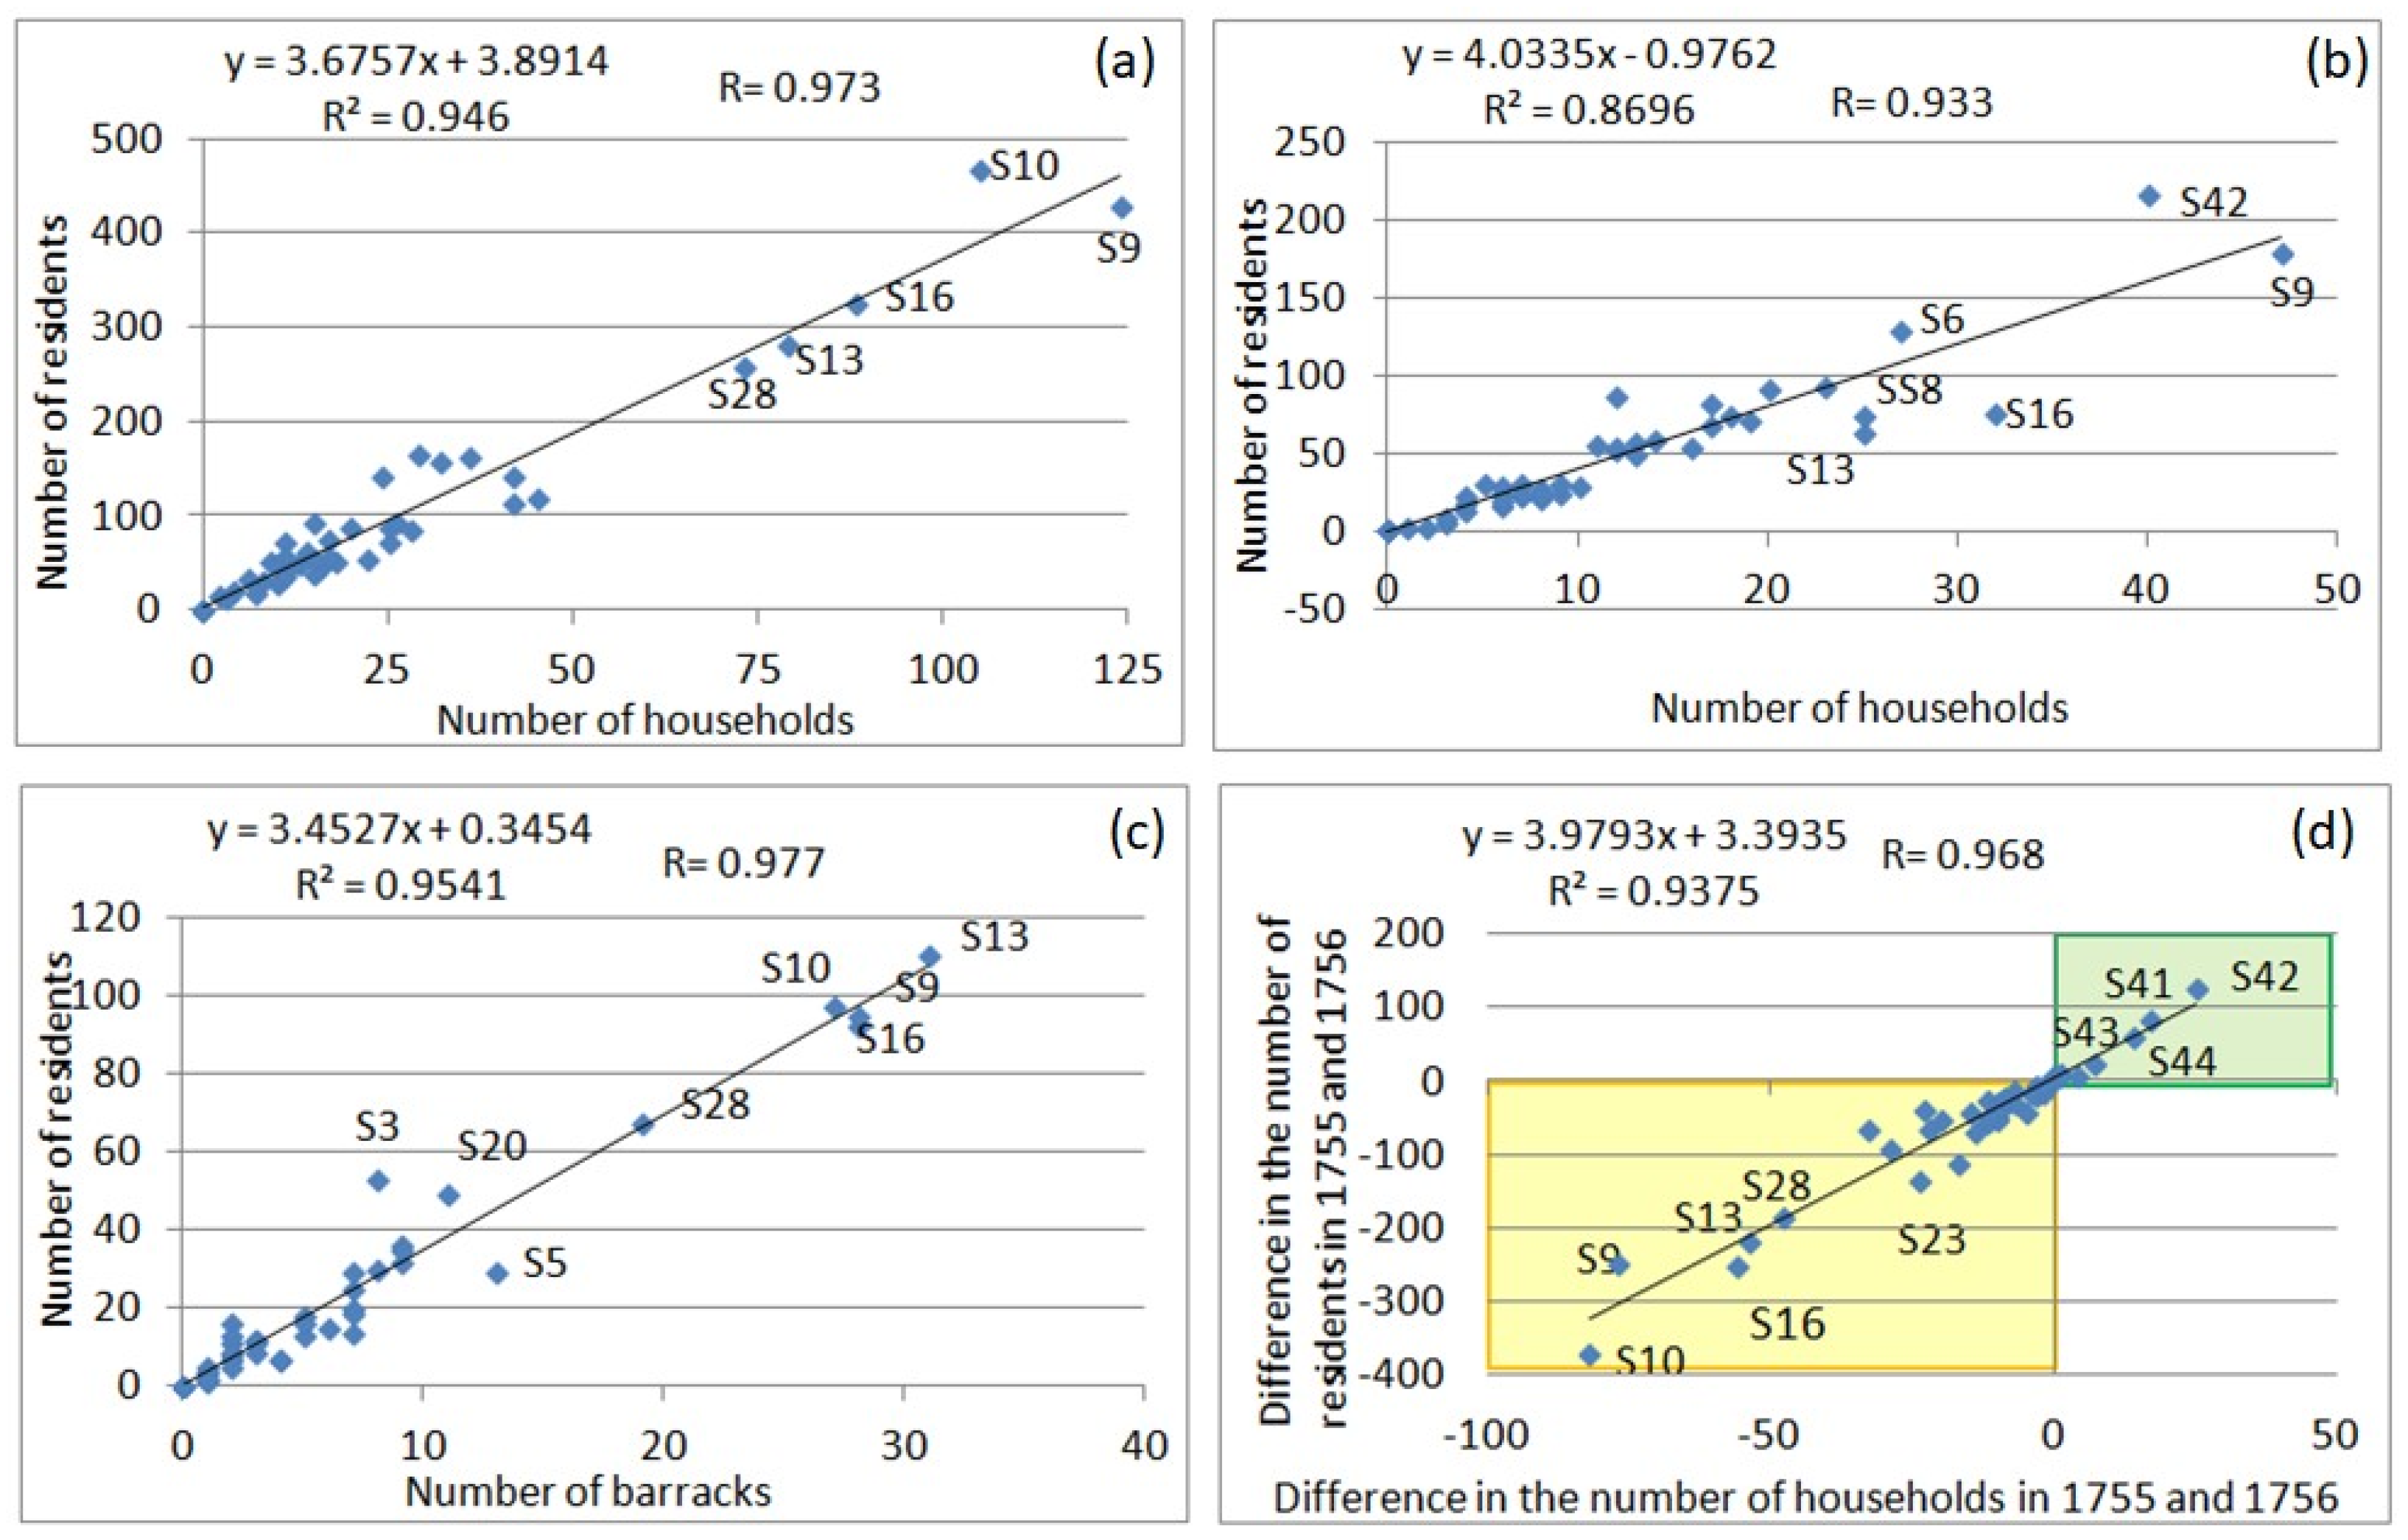
Figure 8 shows the comparison between the households and residents in 1755 (Figure 8a) and in 1756 (Figure 8b), barracks and residents living in them in 1756 (Figure 8c), and the differences between households and residents in 1755 and 1756 (Figure 8d). The results show that the Pearson’s correlation coefficient (R) is positive-strong, higher than 0.93, which shows that data between house accommodation and population are strongly associated with a linear relationship, while the determination coefficient (R2) higher than 0.87 indicate the linear regression equations that best fit the data. The good quality of the data is an important contribution to the statistics of the population and the impact of the 1755 disaster. In a period before the modern census implementation and guidelines, the data provide an excellent source of information related to demography, since the first census conducted in Portugal was in 1864 [69].
The results presented in Figure 8 also show that in general, the largest streets (S9, S10, S13, S16, and S28) stand out from the cluster of smaller streets and alleys presented in orange and red in Figure 4a and Figure 5a. However, after the earthquake, in 1756, the Beach of Galé (S42) stands out, since 25 new households were constructed (a total of 40) and for that reason, 124 residents moved to that area (a total of 218). The most interesting results are presented in Figure 8d, which shows the difference between the number of households and residents in 1755 and 1756, and summarizes the results presented in Figure 4 and Figure 5. The green area shows that there was a significant construction of new households at the beaches (S41, S42, S43, and S44), and the consequent relocation of residents to that area. By contrast, the yellow area shows the streets where the number of households decreased, and for that reason, the residents also decreased, and once again the larger streets stand out from the cluster of the remaining streets.
3.4. Validation of the Tsunami Numerical Results
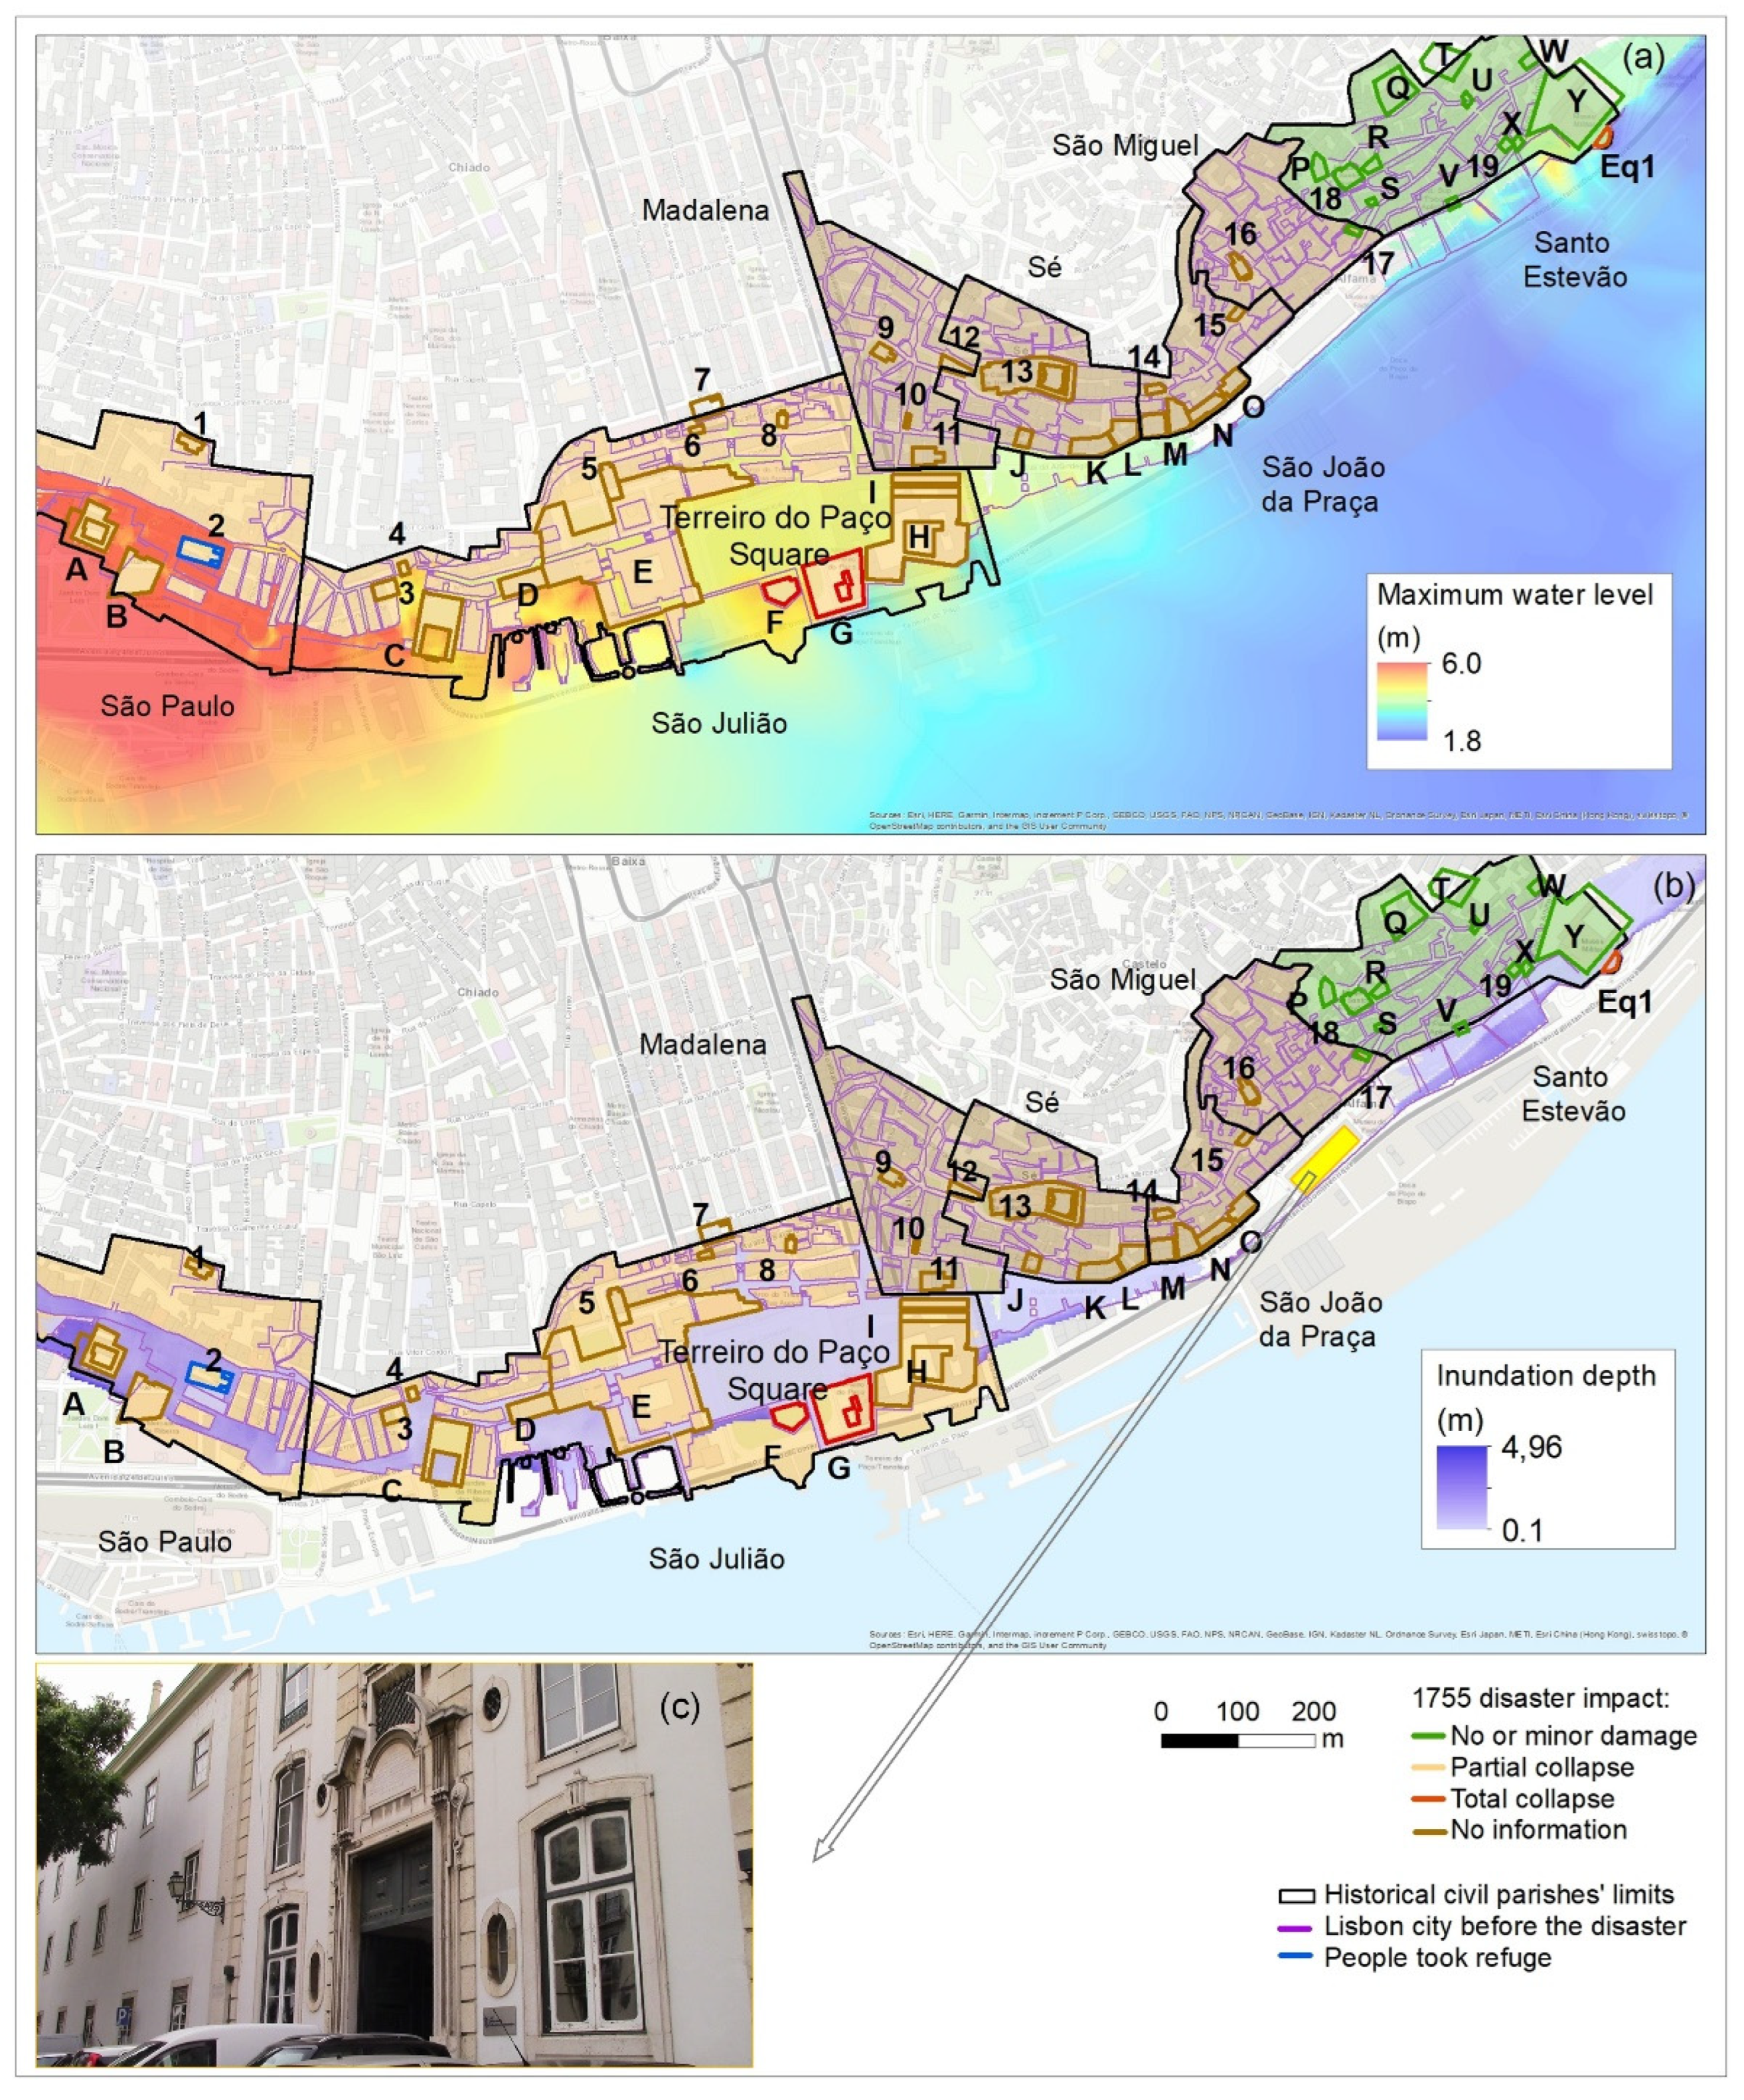
The numerical model results present similar tsunami behavior in the historical civil parishes of São Paulo, São Julião, Madalena, Sé, São João da Praça, and São Miguel, as previously obtained by [44,46]: the arrival of the first tsunami wave at 60 min after the earthquake (Figure 9a), while the third wave hit the coastal area at 130 min (Figure 9b); the maximum water level at São Paulo civil parish (up to 6 m) (Figure 10a) and inundation of the Terreiro do Paço Square (Figure 10b).
In Santo Estevão coastal area, the first and third waves were responsible for the inundation (Figure 9), mostly hitting the Downer Iron Foundry (Y) and its pier with a maximum water level of about 3.1 m (Figure 10a), destroying it. The inundation depth nearby the Tobacco Warehouse (V) and the other buildings on the riverfront side at Santo Estevão coastline was less than 0.27 m (Figure 10b), which shows that the tsunami inundation of the area was not significant. Still, at the beaches, the inundation depth reached up to 1.87 m. Therefore, if Santo Estevão territory did not have sufficient open area to accommodate the homeless residents, it made sense to start the silting process of the Tagus river in order to construct the new households on the beach area. For this reason, the tsunami numerical model results are validated by the historical accounts.
After the earthquake, the Wheat Warehouse (building I, Figure 2, Figure 9 and Figure 10) was transferred to a new location (photo in Figure 10c). The building was reconstructed in 1766, remaining operational to the present day as the Costumes Administrative Office. If the coastal area near to the historical civil parish of Santo Estevão was not inundated by the tsunami, it makes sense to transfer the building to this area. The inundation depth results show the area was indeed not inundated by the tsunami. Previous studies have shown that the source parameters of the 1755 tsunami located on the Gorringe Bank could reproduce the historical accounts, by seismic intensity modeling [30], and tsunami numerical modeling, with propagation [35] and inundation [36,44]. Thus, once again, the numerical model results are validated by the historical accounts. On the other hand, [44] presented a photo of the Wheat Warehouse (I) from the riverfront façade—which is the only historical building in Lisbon with reinforcement on a facade, to the authors’ knowledge. In addition, the opposite façade (Photo in Figure 10c) shows that it is a normal façade, with large windows. These features of the building also validate the city stakeholders’ knowledge of the need to reinforce the structures as a mitigation measure against future tsunamis.
However, given the geographic position of the coastal civil parishes of Lisbon, and the intense daily commercial and maritime activities, it is rather surprising that no accounts have been found describing the damage to ships and related businesses, due to the tsunami.
The most significant difference since 1755 is the position of the coastline, since at the time of the earthquake it was nearby the southern buildings of Santo Estevão, with the existence of five small beaches, about 40 m in wide (Figure 4, Figure 5, Figure 7, Figure 9 and Figure 10). The tsunami numerical model was validated by the historical accounts, showing that the Santo Estevão beaches had no significant inundation, and therefore it is understandable that the riverfront side became more occupied from 1756 (Figure 4 and Figure 5). Thus, the process of silting the Tagus River margins started with the recovery and reconstruction of the city, as can be seen by the differences in the riverfront of the city’s layout in 1755, the civil parishes’ limits in 1770, and the city’s layout at the present day (Figure 2, Figure 4, Figure 5, Figure 7, Figure 9 and Figure 10) where the coastline moved between 130 m and 250 m into the river. The topographic chart of Lisbon comparing the evolution of the city between 1871 and 1911 also validates this approach [70].
4. Conclusions
The authors searched for first-hand historical documents on local and national libraries, including some that have never been analyzed before. The extensive records written by priests provided new data that allowed a more detailed analysis of the 1755 disaster, including damages on the households as well as population data. In addition, the significant amount of historical cartography also allowed the understanding of the evolution of the city over time. Therefore, the interpretation of these documents represented a breakthrough in the study of the impact of the 1755 disaster, because it allows a detailed statistical analysis of demography on the historical civil parish of Santo Estevão.
The results showed that in general, the streets’ layout of the historical civil parish of Santo Estevão suffered minimum changes after the earthquake, remaining until the present day. Furthermore, most of the streets still exist today with the same name or designation as indicated in the first-hand historical documents, which allowed for a good interpretation of the accounts during the field survey. It was possible to identify 13 buildings (among them three religious buildings and five palaces), and since most of them were preserved till the present day, 9 of these buildings have been observed during the field survey. Still, after the earthquake, the number of households decreased by 52%, which is quite significant and contradicts the previous idea that the territory was “well preserved”. For this reason, the overall impact of the earthquake in Santo Estevão should be reclassified as “partial collapse”. The residents living in households decreased to 51%, while 1041 residents had to be relocated to 297 temporary barracks. With more than 44 dead, there were about 1122 residents unaccounted for.
The fire did not affect the territory, but there were fire-prevention measures to protect the Tobacco Warehouse. The information regarding the tsunami continues to be quite scarce, which is surprising since there were a lot of fishery and maritime activities. Nevertheless, the tsunami only destroyed the pier of the Downer Iron Foundry (today is the Military Museum). The tsunami numerical model was validated by the historical accounts, showing that the Santo Estevão beaches had no significant inundation, and the process of silting the Tagus River margins started with the recovery and reconstruction of the city, and at the present day the coastline is located between 130 m and 250 m further into the river.
Author Contributions
Conceptualization, A.S. and D.R.; methodology and search for historical documents, D.R.; methodology and tsunami numerical model, A.S.; figures and tables, A.S.; writing—original draft preparation, D.R.; writing—review and editing, A.S. All authors have read and agreed to the published version of the manuscript.
Funding
This research was supported by Portuguese national funds through the Fundação para a Ciência e a Tecnologia (FCT, I.P.), under the funding "UIDB/GEO/00295/2020" and "UIDP/GEO/00295/2020".
Data Availability Statement
Not applicable.
Acknowledgments
The authors would like to thank the Arquivo Histórico do Patriarcado de Lisboa and the Gabinete de Estudos Olisiponenses for their help and access to the documents, particularly in the long lockdown and restrictions due to the COVID-19.
Conflicts of Interest
The authors declare no conflict of interest.
References
- Castro, J. Map of Portugal; Na Officina Patriarcal de Francisco Luiz Ameno: Lisboa, Portugal; pp. 1762–1763. (In Portuguese)
- Reid, H. The Lisbon earthquake of November 1, 1755. Bull. Seismol. Soc. Am. 1914, IV, 53–80. [Google Scholar] [CrossRef]
- Sousa, F. The Earthquake of the November 1st, 1755 and a Demographic Study—Lisbon District; Tipografia do Comércio: Lisboa, Portugal, 1928; Volume III, pp. 480–949. (In Portuguese) [Google Scholar]
- França, J.A. The Reconstruction of Lisbon and Pombaline Architecture; Instituto de Cultura e Língua Portuguesa Ministério da Educação, Biblioteca Breve: Lisboa, Portugal, 1989; Volume 12. (In Portuguese) [Google Scholar]
- Baptista, M.A.; Miranda, P.M.; Miranda, J.M.; Mendes Victor, L. The 1755 Lisbon Tsunami; evaluation of the tsunami parameters. J. Geodyn. 1998, 25, 143–157. [Google Scholar] [CrossRef]
- O’Loughlin, K.F.; Lander, J.F. Caribbean Tsunamis, a 500-Year History from 1498–1998; Kluwer Academic Publishers: Dordrecht, The Netherlands, 2003. [Google Scholar]
- Araújo, A.C. The Earthquake of 1755. Lisbon and Europe; Clube do Coleccionador dos Correios: Lisbon, Portugal, 2005. (In Portuguese) [Google Scholar]
- Santos, M.C. Study of the Damage that Occurred in Lisbon Cause by the 1755 Earthquake: Quantification and Discussion. Ph.D. Thesis, Lisbon University, Lisbon, Portugal, 2008. Available online: https://fenix.tecnico.ulisboa.pt/thesis/2353642191231 (accessed on 10 June 2022). (In Portuguese).
- Santos, A.; Koshimura, S. The historical review of the 1755 Lisbon Tsunami. J. Geod. Geomat. Eng. 2015, 1, 38–52. [Google Scholar] [CrossRef]
- Capela, J.V.; Matos, H.; Castro, S. The Civil Parishes of the Districts of Lisbon and Setubal in the Parochial Memories of 1758; Universidade do Minho. Casa Museu de Monção: Braga, Portugal, 2016; pp. 1–443. Available online: http://repositorium.sdum.uminho.pt/handle/1822/47799 (accessed on 10 June 2022). (In Portuguese)
- Foster, I.D.L.; Albon, A.J.; Barbell, K.M.; Fletcher, J.L.; Jardine, T.C.; Mothers, R.J.; Pritchard, M.A.; Turner, S.E. High energy coastal sedimentary deposits; an evaluation of depositional processes in Southwest England. Earth Surf. Processes Landf. 1991, 16, 341–356. [Google Scholar] [CrossRef]
- Dawson, A.; Foster, I.D.L.; Shi, S.; Smith, D.E.; Long, D. The identification of tsunami deposits in coastal sediment sequences. Sci. Tsunami Hazards 1991, 9, 73–82. [Google Scholar]
- Thomson, J.; Weaver, P.P.E. An AMS radiocarbon method to determine the emplacement time of recent deep-sea turbidites. Sediment. Geol. 1994, 89, 1–7. [Google Scholar] [CrossRef]
- Lebreiro, S.M.; McCave, I.N.; Weaver, P.P.E. Late Quaternary Turbidite Emplacement on the Horseshoe Abyssal Plain (Iberian Margin). J. Sediment. Res. 1997, 67, 856–870. [Google Scholar]
- Banerjee, D.; Murray, A.S.; Foster, I.D.L. Scilly Isles, UK: Optical dating of a possible tsunami deposit from the 1755 Lisbon earthquake. Quat. Sci. Rev. 2001, 20, 715–718. [Google Scholar] [CrossRef]
- Moreira, V.S. Seismotectonics of Portugal and its adjacent area in the Atlantic. Tectonophysics 1985, 11, 85–96. [Google Scholar] [CrossRef]
- Grimison, N.L.; Chen, W.-P. The Azores-Gibraltar plate boundary: Focal mechanisms, depths of earthquakes, and their tectonic implications. J. Geophys. Res. 1986, 91, 2029–2047. [Google Scholar] [CrossRef]
- Buforn, E.; Udias, A.; Colombas, M.A. Seismicity, source mechanisms and tectonics of the Azores-Gibraltar plate boundary. Tectonophysics 1988, 152, 89–118. [Google Scholar] [CrossRef]
- DeMets, C.; Gordon, R.G.; Argus, D.F.; Stein, S. Current plate motions. Geophys. J. Int. 1990, 101, 425–478. [Google Scholar] [CrossRef] [Green Version]
- Pinheiro, L.M.; Wilson, R.C.L.; Pena dos Reis, R.; Whitmarsh, R.B.; Ribeiro, A. The Western Iberia Margin: A Geophysical and Geological overview. Proc. Ocean Drill. Progr. Sci. Results 1996, 149, 1–23. Available online: http://www-odp.tamu.edu/publications/149_SR/149TOC.HTM (accessed on 10 June 2022).
- Hayward, N.; Watts, A.B.; Westbrook, G.K.; Collier, J.S. A seismic reflection and GLORIA study of compressional deformation in the Gorringe Bank region, eastern North Atlantic. Geophys. J. Int. 1999, 138, 831–850. [Google Scholar] [CrossRef] [Green Version]
- Borges, J.F.; Fitas, A.J.S.; Bezzeghoud, M.; Teves-Costa, P. Seismotectonics of Portugal and its adjacent Atlantic area. Tectonophysics 2001, 337, 373–387. [Google Scholar] [CrossRef]
- Jimenez-Munt, I.; Fernandez, M.; Torne, M.; Bird, P. The transition from linear to diffuse plate boundary in the Azores-Gibraltar region: Results from a thin-sheet model. Earth. Planet. Sci. Lett. 2001, 192, 175–189. [Google Scholar] [CrossRef]
- McClusky, S.; Reilinger, R.; Mahmoud, S.; Ben Sari, D.; Tealeb, A. GPS constraints on Africa (Nubia) and Arabia plate motions. Geophys. J. Int. 2003, 155, 126–138. [Google Scholar] [CrossRef] [Green Version]
- Carrilho, F.; Teves-Costa, P.; Morais, I.; Pagarete, J.; Dias, R. GEOALGAR Project: First results on seismicity and fault-plane solutions. Pure Appl. Geophys. 2004, 161, 589–606. [Google Scholar] [CrossRef]
- Zitellini, N.; Rovere, M.; Terrinha, P.; Chierici, F.; Matias, L.; Bigsets Team. Neogene Through Quaternary Tectonic Reactivation of SW Iberian Passive Margin. Pure Appl. Geophys. 2004, 161, 565–587. [Google Scholar] [CrossRef]
- Machado, F. Contribution to the study of the November 1, 1755. Revist. Fac. Cienc. Univ. Lisb. 1996, XIV, 19–31. (In Portuguese) [Google Scholar]
- Vilanova, S.; Nunes, C.; Fonseca, J. Lisbon 1755: A case of triggered onshore rupture? Bull. Seismol. Soc. Am. 2003, 93, 2056–2068. [Google Scholar] [CrossRef]
- Johnston, A. Seismic moment assessment of earthquakes in stable continental regions—III. New Madrid 1811–1812, Charleston 1886 and Lisbon 1755. Geophys. J. Int. 1996, 126, 314–344. [Google Scholar] [CrossRef] [Green Version]
- Grandin, R.; Borges, J.F.; Bezzeghoud, M.; Caldeira, B.; Carrilho, F. Simulations of strong ground motion in SW Iberia for the 1969 February 28 (Ms = 8.0) and the 1755 November 1 (M~8.5) earthquakes—II. Strong ground motion simulations. Geophys. J. Int. 2007, 171, 807–822. [Google Scholar] [CrossRef] [Green Version]
- Baptista, M.A.; Miranda, P.M.; Miranda, J.M.; Mendes Victor, L. Rupture Extent of the 1755 Lisbon Earthquake Inferred From Numerical Modeling of Tsunami Data. Phys. Chem. Earth 1996, 21, 65–70. [Google Scholar] [CrossRef]
- Baptista, M.A.; Miranda, P.M.; Miranda, J.M.; Mendes Victor, L. Constrains on the Source of the 1755 Lisbon Tsunami inferred from numerical modeling of historical data on the source of the 1755 Lisbon Tsunami. J. Geodyn. 1998, 25, 159–174. [Google Scholar] [CrossRef]
- Baptista, M.A.; Miranda, J.M.; Chierici, F.; Zitellini, N. New study of the 1755 earthquake source based on multi-channel seismic survey data and tsunami modeling. Nat. Hazards Earth Syst. Sci. 2003, 3, 333–340. [Google Scholar] [CrossRef] [Green Version]
- Gutscher, M.A.; Baptista, M.A.; Miranda, J.M. The Gibraltar Arc seismogenic zone (part 2): Constraints on a shallow east dipping fault plane source for the 1755 Lisbon earthquake provided by tsunami modeling and seismic intensity. Tectonophysics 2006, 426, 153–166. [Google Scholar] [CrossRef]
- Santos, A.; Koshimura, S.; Imamura, F. The 1755 Lisbon Tsunami: Tsunami source determination and its validation. J. Disaster Res. 2009, 4, 41–52. Available online: https://www.fujipress.jp/jdr/dr/dsstr000400010041/ (accessed on 10 June 2022). [CrossRef]
- Santos, A.; Koshimura, S. The 1755 Lisbon Tsunami at Vila do Bispo Municipality, Portugal. J. Disaster Res. 2015, 10, 1067–1080. Available online: https://www.fujipress.jp/jdr/dr/dsstr001000061067 (accessed on 10 June 2022). [CrossRef]
- Santos, A.; Fonseca, N.; Queirós, M.; Zezere, J.L.; Bucho, J.L. Implementation of tsunami evacuation maps at Setubal Municipality, Portugal. Geosciences 2017, 7, 116. [Google Scholar] [CrossRef] [Green Version]
- Portuguese Associations of Archeologists. Coloquium Earthquake in Lisbon. Arqueol. Hist. 2016, 68, 1–268. (In Portuguese) [Google Scholar]
- Macedo, M.L.; Silva, I.M.; Lopes, G.C.; Bettencourt, J. The maritime dimension of the Boqueirão do Duro (Santos, Lisboa) in the 18th and 19th centuries: First archaeological results. In Arqueologia em Portugal; Morais Arnaud, J., Martins, A., Eds.; Estado da Questão AAP: Lisboa, Portugal, 2017; pp. 1915–1924. (In Portuguese) [Google Scholar]
- Macedo, M.L.; Sarrazola, A. Parking lot of Praça, D. Luís, I.; ERA—Arqueologia, S.A.: Lisboa, Portugal, 2012; pp. 34–62. (In Portuguese) [Google Scholar]
- Bettencourt, J.; Carvalho, P.; Fonseca, C.; Coelho, I.P.; Lopes, G.; Silva, T. Ships of the modern period in Lisbon: Balance and research perspectives. In I Encontro de Arqueologia de Lisboa: Uma Cidade em Escavação; Nozes, C., Cameira, I., Banha da Silva, R., Eds.; Livro de Resumos: Lisboa, Portugal, 2017; pp. 478–495. (In Portuguese) [Google Scholar]
- FLAD and Público (Ed.) 1755 The Lisbon Earthquake of 1755; Público and FLAD: Lisboa, Portugal, 2005; Volume 1–4. (In Portuguese) [Google Scholar]
- Lourenço, L.; Santos, A. The Lisbon Earthquake of 1755: What We Learned 260 Years Later? Imprensa da Universidade de Coimbra: Coimbra, Portugal, 2015; pp. 1–316, (In Portuguese). Available online: https://digitalis-dsp.uc.pt/bitstream/10316.2/38268/1/Um%20terramoto%20em%20Lisboa%20%281755%29.%20Uma%20reflex%C3%A3o%20de%20agora%2C%20260%20anos%20depois.pdf (accessed on 10 June 2022). (In Portuguese)
- Santos, A.; Correia, M.; Loureiro, C.; Fernandes, P.; Marques da Costa, N. The historical reconstruction of the 1755 earthquake and tsunami in downtown Lisbon, Portugal. J. Mar. Sci. Eng. 2019, 7, 208. [Google Scholar] [CrossRef] [Green Version]
- Arquivo Nacional Torre do Tombo. Book of Plants of the Lisbon Parishes; Codices and documents of unknown provenance; Arquivo Nacional Torre do Tombo: Lisbon, Portugal, 1770; Volume 153. (In Portuguese) [Google Scholar]
- The 1755 Tsunami on Lisbon Downtown. Available online: https://sites.google.com/campus.ul.pt/1755tsunamilisbon/home (accessed on 10 June 2022).
- Câmara Municipal de Lisboa. Municipal Heritage Charter; Santo Estêvão de Alfama Civil Parish: Lisbon, Portugal, 1994. (In Portuguese) [Google Scholar]
- Arquivo Histórico do Patriarcado de Lisboa. List of Confessed; Santo Estêvão de Alfama Parish: Lisbon, Portugal; pp. 1755–1756. (In Portuguese)
- Parochial Memories—Memórias Paroquias, Dicionário Geográfico de Portugal, tomo 20, nº 93 g, Fólio 777–780. Available online: https://digitarq.arquivos.pt/details?id=4240532 (accessed on 10 June 2022). (In Portuguese).
- Arquivo Nacional Torre do Tombo-Arquivo Distrital de Lisboa. Parish Register of Santa Engrácia, Death Book 5, Fólio 156 v. Available online: https://digitarq.arquivos.pt/viewer?id=4816854 (accessed on 10 June 2022). (In Portuguese).
- Arquivo Nacional Torre do Tombo-Arquivo Distrital de Lisboa. Parish Register of Santo Estevão, Death Book 6, Fólios 73–73 v. Available online: https://digitarq.arquivos.pt/viewer?id=4818337 (accessed on 10 June 2022). (In Portuguese).
- Mendonça, J. The History of Earhquakes(…); Officina de António Vicente da Silva: Lisboa, Portugal, 1758; pp. 1–272. (In Portuguese) [Google Scholar]
- Tinoco, J. Planta da cidade de Lxa em q se mostrão os muros de vermelho com todas as ruas e praças da cidade dos muros a dentro com co as declaraçoes postas em seu lugar. In Map of Lisbon in 1650; Direcção Geral dos Trabalhos Geodesicos do Reino: Lisboa, Portugal, 1884. [Google Scholar]
- Silva, A.V. Topographic Plants of Lisbon; Oficinas Gráficas da Câmara Municipal de Lisboa: Lisbon, Portugal, 1950. (In Portuguese) [Google Scholar]
- Folque, F.; Pezerat, C.; Goullard, F.; Goullard, C. Collection Book of Plants of the Parishes of Lisbon, Planta nº 44; Arquivo Histórico da Câmara Municipal de Lisboa: Lisbon, Portugal; pp. 1856–1858. (In Portuguese)
- Almeida, I.; Ramalho, M.T.A. Filipe Folque’s Contribution to 19th Century Portuguese Cartography; Cadernos do Arquivo Municipal: Lisbon, Portugal, 1999; Volume 3, pp. 145–155. (In Portuguese) [Google Scholar]
- Health General Direction (Direção Geral de Saúde), Recommendations and Norms. Available online: https://covid19.min-saude.pt/normas-e-orientacoes/ (accessed on 10 June 2022). (In Portuguese).
- XXII Portuguese Government. Government Decree-Laws and Communications, COVID-19 and Vaccination. Available online: https://www.portugal.gov.pt/pt/gc22/comunicacao/tema?i=128 (accessed on 10 June 2022). (In Portuguese)
- XXII Portuguese Government. The Response of Portugal to COVID-19. Available online: https://covid19estamoson.gov.pt/ (accessed on 10 June 2022). (In Portuguese)
- Imamura, F. Review of tsunami simulation with a finite difference method. In Long-Wave Runup Models; World Scientific: Singapore, 1995; pp. 25–42. [Google Scholar]
- GEBCO Digital Atlas, General Bathymetric Chart of the Oceans, BODC. 2003. Available online: https://www.gebco.net (accessed on 10 June 2022).
- Okada, Y. Surface deformation due to shear and tensile faults in a half space. Bull. Seismol. Soc. Am. 1985, 75, 1135–1154. [Google Scholar] [CrossRef]
- Castilho, J. The Riverfront Side of Lisbon; Imprensa Nacional: Lisbon, Portugal, 1893. (In Portuguese) [Google Scholar]
- Santos, N.V. Militar Museum. In Dictionary oh the history of Lisbon; Santana, F. (coord) Authors’ Edition: Lisboa, Portugal, 1994. [Google Scholar]
- Freire, F.J. Memories of the Main Orders Given in the Earthquake (…); Amador Lisboa, P: Lisboa, Portugal, 1758; pp. 1–355. (In Portuguese) [Google Scholar]
- Cardoso, L. Geographic Dicionary (…); Regia Officina Sylviana e da Academia Real: Lisboa, Portugal; pp. 1747–1751. (In Portuguese)
- Chancelaria Régia. Consultations, Decrees and Notices of the King José I, Livro 16, Fólios 30–31 v; Arquivo Municipal de Lisboa–Arquivo Histórico: Lisboa, Portugal, 1768. [Google Scholar]
- Chancelaria Régia. Consultations, Decrees and Notices of the King José I, Livro 17, Fólios 19–20 v; Arquivo Municipal de Lisboa–Arquivo Histórico: Lisboa, Portugal, 1768. [Google Scholar]
- National Institute of Statistics. The First General Census of the Population. 1864. Available online: https://censos.ine.pt/xportal/xmain?xpid=INE&xpgid=censos_historia_pt_1864 (accessed on 10 June 2022). (In Portuguese).
- Arquivo Municipal de Lisboa–Arquivo Histórico. Planta de Lisboa nº10, Extrato da Carta Topográfica de Lisboa publicada em 1871. Available online: https://arquivomunicipal3.cm-lisboa.pt/xarqdigitalizacaocontent/PaginaDocumento.aspx?DocumentoID=1356158&AplicacaoID=1&Pagina=1&Linha=1&Coluna=1 (accessed on 10 June 2022). (In Portuguese).
Figure 1.
Geographical framework of the study area: (a) countries and regions hit by the 1755 tsunami; (b) Location of Portugal, the Lisbon municipality and Lisbon downtown.
Figure 1.
Geographical framework of the study area: (a) countries and regions hit by the 1755 tsunami; (b) Location of Portugal, the Lisbon municipality and Lisbon downtown.

Figure 2.
Impact of the 1755 disaster on the historical civil parishes of downtown Lisbon (adapted from [44]) due to: (a) earthquake; (b) fire; (c) tsunami. The present-day layout of the city is presented on the background. This study is focused mainly on Santo Estevão.
Figure 2.
Impact of the 1755 disaster on the historical civil parishes of downtown Lisbon (adapted from [44]) due to: (a) earthquake; (b) fire; (c) tsunami. The present-day layout of the city is presented on the background. This study is focused mainly on Santo Estevão.

Figure 3.
Conditions of the numerical model setting and bathymetry data: (a) Tsunami initial sea surface displacement on region 1, and placement of region 2, 3, and 4; (b) region 4 and the placement of regions 5 and 6; (c) details of region 6.
Figure 3.
Conditions of the numerical model setting and bathymetry data: (a) Tsunami initial sea surface displacement on region 1, and placement of region 2, 3, and 4; (b) region 4 and the placement of regions 5 and 6; (c) details of region 6.

Figure 4.
Number of households on each street in the historical civil parish of Santo Estevão (a) in 1755; (b) in 1756; (c) graph with the difference of the households. Street names, land uses and equipment: S1. Forecourt of Church of Santo Estevão; S2. Street of Nova do Almeida; S3. Arch of Chanceler; S4. Alley of Carneiro; S5. Sidewalk of Santo Estevão; S6. Street of Regueira; S7. Alfugera; S8. Alley of Espírito Santo; S9. Street of Remédios/Street Direita; S10. Street Direita das Portas da Cruz; S11. Alley of Fróis; S12. Courtyard of Pólvora; S13. Street Direita de Santo Estevão; S14. Square of Santo Estevão; S15. Alley of Maria da Guerra; S16. Street of Vigário; S17. Alley of Loureiro; S18. Outeiro de Baixo; S19. Alley of Paus; S20. Outeiro de Cima; S21. Outeiro da amendoeira; S22. Alpendres; S23. Alley of Banebuquel; S24. Beach; S25. Courtyard of Mello; S26. Alley of Estanco; S27. Alley of Cancela; S28. Street of Lapa; S29. Alley of Muro; S30. Alley of Maquinez; S31. Alley of Ramos; S32. Alley of Mil Patacas; S33. Alley of Furtado; S34. Square of Brás; S35. Alley of Recâmara; S36. Alley of Surra; S37. Alley that goes to Goleta; S38. Alley of Goleta; S39. Peitoril; S40. Marketplace Doors; S41. Beach of Casas; S42. Beach of Galé; S43. Beach of Pipas; S44. Beach of Estanque; S45. Alley of Belo; Eq1. Pier of the Downer Iron Foundry. The present-day layout of the city is presented on the background.

Figure 5.
Number of residents living in households in the historical civil parish of Santo Estevão: (a) 1755; (b) 1756; (c) Difference in the number of residents. List of street names, land uses and equipment are indicated in Figure 4. The present-day layout of the city is presented on the background.

Figure 6.
Buildings that still exist today, with locations indicated on Figure 4 and Figure 5. (a) 17. Hermitage of Our Lady of Remédios; (b) 18. Church of Santo Estevão; (c) 19. Hermitage of Jesus da Boa Nova; (d) P. Palace Albergaria Freire; (e) Q. Palace of Sequeira or Palace of Condes de São Martinho; (f) R. Palace of Azevedo Coutinho; (g) U. Palace of Dona Rosa; (h) W. Palace of Teles de Melo; (i) Y. downer iron foundry (today is the Militar Museum).

Figure 7.
Overall disaster impact on Santo Estevão historical civil parish due to (a) earthquake; (b) fire; (c) tsunami. List of street names, land uses and equipment are indicated in Figure 4. The present-day layout of the city is presented on the background.
Figure 7.
Overall disaster impact on Santo Estevão historical civil parish due to (a) earthquake; (b) fire; (c) tsunami. List of street names, land uses and equipment are indicated in Figure 4. The present-day layout of the city is presented on the background.

Figure 8.
Comparison between the number of residents living in households and barracks on each street of Santo Estevão: (a) Residents living in households in 1755; (b) residents living in households in 1756; (c) residents living in barracks in 1756; (d) difference between residents living in households in 1755 and 1756. Green area means an increase in the number of residents and households, and yellow area means a decrease in the number of residents and households. List of street names and land uses indicated in Figure 4.

Figure 9.
Tsunami water level snapshots’ results on computational region six, corresponding to the arrival of the first and third waves: (a) 60 min; (b) 130 min. Also presented in the Figure is the plot of the water level time histories. List of buildings in civil parishes of São Paulo, São Julião, Madalena, Sé, São João da Praça, and São Miguel are presented in Figure 2, while buildings of Santo Estevão are indicated in Figure 4. The present-day layout of the city is presented on the background.

Figure 10.
(a) Tsunami numerical results of the maximum water level; (b) tsunami numerical results of the inundation depth; (c) photo of the present-day Costumes building; the facade is viewed from the present day Jardim do Tabaco Street. List of buildings in civil parishes of São Paulo, São Julião, Madalena, Sé, São João da Praça, and São Miguel are presented in Figure 2, while buildings of Santo Estevão are indicated in Figure 4. The present-day layout of the city is presented on the background.


Table 1.
Number of households before and after the disaster at Santo Estevão civil parish, according to several authors. Several discrepancies have been found (*).
Table 1.
Number of households before and after the disaster at Santo Estevão civil parish, according to several authors. Several discrepancies have been found (*).
| Number of Households before the Disaster | Number of Households after the Disaster | |||
|---|---|---|---|---|
| Reference | 1742 | 1755 | 1756 | 1758/1759 |
| [66] | 1108 | --- | --- | --- |
| [48] | 1108 | 1129 | 878 | --- |
| [49] | --- | --- | --- | 977 |
| [1,3] | --- | 1129 | --- | 878 |
| This study | --- | 1129 | 536; 297 (barracks); 833 total * | --- |
Table 2.
Number of residents (before and after the earthquake) and the number of fatalities at Santo Estevão civil parish. The population data consider people older than seven years of age. Location of Hermitage indicated on Figure 4. Several discrepancies have been found (*).
Table 2.
Number of residents (before and after the earthquake) and the number of fatalities at Santo Estevão civil parish. The population data consider people older than seven years of age. Location of Hermitage indicated on Figure 4. Several discrepancies have been found (*).
| Reference | Residents in 1755 | Residents in 1756 | Fatalities | Missing Data |
|---|---|---|---|---|
| [1] | 4325 | 3400, including 27 minors under 7 years old | Less than 40 | -- |
| [3] | 4329 | 3400 | 44 registered dead [51] | -- |
| This study | 4325 | 2118 (living in households); 1041 (living in barracks); 3159 total * | 44 registered dead [51]; Many dead in Hermitage of Our Lady of Remédios (17) | About 1122 residents were unaccounted for * |
Publisher’s Note: MDPI stays neutral with regard to jurisdictional claims in published maps and institutional affiliations. |
© 2022 by the authors. Licensee MDPI, Basel, Switzerland. This article is an open access article distributed under the terms and conditions of the Creative Commons Attribution (CC BY) license (https://creativecommons.org/licenses/by/4.0/).
Share and Cite
MDPI and ACS Style
Santos, A.; Rijo, D. New Data of the 1755 Earthquake and Tsunami in Lisbon, Portugal. Geosciences 2022, 12, 286. https://0-doi-org.brum.beds.ac.uk/10.3390/geosciences12080286
AMA Style
Santos A, Rijo D. New Data of the 1755 Earthquake and Tsunami in Lisbon, Portugal. Geosciences. 2022; 12(8):286. https://0-doi-org.brum.beds.ac.uk/10.3390/geosciences12080286
Chicago/Turabian StyleSantos, Angela, and Delminda Rijo. 2022. "New Data of the 1755 Earthquake and Tsunami in Lisbon, Portugal" Geosciences 12, no. 8: 286. https://0-doi-org.brum.beds.ac.uk/10.3390/geosciences12080286
Note that from the first issue of 2016, this journal uses article numbers instead of page numbers. See further details here.