1. Introduction
The rapid environmental change and the challenges to achieve sustainable development are driving the need for a better understanding and management of nature. Geodiversity has a key role in territorial management and conservation policies, and its concept has been well accepted by the scientific community worldwide. A recent accomplishment is the celebration of International Geodiversity Day on October 6 of each year, approved by UNESCO. Geodiversity is essential to the implementation of the 2030 Sustainable Development Goals.
Among the various existing definitions [
1,
2,
3,
4,
5,
6,
7,
8,
9,
10,
11], Murray Grays’s [
11] is one of the most cited, defining geodiversity as “the natural range (diversity) of geological (rocks, minerals, fossils), geomorphological (landforms, topography, physical processes), soil and hydrological features. It includes their assemblages, structures, systems, and contributions to landscapes”.
Despite the good recognition of the concept and the development of various studies to assess geodiversity, the establishment of a widely accepted methodology and its use as a tool for territorial management and nature conservation is still the subject of much disagreement. In this sense, the development of new studies that focus on the use of geodiversity for these purposes can increase the recognition of geodiversity by a larger scientific audience and society, besides having a use comparable to the current use of biodiversity [
12,
13].
Geodiversity assessment can be performed qualitatively and quantitatively [
14]. Qualitative methods are related to a description of the geodiversity elements in the study area and, eventually, an explanation on their values, always in a non-numerical form. The maps that can be produced by the qualitative approach usually represent spatial units with well-defined boundaries, similar to the traditional geological maps [
15,
16]. CPRM (Geological Survey of Brazil) has produced geodiversity maps on national and state scales. More detailed scale maps, such as municipalities, have also been produced [
17]. These maps present geological-environmental units, providing information about potentialities for and limitations to the use of land.
A variety of quantitative analyses of geodiversity have been developed to determine the distribution of geodiversity richness in a specific area [
12] based on numerical parameters and indicators that can rely on field measurements, remote sensing, or map analysis [
18,
19,
20,
21,
22,
23,
24,
25]. The majority of the quantitative procedures rely on map analysis, which has been focused on the use of indices and map algebra in a GIS (Geographic Information System) environment. Geodiversity indices are the most popular, with the product of this quantitative approach usually being a geodiversity index map, also allowing for partial indices maps (geomorphology, lithology, paedology, hydrology, mineralogy, or palaeontology) [
14]. A qualitative–quantitative approach is also possible, combining qualitative and quantitative procedures [
13].
These different techniques to assess geodiversity have been applied in different contexts, although quantitative assessment methods have been the most popular. However, studies relating the quantitative assessment of geodiversity with geoheritage and the use of the geodiversity index maps for management and geoconservation purposes are not very sound. The relationship between geodiversity and geoheritage is usually shown in geodiversity assessment studies using a qualitative approach [
14], where the description of the geodiversity elements is sometimes used to establish a link between geodiversity and geoheritage values [
26,
27].
The biodiversity–geodiversity relationship is already known in the literature, and recent studies have tested this relationship through different analyses [
15,
28,
29,
30,
31,
32,
33]. Most of these studies are focused on the quantitative approach to observe if areas with high geodiversity are associated with a high biodiversity. Nevertheless, the development of more studies that demonstrate its fundamental relationship in practice is imperative for proper territorial management and conservation [
15].
The relationship between biodiversity and land-use is also a very known relationship, and geodiversity index maps have been understood to be useful tools for territorial management [
12,
16]; still, little is discussed about how land-use relates to geodiversity. Thus, understanding the relationships between geodiversity and biological and anthropological environments is essential to establishing a precise territorial management policy concerned with sustainable development and nature conservation [
15]. Tukiainen et al. [
31] worked on these relationships, aiming to understand how land-use intensity affects both geodiversity and biodiversity on a landscape scale. The information obtained from geodiversity studies can provide an assessment of human intervention in the physical environment and its consequences for biodiversity. Therefore, the study of geodiversity (in its theoretical and practical sense) is very important to improve the society–nature relationship and increase the quality of life.
Aiming to better understand these relationships, correlative analyses between geodiversity and other nature and anthropic elements are presented, using Miguel Pereira municipality in Rio de Janeiro State, Brazil, as a study area. A geodiversity index map supported in quantitative procedures [
23] was used, as well as a qualitatively assessed geodiversity units map, vegetation, sites of geological interest, and land-use maps of the area.
With this case study, we intend to discuss the relevance of geodiversity maps as a support for land-use and nature conservation management and studies. On the one hand, this contributes to the discussion on the influence of geodiversity on other nature and anthropic elements such as land-use, vegetation, and geoheritage. On the other hand, this analyzes which of the approaches (qualitative or quantitative) in geodiversity assessment best supports each of these correlative analyses.
2. Study Area
Miguel Pereira municipality is located in a mountainous region in the State of Rio de Janeiro, Brazil, occupying an area of 287,933 km
2, and it has an estimated population of 25,622 inhabitants [
34]. The municipality is largely situated in the APA Rio Guandu (Guandu River Environmental Protection Area), in addition to also covering part of the Full Protection Conservation Units Tinguá Biological Reserve (to the south) and the Araras Biological Reserve (to the east) (
Figure 1).
The protected areas in Brazil can be defined as natural and semi-natural areas regulated and/or managed with the objectives of conservation and the sustainable use of biodiversity [
36]. Conservation Units are protected areas with well-defined usage and management and are divided in the national territory into two large groups: (a) Full Protection Conservation Units—conservation units with restricted exploitation of natural resources, allowing only the indirect use of its benefits. Educational purposes and scientific research will depend on the respective Management Plans and the authorization of the body responsible for its administration, respectively. These areas are under public domain, except for Natural Monuments and Wildlife Refuges areas. This group is divided into five categories: Ecological Station, Biological Reserve, National Park, Natural Monument, and Wildlife Refuge. (b) Conservation Units for Sustainable Use—conservation units where exploration and direct economic exploitation are permitted but in a planned and regulated manner. The use of land and natural resources is subject to rules and restrictions defined by the Management Plan and by the body responsible for managing the unit. The categories in this group are: Environmental Protection Area, Area of Relevant Ecological Interest, National Forest, Extractive Reserve, Fauna Reserve, Sustainable Development Reserve, and Private Natural Heritage Reserve [
37].
There are a few similarities between these categories from both types of Conservation Units and the categories defined by IUCN (International Union for Conservation of Nature) in 1994. For example, the categories Wildlife Refuge, National Park, Natural Monument, and Sustainable Development Reserve can be related to the categories Ib (Wilderness area), II (National Park), III (National Monument), and VI (Managed Resource Protected Area), respectively. Only one of these categories (National Park) has the same name. Therefore, the categories of Conservation Units in Brazil do not strictly follow the categories stablished by IUCN in 1994.
2.1. Geodiversity
The State of Rio de Janeiro is geotectonically inserted in the Mantiqueira province, which comprises, among other orogens, the Ribeira Orogen, where Miguel Pereira is located. The Mantiqueira province was affected by the Brasiliano–Pan-African event (Neoproterozoic/Cambrian), originating from the Gondwana amalgamation. The Ribeira Orogen is subdivided into five tectono-stratigraphic terrains: Occidental, Oriental, Paraíba do Sul, and Embú (amalgamated at ca. 580 Ma) and Cabo Frio, which was amalgamated later at ca. 520 Ma [
38,
39].
A suture zone called the Central Tectonic Boundary (CTB), dating back to the Brasiliano–Pan-African event, separates two terrains in Miguel Pereira municipality: Oriental terrane (composed mainly of orthogneisses) and Occidental terrain (composed mainly of metasedimentary rocks). In the northwest side of this zone, a shear zone called the Arcádia-Areal Shear Zone (AASZ) can be found, representing a mylonitic zone which has a strong control in the Santana River graben configuration, this being a result of its reactivation during the Cenozoic period [
40].
The lithological diversity of Miguel Pereira is characterized by Neoproterozoic units constituted by metamorphic rocks and granitoids. A diabase dyke is found in Arcadia, having a spheroidal exfoliation and continuing to Conrado (long red line in the map in
Figure 2a). This dyke is associated with the Serra do Mar Dyke Swarm (SMDS) from the Lower Cretaceous period (ca. 140–120 Ma), chronologically correlated with the basaltic magmatism of the Paraná Basin. Quaternary alluvial sediments occur in the west side of Miguel Pereira and are characterized by clay, sand, and gravel deposits related to the Santana River floodplain [
41,
42].
The geomorphological diversity of Miguel Pereira reflects the geomorphological evolution of the State of Rio de Janeiro, originating from the tectonic events during the opening of the Atlantic Ocean and modeled by erosional and sedimentation processes during the Upper Cenozoic period. The territory of the state of Rio de Janeiro can be compartmentalized into morphostructural and morphosculptural units]. The morphostructural unit Atlantic Orogenic Belt is characterized in Miguel Pereira by the morphosculptural units Mountain Escarpments, Interplateau Depressions, Residual Plateaus, and Tectonic Depressions. Mountain Escarpments are represented in the study area by the relief patterns Mountain Domain and Plateau edge escarpments, with associated alluvium-colluvium ramps and talus deposits, along with an inselberg. Interplateau Depressions are characterized by smoother relief (hills) and colluvium and alluvium-colluvium ramps occurring in the northern portion of the area. Floodplains also occur in the lowered areas. The Residual Plateaus occur in the southern portion of the municipality. The Tectonic Depressions are characterized by isolated ridges and low mountains filled by alluvial deposits and can be found in the western portion of the municipality. The morphostructural unit Quaternary Sedimentary Covers is represented by flood plains and terraces bordering the main river of the municipality (Santana river) and alluvium-colluvium ramps associated with the steeper relief in the surroundings (
Figure 2b) [
43].
In general, Miguel Pereira is characterized mainly by steep relief associated with granitoids, orthogneisses, and migmatites, along with a small occurrence of gabbro. The lower areas are mainly composed of hills, associated mostly with biotite gneisses and intercalated schist gneisses and quartzites. Quaternary deposits are associated with flood plains. Triangular facets occur in the upper areas and are related to the graben border faults and colluvial deposits from the Quaternary. The CTB, the most representative shear zone in the area, is associated with the Santana River valley, which comprises the main river in the area. The Santana River valley is 4 km long and up to 500 m wide in the NE–SW direction, and it is associated with the Santana River Graben, originating from the reactivation of the AASZ.
Miguel Pereira is characterized by a soil diversity composed by red-yellow ultisol, ochrept, red and red-yellow oxisols, fluvent, and udorthent. Ochrept and udorthent soil types are mainly associated with steep areas, while gentle slope areas are mainly composed of red and red-yellow oxisols and red-yellow ultisol soil types. Fluvent soils are more characteristic of flood plain areas (
Figure 2c). Oxisols develop in environments with a hot and humid tropical climate. They are mineral soils with good drainage and very deep and homogeneous profiles, as they are located in areas with intense soil movement due to bioturbation processes. Very poor in plant nutrients, these soils can be used in agriculture due to physical conditions such as: relief with a gentle slope; little susceptibility to water erosion; favorable to the work of agricultural machines; good internal properties due to high friability and permeability. Ultisols have a greater differentiation of horizons and occur in very variable relief, from mountainous to gently undulating, generally associated with Oxisols. They are heterogeneous soils, with increased clay in depth. They are generally shallow to deep, with a high or low base saturation, and sandy or clayey on surfaces, with gradual or abrupt transitions in texture. When not located in mountainous areas, with a high slope, they can be used for agriculture. Udorthens are shallow soils, predominant in areas of Brazil with strong slopes. Fluvents, on the other hand, occur in flattened reliefs, constituted by a succession of layers of an alluvial nature, with no pedogenetic relationship between them. These soils, unlike Udorthents, are thick enough for agricultural use; however, they are subject to constant flooding in the plains. Ochrepts occur in steep relief areas in the municipality and are very common soils, with very different characteristics and occurrences, although they are not very useful for agriculture [
44,
45].
The hydrographic network of Miguel Pereira is composed of a variety of temporary and permanent channels, without any significant hydrographic basin (
Figure 2d). The Santana River is the main permanent river in the municipality and one of the tributaries of Guandu river, which covers several municipalities. Its surface water resources are important for the municipality and surrounding areas, mainly due to the presence of the APA Rio Santana (protected area for sustainable use), with an area of 23,595 ha, inserted in the Tinguá Biological Reserve Buffer Zone (Full Protection Federal Conservation Unit). As it is located in a buffer zone, it is important to have control over human interventions (especially urban growth). The Santana River seems to have an important erosional role in the municipality, significantly affecting the landscape.
Figure 2.
(
a) Geological map of Miguel Pereira (modified and translated from DRM-RJ, 1982 [
46]); (
b) Geomorphological units map of Miguel Pereira (modified and translated from CPRM, 2017 [
47]); (
c) Soil map of Miguel Pereira (modified and translated from INEA, 2011 [
48]); (
d) Hydrographic map of Miguel Pereira (modified and translated from IBGE, 2018 [
49]). “Identified rivers” are the rivers that are identified and named by IBGE (A–O). “Rivers” are those without any designation. Source: Gonçalves et al. [
23].
2.2. Vegetation
Miguel Pereira is part of the Atlantic Rainforest biome that occupies approximately 13% of the Brazilian territory. This biome is located in the coastal region and is one of the most threatened biomes in Brazil, with about 15.2% of its original forest cover remaining. It includes 1361 species of Brazilian fauna, including 261 species of mammals, 620 species of birds, 200 species of reptiles, and 280 species of amphibians, with 567 species only occurring in this biome. Currently, its area is reduced and fragmented with forest remnants located mainly in areas of difficult access [
50,
51].
The mountain region of Rio de Janeiro is in the domain of the Dense Ombrophilous Forest that characterizes the vegetation cover of Miguel Pereira [
52]. This type of vegetation is characterized by phanerophytes—macro and mesophanerophytic life subforms—in addition to woody lianas and epiphytes in abundance, which differentiate it from other classes of formations. The thermal characteristic of the Dense Ombrophilous Forest is tied to the tropical climatic factors of high temperatures (averages of 25 °C) and high precipitation, well distributed throughout the year (from 0 to 60 dry days), which determine a bioecological situation with virtually no dry biological period. Furthermore, dystrophic and exceptionally eutrophic latosols originating from various types of rocks are found in these forests.
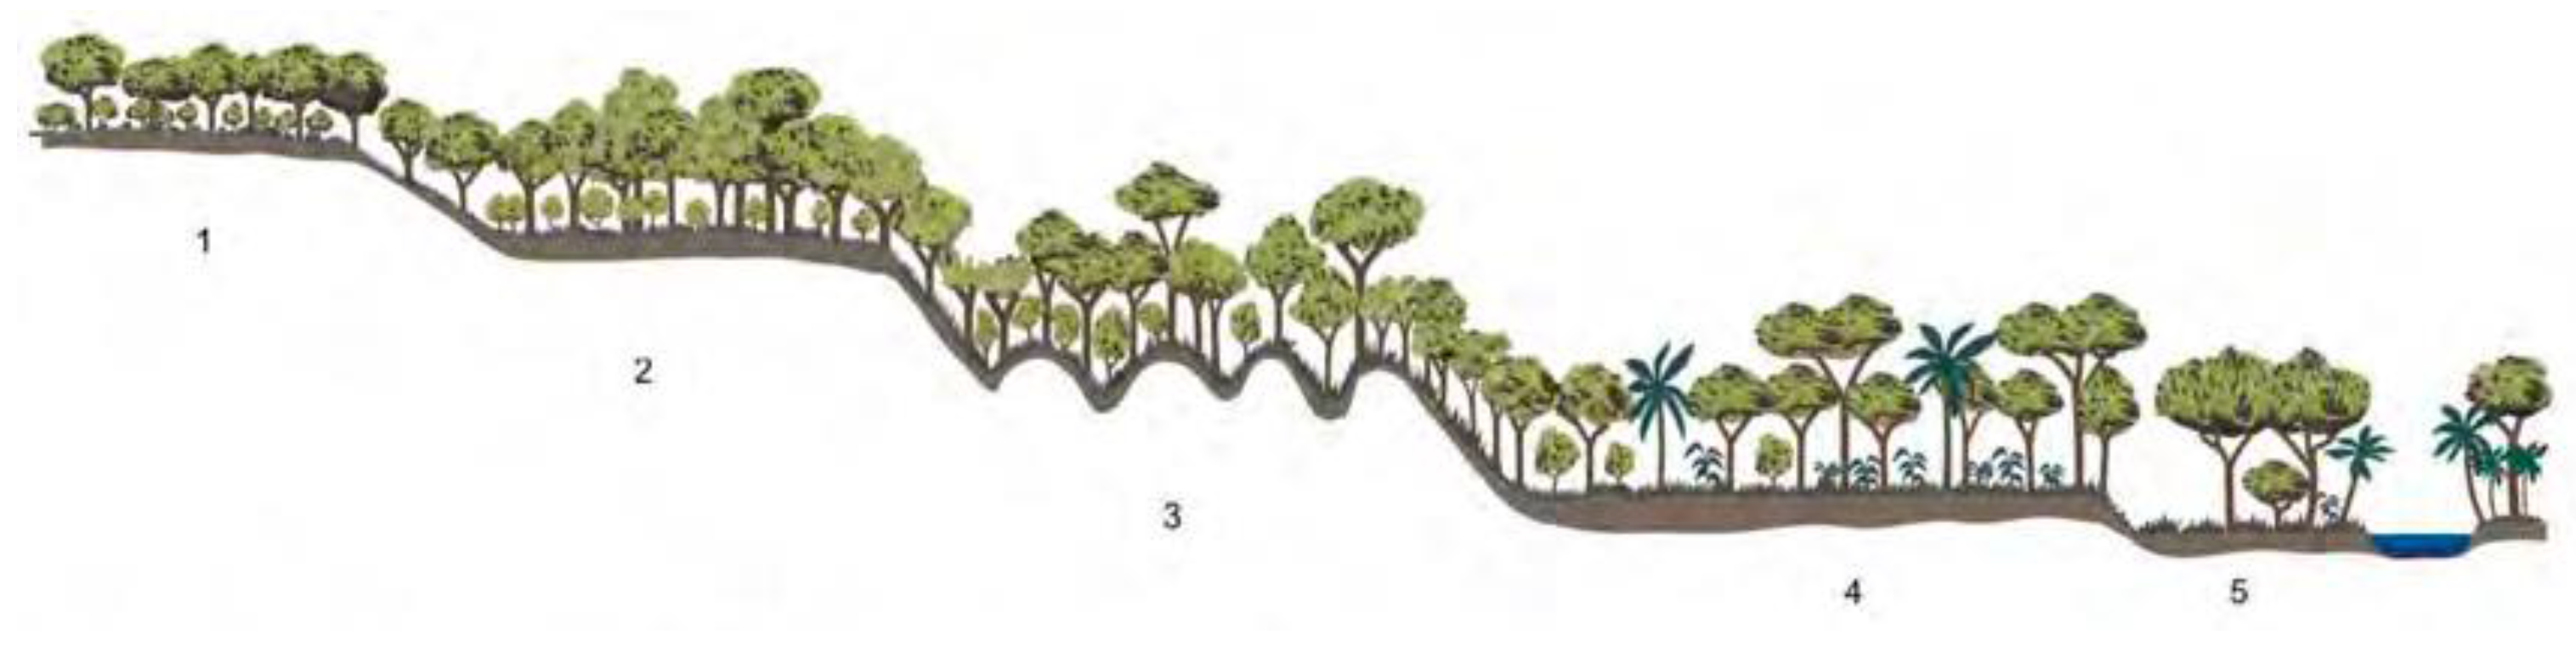
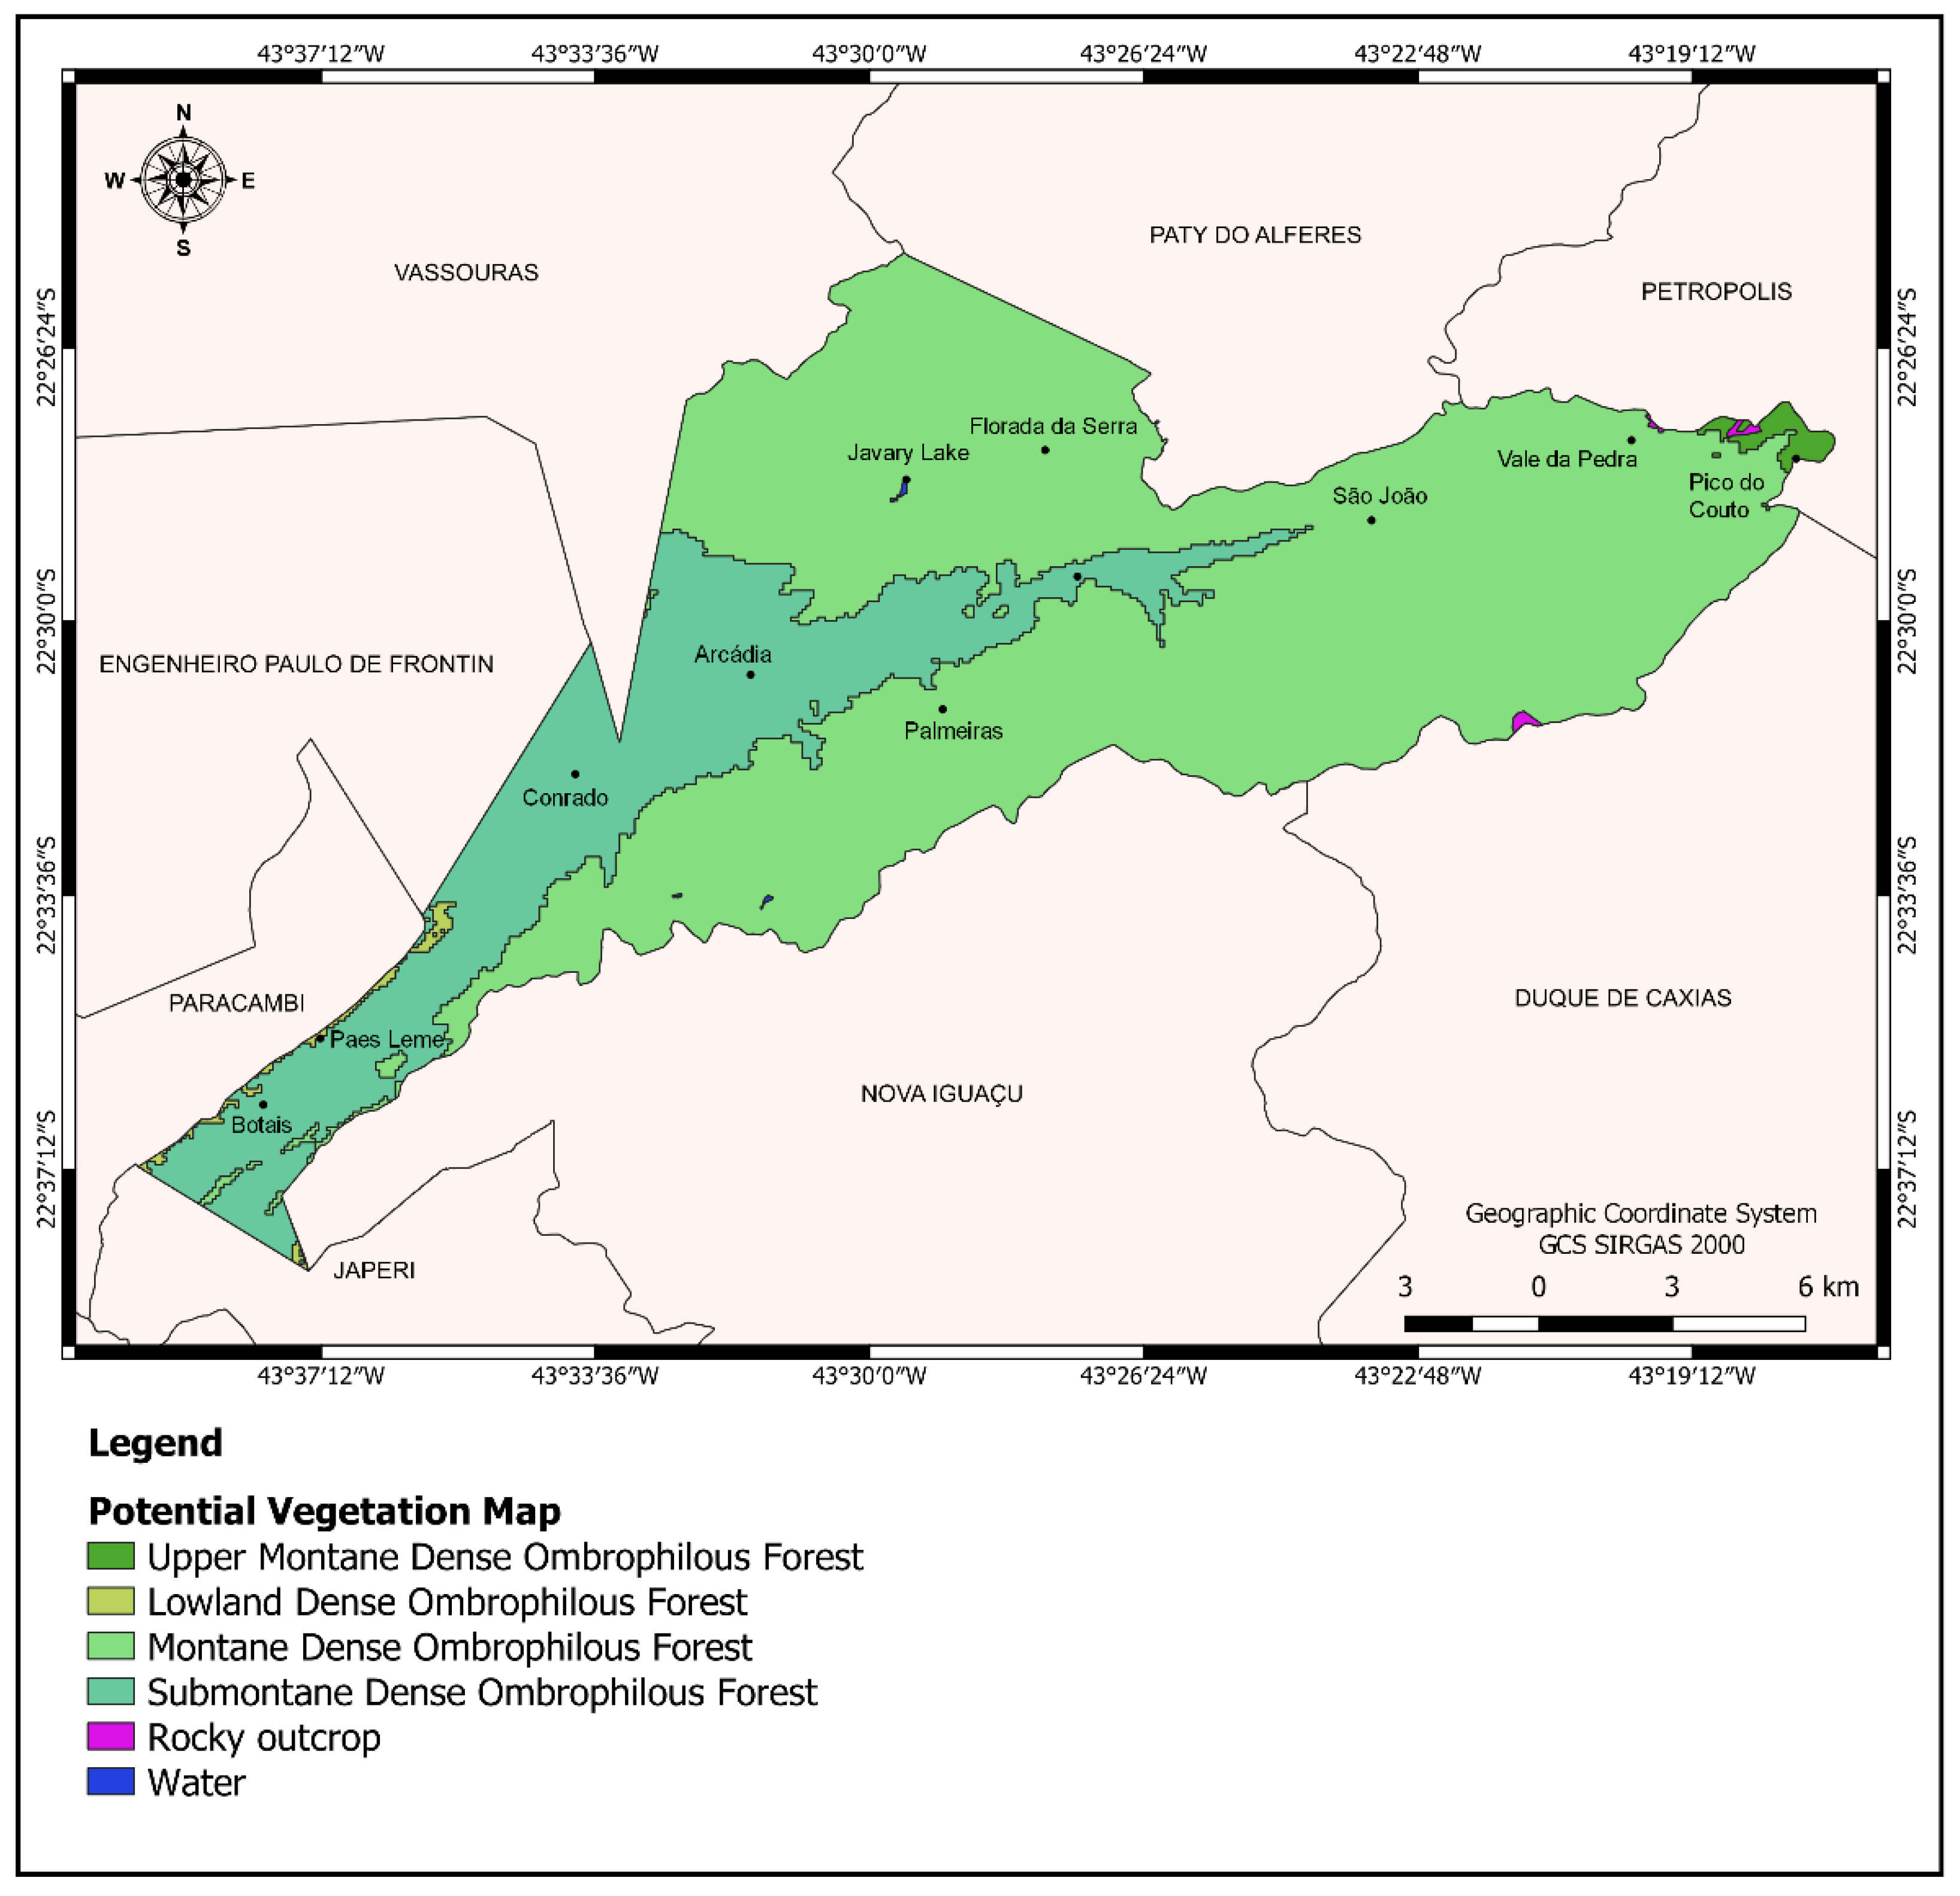
The Dense Ombrophilous Forest is subdivided into five formations, ordered according to the topographic hierarchy, which reflect different physiognomies: Alluvial Formation, Lowland Formation, Submontane Formation, Montane Formation, and Upper-Montane Formation (
Figure 3) [
50,
51]. Miguel Pereira comprises the Lowland, Submontane, Montane, and Upper-Montane formations (
Figure 4).
2.3. Land-Use
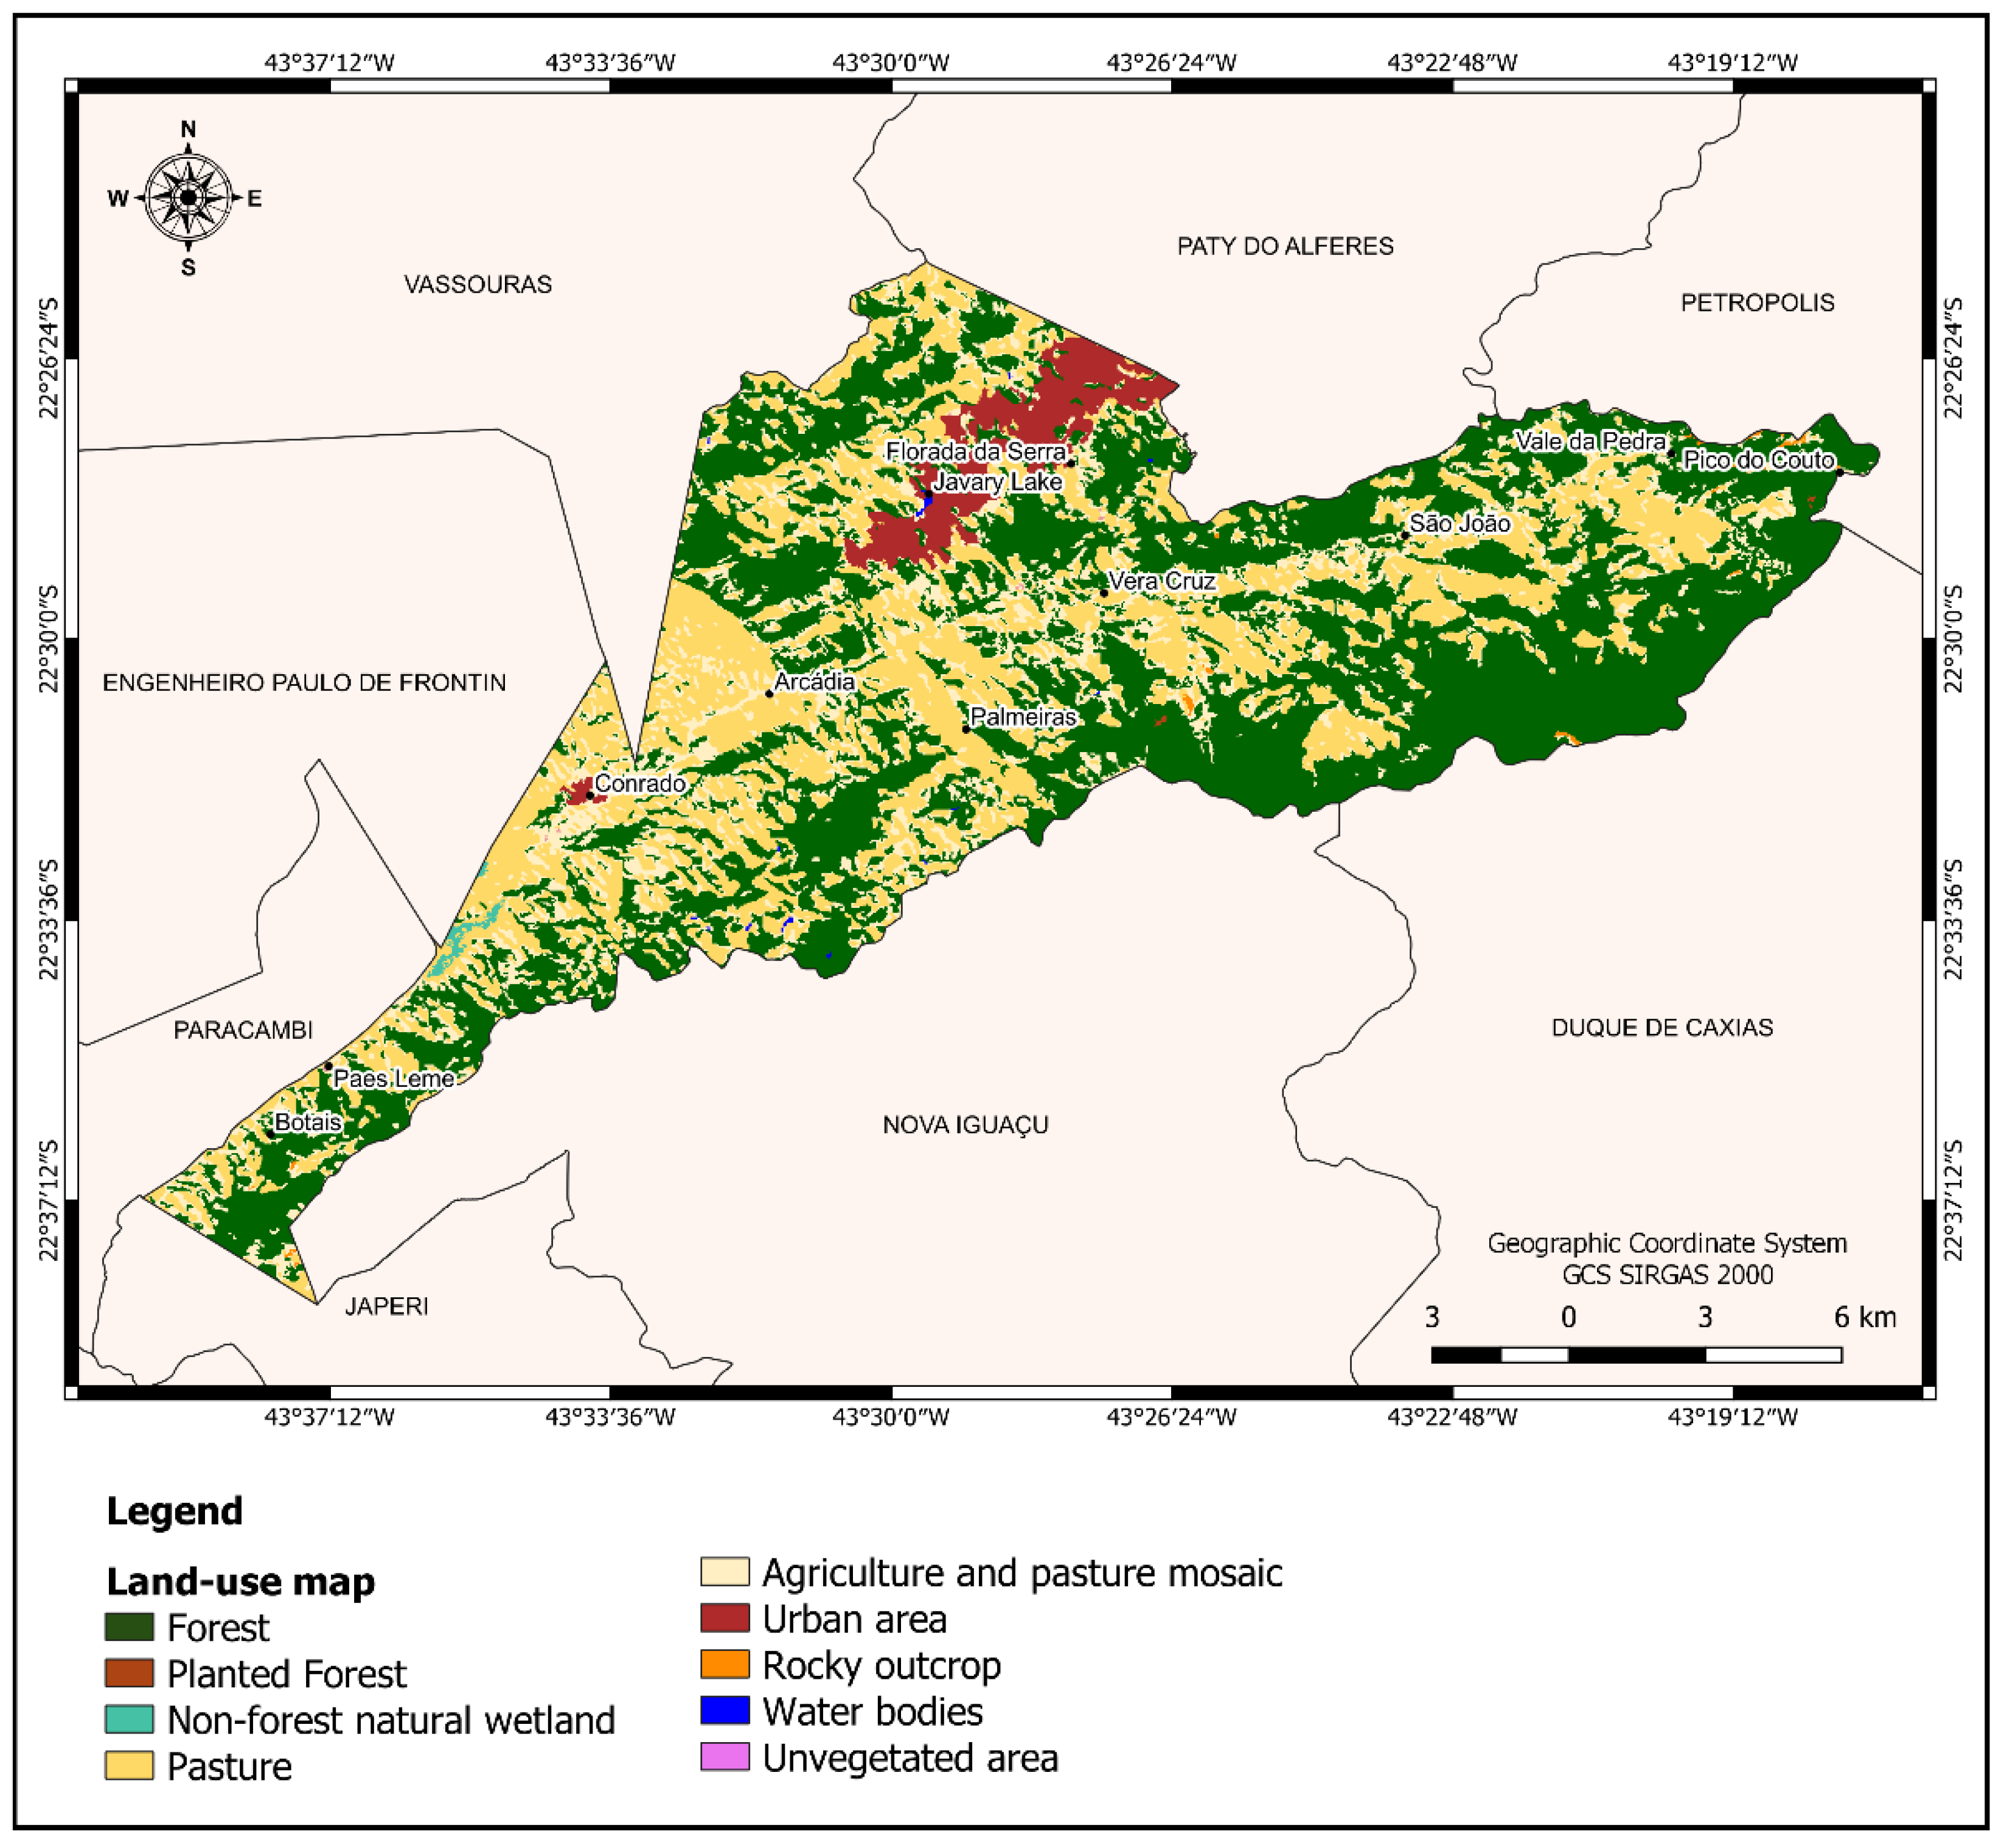
Miguel Pereira is mainly dominated by pasture and agriculture, along with forest areas (
Figure 5) [
55]. The Forest class is characteristic of the Atlantic Rainforest biome and is dominated by the Dense Ombrophilous Forest. Pastures are areas that are predominantly planted and linked to agricultural activity. The agriculture and pasture mosaic represents areas of agricultural use where it is impossible to distinguish between pasture and agriculture.
In the Urban areas, there is a predominance of non-vegetated surfaces, including roads, pathways, and buildings. They are mainly concentrated around the Javary Lake and Conrado locality. Javary Lake is the main water body in the municipality and a very touristy place. Areas of non-permeable surfaces (infrastructure, urban sprawl, or mining) not mapped in their classes are characterized by unvegetated areas in the land-use map.
Rocky outcrops are naturally exposed rocks on the land surface without soil cover, often with the partial presence of rupicolous vegetation and a high slope. Non-forest natural wetlands are areas where the vegetation has a river and/or lake influence.
3. Methods
A correlative analysis was performed between geodiversity (qualitative and quantitative maps) and other nature and anthropic elements (potential vegetation, land-use, and sites of geological interest) in Miguel Pereira municipality to understand their relationships. The quantitative map [
23] and the qualitative map were produced based on the maps of the physical environment (geology, geomorphology, soils, and hydrography) available for the area. Most of the procedures performed in this study were carried out through geoprocessing tools in the QGIS software 3.22.8. Microsoft Excel software 365 (version 2208) was used to perform the Pearson analysis (the correlation between the quantitative approach and other elements) and the correlation between the qualitative approach and other elements. Tests were performed considering different maps of vegetation and land-use to observe possible differences in the results.
A fieldwork stage in Miguel Pereira, in addition to validating the quantitative map [
23], also helped to define the geodiversity units of the qualitative map, the potentialities of and limitations to the use of each unit, and its services (also referred to as “geosystem services” [
56,
57] or “abiotic ecosystem services” [
58]), and it helped to identify potential geosites and geodiversity sites.
3.1. Geodiversity Mapping
3.1.1. Quantitative Approach
A quantitative analysis was performed in a previous work [
23] based on Pereira et al. [
12] and using geoprocessing tools (multiparts and singleparts), except for the hydrographic sub-index, which was assessed based on the drainage density analysis [
59,
60].
The maps of the physical environment available for the area (geology, geomorphology, soils, and hydrography) were overlaid by a grid (1 × 1 km cell size), and a counting procedure was performed considering the occurrences inside each cell of the grid. Multiparts and singleparts techniques were used to observe the differences between the resulting maps. The multiparts technique counted each geometry with the same attribute inside each grid cell only once. The singleparts technique considered every geometry, i.e., their repetitions were also counted. The hydrographic sub-index was obtained through the drainage density analysis, providing important information about surface runoff. Two different classifications (MOV, Maximum Obtained Value and MPV, Maximum Possible Value) were defined for each geodiversity index map obtained from each method (multiparts and singleparts) to assess possible differences in the results. MOV is the highest score in a grid cell obtained from the sum of the sub-indices, and MPV represents the maximum values that these sub-indices can reach in a cell of the grid [
23]. The geodiversity index map (
Figure 6) that best represents the geodiversity of the area was obtained through the multiparts technique using MOV classification, produced by Gonçalves et al. [
23] and used in this study to perform a correlative analysis with the geodiversity map of Miguel Pereira (qualitative approach) and other nature and anthropic elements (sites of geological interest, land-use, and vegetation).
A grid-based map consisting of 358 cells with a 1 × 1 km cell size was used instead of an isoline map, as it is more suitable for correlation purposes. The results from the quantification were normalized to values between 0 and 1 using the formula [
61]:
x = value; min (
x) = minimum value; max (
x) = maximum value.
For example, if a grid cell has a value equal to 5 (x = 5), the minimum value reached in the quantification is 1 (min (x) = 1), and the maximum value is 10 (max (x) = 10), the normalized value will be approximately 0.44.
This formula was also applied to the sites of geological interest, vegetation, and land—quantitative maps to ensure that all the indices have the same value.
3.1.2. Qualitative Approach
A geodiversity map of Miguel Pereira was created from the integrative analysis of the physical environment (geology, geomorphology, soil, and hydrology) based on the maps available for this area and complementary information obtained through fieldwork.
Geodiversity units were defined based on the concept of geodiversity [
11] and based on the method developed by CPRM to create geodiversity maps. The definition of units by the integrated analysis of the physical environment is based on a holistic and sustainability view, emphasizing the potentialities of and limitations to their use. Services provided by geodiversity were defined for each unit [
11].
The geodiversity units were defined by associating the landforms with geology, soils, and hydrology using geoprocessing tools. The geological, geomorphological, pedological, and hydrographic maps were associated using the ‘overlay’ tool. This association consisted of relating—for example, deposits of clay, sand, and gravel—Fluvent—Floodplains, or Mountains Domain—orthogneisses and migmatites—Red-Yellow Ultisol/Ochrept.
Although having an important role in the landscape modeling in the municipality, hydrology was not considered in the definition of each unit, it being important in the characterization of the units. The geomorphological units map was used as a basis to define the units, since it is the most detailed map used in this study [
15].
3.2. Geoheritage
Geological heritage, or geoheritage, consists of key locations that help to understand the Earth’s geological history and refers to in situ occurrences of geodiversity elements with high scientific value (geosites) and ex situ geodiversity elements (e.g., collections in museums). Both in situ and ex situ geoheritage can also have other values in addition to scientific value, such as educational, aesthetic, and cultural value, but only the scientific value justifies the geological heritage. Moreover, there are sites that do not have particular scientific value but are still important resources for education, tourism, or the cultural identity of communities. They can also be found in situ (geodiversity sites) and ex-situ. [
62].
An inventory of geosites or geodiversity sites did not exist for Miguel Pereira municipality, although there are sites with geological interest that can be potential geoheritage sites. These sites were identified through fieldwork while checking the validity of the maps produced through quantitative and qualitative analysis. However, as the aim of the fieldwork was not to perform an inventory of geosites or geodiversity sites, only a potential list was created. It is important to mention that not all the sites visited during the fieldwork were considered in this list, as there are many sites that show similar characteristics. Only the most relevant and accessible sites were selected to produce a map of sites of geological interest (which considers not only geology but also other geodiversity elements such as landforms).
Aiming to contribute to future methods for their inventory, values such as scientific, educational, and/or tourism values were identified for in situ occurrences of geodiversity elements in some sites. The value is closely related to the potential use of these sites [
63], which was based on the geodiversity map (qualitative assessment) and the potentialities of and limitations to each unit.
The map of sites of geological interest was used in the correlation analysis with the geodiversity index map [
23] and the geodiversity map (qualitative approach) to help understand if the distribution of these sites is influenced by the geodiversity richness, besides its relationship with the geodiversity units.
3.3. Correlation Analysis
The correlation between the quantitative map and the other maps was performed using the Pearson analysis [
64]. In this method, the results from the quantification were exported and aggregated to Microsoft Excel software, where the Pearson’s correlation coefficient was calculated:
The Pearson’s coefficient indicates if there is a statistical relationship between the data. The values are obtained between −1 and 1 and can be interpreted as shown in
Table 1.
The geodiversity map (qualitative approach) was correlated with the potential vegetation, land-use, and quantitative maps through map algebra to observe how much correspondence there is between the geodiversity units and the classes from the vegetation, land-use, and quantitative maps.
The procedure performed to produce the geodiversity index map (quantitative approach) considered the vector maps converted into grid format and obtaining quantitative values, as described in Gonçalves et al. [
23]. However, the geodiversity map (qualitative approach) is not presented in a grid format, i.e., it is not the result of a quantitative assessment, and shows qualitative classification (geodiversity units) instead of quantitative values. Therefore, the Pearson’s coefficient was not used in the correlative analysis between this map and the other nature and anthropic maps, as there are no quantitative values to perform these statistics. In this case, the Zonal Statistics algorithm was used, which calculates the statistics of a raster layer for each feature of an overlapping polygon vector layer.
The vector maps (geodiversity map, vegetation, and land-use) were converted into a raster format and reclassified by assigning unique numerical values to the different classes in the maps. The 1 × 1 km grid cell was used as a polygon vector layer, required by the algorithm and overlapping the raster layer maps. The objective of this analysis is to choose, by “majority” (statistic type), which attribute the 1 × 1 km grid cell will have. By doing this, the maps are converted into the same homogenous and correlational dimension (
Figure 7).
Sites of geological interest were correlated with the geodiversity map by identifying the number of sites occurring in each unit.
4. Results
4.1. Qualitative Approach
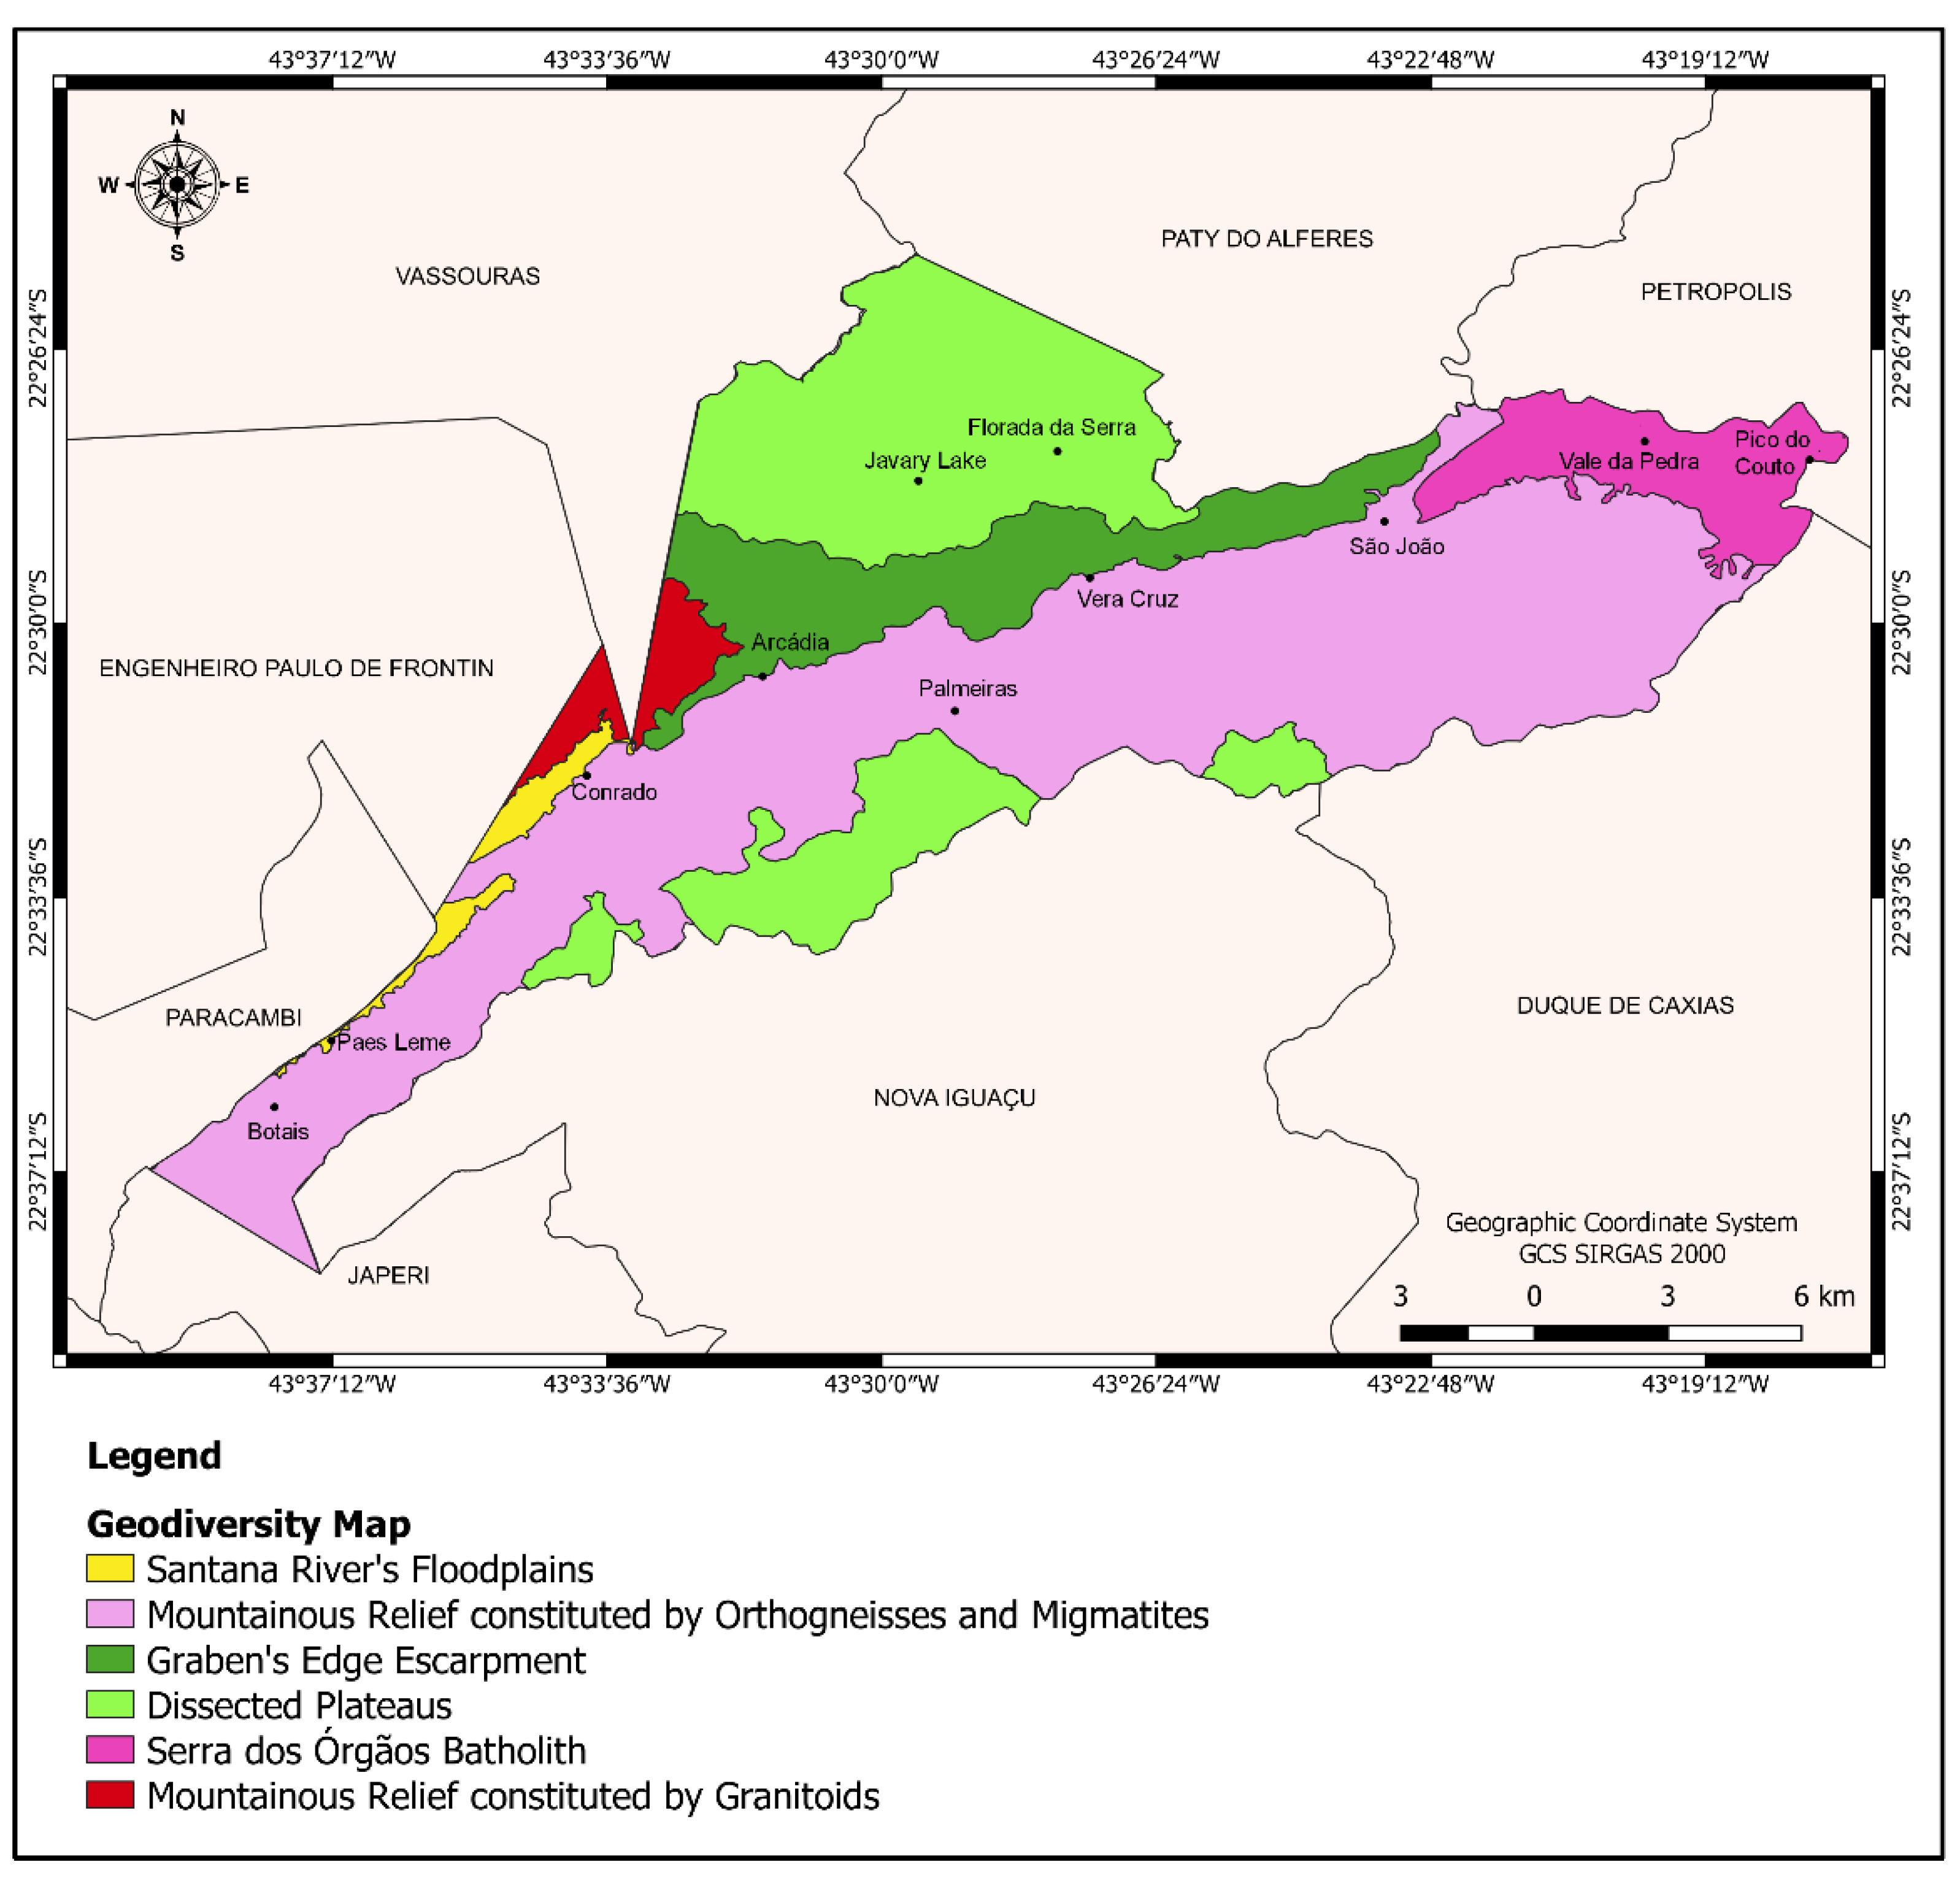
The geodiversity map produced through the qualitative approach is characterized by six geodiversity units (
Figure 8) representing the integrative analysis of the abiotic elements and the definition of the potentialities of and limitations to the use of each unit and its respective abiotic services (
Table 2). Hydrography was not included in the table, as it was used only in the characterization of the units.
The compartmentalization of the area in geodiversity units is useful in terms of territorial planning and management, since it is possible to observe the potentialities of and limitations to the use of each unit, in addition to its services.
4.2. Geoheritage
The delimitation of geodiversity units was also important for the identification of sites of geological interest in Miguel Pereira municipality during the fieldwork, which were assigned values such as scientific, educational, and/or tourism (
Figure 9).
Important sites were identified, which can be potential geosites and/or geodiversity sites in a future inventory (
Figure 10). The most important site is the one showing a mylonitised rock associated with the Central Tectonic Boundary (CTB). This site has scientific value, as the suture helps to understand the amalgamation of Gondwana. Another relevant site is the two-level fluvial terrace occurring in the Conrado locality, which has educational value to study geodiversity on a local scale, besides the observation of triangular facets in the surrounding areas with a higher slope. Moreover, the diabase dyke with spheroidal exfoliation associated with the Serra do Mar Dyke Swarm (SMDS) can be found in a site close to Conrado, where values such as educational and tourism values (presence of a waterfall) were identified.
4.3. Correlative Analysis: Quantitative Approach
After performing tests considering land-use and vegetation maps from different sources, besides the sites of geological interest, the Pearson’s correlation coefficient did not demonstrate a significant correlation with the geodiversity index map.
The vegetation map [
54] and land-use map [
55] were considered to produce the final correlation results (
Table 3). The land-use map had a weak correlation (0.305), while the sites of geological interest and vegetation had a very weak correlation (0.126 and 0.102, respectively). However, the statistical analysis demonstrated a positive correlation between the maps.
The relationship between vegetation and geodiversity richness, even if very weak, demonstrates a positive relationship. However, limited data were used regarding biodiversity, restricted only to potential vegetation data, which are not sufficient to understand the full geodiversity–biodiversity relationship. The use of a potential vegetation map, instead of a real state vegetation map, can also influence the statistical analysis. The sites of geological interest also had a very weak correlation with vegetation and land-use, albeit a positive correlation.
Geodiversity provides support for human activities and, depending on the place, also prevents use (such as high-slope areas, for example). The land-use map shows a greater correlation with the geodiversity index map in comparison with the other maps, demonstrating a positive relationship between geodiversity and the use and occupation of land, even if this relationship is weak.
4.4. Correlative Analysis: Qualitative Approach
The percentage of each of the classes of the land-use, vegetation, and geodiversity index maps is presented in
Figure 11. The correlation between the qualitative approach and the other maps can be observed in
Figure 12, which shows bars representing the percentage of the quantification of overlaid features in the geodiversity units considering the grid maps produced through zonal statistics analysis.
Although the class “Very High” is the class with less occurrence in the quantitative map (1.68%), it occurs entirely in the “Mountainous Relief constituted by Orthogneisses and Migmatites” unit in the qualitative map. The class “Medium” is the most abundant in the geodiversity index map (37.71%), having a greater concentration in the same unit mentioned before. Most of the “High” class that occurs in the quantitative map is concentrated in the same unit. So, it was observed that Miguel Pereira municipality has medium geodiversity (
Figure 11b) and concentrates all the “Very High” and most of the “High” geodiversity areas from the geodiversity index map (quantitative approach) in the “Mountainous Relief constituted by Orthogneisses and Migmatites” unit.
Miguel Pereira is mostly dominated by Montane Dense Ombrophilous Forest (72.63%), which has a greater occurrence in the “Mountainous Relief constituted by Orthogneisses and Migmatites” unit in the geodiversity map. This type of vegetation occurs in high topography, which is in accordance with this unit, mainly characterized by a mountainous relief. The Upper Montane Dense Ombrophilous Forest is situated entirely in the “Serra dos Órgãos Batholith” unit, which is also in accordance with this type of vegetation that occurs in the highest topography.
The Submontane Dense Ombrophilous Forest has also a greater occurrence in the “Mountainous Relief constituted by Orthogneisses and Migmatites” unit. However, this unit is mostly dominated by the Montane Dense Ombrophilous Forest. The Lowland Dense Ombrophilous Forest has less of an occurrence in the municipality (1.12%) and can be found in both the “Mountainous Relief constituted by Orthogneisses and Migmatites” and “Santana River’s Floodplains” units. This type of vegetation is associated with low topography. The “Santanta River’s Floodplains” unit is composed of Lowland Dense Ombrophilous Forest and Submontane Dense Ombrophilous Forest.
The “non-forest natural wetland” class in the land-use map is entirely situated in the “Santana River’s Floodplains” unit, which is in accordance with the characteristics of the unit regarding the potentialities (such as agricultural activities) and limitations (floods in the plains) of the use, as well as associated services. The “urban infrastructure” class occurs entirely in the “Dissected Plateaus” unit, which is mostly dominated by Forest. This unit has the potential for urban occupation and agriculture in low-lying areas and limitations associated with sliding in some places of greater slope that have urban occupation.
Most of the Forest class occurs in the “Mountainous Relief constituted by Orthogneisses and Migmatites” unit, and both the “pasture” and “agriculture and pasture mosaic” classes have a greater occurrence in the same unit, which has the potential for agricultural activities in low-lying areas. Overall, Miguel Pereira is mostly dominated by Forest (60.34%) and Pasture (29.89%), which, together, represent 90.23% of the territory.
Most of the sites of geological interest occur in the “Graben’s edge escarpment” (four sites) and “Mountainous Relief constituted by Orthogneisses and Migmatites” (three sites) units. These units have a variety of potentialities of and limitations to the use in association with services such as knowledge, cultural, provisioning, and supporting services. A site is located in the “Santana River’s Floodplains” unit, which has the potential for educational, scientific, and agricultural activities, providing services such as knowledge, supporting, and provisioning services. In this site, we can observe the use of terraces for agricultural activities. The “Dissected Plateaus” unit has the potential for tourist activities providing cultural services. A site located in this unit is related to a potential viewpoint in Lago do Javary.
5. Discussion
The geodiversity map (qualitative approach) was a product of this work and represented an adaptation of the methodology developed by the Geological Survey of Brazil (CPRM). In addition to the potentialities and limitations already presented on the maps from CPRM, ecosystem services provided by geodiversity were also defined for each geodiversity unit, representing a novelty for more detailed scale geodiversity maps. This addition also contributes to incorporating abiotic diversity into the ecosystem services research, which is an important factor to consider in land management and nature conservation policies [
65].
Despite the difference in the scale of the maps (geology, geomorphology, hydrography, and soils), the geodiversity map represents a clear response to the integration of abiotic elements, showing the different potentialities and limitations of each unit, as well as indicating possible uses such as urban occupation, tourist activities, and others. For example, Miguel Pereira has areas suitable for the development of urban settlements where there is less slope and relief amplitude (hills). On the other hand, areas with high slopes or areas subject to flooding are a limitation to urban occupation.
Although the relationship between the geodiversity index map and the other elements demonstrated a weak and very weak correlation using the Pearson’s coefficient, this relationship was positive. Peixoto [
61] also performed a correlation analysis between geodiversity and other elements (the land-use map was not used), and the author obtained the same positive correlation with biodiversity and geoheritage. However, only vegetation data were available for Miguel Pereira municipality, which was the only biotic feature considered in the present work. Additionally, the potential vegetation map shows only two dominant classes (Upper Montane and Montane Dense Ombrophilous Forest), which can influence the statistical analysis results showing this very weak correlation. The geodiversity–biodiversity relationship is already demonstrated in various works [
28,
29,
30,
31,
32,
33]. More studies need to be performed to understand this relationship more deeply.
The relationship between geodiversity and land-use was already explored in a previous study [
21] which demonstrated that urban growth significantly impacted areas with high and very high geodiversity in a coastal area in Brazil (Armação dos Búzios municipality). As observed in the correlative analysis, this relationship is weak but positive, demonstrating that there is a connection between these elements. This is closely related to the importance of geodiversity in providing services for society (land and water as a platform for human activity, soil processes, mineral resources, and others), as already demonstrated in previous studies [
65,
66,
67]. As showed by Reverte et al. [
63], human actions can alter the availability of local services and influence the quality of life of certain species.
Considering the relationship between the sites of geological interest identified in the study area and the geodiversity index map, we observed that this relationship is positive but very weak. High geodiversity areas are not necessarily related to the occurrence of sites with high scientific value, and low geodiversity areas can have important geodiversity occurrences [
21], as different methodologies are used to assess geodiversity and to perform a geological inventory. In this study, the geodiversity richness does not influence the distribution of the sites of geological interest. However, geodiversity constitutes the backbone of geoheritage and geoconservation, and geoheritage represents those specific elements of geodiversity that have importance/value and are selected for geoconservation [
68].
The geodiversity map (qualitative approach) demonstrated a coherent relationship with the other elements considered in this study (geodiversity index map, vegetation, land-use, and the sites of geological interest). The “Very High” class from the geodiversity index map occurs entirely in the “Mountainous Relief constituted by Orthogneisses and Migmatites” unit, where most of the “High” class also occurs. This unit is characterized by providing a greater quantity of abiotic services than the other units (four services—cultural, knowledge, supporting, provisioning) and a variety of potentialities for the use of the unit (such as tourism and educational activities, the use of water resources, ecotourism, environmental conservation, and scientific research).
The types of vegetation of Miguel Pereira municipality are related to the topography and are well correlated with the geodiversity units of the geodiversity map. The Montane Dense Ombrophilous Forest is the most abundant and is related to high topography areas, having a greater occurrence in the “Mountainous Relief constituted by Orthogneisses and Migmatites” unit. This may be related to the use of a geomorphological map as a basis to define those units. Santos et al. [
15] also observed a good correlation between the vegetation types and the geodiversity map of Armação dos Búzios municipality, showing that each geodiversity unit is occupied by specific vegetation types. However, the availability of data on the biodiversity of Miguel Pereira is necessary for future studies in order to better understand the relationship between habitat/species diversity and geodiversity in the study area.
The relationship between the geodiversity units of the geodiversity map and the land-use is also highlighted, showing that the potentialities of and limitations to the use of some units provided complementary information and were in accordance with classes from the land-use map. Thus, the map produced through the qualitative approach can be a useful tool for land management studies, as already demonstrated by the geodiversity maps produced by CPRM.
The relationship between the sites of geological interest in the study area and the geodiversity units is noticeable. This was already expected, as these sites and their values (scientific, educational, tourism) were identified based on the potentialities and limitations of the geodiversity units and their associated services. Most of the sites are concentrated in the “Graben’s edge escarpment” and “Mountainous Relief constituted by Orthogneisses and Migmatites” units, occurring close to the Santana River valley, which is associated with the CTB. As demonstrated, potential geosites/geodiversity sites were identified, such as a relevant site associated with the CTB in the “Mountainous Relief Constituted by Orthogneisses and Migmatites” unit, which is important from scientific and educational points of view. Another relevant site is the one located in Conrado in the “Santana River’s Floodplain” unit. This site is interesting from an educational point of view; we can observe two-level river terraces, plane-parallel stratification at the edges of the terrace, and the presence of triangular facets on the higher slope relief. Therefore, values were identified in some visited sites based on the services and the potentialities and limitations of the use of the geodiversity units, which can establish a link with the type of use of those sites [
11,
14]. A future site inventory is encouraged, aiming to contribute to geoconservation strategies [
62].
The map produced through the qualitative approach best supported the correlative analysis with the other nature and anthropic elements in Miguel Pereira municipality. This endorses the use of geodiversity maps for land management and nature conservation [
15], highlighting the potentialities of and limitations to the use of the geodiversity units. Geodiversity as a whole is not very considered or not considered at all in land use and nature conservation strategies and policies in Brazil. There are some cases regarding the inclusion of geodiversity in the creation of Conservation Units in the State of Rio de Janeiro, e.g., the creation of the Costa do Sol State Park (Full Protection Conservation Unit) in Armação dos Búzios municipality. However, the best example is the creation of the Natural Monument of Maria Comprida Mountain, aiming to enhance the scenic beauty and geodiversity of the region and protecting rocky outcrops, mountains, peaks, and summits, especially the Maria Comprida Mountain, a prominent geosite in Serra do Mar and one of the most notable in Petrópolis municipality [
69].
In some countries, much progress has been made on the issue of geoconservation, but even there, geodiversity has not yet proven to be a tool for land use planning. The large literature produced on the assessment and graphic representation of geodiversity has also failed to demonstrate this use for geodiversity. Hence, the identification of ecosystem services provided by geodiversity may be a key step in geodiversity assessment and in the production of information that may be useful for this purpose. The insertion of the services provided by geodiversity for each unit contributed significantly to the qualitative approach presented here. For land use planning purposes, cartographic information with the geographic distribution of services and their importance will be more relevant than the geographic distribution of geodiversity indices. Nevertheless, the geodiversity index map (quantitative approach) can offer complementary information about the geodiversity richness along the units and can be a complementary product, especially when considering its relationship with biodiversity, as demonstrated by previous studies.
6. Conclusions
This work aimed to determine the relationship between geodiversity and other nature and anthropic elements based on a correlative analysis, considering the main methods of geodiversity assessment and the application of geodiversity maps in land management and nature conservation studies.
Geodiversity correlated more with the sites of geological interest, land-use, and vegetation through the qualitative assessment, even if the quantitative assessment revealed a positive correlation with these elements. The geodiversity map (qualitative approach) best supported the correlative analysis in the study area, showing that this kind of map has good potential to be used in the context of land management and nature conservation, representing an integrated analysis of the physical environment on a holistic and sustainability basis. On the other hand, the very weak and weak correlations between the geodiversity index map and the other elements show that further studies are necessary regarding its potential use. This adds a new discussion to the efforts on geodiversity studies, namely, if the quantitative assessment of geodiversity could have more sustained results and applications if the approach were qualitative or combined qualitative and quantitative methods.
The correlative analysis between the qualitative and quantitative approaches showed that these assessment methods could be complementary in the context of Miguel Pereira municipality, mainly in the identification of high geodiversity areas along the geodiversity units. In addition to the definition of potentialities of and limitations to the use of each unit, the inclusion of ecosystem services brought the possibility of further enriching the product and represents an innovative approach regarding the production of more detailed scale geodiversity maps in Brazil (municipality scale), besides contributing to the identification of sites of geological interest. However, a detailed inventory in the study area should be considered for geoconservation efforts.
These results endorse the use of geodiversity mapping in nature conservation and land management policies and highlights the utility of geodiversity maps through qualitative approaches, especially in relation to the identification of potential geosites and geodiversity sites. Accordingly, it is expected that the results obtained in this work contribute to the incorporation of geodiversity into environment management and conservation strategies and to the discussion of the application of geodiversity maps for these purposes.


