


Time-Series Variation of Landslide Expansion in Areas with a Low Frequency of Heavy Rainfall

1
Hokkaido Research Organization, Sapporo 060-0819, Japan
2
Institute of Life and Environmental Sciences, University of Tsukuba, Tsukuba 305-8572, Japan
*
Author to whom correspondence should be addressed.
Geosciences 2023, 13(10), 314; https://0-doi-org.brum.beds.ac.uk/10.3390/geosciences13100314
Submission received: 20 August 2023
/
Revised: 3 October 2023
/
Accepted: 12 October 2023
/
Published: 18 October 2023
(This article belongs to the Special Issue Soil Erosion and Shallow Landslides: Prediction of the Phenomena and Measures of Sediments Delivery)
Abstract
:After multiple simultaneous landslides caused by heavy rainfall, expanding landslides continue to occur for a certain duration. Evaluation of the influencing period of sediment yield due to expanding landslides is vital for comprehensive sediment management of the basin. In this study, we investigated a region with a low frequency of heavy rainfall that has not received its due level of attention until now. Consequently, the transition of expanding landslides depends on the transition of the number of remaining landslides, based on the difference in the frequency of heavy rainfall. Furthermore, the transition of expanding landslides depends on the maximum daily rainfall after the landslides. These findings indicate that “the number of remaining landslides” and “maximum daily rainfall after a landslide” are related factors that determine the period during which expanding landslides frequently occur. An estimation formula based on elapsed time was developed to calculate the number of remaining landslides. An empirical formula for the number of expanding landslides was obtained by multiplying the function of the daily maximum rainfall after the landslide by the estimation formula for the number of remaining landslides. The developed empirical formula can be used effectively for evaluation during periods when rainfall-induced landslides are subject to subsequent expansion.
1. Introduction
Recently, comprehensive watershed sediment management has been promoted from the viewpoint of a sediment transport system, which is inclusive of the mountain watershed to the sea area as a single system. The sediment supplied from the mountain slope is temporarily deposited into the basin and then flows downstream due to rainfall and other factors. In particular, when earthquakes and heavy rainfall cause multiple simultaneous landslides, sediment runoff occurs downstream over a longer duration [1,2,3], causing damage to houses and infrastructure in downstream areas. Therefore, it is vital to understand sediment dynamics as a sediment transport system after large-scale sediment supply events, such as earthquakes or heavy rainfall [4].
In addition to the re-movement of the sediment produced during large-scale sediment supply events and deposition in river channels [5], it is important to survey the sediment supply to river channels from their slopes after earthquakes and heavy rainfall events. It has been revealed that high sediment production continues on the slopes around landslide areas, such as in the frequent occurrence of new landslides due to the destabilization of slopes caused by previous landslides [6]. Recently, Samia et al. [6] defined the path dependency of landslides as a situation in which a landslide is likely to occur for a set period after its occurrence. In addition, on slopes where hard soil and weathered bedrock are exposed to earthquakes and heavy rain, sediment runoff may continue, owing to surface erosion, until the vegetation recovers [7,8]. Therefore, to evaluate the sediment runoff from the landslide slope to the river channel after an earthquake or heavy rainfall, it is necessary to consider both the expansion of the landslide and the recovery of vegetation after its occurrence.
Regarding the expansion of the landslide area after the occurrence of earthquake-induced landslides, it has been reported that the expansion of landslides often occurs after aftershocks [9] or when the post-earthquake rainfall intensity is relatively weak [10,11]. Khattak et al. [12] reported that the expanding landslide area recorded during the two years following the 2005 earthquake in Pakistan was approximately 9% of the landslide area at the time of the earthquake. Li et al. [13] reported that the expansion of the area corresponding to approximately 33% of the original landslide occurred two years after the 2008 Wenchuan earthquake. In addition, Li et al. [13] reported that the percentage of expansion of the landslide areas confirmed after 8 years was 5%. Therefore, the actual conditions of the expanded landslide area on the landslide slope that was caused by the earthquake were clearly quantified. On the other hand, with regard to rainfall-induced landslides, fewer studies have focused on the continuous monitoring of expanding landslides, compared with those related to earthquake-induced landslides [14,15,16].
Regarding the recovery of vegetation on the landslide slopes, the period during which the soil layer recovers or the period during which the landslide continues to exist as a “bare slope” has been reported for landslides caused by earthquakes or heavy rainfall [17,18,19,20]. In some cases, the recovery rate of the soil layer in the landslide area was relatively fast in the early stages after the landslide and later decreased. For example, Shimokawa [17] reported that 250 years after the occurrence of a landslide on steep slopes (30–40°) in southern Japan, the thickness of the soil layer increased to approximately 80 cm. The soil layer growth rate was the fastest at approximately 2.7 mm/y for the first 150 years and then decreased to approximately 1.8 mm/y. Furthermore, the rate of vegetation recovery has been quantitatively evaluated over several decades, based on the interpretation of aerial photographs and normalized difference vegetation index analysis using satellite images (e.g., [21,22,23,24]). Lin et al. [21] examined the vegetation recovery of landslide areas caused by the Chi-Chi earthquake and found that vegetation recovered in 28% of the landslide area one year after the earthquake and in 60% of the landslide area two years after the earthquake. In addition, Shou et al. [22] showed that there was vegetation recovery in 90% of landslides 10 years after the Chi-Chi earthquake. Furthermore, Hovius et al. [23] and Liu et al. [24] reported that typhoon attacks after an earthquake significantly slowed vegetation recovery. Based on these facts, it is considered probable that vegetation recovery in landslide areas is controlled by the time that has elapsed since the occurrence of landslides and rainfall conditions after the landslides.
As described above, slopes that exhibit landslides due to heavy rain or earthquakes are affected by rainfall, but the expansion of landslide areas shrinks over time, and vegetation is recovered in the bare areas of landslide areas. In other words, it is thought that slopes on which landslides occur because of heavy rainfall or earthquakes will return to their original state from before the heavy rainfall or earthquakes. However, few studies have concurrently addressed both landslide expansion and vegetation recovery after landslides. In particular, there have been insufficient studies on variations in landslide expansion by considering the transition of landslides due to vegetation recovery (transition of the remaining landslides).
Furthermore, several studies that investigated the expansion process of landslides caused by heavy rainfall were conducted in areas with a high frequency of heavy rainfall [14,15,16]; however, studies on areas with a low frequency of heavy rainfall are limited. The number of expanding landslides depends on the number of landslides (the remaining landslides) occurring in a basin. It is believed that the number of landslides in areas with a low frequency of heavy rainfall is smaller than that in areas with a high frequency; however, the number of landslides increases once heavy rainfall occurs. In other words, areas with a low frequency of heavy rainfall show larger transitions in terms of the number of landslides than areas with a high frequency, and it is thought that the transitions in expanding landslides are also large. However, the actual situation is not clear.
In addition, it has not been sufficiently clarified whether the expanding landslide depends not only on the influence of the remaining landslide but also on the elapsed time after the landslide or, alternatively, on rainfall intensity. This investigation also provides useful information for areas that have not yet been affected by heavy rainfall but that are likely to be affected by heavy rainfall due to future climate change.
Therefore, in this study, we analyzed the characteristics and factors of transitions in expanding landslides in regions where the frequency of heavy rainfall is low. In addition, the transition of expanding landslides is thought to be dependent on the transitions of the remaining landslides. We estimated the number and area of the remaining landslides over time. Furthermore, we examined the influence of the original landslide area, as it is a determining factor for the number and size of the subsequent landslides.
Based on the gaps in the literature mentioned above, the study objectives were to analyze the characteristics and factors associated with the transition of expanding landslides in areas with a low frequency of heavy rainfall. In addition, the study aimed to evaluate the period of impact of expanding landslides, considering the transition of the remaining landslides. The Saru River Basin in Hokkaido was selected as the region of Japan with the lowest frequency of heavy rainfall events. The most significant heavy rainfall event occurred in this region in 2003. Based on the available data regarding the subsequent expansion and vegetation recovery of the landslide caused by this heavy rainfall, we investigated the expansion and vegetation recovery of landslides that occurred in this area at different times over the past 50 years.
2. Study Site
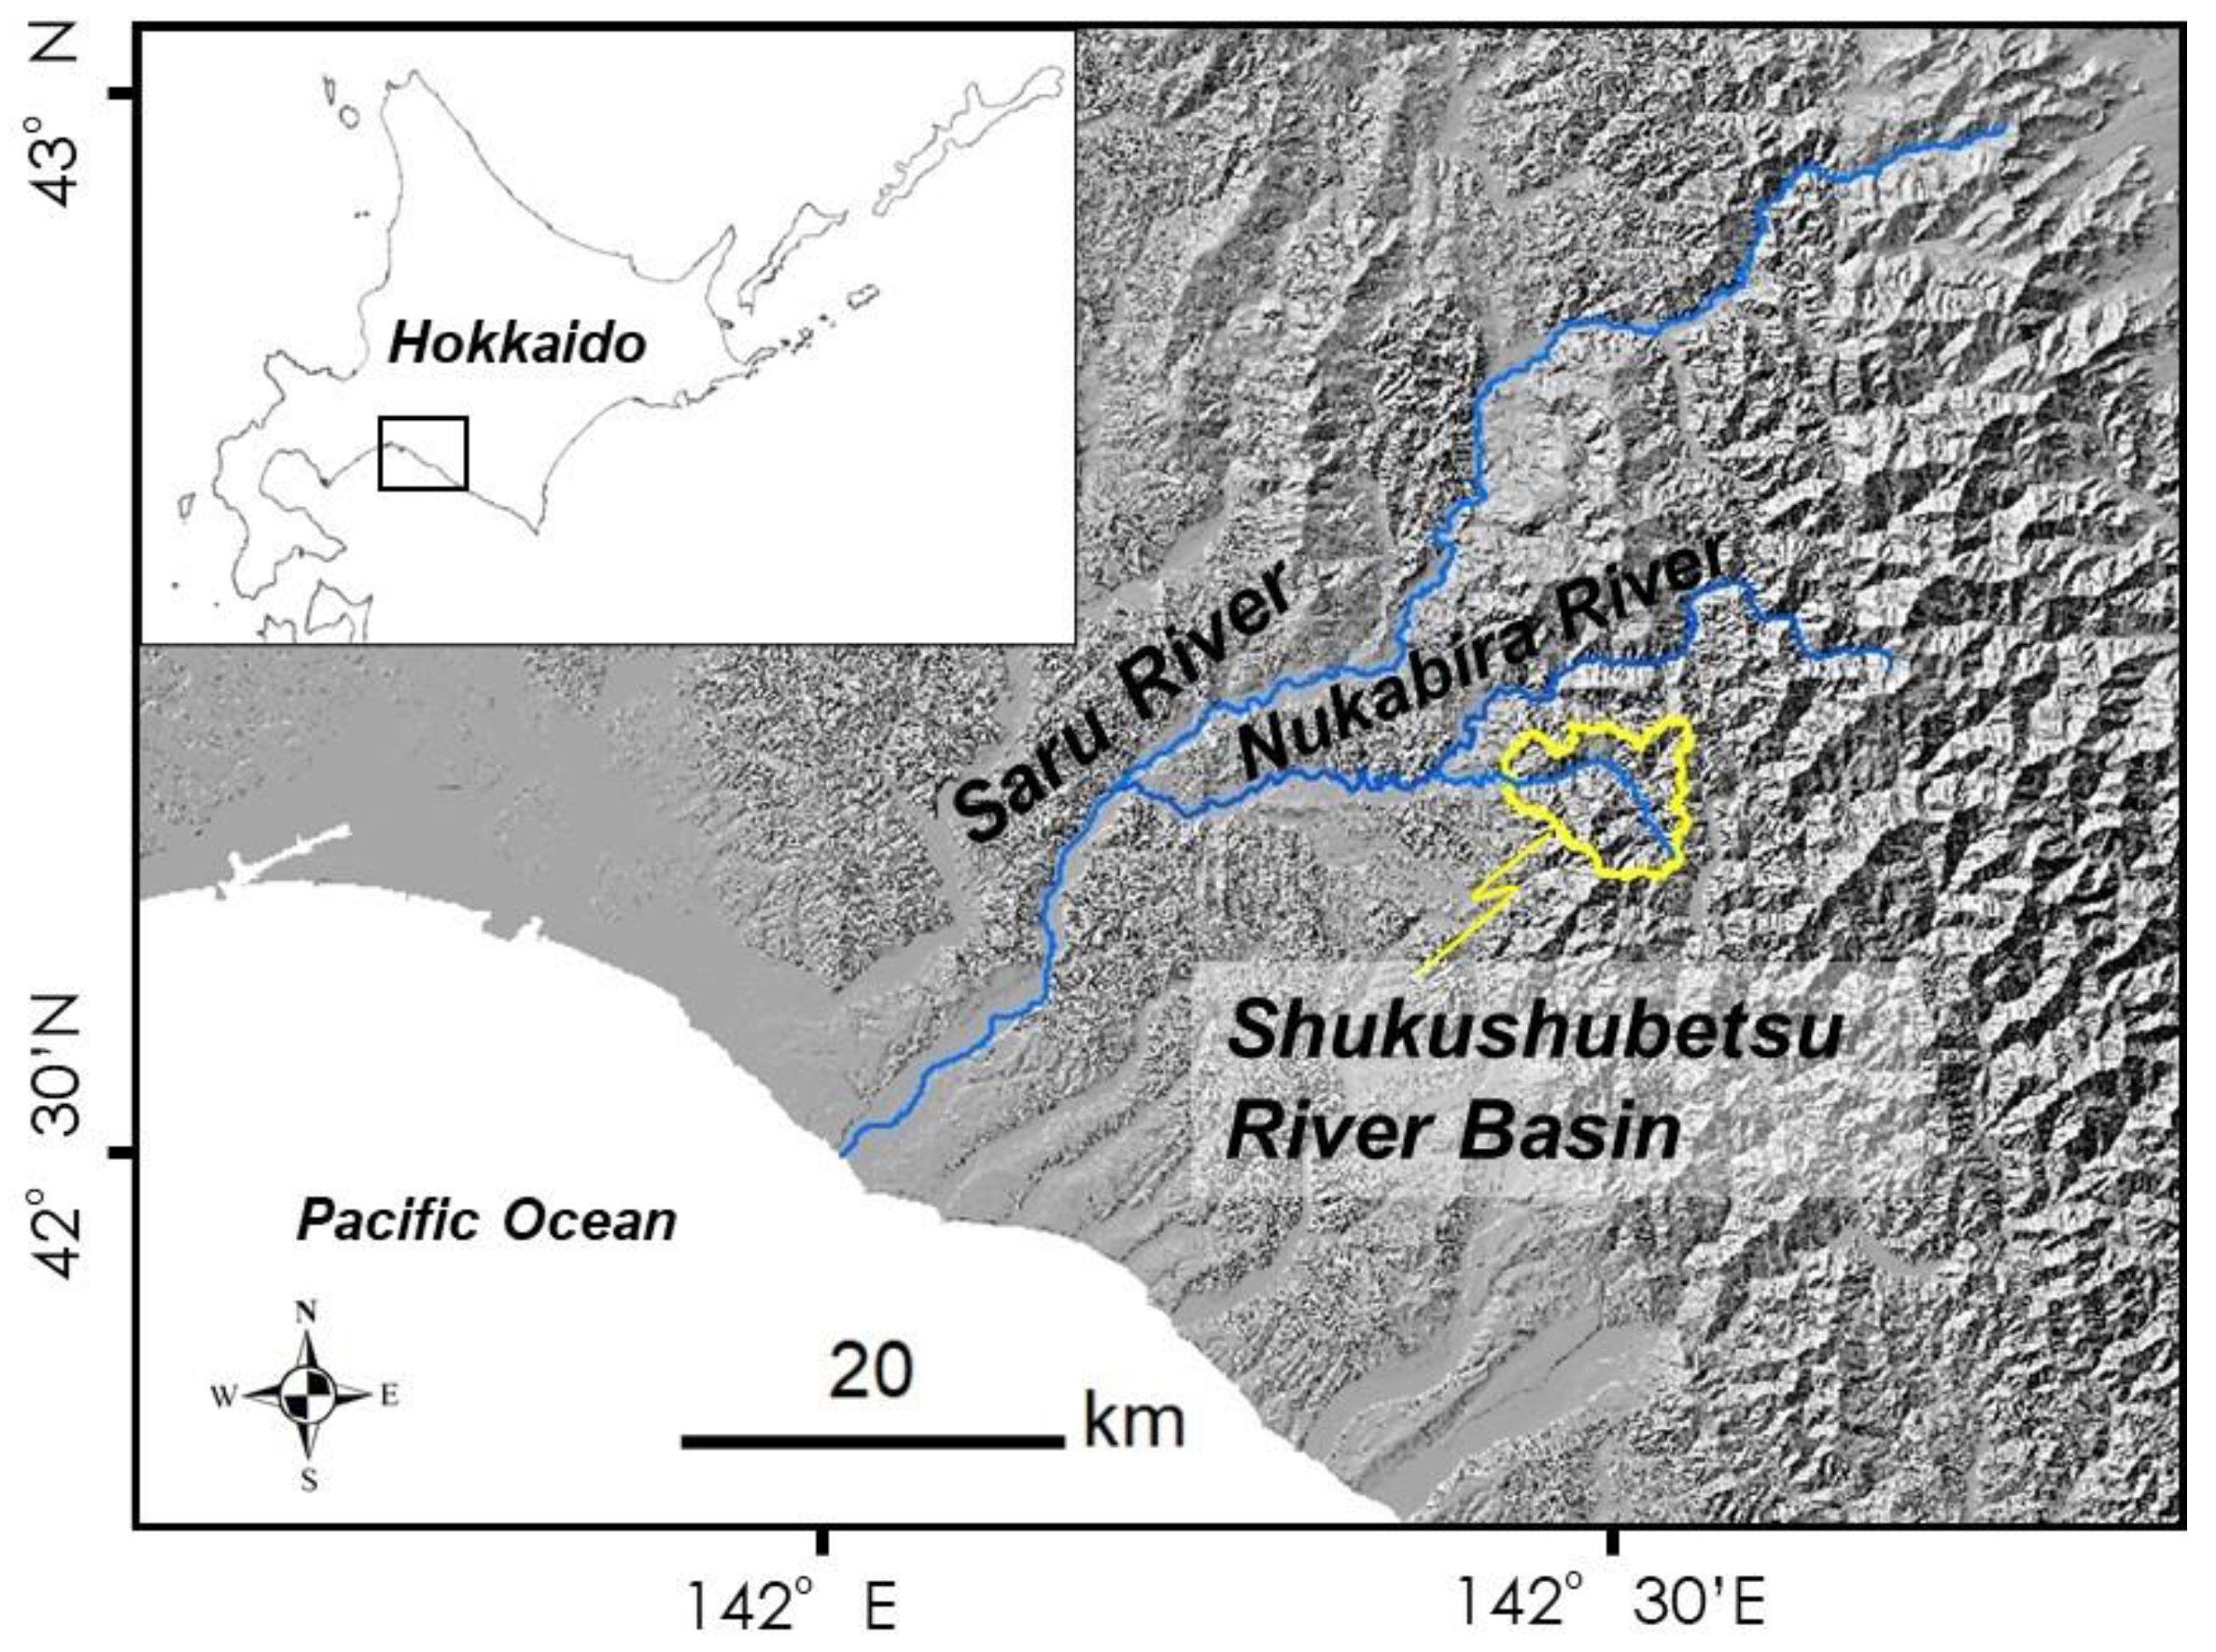
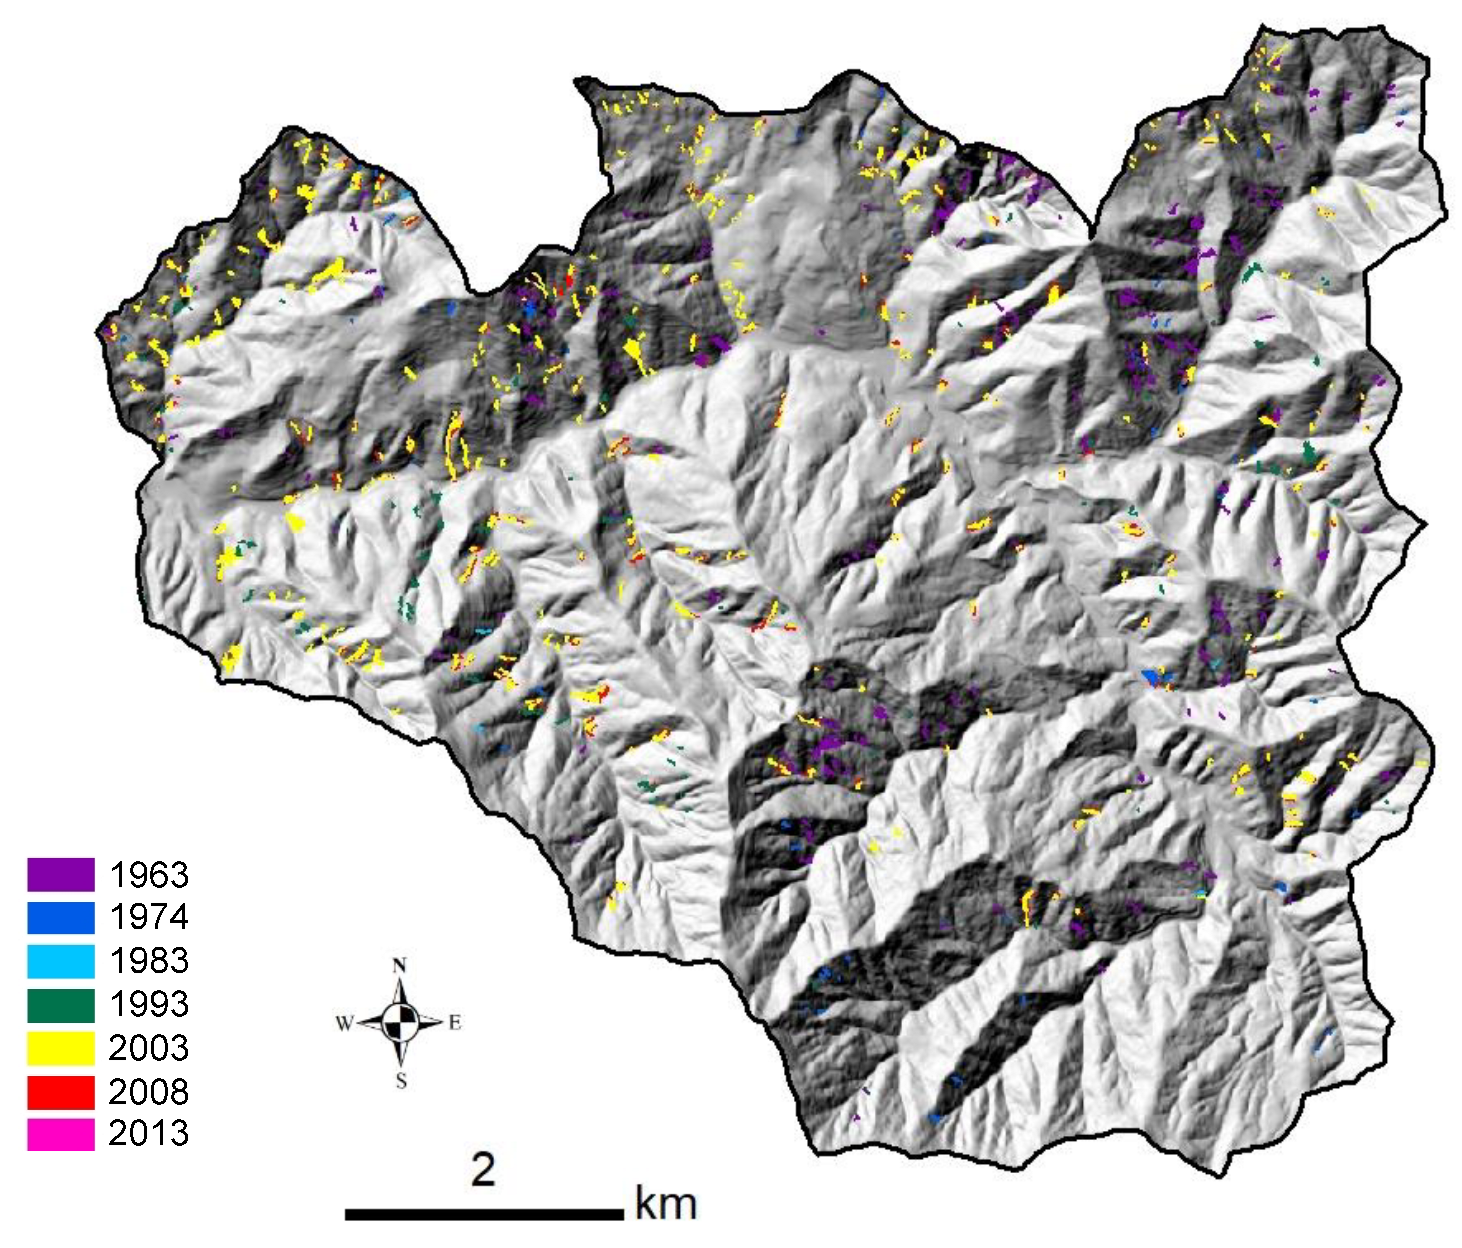
The study area comprises the Shukushubetsu River Basin, a tributary of the Saru River, located in the western part of the Hidaka Mountains in central Hokkaido (Figure 1). The Shukushubetsu River Basin covers an area of 54 km2 (Figure 1). The elevation of the area ranges from 145 to 1317 m above sea level. The average slope gradient calculated from the 10 m DEM was 28.5°. The study area is in the Kamuikotan Zone and consists primarily of Late Cretaceous sedimentary rocks (sandstone, siltstone, and mudstone) (16 km2) and basalt blocks, which are accretionary complexes from the Late Jurassic–Early Cretaceous (35 km2) [25]. The vegetation in the study area has been partially transformed into an afforestation site for Abies sachalinensis and Larix kaempferi, but most of the vegetation is covered with a natural mixed coniferous forest [26].
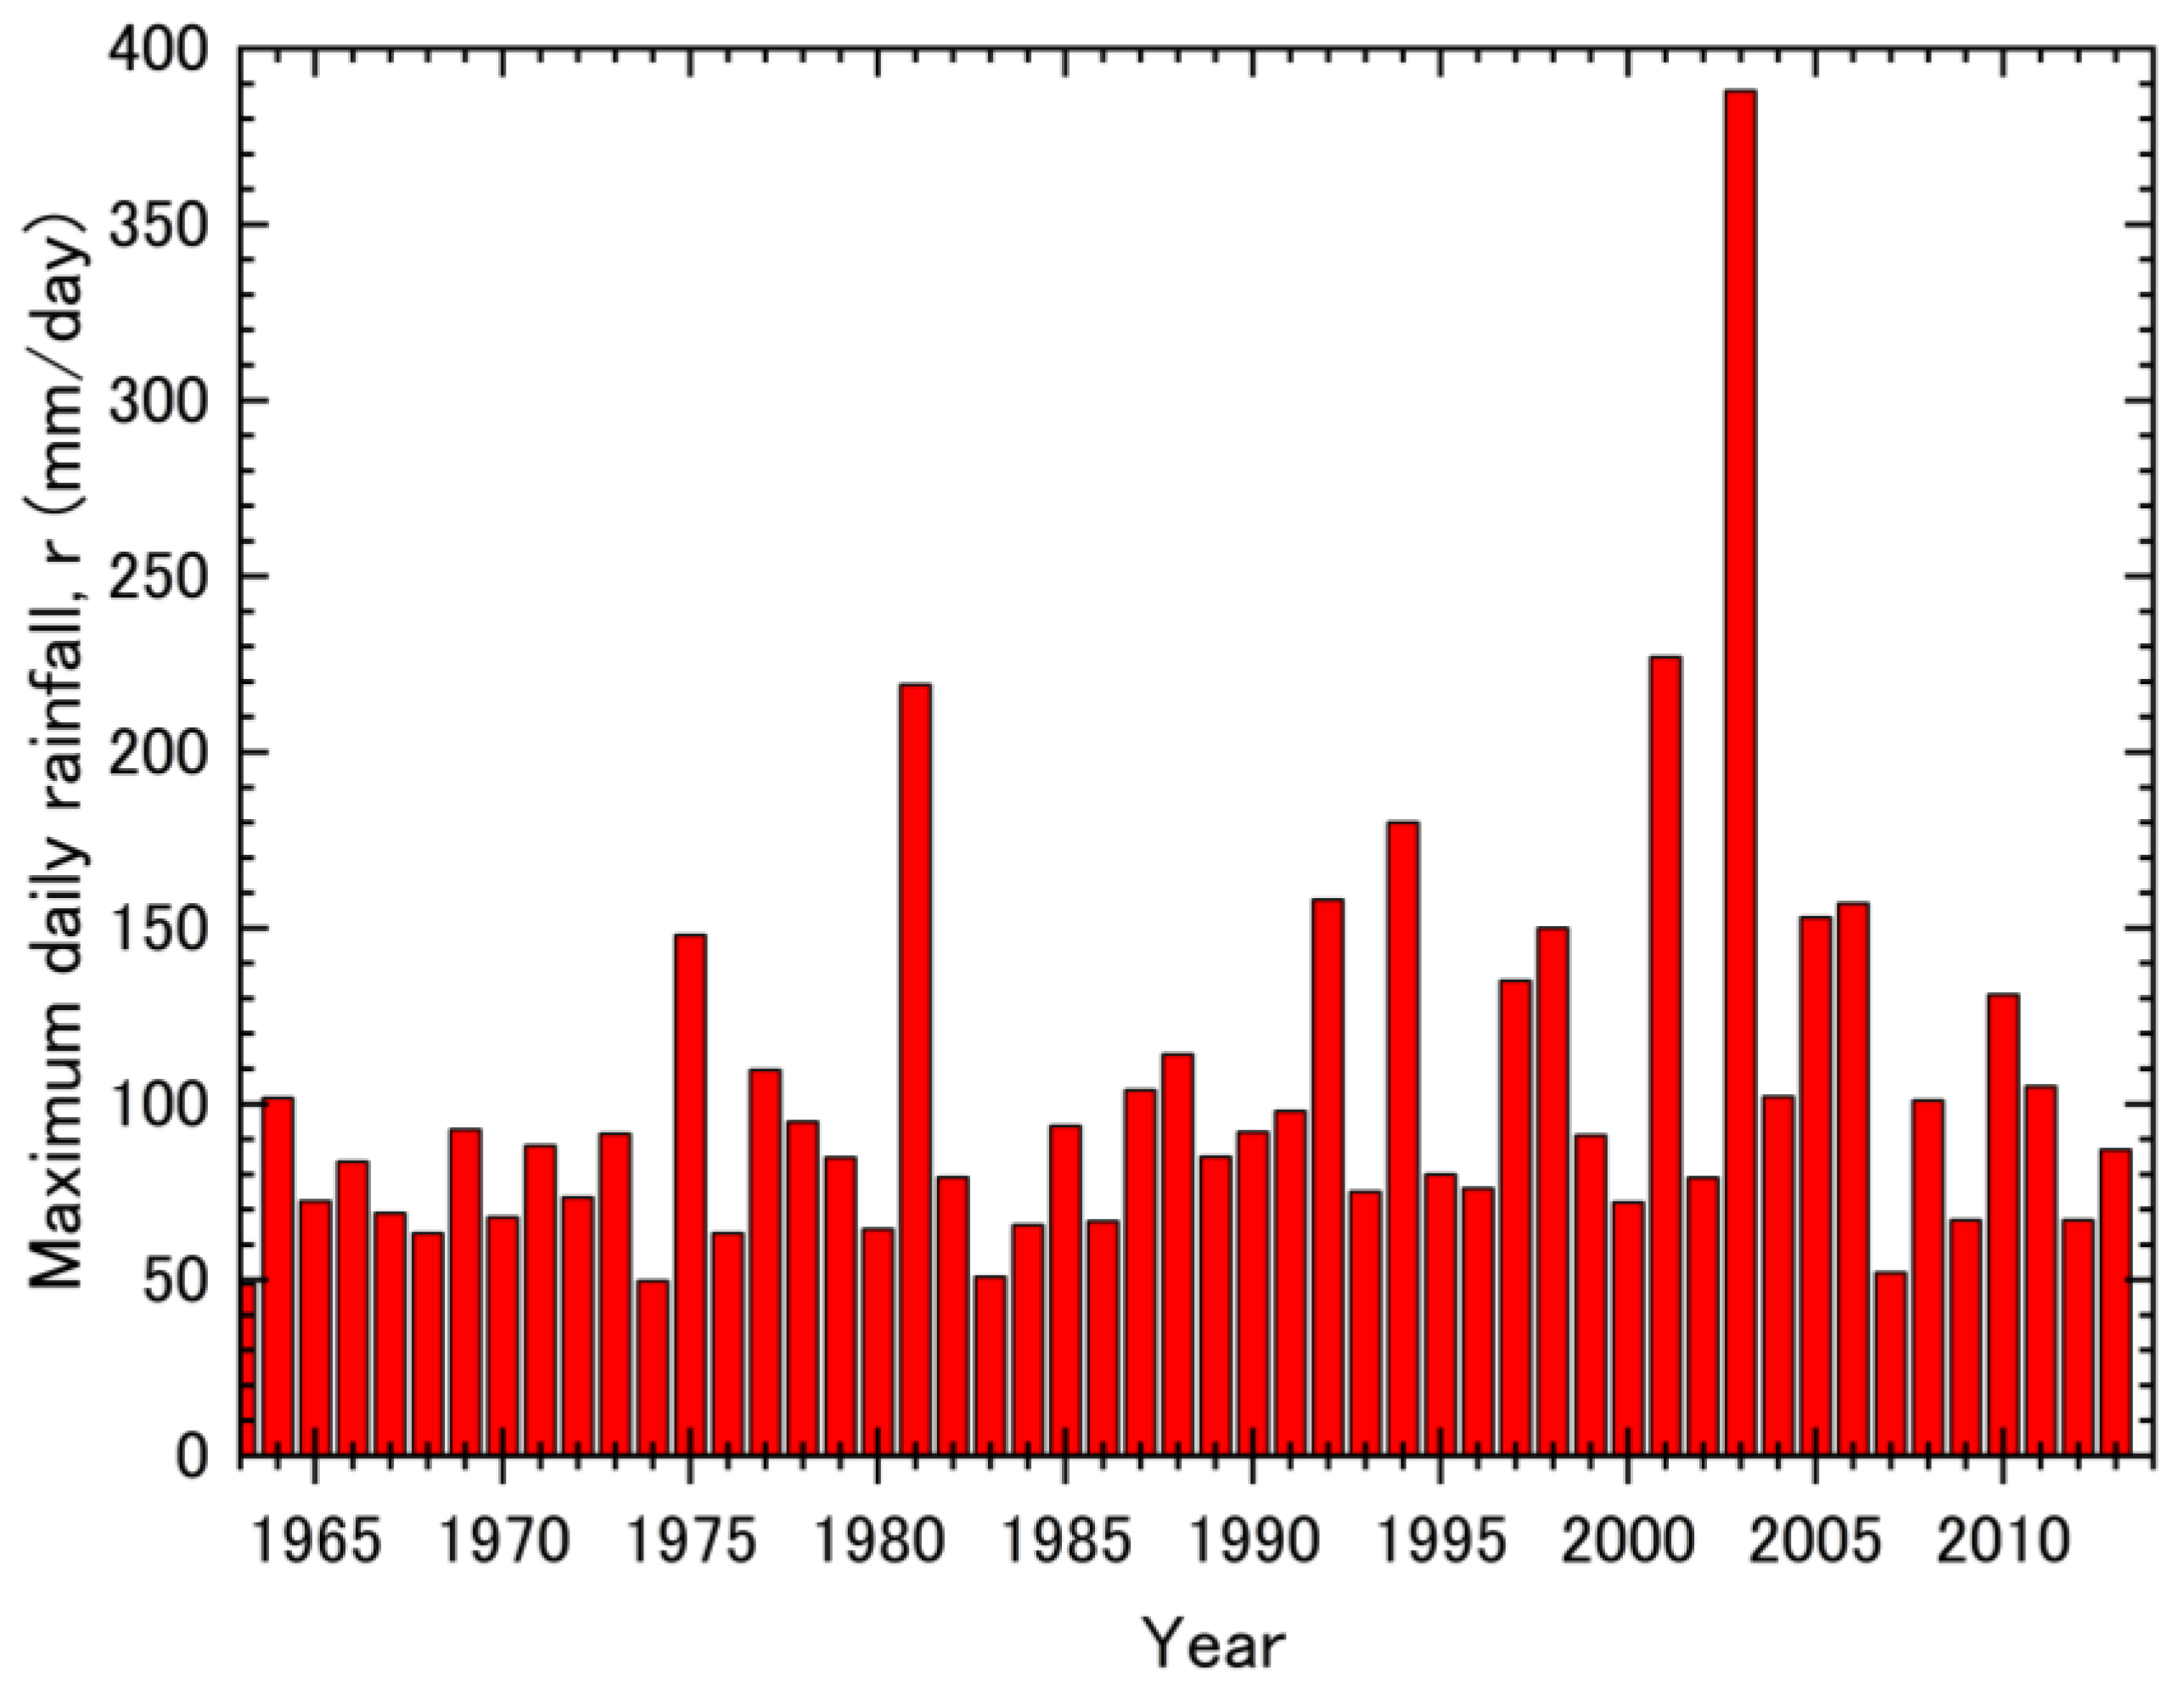
Hokkaido is located in a subarctic region that is historically unaffected by tropical cyclones (typhoons). Therefore, sediment runoff events in Hokkaido are generally less frequent than those in areas with frequent typhoons [27]. The observed average annual rainfall, based on rain gauges, is 1359 mm in the study area. In the Saru River Basin, snowmelt runoff from April to May accounts for 35% of the annual runoff [28], but landslides and debris flows are primarily caused by heavy rainfall during the summer season [26]. From 8–9 August 2003, a typhoon caused the heaviest rainfall to be recorded in the study area in recent decades. Among the tributary basins of the Saru River, the Shukushubetsu River Basin has a particularly high rainfall intensity, with a total rainfall of 434 mm and a maximum rainfall intensity of 64 (mm/h) during the event [26]. Based on the estimation formula proposed by Kimura et al. [26], the maximum daily rainfall in the study area during the analysis period (1963–2013) was determined using data from nearby rainfall stations (Figure 2). In 1981 and 2001, before the heavy rainfall recorded in 2003 (Figure 2), maximum daily rainfall exceeding 200 mm was observed in the Shukushubetsu River Basin, and the 100-year probability of daily rainfall was 363 mm.
3. Methods
3.1. Data
The landslide areas were interpreted using aerial photographs. The aerial photographs used for the interpretation were the aerial photographs issued by the Forestry Agency in 1963, 1974, 1983, 1993, 2003, 2008, and 2013 (Table 1).
3.2. Interpretation and Classification of Landslides and Calculation of Individual Landslide Areas
The interpretation and classification of landslides and the calculation of individual landslide areas were performed using ArcGIS (ver.10.8.1), based on multi-temporal orthophotographs. Orthophotographs were obtained according to the procedures described by Koshimizu and Uchida [29].
In the study area, the hillslopes are typically covered by forest. During the study period, there was no human-induced deforestation being conducted in the region. Consequently, the absence of vegetation in certain areas indicated the presence of landslide scars. Therefore, in this study, we detected no vegetation area and designated no vegetation area to clarify the landslide area using multi-temporal orthophotographs.
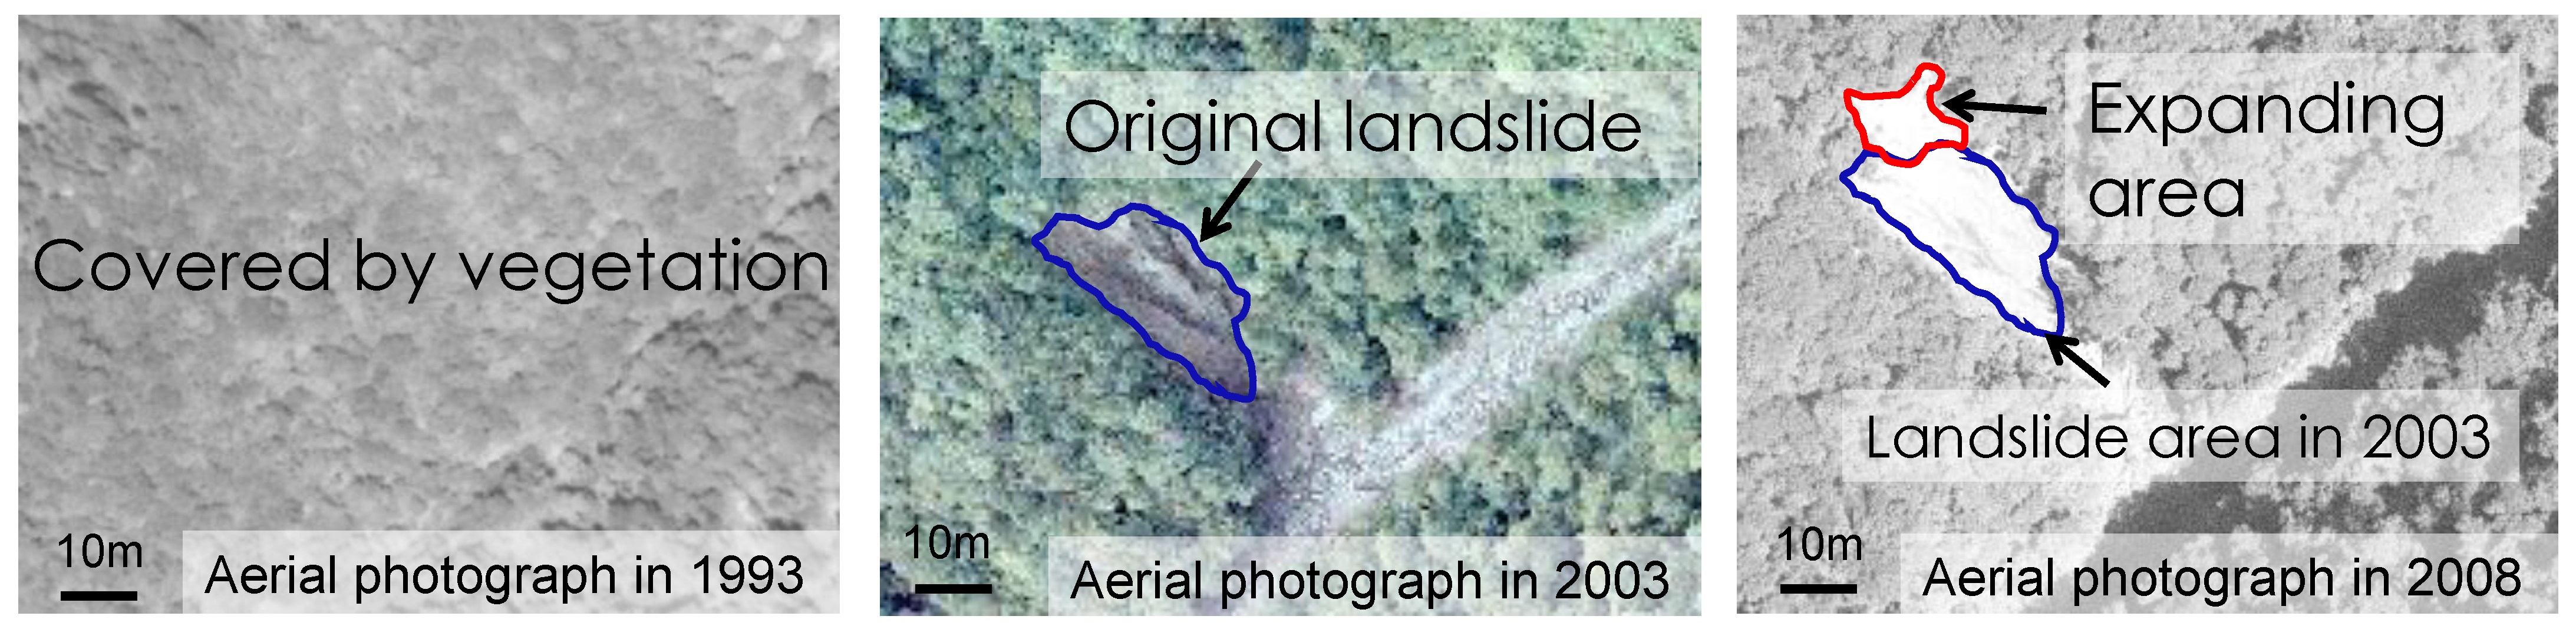
In this study, the occurrence, expansion, shrinkage, and disappearance of landslides were interpreted based on the difference between the aerial photographs taken previously and those taken during the considered period using orthophotographs. If the aerial photographs taken in the previous period were covered by vegetation and it was possible to ascertain that the aerial photographs from the period of interest had caused a new landslide, then it was defined as a landslide that occurred or expanded during this period. An “original landslide” was defined as a landslide that did not intersect or overlap with a pre-existing landslide. However, if the landslide touched another landslide that existed in the previous period, the existing landslide was considered to have expanded, and was defined as an “expanding landslide”. For example, in a place that was previously covered with vegetation, as shown in the left image of Figure 3, when a bare area was confirmed in the subsequent period (center image of Figure 3), such an area was extracted from the image as an “original landslide” (with a blue solid line surrounding the range). As shown in the right image of Figure 3, when an expanded bare area (with a red solid line surrounding the range) that was adjacent to the previous landslide area (with a blue solid line surrounding the range) was identified in the subsequent period, it was extracted from the image as an “expanding landslide”. In addition, a “reactivated landslide’’, which refers to a landslide occurring again within the range of an existing landslide in the period before the relevant time, was also defined as an “expanding landslide”. When interpreting the landslides, we first extracted the range in which sediment movement, such as the presence of bare land, was confirmed. Next, to distinguish between the erosion area and the other areas, a landslide area polygon was created by excluding the area where sediment clearly accumulated from the area where sediment movement had been confirmed by stereoscopic vision.
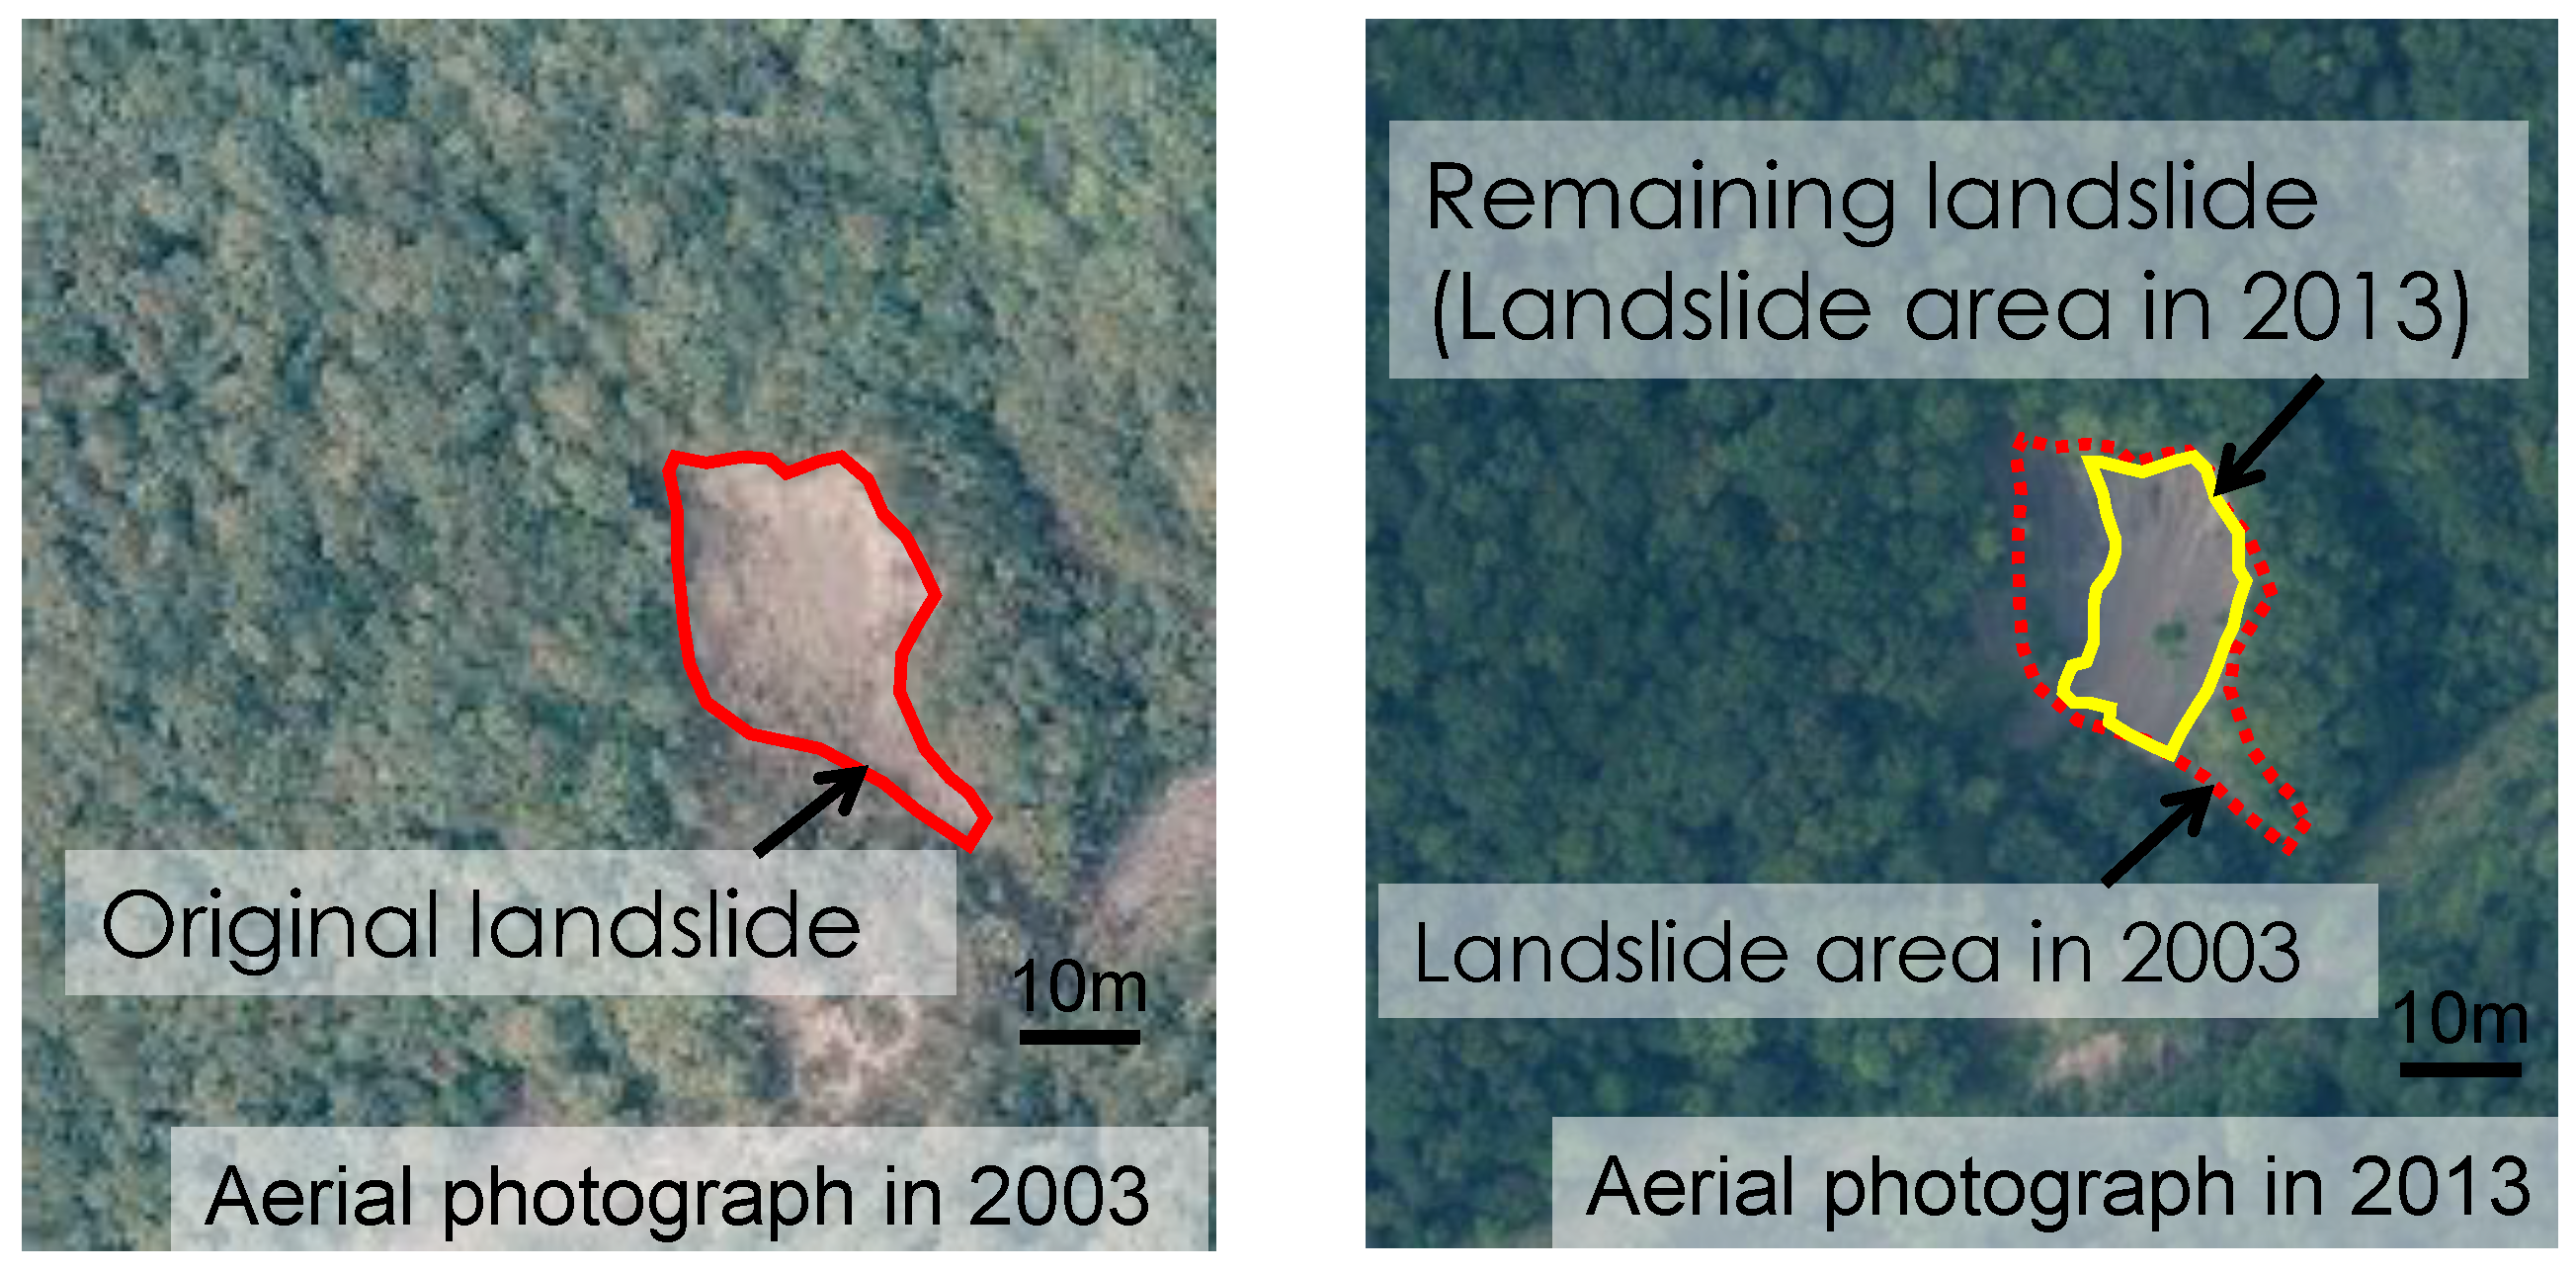
On the other hand, if the recovery of vegetation was confirmed in the aerial photographs taken during the previous period, the landslide area was considered to have shrunk or disappeared. Therefore, when the landslide area is completely covered with vegetation and has now vanished, it is classified as a “disappeared landslide,” and when even a part of the landslide area remains, it is classified as a “remaining landslide”. For example, if the landslide area confirmed on the left image of Figure 4 (with a red solid line surrounding the range) decreases in the landslide area in the next period (with a yellow solid line surrounding the range), it is classified as a “remaining landslide”. It should be noted that the expanding landslide is also included in the remaining landslide because the bare area has been continuously confirmed since the time of the original landslide. In other words, a remaining landslide includes both shrunken and expanding landslides. Some orthophotographs did not sufficiently confirm the surroundings of the landslide area because of unclear aerial photographs or tree shadows. In such cases, it was difficult to accurately trace the landslide area; therefore, such orthophotographs were excluded from the analysis.
Furthermore, it is believed that the landslide occurred between the time of the aerial photograph, which was taken just before the confirmation of the landslide, and the time when the subsequent aerial photograph was captured. It is difficult to determine when it occurred. Similarly, when the disappearance of a landslide was confirmed, it was difficult to determine the time of disappearance. Therefore, in this study, we assumed that the landslide occurred or disappeared between the time of the current photograph and the previous one. We then organized and represented these events based on the midpoint of the time period. Furthermore, the maximum possible time width was evaluated.
3.3. Flow of the Analysis
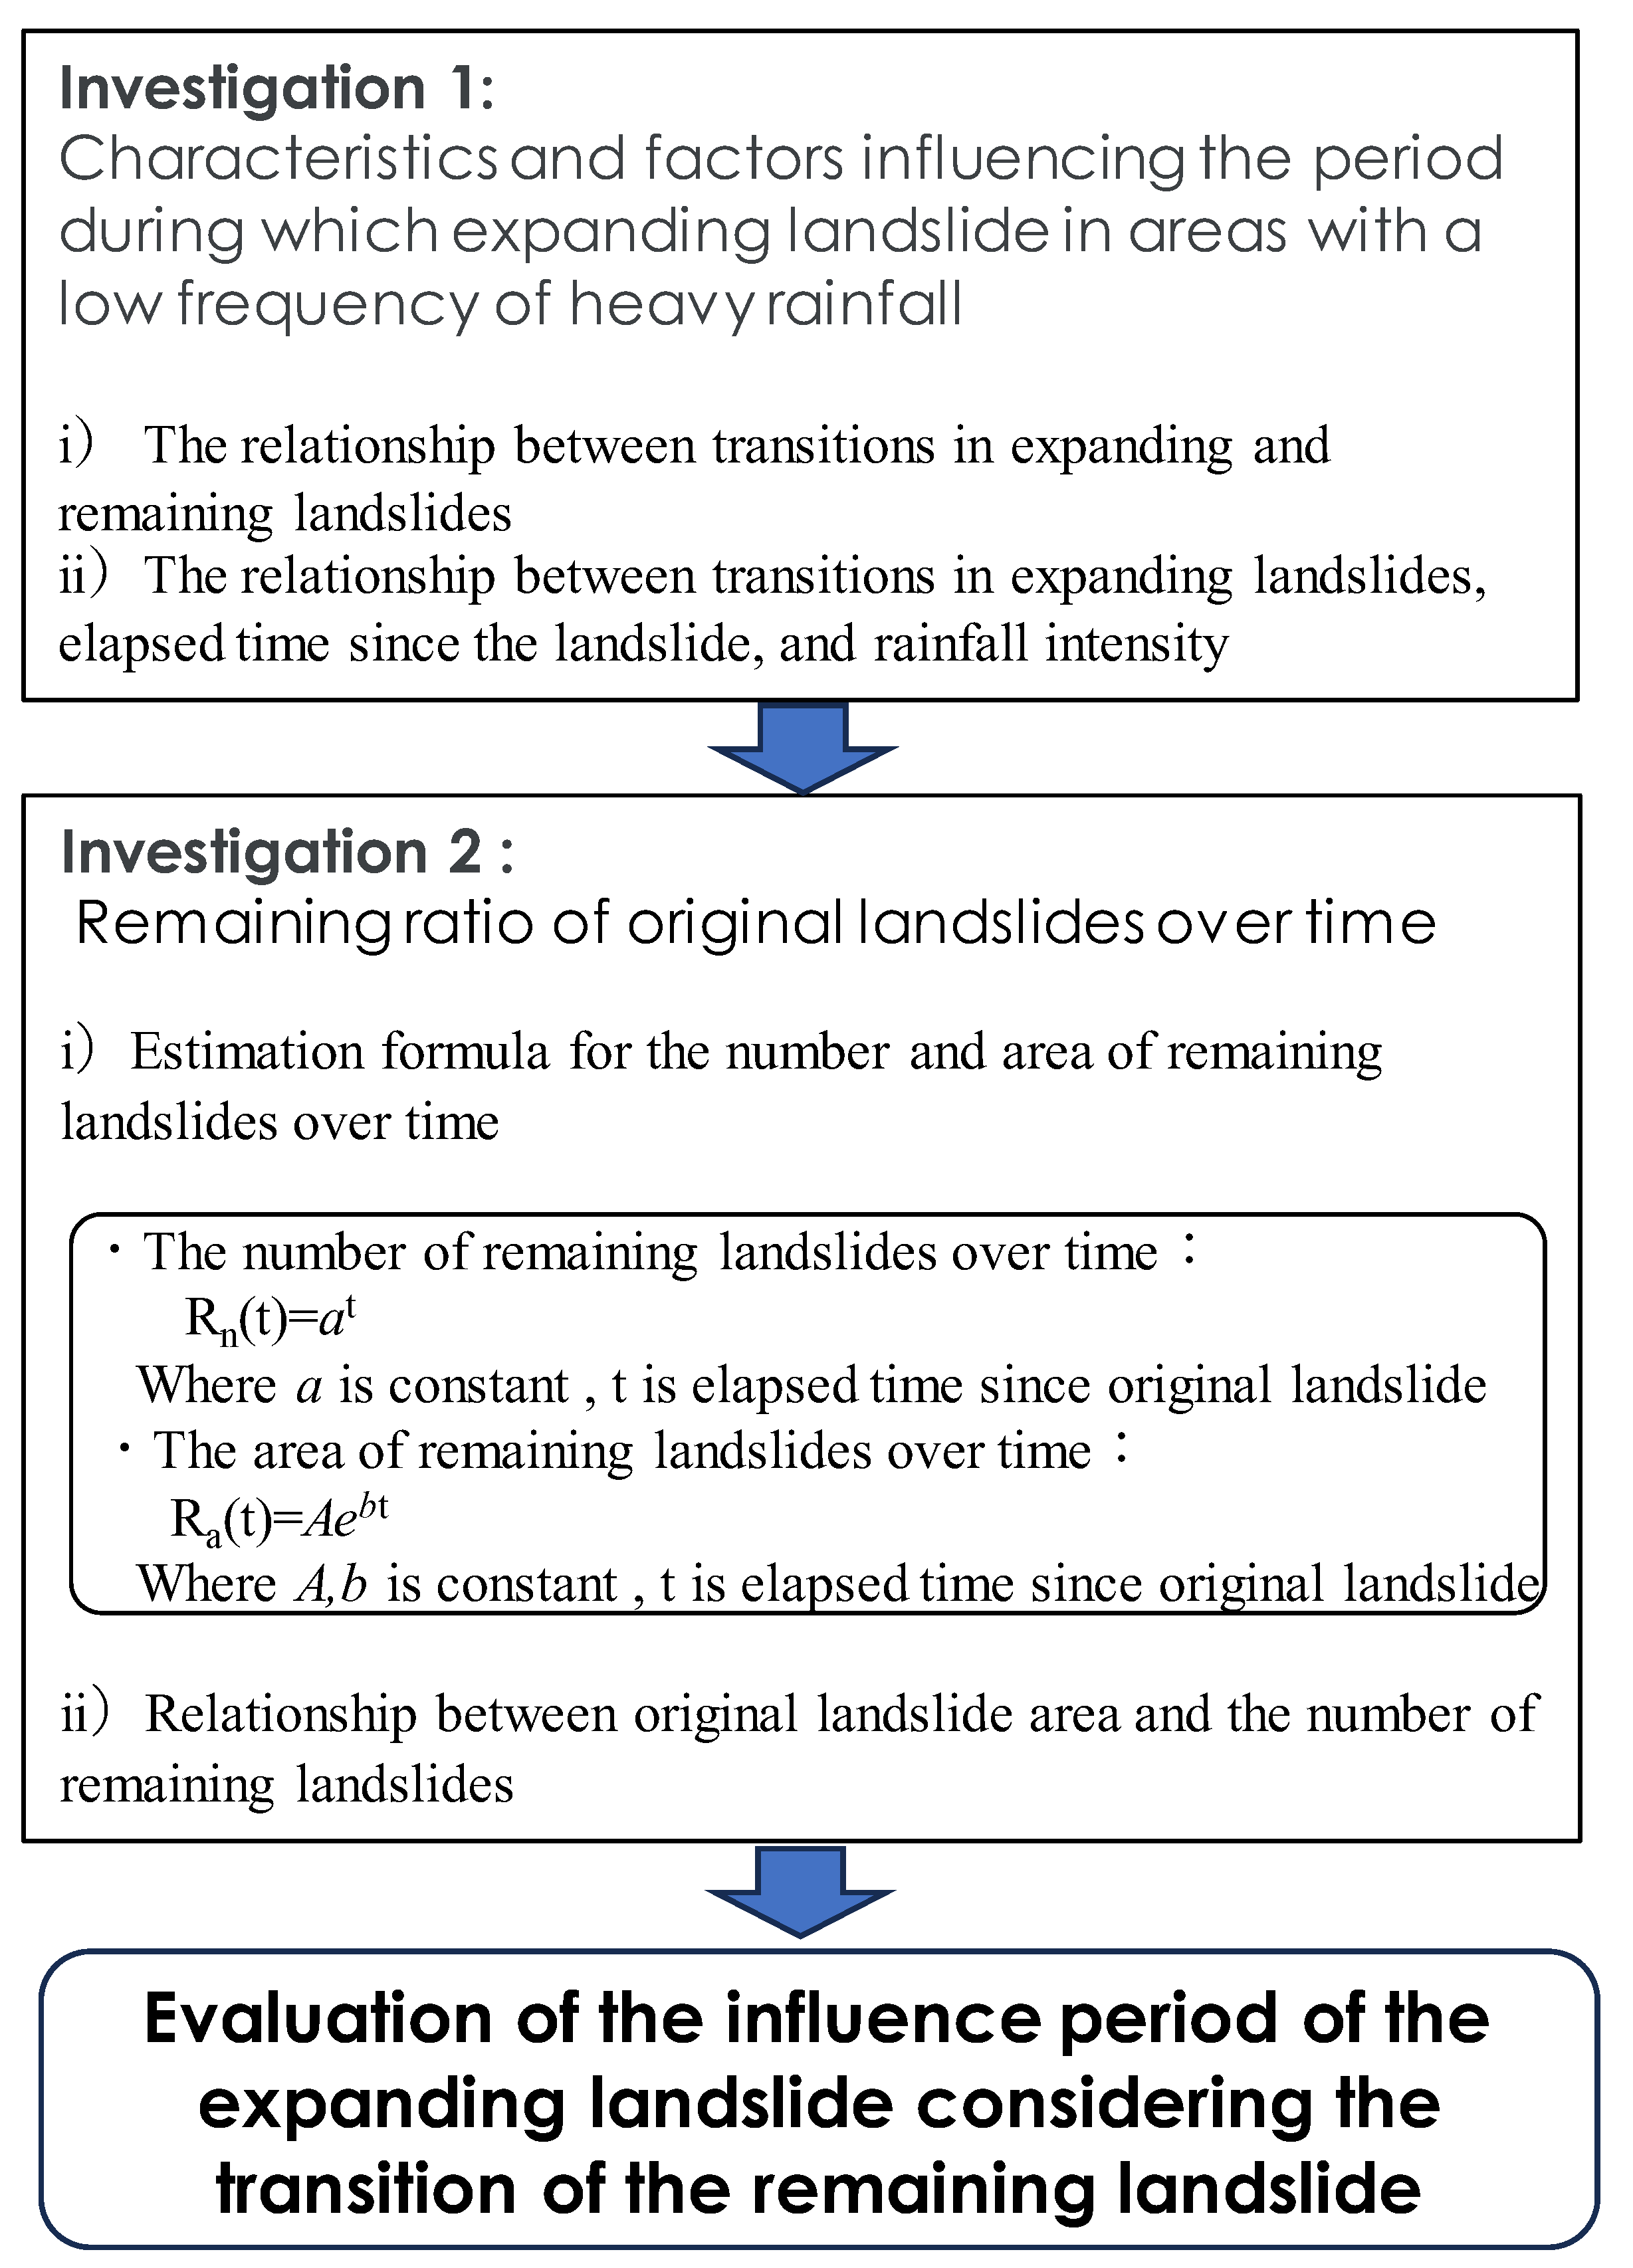
In this study, we evaluated the period of impact of the expanding landslide, considering the transition of the remaining landslide (Figure 5).
First, we analyzed the characteristics and factors influencing the period during which expanding landslides occur frequently in areas with a low frequency of heavy rainfall. In this regard, we investigated (i) the relationship between transitions in expanding and remaining landslides and (ii) the relationship between transitions in expanding landslides, the time that had elapsed since the landslide, and rainfall intensity.
As for the relationship between transitions in expanding and remaining landslides, we divided the expansion landslides by the original landslides and compared the transition of the ratio with the transition of the number of remaining landslides. The reason for dividing the expanding landslides by the original landslides is to eliminate, as fully as possible, the effect of rainfall intensity on the progression of expanding landslides. We assumed that the expanding landslide and the original landslide were affected by the same rainfall intensity at the same time, and then eliminated the effect of rainfall intensity as fully as possible by dividing the expanding landslide by the original landslide. In this study, we investigated the relationship between transitions, using the ratio of the total area of expanding landsides to the total area of the original landslide and transitions in the number of remaining landslides.
For the relationship between transitions in expanding landslides, the number of years that have elapsed since the landslide, and rainfall intensity, the ratio of expanding landslides to remaining landslides was determined. By investigating the relationship between this ratio and the elapsed years and rainfall intensity, we will clarify whether the expanding landslides are more influenced by the elapsed years since the landslide or the rainfall intensity.
Specifically, we investigated the relationship between “the ratio of the number of expanding landslides to the number of remaining landslides (the ratio of the number of expanding landslides, or RNEL)” and “the ratio of the expanding landslides area to the remaining landslides area (the ratio of the expanding landslide area, or RELA)” with elapsed time and rainfall intensity, respectively. For the rainfall scale index, we decided to use the maximum daily rainfall as an index of short-term rainfall intensity related to landslides [30,31] and as an index of the rainfall scale that has been continuously observed in the basin.
Next, we determined the ratio of remaining landslides to original landslides over time. Regarding this determination, in order to construct a formula for estimating the number and area of remaining landslides over time, we investigated the relationship between the number of remaining landslides (the remaining landslide areas) and the number of original landslides (the original landslide areas). When constructing the formula for estimating the number of remaining landslides and the remaining landslide area, we estimated the ratio of the number of remaining landslides to the number of original landslides (the ratio of the number of remaining landslides, or RNRL) and the ratio of the remaining landslide areas to the original landslide areas (the ratio of the remaining landslide area, or RRLA) from the elapsed year. Regarding the relationship between the original landslide area and the number of remaining landslides, we investigated the transitions in RNRL over time for each of the five original landslide areas (0–250 m2, 250–500 m2, 500–750 m2, 750–1000 m2, and >1000 m2).
4. Results
4.1. Area Frequency Distribution and Density of Original Landslides
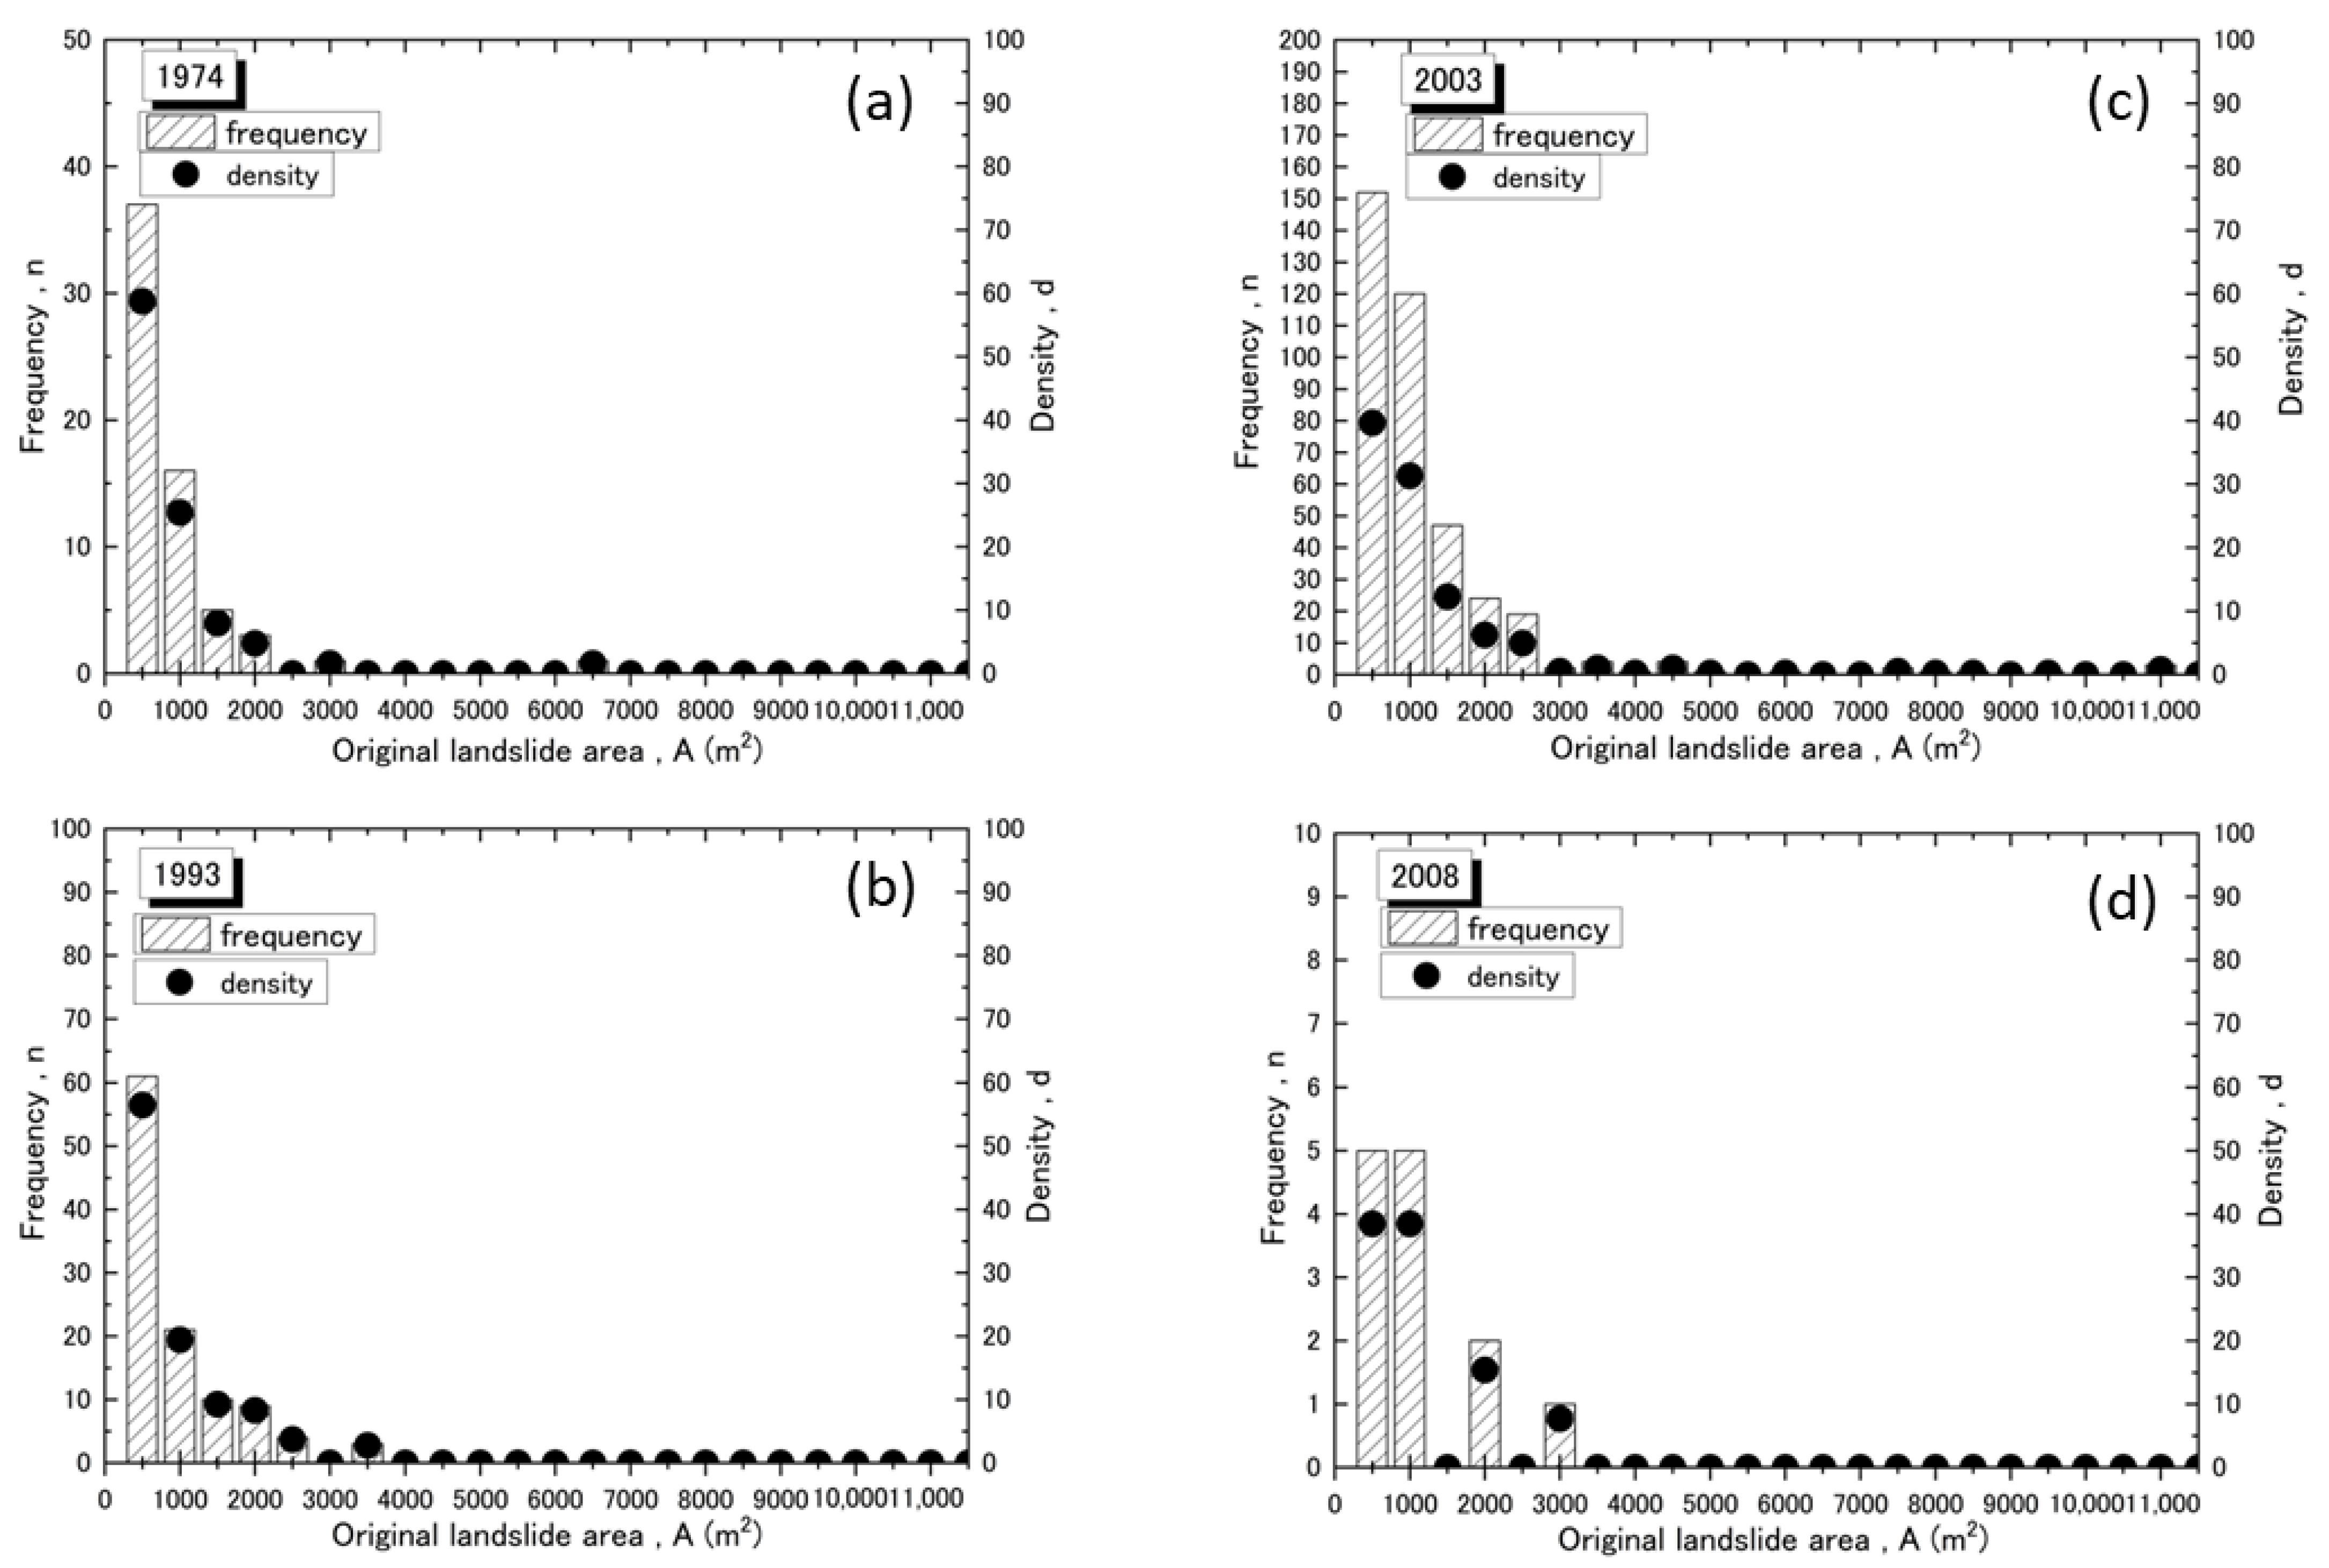
The multi-temporal landslide inventory in this study area is shown in Figure 6. The year 1963 was excluded because it was impossible to compare it with previous aerial photographs or to identify the original landslide. Furthermore, 1983 and 2013 were excluded because the number of original landslides was very small, at five and six, respectively. The frequency distribution and density of the original landslide area over the entire period showed a Poisson distribution, with the maximum original landslide area in the interval of 0–500 m2 (Figure 7).
The total number of landslides in 1974 was 63 and the landslide area of 0–500 m2 had a landslide density of 59%, accounting for more than half of the total; moreover, the maximum landslide area was 6312 m2 (Figure 7a). The total number of landslides in 1993 was 108, and the landslide area of 0–500 m2 had a landslide density of 56%, accounting for more than half of the total, with a maximum landslide area of 3419 m2 (Figure 7b). The total number of landslides in 2003 was 383, which was the largest number during the analysis period, and the landslide density in the section from 0–1000 m2 accounted for more than half of the total (70%). The maximum landslide area was 11,466 m2, which was the largest during the analysis period (Figure 7c). The number of landslides in 2008 was 13, which was the third lowest during the analysis period, and the landslide area of 0–1000 m2 had a landslide density of 77%, accounting for more than half of the total. The maximum landslide area was 2790 m2 (Figure 7d).
4.2. Area of Expansion and Original Landslides and Transition in Their Ratios
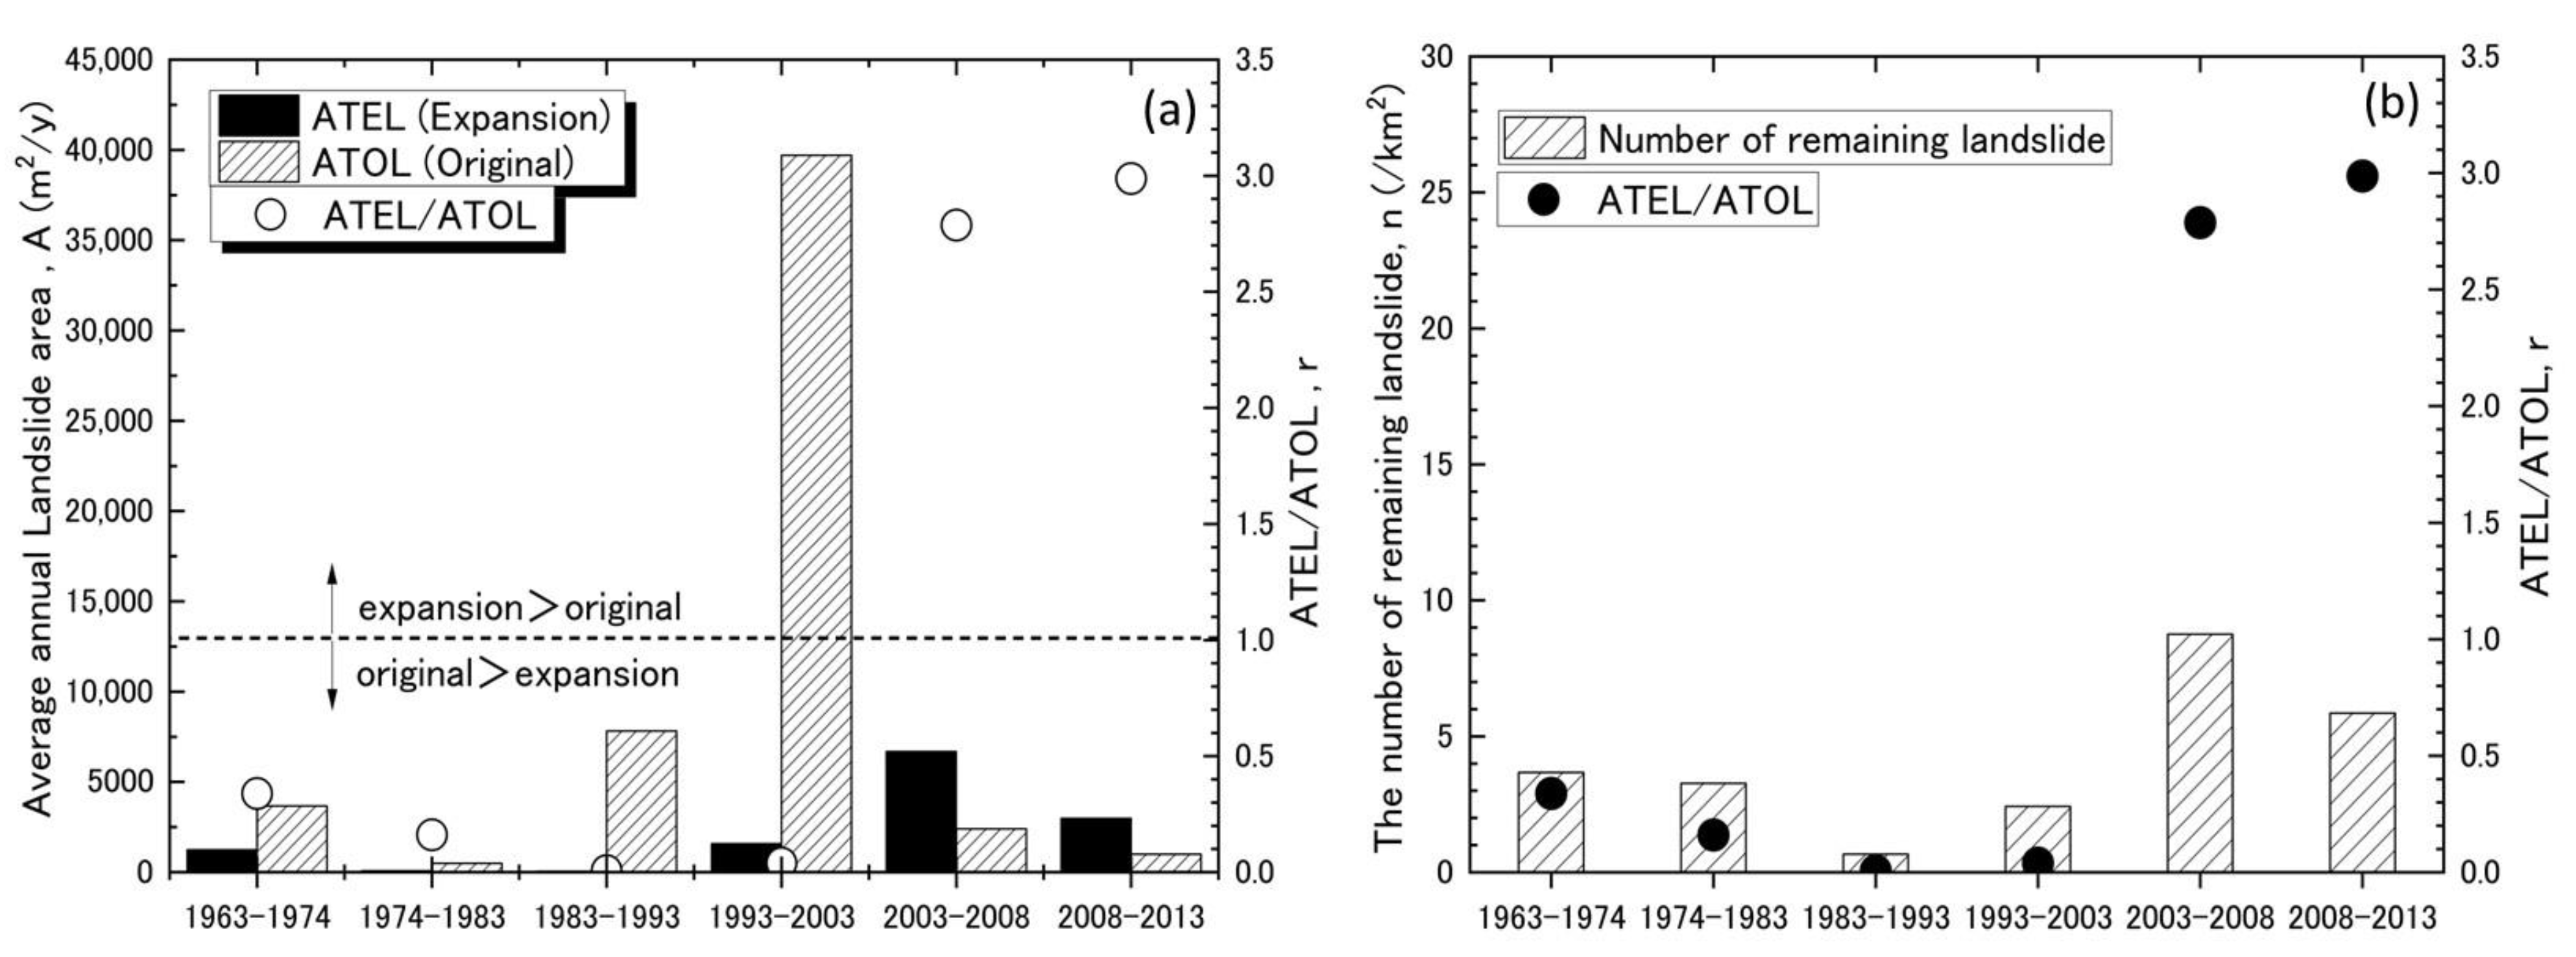
The average annual total area of the original landslides (ATOL) during the analysis period (1963–2013) was 3075 (m2/year), excluding the period from 1993 to 2003 (heavy rainfall was recorded in 2003) (Figure 8a). The ATOL ranged from 488 (m2/year) (1974–1983) to 7828 (m2/year) (1983–1993), a difference of approximately 16-fold. In addition, the ATOL was 39,708 (m2/year) during the period from 1993 to 2003, including 2003, when heavy rainfall was recorded.
Conversely, the annual average total area of the expansion landslide (ATEL), which is the average for all periods, was 2103 (m2/year). The period with the largest ATEL was from 2003 to 2008, recorded after the heavy rain in 2003 (6681 (m2/year). The average ATEL, excluding the period from 2003 to 2008, was 1181 (m2/year). Therefore, the ATEL from 2003 to 2008 was approximately six-fold that of the average ATEL, excluding the period from 2003 to 2008.
The average of the ATEL-to-ATOL ratio was 1.05, on average, over the entire period. Before the heavy rainfall of 2003, the average of the ATEL-to-ATOL ratio was 0.13. The period with the highest ratio was 2008–2013, after the heavy rainfall in 2003, followed by 2003–2008. The values for each period were 3.0 and 2.8, respectively, and the ATEL exceeded the ATOL in both periods. Furthermore, the ratio between the two periods was 22–23-fold higher than that before 2003. The ATEL from 2003 to 2008 (6681 (m2/year)) was smaller than the ATOL from 1993 to 2003 (including the heavy rainfall in 2003) and from 1983 to 1993 by 0.17-fold and 0.85-fold, respectively. However, it was 2.17-fold higher than the ATOL (3075 (m2/year)) during the analysis period (1963–2013), excluding 1993–2003, which recorded the heavy rainfall in 2003. Furthermore, the ATEL from 2003 to 2008 was also higher than the ATOL from 1963 to 1974 (1.82-fold), 1974 to 1983 (13.7-fold), and 2008 to 2013 (6.68-fold), respectively. Furthermore, the ATEL (2988 (m2/year)) in the period from 2008 to 2013 was smaller than the ATOL in the period from 1993 to 2003 (including the heavy rainfalls in 2003) (0.08-fold), 1983 to 1993 (0.38-fold), and 1963 to 1974 (0.82-fold). However, it remained relatively consistent with the ATOL (3075 (m2/year)) during the analysis period (1963–2013), excluding the 1993–2003 period, which featured heavy rainfall in 2003 (0.97-fold).
4.3. Relationship between the Ratio of Expanding and Original Landslide Areas and the Number of Remaining Landslides
The number of remaining landslides was the lowest at 0.67 (/km2) in 1983–1993 and the highest at 8.76 (/km2) in 2003–2008 (Figure 8b). The average number of remaining landslides over the entire period was 4.11 (/km2). From 1983 to 1993, when the ATEL-to-ATOL ratio was the lowest, the number of remaining landslides was also the lowest. However, the number of remaining landslides during the period when the ATEL-to-ATOL ratio exceeded 1 (2003–2008 and 2008–2013) was within the top two in the analysis period. In addition, the period in which the ATEL-to-ATOL ratio was the third largest (1963–1974) corresponded to the period in which the number of remaining landslides was the third largest. Therefore, a corresponding relationship was observed between the ATEL-to-ATOL ratio and the number of remaining landslides.
4.4. Relationship between Transitions in Expanding Landslides, Elapsed Time since the Landslide, and Rainfall Intensity
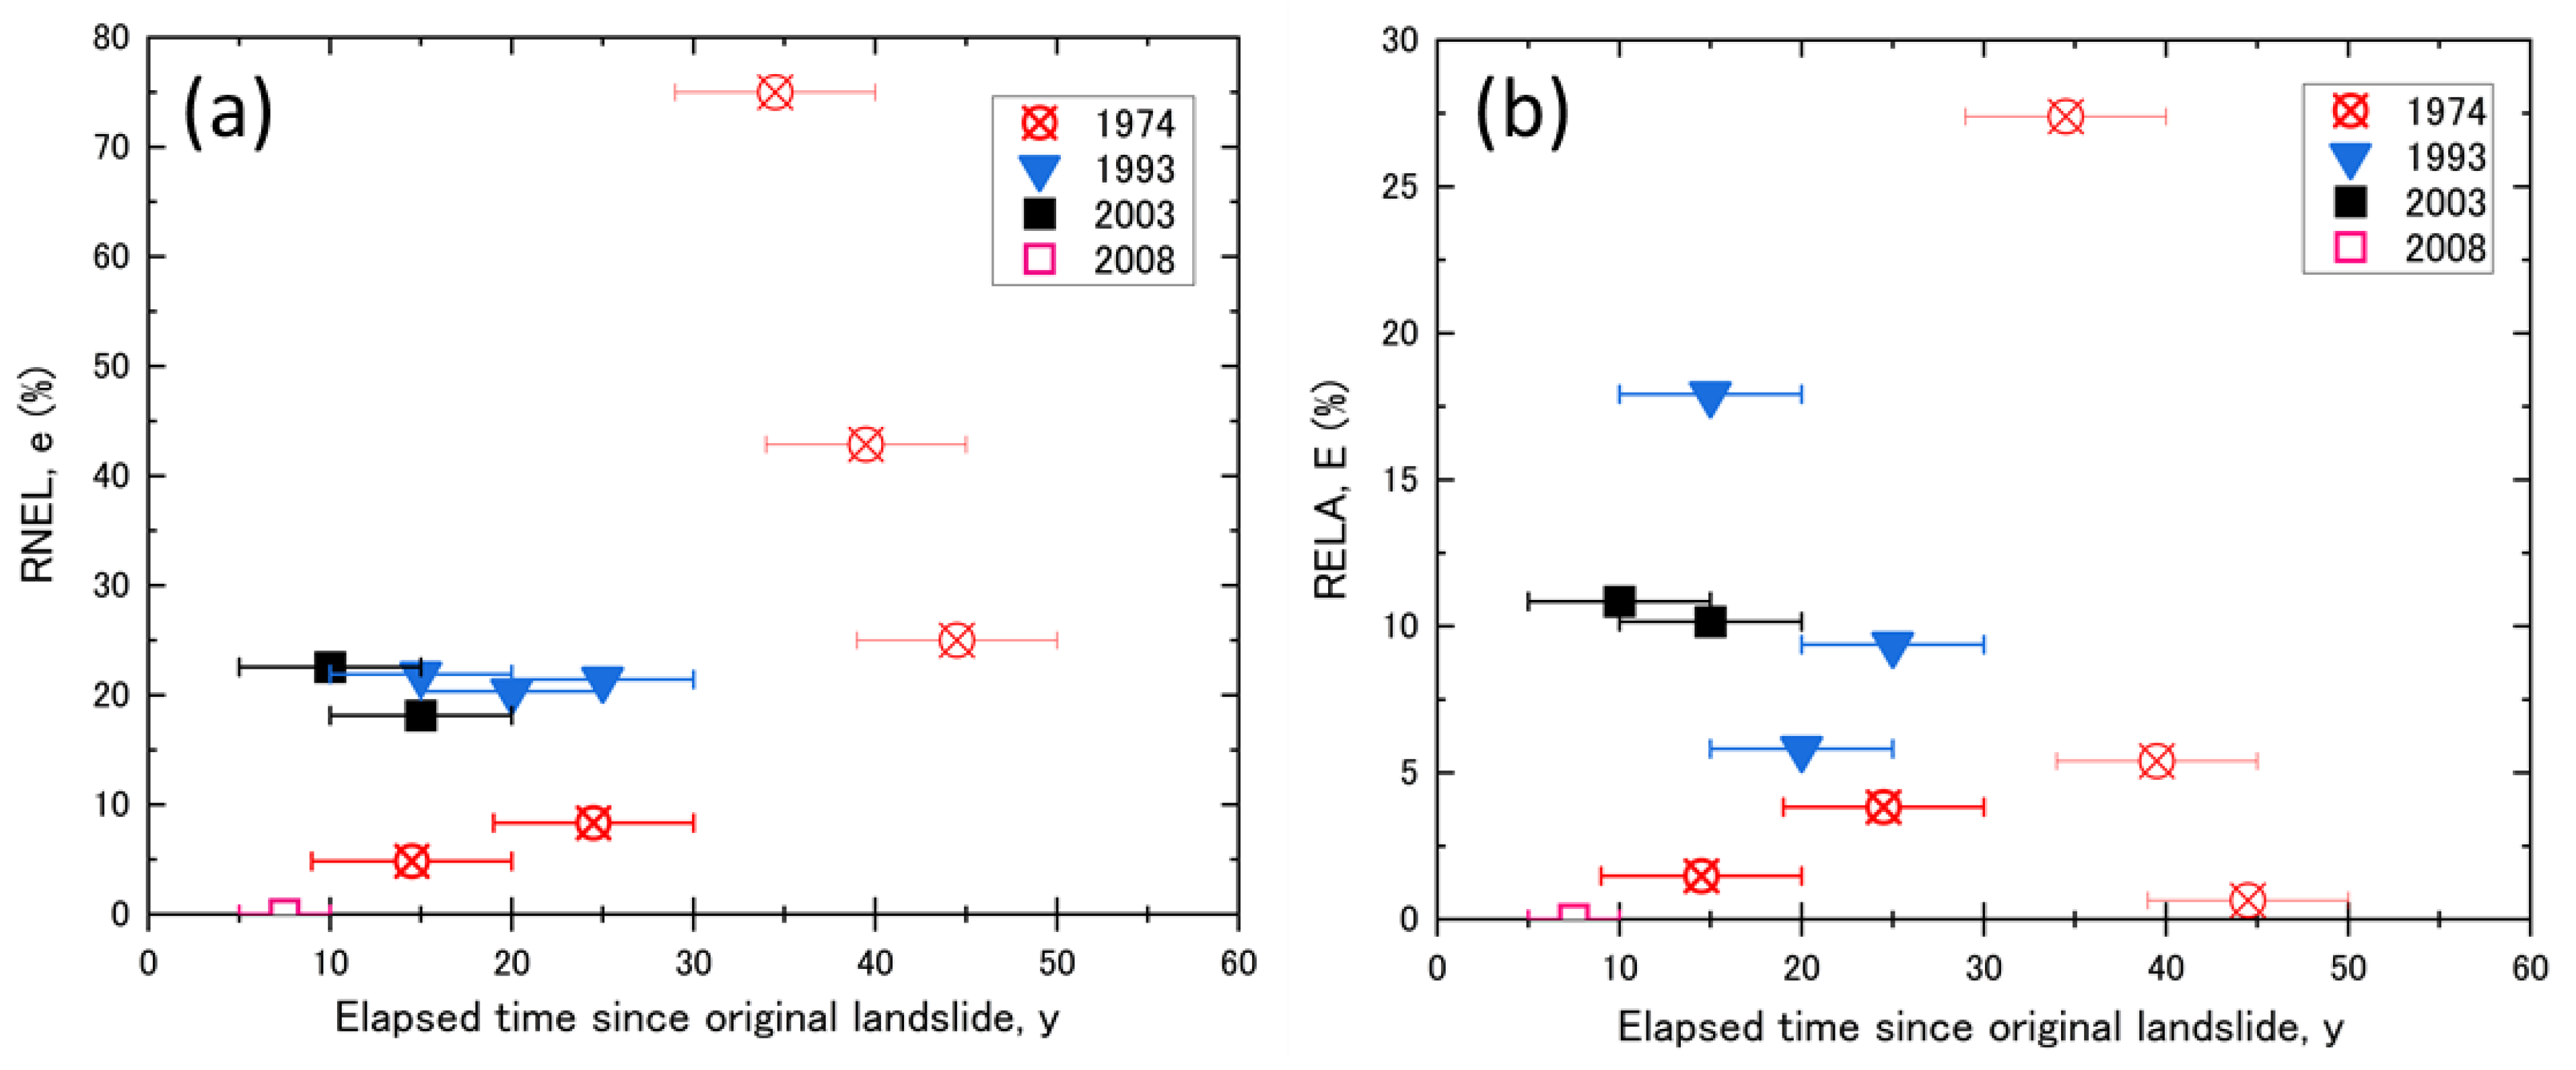
Figure 9a,b shows the relationship between the RNEL, the RELA, and the elapsed time. The 1974 landslide was treated as supplementary data because the number of landslide samples that persisted beyond 29 years after this landslide was small (<10). The RNEL in each period did not show a monotonous increase or decrease depending on the number of years since the landslide occurred (Figure 9a). The landslides in 1993 and 2003 showed a constant RNEL value of approximately 20%, regardless of the number of years since the landslide. However, for the 1974 landslide, when the number of samples was ≥10, RNEL was <10% in the period 9 to 19 years after the landslide and that 19 to 29 years after the landslide. This was smaller than the RNEL for the same landslide periods in 1993 and 2003. The transition of the RNEL in 1974 increased slightly from 4.8% in the period 9 to 19 years after the landslide to 8.3% in the period 19–29 years after the landslide. Furthermore, for the 1974 landslide, the RNEL was ≥10% (for the period 29 years after the landslide) and it further increased to 75% for the period 29–40 years after the landslide and decreased for the period 34–50 years after the landslide.
The RELA in each period did not exhibit a monotonous increase or decrease depending on the number of years since the landslide occurred (Figure 9b). In 1974, the RELA increased slightly, from 1.5% in the period 9–19 years after the landslide to 3.8% in the period 19–29 years after the landslide. For the period with fewer than ten samples, it further increased to 27% in the period 29–40 years after the landslide. However, it decreased to 5.4% for the period 34–45 years after the landslide and further decreased to 0.6% for the period 39–50 years after the landslide. For the landslide in 1993, the RELA was the highest at 18% for the period 10–20 years after the landslide. Subsequently, it decreased to 5.8% for the period 15–25 years after the landslide but slightly increased to 9.4% for the period 20–30 years after the landslide. For the landslide in 2003, the RELA showed a constant value of approximately 10%, regardless of the elapsed years.
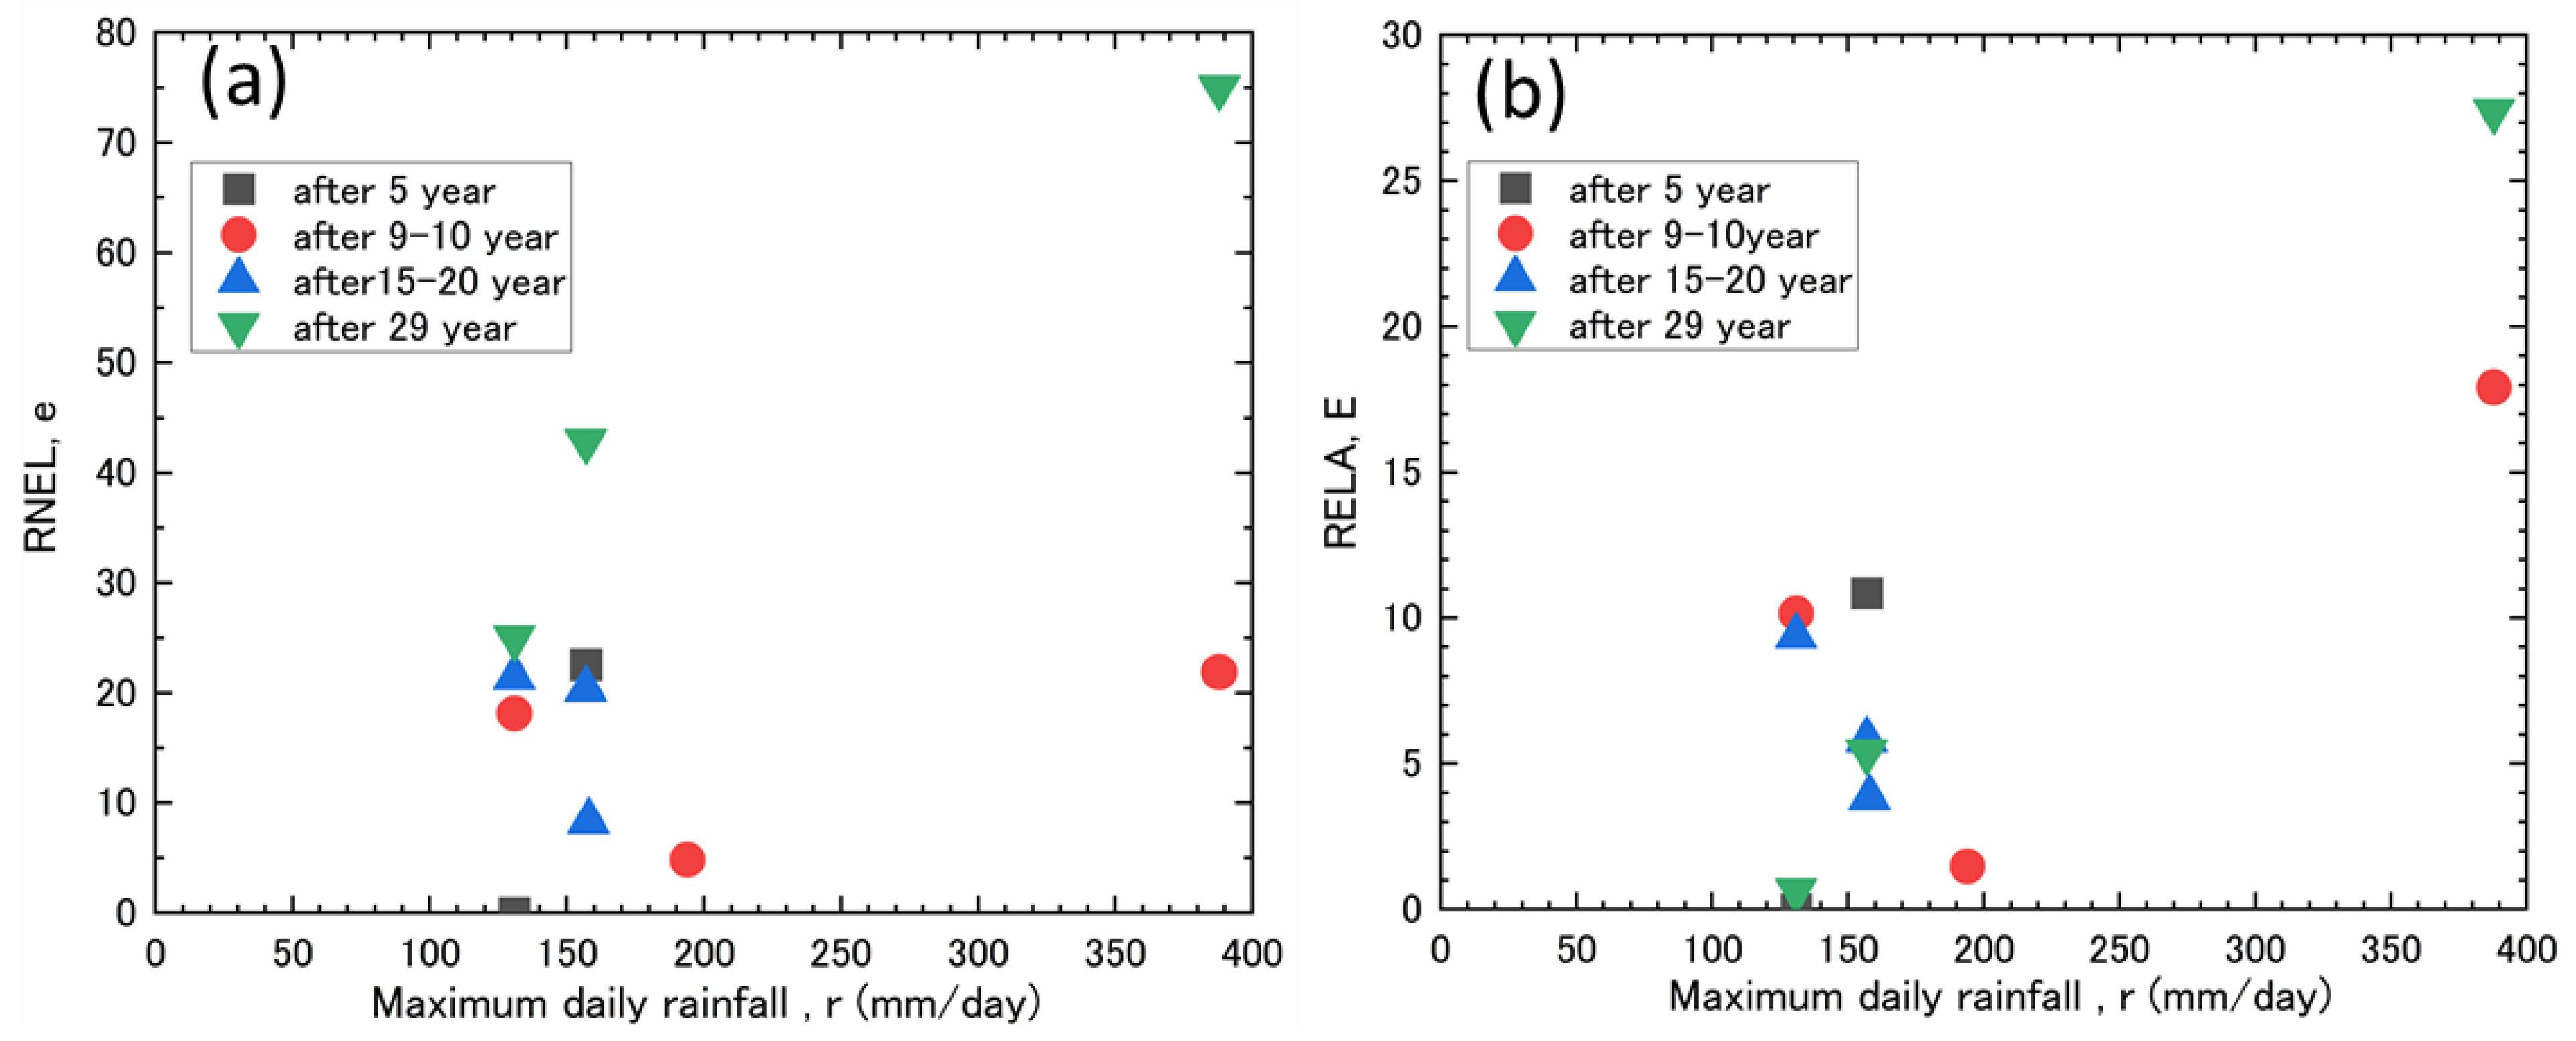
Figure 10a,b shows the relationship between the RNEL, the RELA, and the maximum daily rainfall in each period. The correlation between the RNEL and maximum daily rainfall was R2 = 0.33 (Figure 10a). Regarding the relationship between the RNEL and maximum daily rainfall during the longest period after the landslide in the analysis period (over 29 years after the landslide), the RNEL increased with rainfall intensity. For the relationship between the RNEL and the maximum daily rainfall 9–10 years after the landslide, the RNEL, with a maximum daily rainfall of 388 mm, was similar to or greater than the RNEL with a maximum daily rainfall of 131 mm. In addition, the analysis of the relationship between the RNEL and the period after the landslide when the maximum daily rainfall was the highest showed that the RNEL was 22% for the period 9–10 years after the landslide and 75% for the period beyond 29 years after the landslide. This indicated that the RNEL value for the period beyond 29 years after the landslide exceeded that for 9–10 years after the landslide. In addition, the RNEL value at >29 years after the landslide was the highest during the entire analysis period. Therefore, the RNEL increased with the rainfall intensity of the maximum daily rainfall, regardless of the time that had elapsed after the landslide.
The relationship between the RELA and the maximum daily rainfall for the entire period showed a clear correlation (R2 = 0.64 (Figure 10b)). An analysis of the relationship between the RELA and maximum daily rainfall during the longest period after the landslide in the analysis period (29 years after the landslide) showed that the RELA value increased as the rainfall intensity increased. Moreover, an analysis of the relationship between the RELA and maximum daily rainfall 9–10 years after the landslide showed that the RELA with a maximum daily rainfall of 388 mm was greater than the RELA with a maximum daily rainfall of 131 mm. In addition, an analysis of the relationship between the RELA and the period after the landslide showed that when the maximum daily rainfall was the highest (maximum daily rainfall: 388 mm), the RELA was 18% for the period 9–10 years after the landslide and 27% for the period more than 29 years after the landslide. Therefore, the RELA at >29 years after the landslide exceeded the RELA at 9–10 years after the landslide. As mentioned earlier, the RELA also increased with the rainfall intensity of the maximum daily rainfall, regardless of the elapsed time after the landslide, as was similar for the RNEL.
4.5. Transition of the Number and Area of Remaining Landslides after the Landslide, Relationship between the Original Landslide Area and the Number of Remaining Landslides
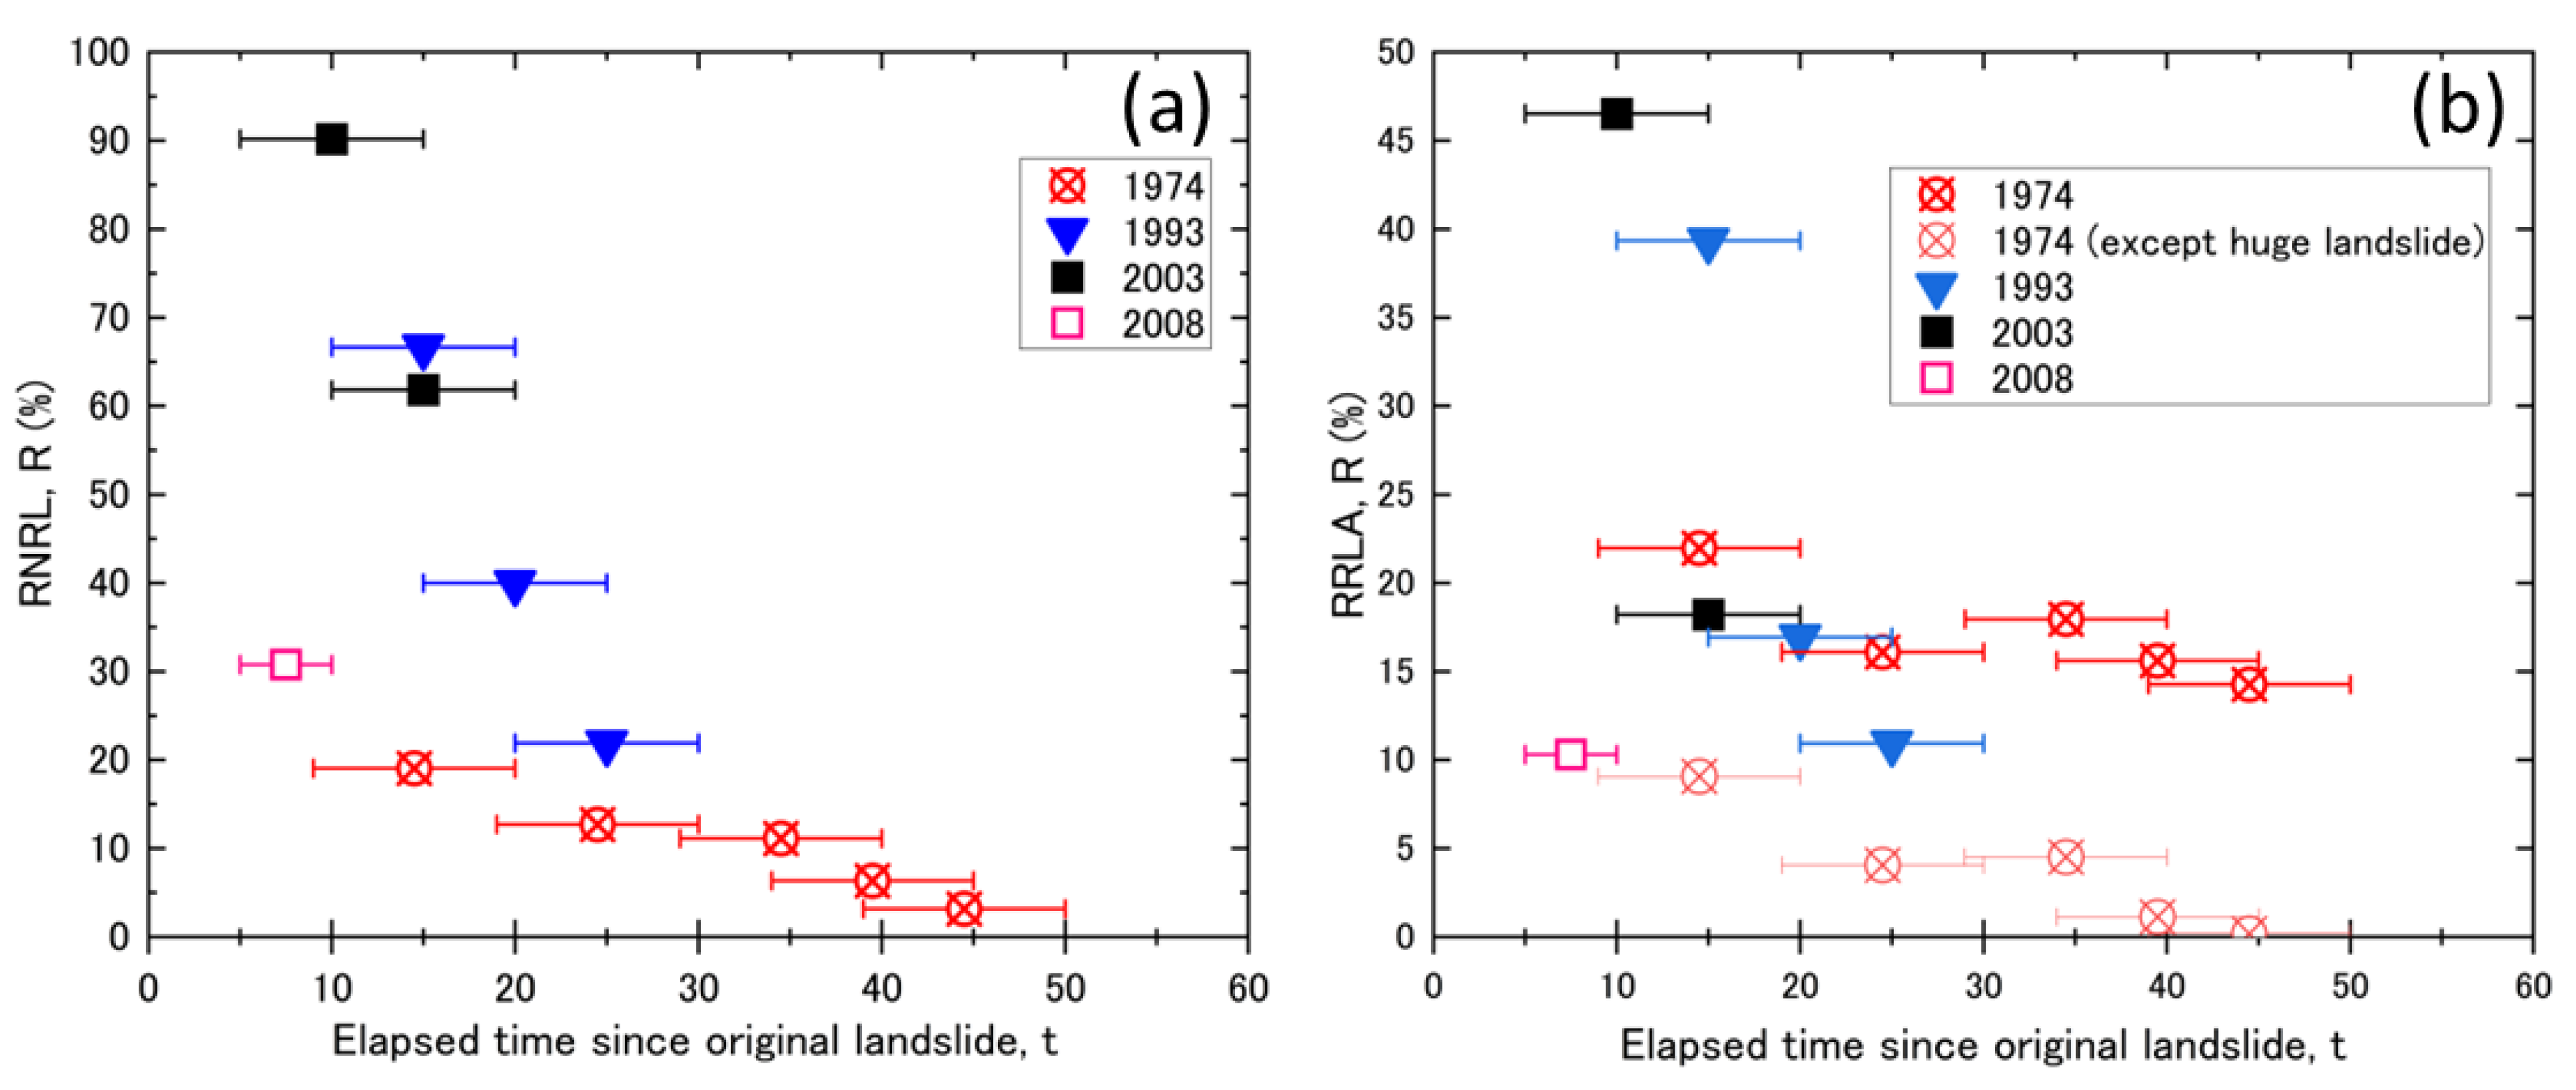
The RNRL and RRLA in each period are shown in Figure 11a,b, respectively. The year 1983 was also excluded because the number of original landslides was negligible (only five). The slope of the relational expression of the RNRL with respect to the elapsed time after the occurrence of the original landslide in each period was defined as the reduction rate and was compared for each period. The RNRL decreased exponentially (R(t) = 0.93t (R2 = 0.79)). The transition of the RNRL for each period reached the highest in the period immediately after the landslide (approximately 5–20 years after the landslide) and then decreased monotonically in each period; however, the reduction rate varied depending on the period. In 1974, the RNRL reached 18% in the period 9–20 years immediately after the landslide and then decreased in the period 39–50 years after the landslide. The reduction rate of the RNRL in 1974 was −0.5 (Figure 11a). In 1993, the RNRL reached 67% in the period 10–20 years after the landslide and then decreased in the period 20–30 years after the landslide. The reduction rate of the RNRL in 1993 was −4.5 (Figure 11a). In 2003, the RNRL reached 90% in the period 5–10 years after the landslide and then decreased in the period 10–20 years after the landslide. In 2003, the reduction rate of the RNRL was −5.7 (Figure 11a). In 1974, the smallest RNRL (18%) was observed immediately after the landslide, and the largest value was observed in 2003 (90%) (Figure 11a). The reduction rate of the RNRL was also the smallest in 1974 (−0.5) and largest in 2003 (−5.7).
The RRLA results can be described as follows. In 1974, one prominently huge landslide was included among the landslides that occurred in 1974. For this reason, we thought that a huge landslide would have an effect on the results; hence, we have also presented the related results. Similar to the transition results for the number of landslides, we plotted the RRLA for all the periods and examined its transition over time. The RRLA decreased exponentially, except for a huge landslide in 1974 (R(t) = 95.3e−0.115t (R2 = 0.75)). The transition of the RRLA for each period was the highest in the period immediately after the landslide (approximately 5–20 years after the landslide); however, it then decreased monotonically in each period, although the reduction rate varied. In 1974, the RRLA reached 22% in the period 9–20 years immediately after the landslide and then decreased in the period 39–50 years after the landslide. The reduction rate of the RRLA in 1974 was −0.2 (Figure 11b). Excluding the huge landslide in 1974, the RRLA reached 9% in the period 9–20 years after the landslide and then decreased in the period 39–50 years after the landslide. In 1974, the reduction rate of the RRLA, with the exclusion of large-scale landslides, was −0.3 (Figure 11b). In 1993, the RRLA reached 39% in the period 10–20 years after the landslide and then decreased in the period 20–30 years after the landslide. The reduction rate of the RRLA in 1993 was −2.8 (Figure 11b). In 2003, the RRLA reached 47% in the period 5 to 10 years after the landslide and then decreased in the period 10 to 20 years after the landslide. The reduction rate of RRLA in 2003 was −5.7 (Figure 11b). The lowest and highest RRLA values immediately after the landslide were observed in 1974 (9%) and 2003 (47%), respectively (Figure 11b). The lowest and highest RRLA reduction rates were observed in 1974 (−0.2) and 2003 (−5.7).
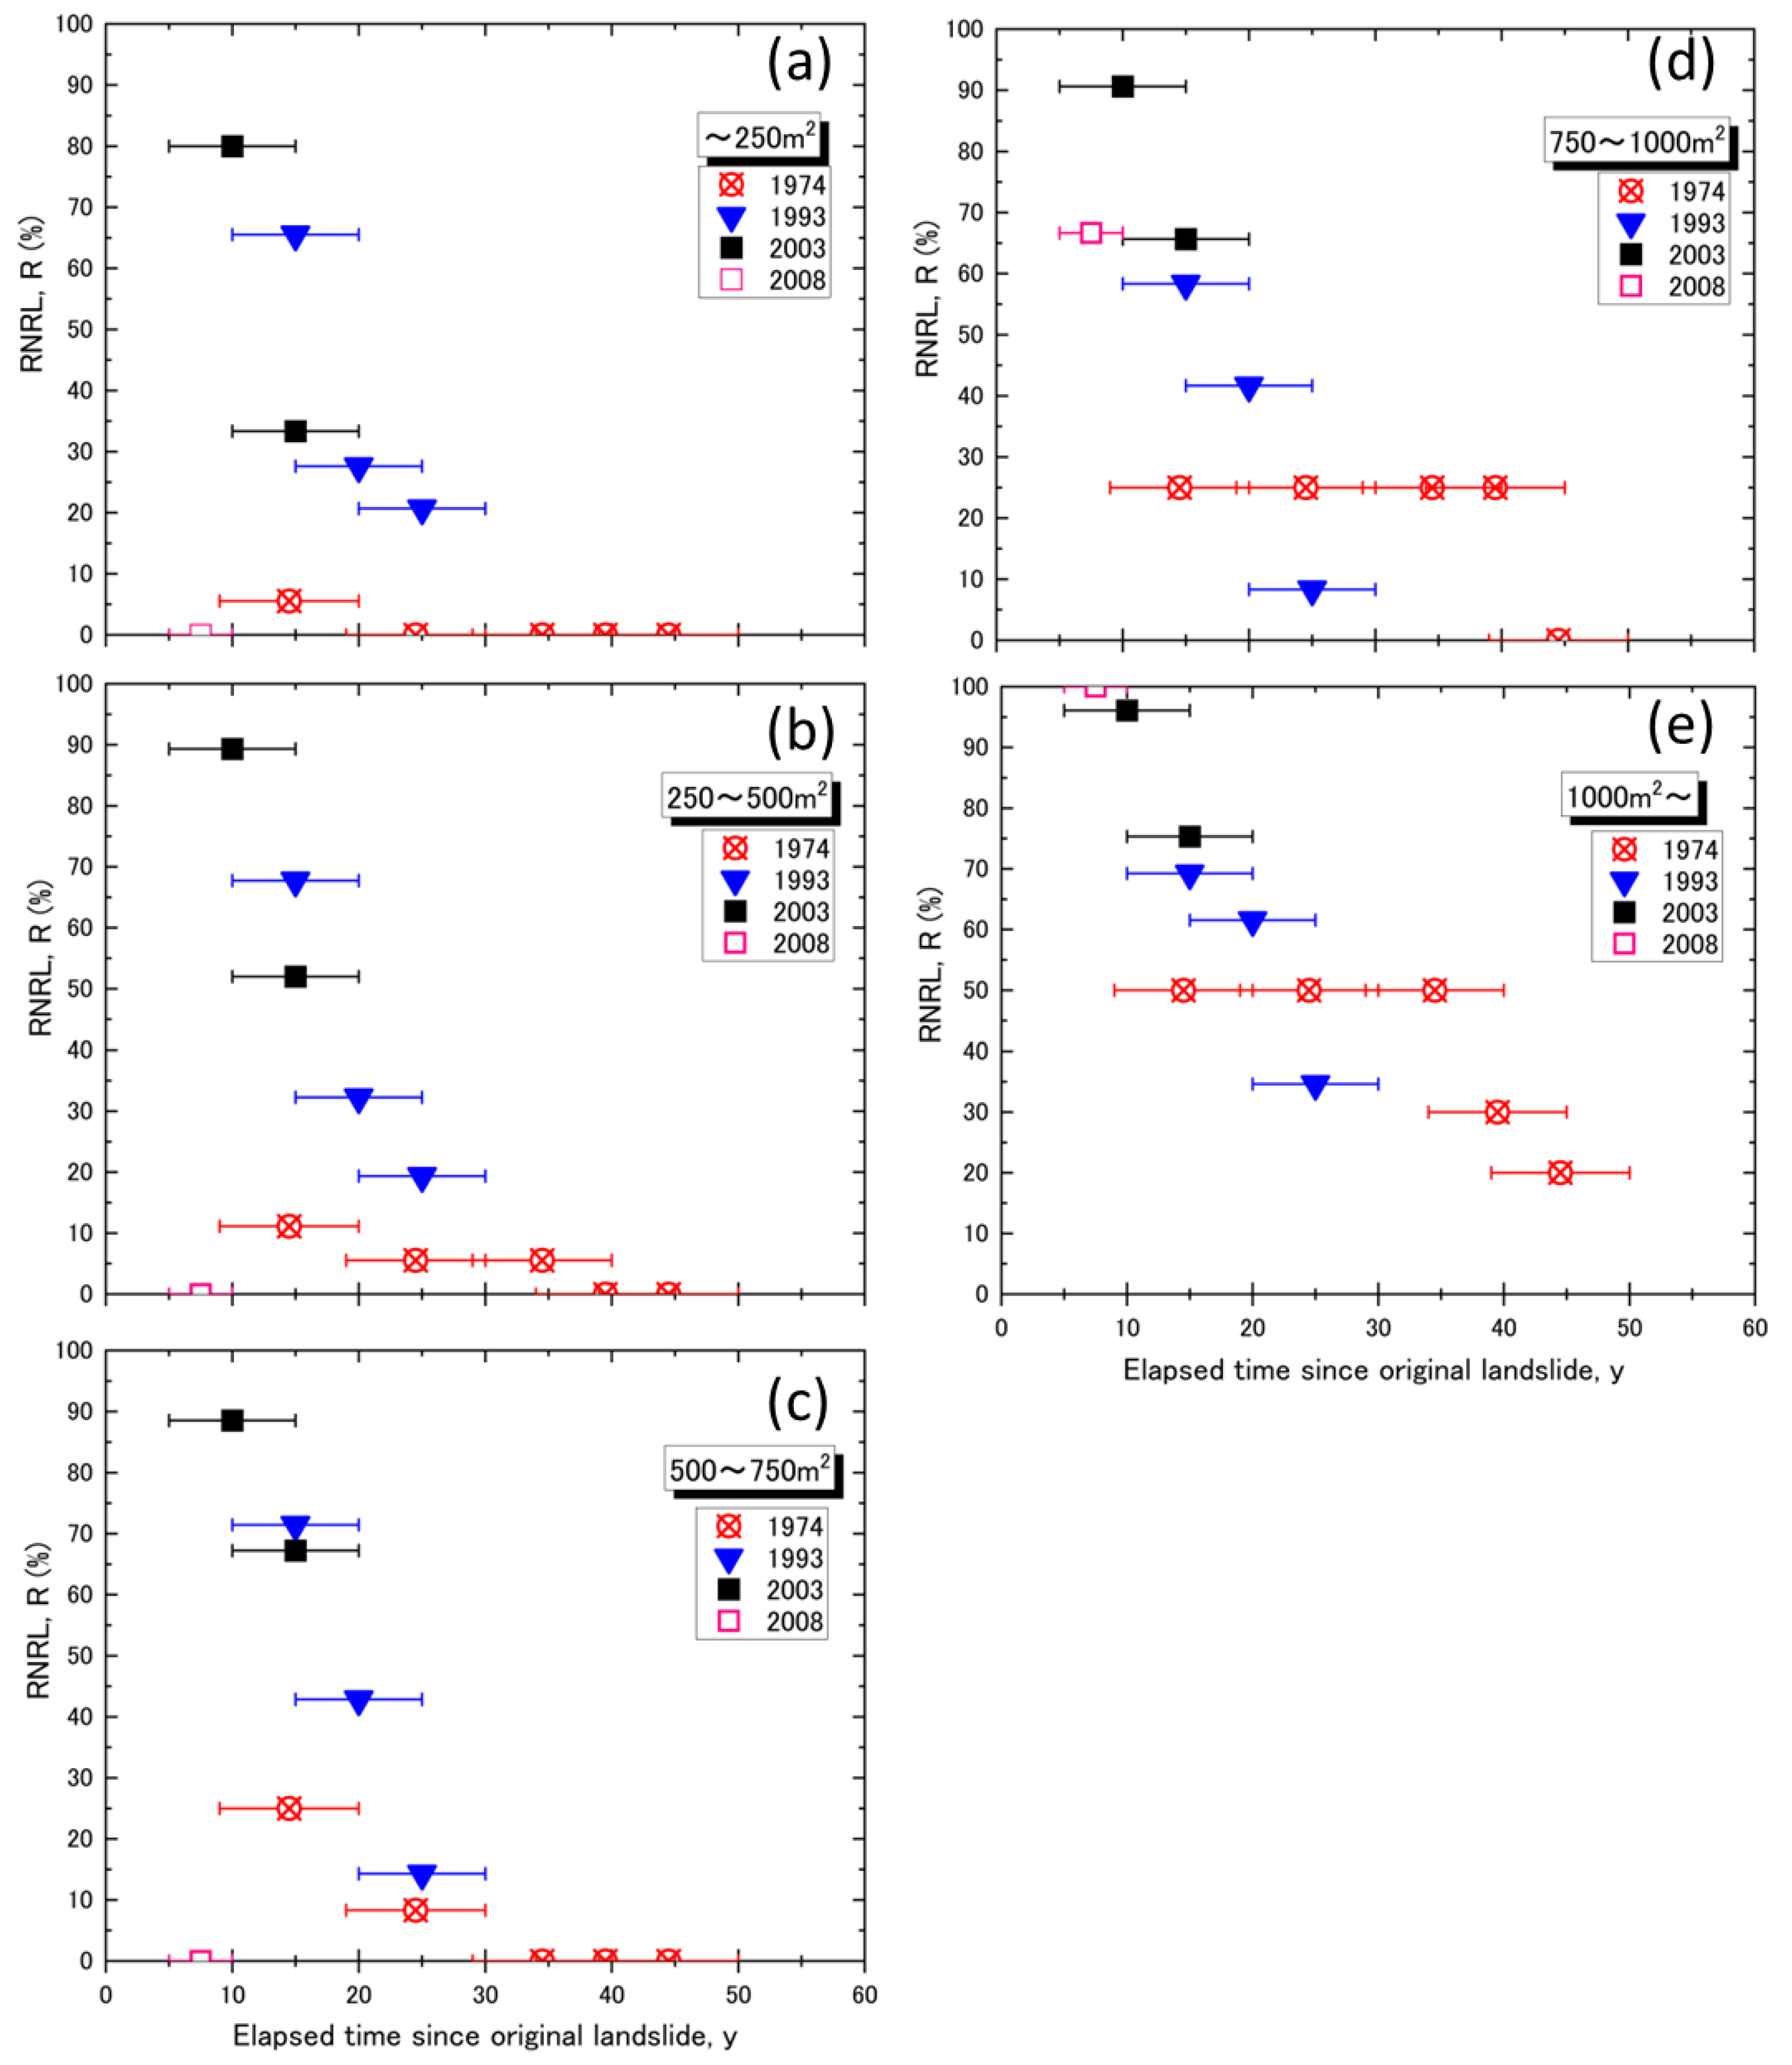
Furthermore, we organized the transition of the RNRL over time for each original landslide area (Figure 12) and compared its ratio for the same elapsed period after the landslide in each period, according to the landslide area. Consequently, for all periods, the larger the original landslide area, the higher the RNRL in the same elapsed period after the landslide (Figure 12). For example, the RNRL value 39–50 years after the landslide, which had the longest elapsed time, was 0% for original landslide areas of ≤250 m2, 250–500 m2, 500–750 m2, and 750–1000 m2. In contrast, 20% had an original landslide area of ≥1000 m2.
Furthermore, when the original landslide area was ≤250 m2, the RNRL became 0% 30 years after the landslide, whereas when the original landslide area was in the range of 750–1000 m2, the RNRL remained at 25%, even 34 years after the landslide. Therefore, the larger the area of the original landslide, the easier it was for the landslide to persist.
5. Discussion
5.1. Factors and Characteristics for the Transitioning of Expanding Landslide in Areas with a Low Frequency of Heavy Rainfall
Ishigaki et al. [15] analyzed changes in landslide area over a period of approximately 76 years using aerial photographs of the Tanzawa Mountains of Kanagawa Prefecture. Their findings showed that the ATEL-to-ATOL ratio in each period was 0–0.7. Compared with the results of Ishigaki et al. [15], the variation in this survey area was large (0–3.0) (Figure 8a). The ATEL-to-ATOL ratio from 2003 to 2008 was 4-fold greater than the maximum of 0.7 in the study by Ishigaki et al. [15]. The ATEL-to-ATOL ratio from 2008 to 2013 was 4.3-fold larger than the maximum of 0.7 in the study by Ishigaki et al. [15]. Although there are various possible reasons for the large fluctuation, compared with that reported in the study by Ishigaki et al. [15], one factor may be the difference in the frequency of heavy rainfall in the study area. Ishigaki et al. [15] investigated the Tanzawa Mountain Range, where heavy rainfall with a daily rainfall of ≥200 mm has occurred 17 times in the 40 years since 1960 [32]. However, for a period of 50 years (1963 to 2013) in this study area, heavy rainfall on the same scale occurred only three times (1981, 2001, and 2003) (Figure 2). In contrast, the transition in the ATEL-to-ATOL ratio for each period in the survey area was almost the same as the transition of the number of remaining landslides (Figure 8b). This indicated that the transition of the expanding landslide area depended on the number of remaining landslides. Therefore, this variation in the number of remaining landslides due to differences in the frequency of heavy rainfall is considered one of the factors that caused the greater variation in the ATEL-to-ATOL ratio compared with that reported by Ishigaki et al. [15]. In other words, areas with a low frequency of heavy rainfall have a greater variation in the number of landslides than areas with a high frequency of heavy rainfall. Accordingly, it is thought that the variation in the expansion of landslides is also great.
Furthermore, both the RNEL and RELA values increased with maximum daily rainfall, regardless of the passage of time (Figure 9 and Figure 10). In other words, it was expected that the frequency and area of the expanding landslide would increase according to the rainfall intensity, regardless of the number of years that had elapsed after the landslide. Therefore, it was assumed that the period during which expanding landslides occurred frequently was controlled by the number of remaining landslides and the rainfall intensity after the landslides.
5.2. Ratio of Remaining Landslides to the Original Landslide over Time
As discussed in Section 5.1, the period during which expanding landslides occurred frequently was controlled by the number of remaining landslides. The formula for estimating the number of remaining landslides in this study area was R(t) = 0.93t. Tsukamoto et al. [14] investigated the transition of landslides over the 36-year period from 1959 to 1995 on the southeastern slope of Mt. South Kiso, Japan. They reported that 10 years after 1959, the RNRL landslide was at 41%. According to the estimation formula in this study (R(t) = 0.93t), the RNRL 10 years after the landslide was estimated to be 48%. Therefore, although the value estimated in this study was approximately 7% higher, the results were almost the same as those of Tsukamoto et al. [14]. In addition, Samia et al. [6] quantitatively investigated the duration of original landslides and the rate of remaining landslides over approximately 70 years in the Collazzone region of Umbria, central Italy. Samia et al. [6] calculated the remaining landslide rate as the product of the RNRL and the ratio of the remaining landslide area to the catchment area. Therefore, although slightly different from the estimation formula in this study, the remaining landslide rates for 10 and 40 years after the landslide were reported to be 25% and 1%, respectively. With the estimation formula used in this study, the RNRL was 48% at 10 years after the landslide, which was 23% higher than that reported by Samia et al. [6]. However, 40 years after the landslide, it was 5%, which was similar to that reported by Samia et al. [6]. Therefore, the estimation formula proposed in this study may show a deviation from the measured value for the duration immediately after the landslide. However, this deviation was considered to be negligible.
With respect to the remaining landslides over time, differences have been reported depending on the size of the landslide and the geological conditions of the slope [6,14,17,18,33,34,35]. Therefore, it is possible that regional characteristics are one of the factors behind the differences observed at this survey site 10 years after the landslide, compared with that reported by Samia et al. [6]. From the above, although the remaining landslide rate at a certain time after the occurrence of the landslide confirms a slight difference, due to the difference in the scale and geological conditions of the original landslide area, the remaining landslide rate exponentially decreases with time.
Tsukamoto et al. [14] attributed the exponential decrease in the remaining landslide rate to the fact that the frequency distribution curve of the landslide areas of the original landslides was asymmetric (Poisson distribution) and that the vegetation recovery rate was constant. The frequency distribution curves of the landslide areas of the original landslides in all periods analyzed in this study were asymmetrical, and the landslide density in each period tended to increase as the landslide area decreased (Figure 7). Furthermore, we ascertained the transition of the RNRL over time for each original landslide area (Figure 12) and compared its ratio for the same elapsed period after the landslide in each period according to the landslide area. Consequently, the larger the original landslide area, the higher the RNRL during the same elapsed period after the landslide (Figure 12). For this reason, the exponential decrease in the RNRL is thought to be due to the asymmetry (Poisson distribution) of many landslide areas with small original landslide areas and vegetation recovery from small landslides.
5.3. Evaluation of the Influence Period of the Expanding Landslide, Considering the Transitioning of the Remaining Landslide
Previous studies have often reported that expanding landslides become more pronounced when a landslide caused by an earthquake is subjected to subsequent rainfall [10,11,12,36,37,38,39,40,41]. This is possibly because an earthquake caused cracks around the landslide area; the cracks become lines of weakness and the subsequent rainfall causes landslides [38,41]. In addition, it has been reported that even a small amount of rainfall after an earthquake, approximately 50–70% of the pre-earthquake rainfall, causes the landslide area to expand [10]. Furthermore, an expanding landslide becomes significant even when the remaining landslide area is affected by an earthquake [42,43]. The Tokachi-oki earthquake occurred near the study area, the epicenter of which was off Kushiro, on 26 September 2003, 1 month after heavy rainfall. However, because the study area is far from the epicenter and the maximum seismic intensity was approximately 4 [44], it was not evident that the earthquake had a strong impact after the landslide occurred.
Expanding landslides become active when earthquake-induced landslides are affected by rainfall or remaining landslides are affected by earthquakes. However, in this study, it was confirmed that even if there was no earthquake impact after a landslide caused by heavy rainfall, the expanding landslide became significant at the entire basin scale (Figure 8).
As described in Section 5.1, we estimated that the frequency and area of expanding landslides would increase according to the number of remaining landslides and maximum daily rainfall after the landslide. In other words, “the number of remaining landslides” and “maximum daily rainfall after the landslide” are considered to be important indicators in evaluating the period of impact of expanding landslides due to heavy rainfall. In addition, the number of remaining landslides can be estimated using the formula described in Section 5.2. Therefore, by multiplying the function for the maximum daily rainfall after a landslide by the estimation formula for the number of remaining landslides shown in Section 5.2, we proposed an empirical formula for the number of expanding landslides after heavy rainfall. This allowed us to assess the impact period of the expanding landslides.
6. Conclusions
In this study, we selected the Saru River Basin in Hokkaido as a region with a low frequency of heavy rainfall that has not received much research attention thus far, and clarified the factors and characteristics associated with the transitioning of an expanding landslide. In addition, we estimated the number and area of the remaining landslides and evaluated the influence period of the expanding landslide, considering the transition of the remaining landslide. To clarify the characteristics and factors that affect the period during which expanding landslides occur, we investigated (i) the relationship between transitions in expanding landslides and transitions in remaining landslides, and (ii) the relationship between transitions in expanding landslides, elapsed years since the landslide, and rainfall intensity.
After investigating the relationship between “the ratios of expanding landslide area to the original landslide area” and “the number of remaining landslides”, we found that there is a correspondence relationship between the two. In other words, our findings showed that the expanding landslide depends on the transition of the number of remaining landslides. Furthermore, the RNEL and RELA depend on the maximum daily rainfall, regardless of the elapsed time. Taken together, our findings reveal that “the number of remaining landslides” and “maximum daily rainfall after the landslide” are related factors that determine the period during which expanding landslides frequently occur.
It is possible to estimate the number of remaining landslides over time based on the ratio of the number of original landslides (R(t) = 0.93t). Therefore, by multiplying the function for the maximum daily rainfall after a landslide by the estimation formula for the number of remaining landslides, we propose an empirical formula for the number of expanding landslides after heavy rainfall. Therefore, it is possible to evaluate the impact period of the expanding landslides caused by heavy rainfall in this area. Thus, it is predicted that after heavy rainfall, the number of remaining landslides will increase, and even after a certain amount of time has passed, once heavy rainfall occurs, expanding landslides will become active.
Future studies should develop empirical formulas for various regions with different topographical, geological, and climatic conditions for evaluating the period of impact of the expanding landslides in each region. These results will provide useful information for comprehensive watershed sediment management.
Author Contributions
Conceptualization, K.K. and T.U.; methodology, K.K. and T.U.; software, K.K.; validation, K.K. and T.U.; formal analysis, K.K.; investigation, K.K.; resources, K.K.; data curation, K.K.; writing—original draft preparation, K.K.; writing—review and editing, K.K. and T.U.; visualization, K.K.; supervision K.K. and T.U.; project administration, K.K.; funding acquisition, K.K. and T.U. All authors have read and agreed to the published version of the manuscript.
Funding
This work was supported by JSPS KAKENHI, grant number JP26870830, JP21K05674.
Data Availability Statement
Not applicable.
Acknowledgments
We would like to thank T. Yamada for helpful insights.
Conflicts of Interest
The authors declare no conflict of interest.
References
- Koi, T.; Hotta, N.; Ishigaki, I.; Matuzaki, N.; Uchiyama, Y.; Suzuki, M. Prolonged impact of earthquake-induced landslides on sediment yield in a mountain watershed: The Tanzawa region, Japan. Geomorphology 2008, 101, 692–702. [Google Scholar] [CrossRef]
- Korup, O. Earth’s portfolio of extreme sediment transport events. Earth-Sci. Rev. 2012, 112, 115–125. [Google Scholar] [CrossRef]
- Stolle, A.; Schwanghart, W.; Andermann, C.; Bernhardt, A.; Fort, M.; Jansen, J.D.; Wittmann, H.; Merchel, S.; Rugel, G.; Adhikari, B.R.; et al. Protracted river response to medieval earthquakes. Earth Surf. Process. Landf. 2018, 44, 331–341. [Google Scholar] [CrossRef]
- Izumiyama, H.; Uchida, T.; Horie, K.; Sakurai, W. Characteristics of sediment dynamics following large-scale sediment supply events in mountain watersheds in Japan. Geomorphology 2020, 367, 107301. [Google Scholar] [CrossRef]
- Kasai, M.; Marutani, T.; Brierley, G. Channel bed adjustments following major aggradation in a steep headwater setting: Findings from Oyabu Creek, Kyushu, Japan. Geomorphology 2004, 62, 199–215. [Google Scholar] [CrossRef]
- Samia, J.; Temme, A.; Bregt, A.; Wallinga, J.; Guzzetti, F.; Ardizzone, F.; Rossi, M. Do landslides follow landslides? Insights in path dependency from a multi-temporal landslide inventory. Landslides 2017, 14, 547–558. [Google Scholar] [CrossRef]
- Saba, S.B.; van der Meijde, M.; van der Werff, H. Spatiotemporal landslide detection for the 2005 Kashmir earthquake region. Geomorphology 2010, 124, 17–25. [Google Scholar] [CrossRef]
- Wu, C.H. Evaluating the landslide stability and vegetation recovery: Case studies in the Tsengwen reservoir watershed in Taiwan. Water 2021, 13, 3479. [Google Scholar] [CrossRef]
- Parker, R.; Hancox, G.; Petley, D.; Massey, C.; Densmore, A.; Rosser, N. Spatial distributions of earthquake-induced landslides and hillslope preconditioning in the northwest South Island, New Zealand. Earth Surf. Dyn. 2015, 3, 501–525. [Google Scholar] [CrossRef]
- Tomita, Y.; Sakurai, W.; Naka, N. Study on the Extension of Collapse Caused by Rainfall after the Earthquake in Rokko Mountain Range. J. Jpn. Soc. Erosion. Control Eng. 1996, 48, 15–21. [Google Scholar] [CrossRef]
- Marc, O.; Hovius, N.; Meunier, P.; Uchida, T.; Hayashi, S. Transient changes of landslide rates after earthquakes. Geology 2015, 43, 883–886. [Google Scholar] [CrossRef]
- Khattak, G.A.; Owen, L.A.; Ulrich, K.; Harp, E.L. Evolution of earthquake-triggered landslides in the Kashmir Himalaya, northern Pakistan. Geomorphology 2010, 115, 102–108. [Google Scholar] [CrossRef]
- Li, C.; Wang, M.; Liu, K. A decadal evolution of landslides and debris flows after the Wenchuan earthquake. Geomorphology 2018, 323, 1–12. [Google Scholar] [CrossRef]
- Tsukamoto, Y.; Kosaka, I.; Takizawa, H.; Ishigaki, I.; Ookoshi, M.; Fukuda, T. Process of occurrence and recovery of surface soil slides. J. Jpn. Soc. Erosion. Control Eng. 2001, 54, 63–72. [Google Scholar] [CrossRef]
- Ishigaki, I.; Hiruma, N.; Ohkawa, W.; Matsuzaki, N.; Abe, K.; Suzuki, M.; Utiyama, Y. Forest vegetation recovery process on a landslided hillslope for 75 years, in Nakanosawa watershed, the western Tanzawa. J. Jpn. Soc. Reveget. Technol. 2006, 32, 171–176. [Google Scholar] [CrossRef]
- Tseng, C.-M.; Chen, Y.-R.; Chang, C.-M.; Chue, Y.-S.; Hsieh, S.-C. Assessment of Rainfall-Induced Landslide Distribution Based on Land Disturbance in Southern Taiwan. ISPRS Int. J. Geo-Inf. 2021, 10, 209. [Google Scholar] [CrossRef]
- Shimokawa, E. A natural recovery process of vegetation on landslide scars and landslide periodicity in forested drainage basins. In Proceedings of the Symposium on Effect of Forest Land Use on Erosion and Slope Stability Environment and Policy, East and West Center, Honolulu, HI, USA, 7–11 May 1984; pp. 99–107. [Google Scholar]
- Trustrum, N.; De Rose, R. Soil depth-age relationship of landslides on deforested hillslopes, taranaki, New Zealand. Geomorphology 1988, 1, 143–160. [Google Scholar] [CrossRef]
- Iida, T. A Probability Model of the Slope Failure based on Soil Depth Distribution. Trans. Jpn. Geomorphol. Union 1996, 17, 69–88. [Google Scholar]
- Smale, M.C.; McLeod, M.; Smale, P.N. Vegetation and soil recovery on shallow landslide scars in tertiary hill country, East Cape Region, New Zealand. N. Z. J. Ecol. 1997, 21, 31–41. [Google Scholar]
- Lin, W.T.; Chou, W.C.; Lin, C.Y.; Huang, P.H.; Tsai, J.S. Vegetation recovery monitoring and assessment at landslides caused by earthquake in Central Taiwan. For. Ecol. Manag. 2005, 210, 55–66. [Google Scholar] [CrossRef]
- Shou, K.J.; Hong, C.Y.; Wu, C.C.; Hsu, H.Y.; Fei, L.Y.; Lee, J.F.; Wei, C.Y. Spatial and temporal analysis of landslides in Central Taiwan after 1999 Chi-Chi earthquake. Eng. Geol. 2011, 123, 122–128. [Google Scholar] [CrossRef]
- Hovius, N.; Meunier, P.; Lin, C.W.; Chen, H.; Chen, Y.G.; Dadson, S.; Horng, M.J.; Lines, M. Prolonged seismically induced erosion and the mass balance of a large earthquake. Earth Planet. Sci. Lett. 2011, 304, 347–355. [Google Scholar] [CrossRef]
- Liu, S.H.; Lin, C.W.; Tseng, C.M. A statistical model for the impact of the 1999 Chi-Chi earthquake on the subsequent rainfall-induced landslides. Eng. Geol. 2013, 156, 11–19. [Google Scholar] [CrossRef]
- Geological Survey of Japan, AIST. Seamless Digital Geological Map of Japan V2 1: 200,000. 2022. Available online: https://gbank.gsj.jp/seamless (accessed on 17 June 2022).
- Kimura, T.; Kasai, M.; Ebisu, N.; Marutani, T. Patterns of Sediment Flux Determined from Dendrochronological Analysis of Debris Fans within Headwater Catchments, Hokkaido, Japan. Trans. Jpn. Geomorphol. Union 2012, 33, 61–81. [Google Scholar]
- Saito, H.; Korup, O.; Uchida, T.; Hayashi, S.; Oguchi, T. Rainfall conditions, typhoon frequency, and contemporary landslide erosion in Japan. Geology 2014, 42, 999–1002. [Google Scholar] [CrossRef]
- Mizugaki, S.; Abe, T.; Murakami, Y.; Maruyama, M.; Kubo, M. Fingerprinting suspended sediment source in the Nukabira River, northern Japan. Int. J. Eros. Control. Eng. 2012, 5, 60–69. [Google Scholar] [CrossRef]
- Koshimizu, K.; Uchida, T. The effect of subsequent expanding shallow landslides after heavy rainfalls on catchment-scale sediment yield. J. Jpn. Soc. Erosion. Control Eng. 2017, 69, 19–26. [Google Scholar] [CrossRef]
- Leonarduzzi, E.; Molnar, P. Deriving rainfall thresholds for landsliding at the regional scale: Daily and hourly resolutions, normalisation, and antecedent rainfall. Nat. Hazards Earth Syst. Sci. 2020, 20, 2905–2919. [Google Scholar] [CrossRef]
- Tsunetaka, H. Comparison of the return period for landslide-triggering rainfall events in Japan based on standardization of the rainfall period. Earth Surf. Process. Landf. 2021, 46, 2984–2998. [Google Scholar] [CrossRef]
- Yamamoto, H.; Iwaya, K.; Suzuki, K.; Hayakawa, S.; Suzuki, S. Heavy Rainfall Disaster Characteristics in Tanzawa Area of Kanagawa Prefecture from August 13 to 14, 1999 by Tropical Depression. J. Jpn. Soc. Nat. Disaster. Sci. 2001, 19, 425–436. [Google Scholar]
- Numamoto, S.; Suzuki, M.; Nagatomo, M.; Kuraji, K.; Sakura, T.; Ohta, T. Monitoring of revegetation after slope failure using aerial photography. J. Jpn. Soc. Erosion. Control Eng. 1999, 52, 14–20. [Google Scholar] [CrossRef]
- Tsukamoto, Y. A process model of devastation and recovery of forested mountains. J. Jpn. Soc. Erosion. Control Eng. 2002, 54, 66–77. [Google Scholar] [CrossRef]
- Wu, C.H. Comparison and evolution of extreme rainfall-induced landslides in Taiwan. ISPRS Int. J. Geo-Inf. 2017, 6, 367. [Google Scholar] [CrossRef]
- Dadson, S.J.; Hovius, N.; Chen, H.; Dade, W.B.; Lin, J.C.; Hsu, M.L.; Lin, C.W.; Horng, M.J.; Chen, T.C.; Milliman, J.; et al. Earthquake-triggered increase in sediment delivery from an active mountain belt. Geology 2004, 32, 733–736. [Google Scholar] [CrossRef]
- Lin, C.W.; Liu, S.H.; Lee, S.Y.; Liu, C.C. Impacts of the Chi-Chi earthquake on subsequent rainfall-induced landslides in central Taiwan. Eng. Geol. 2006, 86, 87–101. [Google Scholar] [CrossRef]
- Koyama, K.; Fujita, M.; Maeda, Y.; Tada, Y.; Ochiai, H.; Sammori, T.; Daimaru, H.; Murakami, W.; Kawai, T.; Iwamura, N. Characteristics of slope failure by the local downpour on September 4, 2007 in Kotoura-town, Tottori prefecture. J. Jpn. Soc. Erosion. Control Eng. 2009, 62, 52–59. [Google Scholar] [CrossRef]
- Daimaru, H.; Kurokawa, U.; Murakami, W.; Matsuura, S. Topographic features of deep-seated landslides inferred from multi-temporal geographical information in Senzu district, central Japan. J. Jpn. Landslide Soc. 2013, 50, 24–33. [Google Scholar] [CrossRef]
- Ishikawa, Y.; Akazawa, F.; Ue, H.; Ohno, H.; Osanai, N.; Kaibori, M.; Kubota, T.; Koga, S.; Gonda, Y.; Sakashima, T.; et al. Secondary sediment movements and secondary sediment disasters caused by rainfalls after the Kumamoto Earthquake in April 2016. J. Jpn. Soc. Erosion. Control Eng. 2016, 69, 25–36. [Google Scholar] [CrossRef]
- Murakami, W.; Daimaru, H.; Kaneko, M. Geomorphological characteristics of mountain slopes with landslides induced by rainfalls after the Iwate-Miyagi nairiku earthquake in 2008. J. Jpn. Landslide Soc. 2017, 54, 3–12. [Google Scholar] [CrossRef]
- Ishigaki, I. Generation of shallow landslide and feature of vegetation recovery in Yakumo region, Hokkaido Japan. J. Jpn. Soc. Reveget. Technol. 2005, 30, 572–581. [Google Scholar] [CrossRef]
- Saito, H.; Uchiyama, S.; Hayakawa, Y.S.; Obanawa, H. Landslides triggered by an earthquake and heavy rainfalls at Aso volcano, Japan, detected by UAS and SfM-MVS photogrammetry. Prog. Earth Planet. Sci. 2018, 5, 5–15. [Google Scholar] [CrossRef]
- Japan Meteorological Agency. 2003. Available online: https://www.data.jma.go.jp/eqev/data/kyoshin/jishin/030926_tokachioki/index.html (accessed on 31 July 2017).
Figure 1.
Location map of the study site.

Figure 2.
Maximum daily rainfall from 1963 to 2013.

Figure 3.
Classification of the original and expanding landslides using orthophotography. Original landslide: landslides where a bare area was observed during a set photography period (blue outline in the center image), compared with the area covered by vegetation during the previous photography period (left image). Expanding landslide: landslides where the bare area has expanded to the area (red outline in the right image) adjacent to the landslide, compared with the previous photography period (center image).

Figure 4.
Extraction of remaining landslides (shrunk landslides). Remaining landslide: a landslide where a bare area was continuously observed during the current period of interest (yellow solid line in the right image), compared with the landslide area during the previous period of interest (red solid line in the left image and red dotted line in the right image).

Figure 5.
Analysis flow chart.

Figure 6.
Multi-temporal landslide inventory map in the study area.

Figure 7.
Histogram of the original landslide area for each year: (a) 1974, (b) 1993, (c) 2003, and (d) 2008.
Figure 7.
Histogram of the original landslide area for each year: (a) 1974, (b) 1993, (c) 2003, and (d) 2008.

Figure 8.
(a): Relationship between the average annual total area of original and expanding landslides and ATEL/ATOL for each period. (b): Relationship between the number of remaining landslides and ATEL/ATOL for each period.
Figure 8.
(a): Relationship between the average annual total area of original and expanding landslides and ATEL/ATOL for each period. (b): Relationship between the number of remaining landslides and ATEL/ATOL for each period.

Figure 9.
(a): Relationship between the RNEL and the elapsed time since the original landslide. (b): Relationship between the RELA and the elapsed time since the original landslide.
Figure 9.
(a): Relationship between the RNEL and the elapsed time since the original landslide. (b): Relationship between the RELA and the elapsed time since the original landslide.

Figure 10.
(a): Relationship between the RNEL and maximum daily rainfall. (b): Relationship between the RELA and maximum daily rainfall.
Figure 10.
(a): Relationship between the RNEL and maximum daily rainfall. (b): Relationship between the RELA and maximum daily rainfall.

Figure 11.
(a): Relationship between the RNRL and the elapsed time since the original landslide. (b): The relationship between the RRLA and the elapsed time since the original landslide.
Figure 11.
(a): Relationship between the RNRL and the elapsed time since the original landslide. (b): The relationship between the RRLA and the elapsed time since the original landslide.

Figure 12.
Transitions of RNRL over time for various original landslide areas (a): 0–250 m2, (b): 250–500 m2, (c): 500–750 m2, (d): 750–1000 m2, (e): over 1000 m2.
Figure 12.
Transitions of RNRL over time for various original landslide areas (a): 0–250 m2, (b): 250–500 m2, (c): 500–750 m2, (d): 750–1000 m2, (e): over 1000 m2.


Table 1.
List of aerial photographs.
| Year | Date | Scale |
|---|---|---|
| 1963 | 30 May, 17 June, 19 June, 28 June | 1:20,000 |
| 1974 | 1 August | 1:20,000 |
| 1983 | 29 September, 8 October, 19 October, 21 October | 1:16,000 |
| 1993 | 6 July, 31 August, 2 September, 15 September, 17 September | 1:16,000 |
| 2003 | 16 September | 1:16,000 |
| 2008 | 6 August, 10 September | 1:16,000 |
| 2013 | 6 September, 13 September, 27 September | 1:16,000 |
Disclaimer/Publisher’s Note: The statements, opinions and data contained in all publications are solely those of the individual author(s) and contributor(s) and not of MDPI and/or the editor(s). MDPI and/or the editor(s) disclaim responsibility for any injury to people or property resulting from any ideas, methods, instructions or products referred to in the content. |
© 2023 by the authors. Licensee MDPI, Basel, Switzerland. This article is an open access article distributed under the terms and conditions of the Creative Commons Attribution (CC BY) license (https://creativecommons.org/licenses/by/4.0/).
Share and Cite
MDPI and ACS Style
Koshimizu, K.; Uchida, T. Time-Series Variation of Landslide Expansion in Areas with a Low Frequency of Heavy Rainfall. Geosciences 2023, 13, 314. https://0-doi-org.brum.beds.ac.uk/10.3390/geosciences13100314
AMA Style
Koshimizu K, Uchida T. Time-Series Variation of Landslide Expansion in Areas with a Low Frequency of Heavy Rainfall. Geosciences. 2023; 13(10):314. https://0-doi-org.brum.beds.ac.uk/10.3390/geosciences13100314
Chicago/Turabian StyleKoshimizu, Ken’ichi, and Taro Uchida. 2023. "Time-Series Variation of Landslide Expansion in Areas with a Low Frequency of Heavy Rainfall" Geosciences 13, no. 10: 314. https://0-doi-org.brum.beds.ac.uk/10.3390/geosciences13100314
Note that from the first issue of 2016, this journal uses article numbers instead of page numbers. See further details here.