Article

Large Earthquakes in Subduction Zones around the Polar Regions as a Possible Reason for Rapid Climate Warming in the Arctic and Glacier Collapse in West Antarctica

by
Leopold I. Lobkovsky
1,2,3,4,*,
Alexey A. Baranov
5,
Igor A. Garagash
6,7,
Mukamay M. Ramazanov
7,8,
Irina S. Vladimirova
1,9,
Yurii V. Gabsatarov
1,9,
Dmitry A. Alekseev
2,3,4,6,* and
Igor P. Semiletov
2,4
1
Shirshov Institute of Oceanology of the Russian Academy of Sciences, 117997 Moscow, Russia
2
Science Department, Tomsk State University, 634050 Tomsk, Russia
3
Moscow Institute of Physics and Technology (MIPT), Phystech School of Radio Engineering and Computer Technology, 141700 Dolgoprudny, Russia
4
V.I. Il’ichev Pacific Oceanological Institute, Far Eastern Branch Russian Academy of Sciences, 690041 Vladivostok, Russia
5
Institute of Earthquake Prediction Theory and Mathematical Geophysics, Russian Academy of Sciences, 117997 Moscow, Russia
6
Schmidt Institute of Physics of the Earth, Russian Academy of Sciences, 123242 Moscow, Russia
7
Sadovsky Institute of Geosphere Dynamics, Russian Academy of Sciences, 119334 Moscow, Russia
8
Geothermal Research and Renewable Energy—Branch of Joint Institute for High Temperatures of the Russian Academy of Sciences, 367032 Makhachkala, Russia
9
Geophysical Survey of the Russian Academy of Sciences, 249035 Obninsk, Russia
*
Authors to whom correspondence should be addressed.
Submission received: 16 April 2023 / Revised: 19 May 2023 / Accepted: 2 June 2023 / Published: 8 June 2023

Abstract

:
A correlation is observed between changes in the level of Earth’s seismic activity and increments of the atmospheric methane concentration over the past 40 years. Trigger mechanisms are proposed for methane emissions and glacier collapse in polar regions. These mechanisms are due to deformation waves caused by large earthquakes in subduction zones located near the polar regions: the Aleutian and Kuril–Kamchatka subduction zones, closest to the Arctic, and the Antarctica–Chilean and Tonga–Kermadec–Macquarie subduction zones. Disturbances of the lithosphere are transmitted over the distances of 3000–4000 km and more at a speed of about 100 km/year. Additional associated stresses come to the Arctic and Antarctica several decades after the occurrence of large earthquakes. In the Arctic zone, additional stresses affect the low-permeability structure of gas bearing sedimentary strata, causing increased methane emission and climate warming. In West Antarctica, deformation waves could trigger the acceleration and intensive collapse of West Antarctic glaciers, which has been observed since the 1970s. These waves are also capable of activating dormant volcanoes located under the sheet glaciers of West Antarctica, leading to an increase in heat flux, to the melting of ice at the glaciers’ base, and to their accelerated sliding towards the ocean, as is happening with the Thwaites Glacier.

1. Introduction

Among the possible natural drivers of the Earth’s climate change, the large earthquakes with a magnitude greater than 8 occurring in the subduction zones of the Pacific lithosphere are of great importance. There is a very even correlation between the total release of seismic energy from the Earth, which is 90% determined by the energy of large earthquakes with a magnitude greater than 8, and modern climate warming. This correlation lies in the fact that the peak of the total seismic activity of the Earth in the 20th century fell during the time interval 1952–1965, and the beginning of modern global warming refers to the period 1978–1980; that is, there is a delay of about 20–30 years marking the beginning of a sharp warming relative to the maximum release of seismic energy from the Earth. At the same time, warming is most pronounced in the Arctic. Thus, it is necessary to answer two main questions: (1) Why did modern climate warming begin at the end of the 1970s? (2) Why is the strongest warming confined to the Arctic region?
The possible answers to these questions were obtained within the framework of the recently proposed seismogenic trigger mechanism for the destruction of metastable gas hydrates of the Arctic shelf and intense methane emission as a result of the action of deformation lithosphere waves excited by the large earthquakes in the Aleutian subduction zone that occurred in the middle of the 20th century [1]. These waves traveled at a speed of about 100 km/year, the distance of about 2000 km between the Aleutian island arc and the Arctic shelf over 20 years, which explains the time shift of the onset of a sharp warming in the Arctic relative to the action of the seismogenic driver in the subduction zone.
Along with methane emissions on the Arctic shelf, there is numerous evidence of gas blowouts and methane emissions in various land areas of the Arctic zone, particularly in the Timan–Pechora region, in Western and Eastern Siberia, in the northern part of the Russian Far East, and in the northern parts of Canada and Alaska, which are located in the permafrost zone [2].
It is obvious that the seismogenic trigger mechanism originally proposed for the case of methane emission on the Arctic shelf should be extended to the entire vast land area of the Arctic zone, where the sedimentary strata contain very large amount of gas, existing both in free form and as partially dissociated gas hydrates. This gas is usually trapped in the micropores of low-permeability permafrost and sedimentary formations beneath permafrost, and can be released as a result of volumetric destruction of the rock microstructure, accompanied by the emergence of microcracks and microchannels that provide gas filtration [3,4,5,6,7,8,9,10,11,12,13,14].
Deformation waves originating from the large earthquake sources in the Aleutian and Kuril–Kamchatka island arcs and arriving at the land areas of the Arctic zone serve as a trigger mechanism for the destruction of the internal structure of gas-saturated low-permeability sedimentary rocks, leading to an increase in methane emission and a greenhouse effect. It is important to note that there is a clearly visible correlation between the change in the level of the released seismic energy of the Earth and the incremental methane concentration in the atmosphere over the past 40 years, with a some 20-year time shift between these processes, which obviously supports the proposed seismogenic trigger hypothesis of the climate warming [15].
Large reserves of methane in subglacial and underwater sediments were also found in and around Antarctica in the form of gas hydrates [16,17,18]. We suggest that a similar seismogenic trigger mechanism also applies for Antarctica. Here, the subduction zones (Chilean, Sandwich and Kermadec–Macquarie) are the places of occurrence of the large earthquakes, which generate deformation lithospheric waves reaching Antarctica about 30–40 years after seismic events, covering the distances of 3500–4000 km between wave generation sites and Antarctica, where they destroy glaciers and subglacial gas hydrates due to additional stresses [19,20].
The current phase of glacier collapse in West Antarctica began in the 1970s and, in accordance with the seismogenic trigger mechanism, can be explained by a series of large earthquakes that occurred in the 1940s (that is, 30 years earlier) in the Chilean subduction zone. Later, the process of glacier collapse in the Antarctic Peninsula intensified, starting with the collapse of the Larsen A glacier in 1995, which was caused by a new deformation wave train excited by a series of large earthquakes that occurred in 1960 in the Chilean subduction zone [19,20].
It should be noted that the present-day process of the intensive collapse of Antarctic glaciers is usually explained by the influence of warm air currents and sea currents carrying warm air and water from the South Pacific, e.g., [21]. In this regard, the questions arise: why did these processes begin precisely at the end of the last century and why do they continue to gain momentum in the current century? The explanation for this phenomenon, as usual, comes down to the thesis of the anthropogenic impact of industrial carbon dioxide emissions that create the greenhouse effect and global warming. When raising doubts about the validity of the widespread anthropogenic theory of modern climate warming and related processes, it is necessary to propose an alternative physically based hypothesis for the discussion of this problem to explain the observed natural phenomena.
This article discusses an alternative geodynamic approach based on the seismogenic trigger hypothesis of the activation of methane emission on the Arctic shelf and land in the late 1970s, which caused the onset of a sharp climate warming in the Arctic, as well as an intense ice shelf collapse in West Antarctica in the late 20th and early 21st centuries. The seismogenic trigger hypothesis is based on a time-lagged spatio-temporal correlation between the period of the maximum release of the Earth’s seismic energy, associated with the large earthquakes in subduction zones, and the onset of a sharp climate warming.
Developing this approach, we proceed from the general concept of deformation waves coming to the Arctic shelf and land from the Aleutian and Kuril–Kamchatka subduction zones closest to it in the North Pacific Ocean, and to Antarctica from the subduction zones of the South Pacific Ocean closest to it: Chile, Sandwich and Kermadec–Macquarie. It is assumed that the deformation waves excited by the large earthquakes occurring in these subduction zones, due to trigger mechanisms, lead to increased methane emission in the Arctic, which creates a greenhouse effect of environmental warming, as well as to intensive destruction of the glaciers of West Antarctica.
It should be noted that the lithospheric deformation waves, providing the seismogenic trigger mechanism for the increased methane emission, have been studied by many researchers in recent decades on the basis of various mathematical models in order to explain the observed migration of the Earth’s seismic activity with characteristic velocities ranging from several tens to a few hundred km/year, e.g., [22,23,24,25,26,27]. The earlier purely mechanical models yielded nearly complete attenuation of stress and strain perturbations at distances of the order of a few hundreds of kilometers, e.g., [28,29,30]. In later thermomechanical models, which take into account the phase transition at the lithosphere–asthenosphere boundary, it was shown that deformation waves can propagate without significant attenuation over the distances of thousands of kilometers [31,32].
In this study, from the standpoint of the seismogenic trigger geodynamic concept, we describe the correlations between series of large earthquakes that occurred in the 20–21st centuries in the subduction zones surrounding the polar regions of the Earth, and the most dangerous processes developing in these regions; namely, climate warming in the Arctic, as well as intensive collapse and accelerated sliding of glaciers in Antarctica.

2. Time-Lagged Spatio-Temporal Correlation between the Phase of Maximum Earth Seismic Energy Release and the Beginning of Present-Day Global Warming

Figure 1 shows the Earth’s earthquakes that occurred over the period 1976–2020, starting from magnitude 5 and above [33,34]. It is clearly seen that all the large earthquakes with a magnitude greater than 8 are confined to subduction zones and collisions of lithospheric plates. The lithospheric spreading zones are marked by earthquakes with much smaller magnitudes in the range 5 < M < 7.
To confirm the proposed seismogenic trigger hypothesis, it is necessary to ensure that there is a spatio-temporal correlation between the large earthquakes and observed climate changes. Figure 2 shows a graph of changes in the average temperature of the Earth’s atmosphere during the 20th and early 21st centuries [35] and the variations in the release of the Earth’s seismic energy, which is determined mainly by the large earthquakes with a magnitude greater than 8 [36].
This comparison clearly shows that the largest portion of the Earth’s seismic energy was released in the time interval 1952–1965. In particular, the most powerful series of large earthquakes in the Aleutian Arc (closest to the Arctic shelf) is confined to this interval: this comprises the large earthquake of 1957, which occurred in the central part of the arc, with a magnitude of M = 8.6; then, the large earthquake of 1964, which occurred at the eastern end arcs, with a magnitude of M = 9.2 (Alaska earthquake); and finally, the large earthquake of 1965 in the western part of the arc, with a magnitude of M = 8.7 (Figure 3). Added to these seismic events is the source of the large North Kuril earthquake, with a magnitude of 9.0, located close to the Aleutian Arc, which occurred in 1952 in the northern part of the Kuril Island arc. Note that the most powerful earthquake in the entire history of observations, with a magnitude of 9.5, which occurred in 1960 in the central part of the Chilean subduction zone, was regionally located in relative proximity to Antarctica. Thus, a surge of unprecedented seismic activity in the Aleutian arc and in the northern part of the Kuril–Kamchatka arc occurred approximately 15–25 years before the onset of a sharp climate warming phase in the Arctic region (1979–1980).
The question arises whether the observed spatiotemporal correlation between the phase of the maximum release of the Earth’s seismic energy in the subduction zones and the onset of a sharp warming in the Polar Regions means the presence of a causal relationship between these various natural phenomena? A positive answer to this question was given in [1,15,19,20], where it is assumed that the indicated causal relationship lies in the triggering effect of deformation waves that arise during large earthquakes and travel at a speed of about 100 km/year from the sources of these earthquakes towards Polar Regions. At such a speed, deformation waves travel a distance of about 2000 km from the Aleutian and North Kuril earthquakes sources to the Arctic shelf and land in about 20 years, where, due to additional stresses, they cause the microstructure fracturing in the onshore low-permeability rocks, which have micropores with trapped free gas, as well as metastable gas hydrate dissociation in the shelf subsea formations. These processes result in the emission of released methane, which causes warming of the environment due to the greenhouse effect. Such a seismogenic trigger mechanism explains the observed correlation time lag of 15–25 years between the series of large earthquakes in the Aleutian Arc and in the north of the Kuril Arc, which occurred in the interval 1952–1965, and the onset of a sharp warming in 1979–1980 (Figure 2 and Figure 3).
When substantiating the seismogenic trigger hypothesis of climate warming, measurements of the methane concentration in the atmosphere, carried out by NOAA Global Monitoring Laboratory [37], are of great importance. Figure 4a,b show the annual average methane concentration in the atmosphere, starting from 1984 to the present, indicating the global CH4 trend [37,38]. The graph shown in Figure 4a provides the globally averaged, monthly mean atmospheric methane abundance determined from marine surface sites since 1983, whereas Figure 4b shows CH4 annual increase (ppb) (values for the last year are preliminary).
A characteristic feature of the methane concentration change over time is the different growth rate during four time intervals: (1) the first interval, 1984–1992, is characterized by a relatively rapid increase in methane concentration; (2) the second interval, 1992–1999, shows a slowdown in the growth of concentration; (3) the third interval, 1999–2007, demonstrates an almost complete cessation of concentration growth; (4) the fourth interval, 2007–2022, indicates a rapid increase in methane concentration again. This causes the question about the reasons behind the change in methane growth rates over the past forty-some years. Based on the seismogenic trigger hypothesis, one would expect that methane concentration growth rate changes should correlate with the variations in Earth’s seismic energy release, implying a time shift of about 20 years associated with the deformation waves’ travel time, which is required for them to reach the areas of methane accumulation in sedimentary rocks, primarily in the Arctic zone. Figure 5 illustrates such a correlation, showing two envelope curves reflecting the change in the average annual atmospheric methane concentration increments during 1984–2022 and variations in the Earth’s seismic activity level, determined by large earthquakes with magnitudes greater than 8, for the period 1964–2002. This similarity is evident, assuming the 20-year time shift associated with the deformation wave travel time. In general, there is a good similarity between the two curves, which, in our opinion, is a weighty argument in favor of the proposed seismogenic trigger hypothesis of climate warming. At the same time, some lack of the correlation is noted between the seismic activity in 1982–1983 and methane concentration around 2003, which are out of phase (taking into account the time shift of 20 years). This discrepancy may be associated with an increase in methane emissions due to other factors, for example, due to anthropogenic impact or increased emissions in wetlands, etc. Such phenomena remain outside the scope of the seismogenic trigger mechanism. Moreover, one cannot expect an exact correlation of the processes under consideration in the context of the seismogenic trigger mechanism, given the complex multifactorial nature of the phenomena under consideration.

3. Deformation Waves and Related Trigger Effects of the Destruction of Metastable Gas Hydrates

Let us consider a schematic diagram of the seismogenic trigger mechanism for the destruction of metastable gas hydrates located in the frozen rocks of a sedimentary basins located at a considerable distance of the order of a few thousand kilometers from the subduction zone. This mechanism was first proposed for the Arctic shelf and the Aleutian Island arc in [1]. Figure 6 shows three stages of this process. The first stage is associated with the occurrence of a strong earthquake in the subduction zone with a magnitude greater than 8 or a series of strong earthquakes close in time (within a few years) with the same magnitude. The second stage is characterized by the appearance of a deformation wave caused by a strong earthquake in the subduction zone and propagating horizontally towards the sedimentary basin in the “elastic lithosphere-viscous asthenosphere” system. Finally, the third stage corresponds to the process of destruction of metastable gas hydrates in frozen sedimentary rocks by external additional stresses brought by a deformation wave into the sedimentary basin. The destruction of gas hydrates leads to the release of methane trapped in them, its filtration through the fractured porous medium of frozen rocks and emission into the atmosphere, creating a greenhouse effect that increases the ambient temperature. Thus, the scheme considered here includes two different geomechanical processes: (1) deformation waves acting as an external trigger load on gas hydrates; (2) the actual process of the destruction of gas hydrates and filtration of the released gas through a fractured porous medium.
In theoretical terms, the problem of stress propagation in a layer of elastic lithosphere, linked at the base with the underlying layer of viscous asthenosphere, was first analyzed by W. Elsasser [28] (Figure 7). The rates of “diffusion” of elastic displacements or stresses in this model turned out to be very slow compared to the velocities of seismic waves, ranging between several tens and 100–200 km/year. However, such velocities are typical for the migration of seismic activity observed in different regions of the Earth and under different geodynamic conditions [39,40]. This circumstance is associated with the increased interest of geophysicists in this problem, which manifested itself in a large number of publications on this subject [40,41,42,43,44,45,46,47]. Today, there are various models of stress and strain propagation in the lithosphere and its individual tectonically active zones (subduction zones, collision zones, transform faults, fault-block intraplate areas) [22,24,30,48,49,50,51,52]. The processes of stress and strain propagation in the two-layer lithosphere-asthenosphere system are often referred to as deformation or tectonic waves.
The most important aspect of our model is a new application of the theory of deformation waves in terms of their triggering effect on metastable gas hydrates, leading to the emission of methane. An essential feature of the model under consideration is that the deformation waves caused by the largest earthquakes in the subduction zone must travel long distances of the order of a few thousand kilometers without significant attenuation in order to be able to activate the trigger mechanism for the destruction of gas hydrates. In “diffusion” models of the Elsasser type, the attenuation of stress and strain perturbations takes place at distances of the order of a few hundreds of kilometers [28,29,30]. Therefore, these models are not suitable for substantiating the trigger mechanism of methane emission. However, there are models of weakly attenuating deformation tectonic waves that take into account not only mechanical perturbations of the lithosphere, but also thermal effects associated with a phase transition at the boundary, lithosphere-asthenosphere, where partial melting of the lithosphere substance and crystallization of the partially molten substance of the asthenosphere take place [31,32].
It was shown that thermomechanical deformation waves can have weak attenuation (Figure 8), which provide the occurrence of significant additional stresses of the order of 0.1 MPa in the lithosphere at distances of the order of a few thousand kilometers from the place of wave generation at an average wave propagation velocity of the order of 100 km/year [32]. Such waves allow the possibility of trigger action on remote areas of gas hydrates.
Below, we analyze some implications of the process of destruction and dissociation of metastable gas hydrates in the frozen rocks of sedimentary basins. As is known, gas hydrates, which are crystalline compounds of gas and water, are widely distributed in the sedimentary strata in permafrost areas on land and in shallow seas, where relatively high pressures and low temperatures occur, which are necessary for the formation and stable existence of hydrates [53] (Figure 9).
According to existing estimates, the global reserves of gas hydrates are about 1000 billion metric tons of carbon [54], the decomposition of which can affect the carbon cycle and climate on a global scale [55,56,57]. The idea of the possible dissociation of gas hydrates and the emission of methane, which has a strong greenhouse effect, has been used to explain a number of well-known phenomena, such as the Paleocene thermal maximum [55] or a rapid post-glacial increase in atmospheric methane [58]. A general hypothesis is also discussed regarding the possible impact of methane emission on global warming with an increase in the processes of permafrost degradation and dissociation of gas hydrates [7,59,60,61,62]. Long-term marine studies of the Arctic shelf have shown that a significant release of methane occurs from the bottom of shallow water areas in the seas of the Eastern Arctic [61,62,63]. Figure 10 shows methane emission from the shelf zone of Eastern Siberia.
Among the numerous natural onshore gas manifestations in the Arctic zone, a special place is occupied by large craters that arose as a result of powerful gas emissions [4,5,12]. Figure 11 shows a crater from a methane eruption in the area of the Bovanenkovskoye field on the Yamal Peninsula.
The dissociation of gas hydrates is usually associated with an increase in temperature to a critical level, upon reaching which the stability of the existence of gas hydrates is lost at a given ambient pressure corresponding to a certain depth of the hydrate layer [7] (Figure 9). Such an increase in the temperature of the hydration layer can be associated either with endogenous processes, for example, with heated fluids migrating along crustal faults from deeper horizons of the lithosphere [8], or with exogenous factors, for example, with warm near-bottom currents on the shelf or transgressions of water masses on the cold land surface in the Arctic [61]. However, the loss of stability of gas hydrates can also be associated with a decrease in external pressure caused by geodynamic factors. Such factors include, for example, a decrease in the hydrostatic water pressure on the shelf as a result of its shallowing caused by the isostatic rise of the crustal surface due to the melting of glaciers, as was established for the Svalbard archipelago [9]. The noted thermal and geodynamic factors act, as a rule, on small geological time scales within the Holocene.
However, there are also fast-acting geodynamic factors that, under certain conditions, lead to almost instantaneous dissociation of gas hydrates. These include, in particular, deformation waves in the lithosphere. The latter can play an important triggering role in the process of disruption of the metastable equilibrium of relict gas hydrates that have experienced partial dissociation, which, as experiments show [10,11], can stop as soon as they start, as a result of the formation of ice films that seal the formed free gas inside gas hydrate microparticles, resulting in the phenomenon of self-preservation of gas hydrates [11,12] (Figure 12).
In the future, metastable relic gas hydrates that are in self-preservation for a long time can collapse when additional stresses occur that destroy thin ice films, thus releasing free gas and leading to their filtration in the fractured porous medium of frozen rocks and, ultimately, to the emission of methane into the atmosphere. The mechanics of this process were analyzed in a number of studies, e.g., [13,14,64].

4. Seismogenic Trigger Mechanism of the Glacier Movement and Collapse in West Antarctica

Recently, Antarctica has experienced an unprecedented rate of ice loss, in terms of both area and volume. The flow of ice into the oceans goes through ice shelves. Moreover, some of the ice shelves are accelerating, and some are simply collapsing. Most of the events take place in West Antarctica, especially the Antarctic Peninsula. Thus, over the last decades, the total area of ice shelves in the Antarctic Peninsula has decreased from 150 to 100 thousand km2 [65]. In the 1970s, a monotonous decrease in the total area of ice shelves in the Antarctic Peninsula began sharply (Figure 13).
According to the seismogenic trigger hypothesis, this process could begin due to the arrival of tectonic waves originating from large earthquakes in the Chilean subduction zone that occurred in the early 1940s: in 1940 (M = 8.2), 1942 (M = 8.2) and 1943 (M = 8.2) (Figure 14). At a speed of 100 km/year, deformation waves, having traveled a distance of about 3500 km from the generation sources located in the Chilean subduction zone to the Antarctic Peninsula, could lead, after 35 years, to the onset of the ice shelves degradation in the 1970s.
The next deformation wave train in the Chilean subduction zone was associated with three large earthquakes that occurred in 1960, one of which, with a magnitude of 9.5 (Valdivia), turned out to be the most powerful earthquake in the entire history of observations. After 35 years, these waves reached the Antarctic Peninsula, destroying the Larsen A ice shelf in 1995 (Figure 15).
Later on, more recent large earthquakes occurring in Chilean subduction zone and the Macquarie island arc (Figure 16a,b), had triggered deformation waves, which, after reaching the glaciers in West Antarctica, have led to a series of ice shelf destruction events, including partial collapses of the Larsen B, Larsen C, Wilkins and George VI glaciers [66,67].
In recent decades, many large earthquakes have occurred in the southern part of the Chilean subduction zone in 1995, 2001, 2007, 2010, 2014 and 2015 (Figure 16a,b), and in 2021, there was a large earthquake in the Sandwich Trench (Figure 16b). The arrival of tectonic waves from these sources, according to the stated concept, will lead to further destruction of the Larsen, Wilkins, George VI and other ice shelves of the Antarctic Peninsula in the near future.
It is important to note that the collapsed glaciers were in a stable state for a long time (hundreds and thousands of years), and some glaciers were stable throughout the Holocene, such as the Larsen B glacier [68,69]. This behavior emphasizes the uniqueness of the present-day period and requires an explanation for the glacier stability loss phenomenon in our time. The usual explanation for these events is reduced to a statement about the impact of global warming on the state of the glaciers. This explanation, however, is questionable, since according to paleoclimatic data, some temperature maxima in the Holocene were higher than in the modern epoch, e.g., [70]. Therefore, it is difficult to explain the sudden transition of glaciers from a long-term stability to intense collapse process only by the increase in the temperature of the environment. An alternative explanation is offered by the seismogenic trigger hypothesis, according to which, the rapid destruction of glaciers is associated with additional stresses brought to Antarctica by deformation waves caused by large earthquakes that occurred in the surrounding subduction zones: Chile, Sandwich and Kermadec–Macquarie.
The frequency of occurrence of a series of large earthquakes having magnitudes greater than 8 in different subduction zones is controlled by the asperity structure in the contact zone of the lithospheric plates’ interaction, which causes a rupture in a large area of the contact zone during an earthquake. Another important factor is the occurrence of conditions for the simultaneous accumulation of critical energy in several large seismogenic blocks at the same time. Such a seismotectonic setting occurs quite rarely, with a recurrence period (for a given subduction zone) of the order of a thousand years. Apparently, in the Chilean and Aleutian subduction zones, such a superactive seismotectonic phase began in the second half of the 20th century. This, according to the seismogenic trigger hypothesis, explains the abrupt onset of the present-day era of climate warming and the phase of intense glacier collapse in Antarctica.
Let us now consider more specifically the glaciological and geological-geophysical setting typical for West Antarctica. As already noted, the main problem with glacier evolution is the rapid transition from stability, i.e., slow flow of sheet glaciers from the interior of Antarctica towards the surrounding shelf at a speed of several meters per year, to the rapid movement of sheet and shelf glaciers towards the ocean at a speed of several km/year, accompanied by intensive destruction. In terms of geomechanics, such a transition can be associated with a change in the friction mode at the base of the ice sheet sliding along the bedrock substrate or its lateral extension, depending on the slope of the bedrock. Under “cold” conditions, the ice at the base of the glacier is firmly attached to the stable bedrock, i.e., no-slip (adhesion) conditions are satisfied, and the movement of the glacier is similar to a slow flow of a highly viscous liquid. In cases where ice-melting zones emerge at the base of a glacier, the glacier begins to slide with low friction, which significantly increases the overall speed of its movement towards the ocean. The melting of ice at the base of the glacier may occur due to a rise in temperature, which depends on the heat coming from the subglacial regions of the Earth’s crust. Figure 17 shows a map of the heat flux distribution in Antarctica, from which it can be seen that the increased values of the heat flux are confined to West Antarctica, in particular, to the Antarctic Peninsula, as well as to the subglacial basins of the Byrd and Bentley and the shelf margin of the Ross Sea [71]. This distribution of heat flux correlates with the intensive movement and destruction of glaciers in West Antarctica, in contrast to East Antarctica, where the heat flux is noticeably lower and the glaciers remain in relative stability. The observed correlation between areas of increased heat flux and a high degree of glacier mobility and destruction in West Antarctica supports the concept of sheet glaciers sliding on a melted base, which increases their speed abruptly.
The nature of the increased heat flux is associated with the features of the structure and evolution of the lithosphere of West Antarctica [72,73,74,75,76,77,78], which are characterized primarily by the presence of the West Antarctic Rift System (WARS), comparable in scale to the East African Rift Zone. The WARS extends over a large distance and includes more than a hundred known subglacial volcanoes [79], with their highest concentration in the area of Mary Byrd Land, as well as the Bentley and Byrd basins (Figure 17). In general, the spatial distribution of volcanoes correlates with areas of increased heat flux, which is logically explained by the recent activity of these volcanoes.
When analyzing the connection between subglacial volcanoes and high heat flux zones with the modern process of accelerated movement and collapse of glaciers, the main question requiring explanation is the moment in time when the stability of glaciers turned to the destructive phase in the 1970s, since the geological evolution of the crust, accompanied by rifting and volcanism, develops on a much larger time scale of the order of tens of millions of years. Therefore, there must have been some kind of trigger mechanism that nearly instantly (in comparison with the geological evolution time scale) forced the glaciers from their stable state into a destructive phase. This mechanism is deformation waves coming to Antarctica from the sources of large earthquakes in the nearest subduction zones, which activate “dormant” volcanoes, causing a sharp heat flux increase beneath the glaciers, which leads to the melting of ice at the glacier base and the development of its rapid sliding along the bedrock towards the ocean. The same waves, due to additional stresses, can destruct regions of mechanical adhesion of ice to bedrock, where ice melting has not yet occurred, leading to weak earthquakes, recorded in large numbers by seismic stations on the surface of glaciers (Figure 18).
Figure 18 shows a simplified diagram of the various modes of the ice sheet and ice shelf movement, reflecting the different stages of its thermomechanical evolution. The first initial stage of evolution corresponds to the slow stage of the viscous flow of a glacier with adhesion to the bedrocks (Figure 18). The second “warm” stage of glacier movement (Figure 18) is a stage of a glacier sliding along the bed due to the melting of its base with the presence of adhesion zones. Melting is associated with the activity of subglacial volcanoes, triggered by the deformation waves that have arrived in Antarctica from the distant sources of the strongest earthquakes surrounding Antarctica. The third stage of glacier rapid movement and disruption occurs as a result of the arrival of tectonic deformation waves in Antarctica from the surrounding sources of the large subduction earthquakes and the destruction of the remaining adhesion zones (roughness) on the contact surface due to additional stresses brought by the tectonic deformation waves.
It is rather difficult to confirm the mechanism of the awakening of dormant subglacial volcanoes by the action of deformation waves by direct observations. However, this factor can be supported by spatiotemporal correlation between large earthquakes in the vicinity of Antarctica and active onshore volcanoes: Deception Volcano, located near the edge of the Antarctic Peninsula, and Erebus Volcano, located near the Ross Sea (Figure 17 and Figure 18). Deception Volcano was active during 1967–1970. This activity could be caused by a series of large earthquakes that occurred in the Chilean subduction zone in the early 1940s: the 1940 earthquakes with M = 8.2 and M = 8.2, as well as the 1943 M = 8.2 earthquake (Figure 14). It is assumed that deformation waves from the sources of these earthquakes reached the Deception Volcano for 25–30 years and initiated volcanic activity due to additional stresses. Mount Erebus has repeatedly shown effusive activity throughout the 20th and 21st centuries. Especially strong eruptions took place during 1972–1974. An unusually high frequency of Erebus eruptions was observed at the beginning of the 21st century, when eruptions occurred in the following years: 2005, 2006, 2008, 2011, 2015 and 2018. From the analysis of the large earthquakes that occurred around Antarctica in the 20th and 21st centuries, a series of four large earthquakes can be identified in the Kermadec subduction zone: 1917, M = 8.2 and M = 8.5; 1919, M = 8.1; 1920, M = 8.1. The distance from the sources of these earthquakes to the Erebus Volcano is about 5500–6000 km, so that in about 55 years, deformation waves can reach it, causing eruptions in 1972–1974 (Figure 19). The abovementioned series of frequent Erebus eruptions at the beginning of the 21st century is well explained by two large earthquakes that occurred in the Macquarie zone in 1989 and in the South Pacific Rise in 1998 (Figure 16a). A relatively short time shift of about 15–20 years between the geodynamic events under consideration is explained by the significantly smaller distance between the sources of these earthquakes and the Erebus Volcano, about 1700–2900 km, compared to the distances from Erebus to the sources in the Kermadec subduction zone, ~6000 km.
Thus, we come to a certain seismogenic trigger model of the evolution of the West Antarctic ice sheets, with a sharp transition from the stable regime, characterized by a slow viscous flow of glaciers for several thousand years, to their rapid sliding towards the ocean and the destruction of their forward parts and adjacent ice shelves. Such a transition is associated with the action of deformation waves caused by large earthquakes occurring around Antarctica, which activate subglacial volcanoes, leading to an increase in heat flux and glacier base melting, which triggers their rapid movement and collapse (Figure 18).
Let us consider the glaciological features of the glacier movement in West Antarctica. The ice sheets’ movement significantly depends on the relief and properties of the underlying bedrock, as well as the non-uniform ice thickness. For example, in the Antarctic Peninsula, sheet glaciers flow down from a high and narrow Antarctic ridge along a sloping bedrock into the sea, transforming into ice shelves floating in the water in the form of thinner ice several hundred meters thick (Figure 20). After the destruction of the ice shelves, the flow rate of the ice sheets behind them becomes several times greater, and their height decreases, since the blocking effect of the ice shelves decreases.
At the same time, it should be noted that the massive destruction of the ice shelves of the Antarctic Peninsula does not lead to a significant increase in sea level, as they float in water and are in a state of isostatic equilibrium. The sea level is increased only by the accelerated retreat of the Antarctic Peninsula sheet glaciers, but these are small. According to various estimates, the rise in sea level due to the complete sliding of the Antarctic Peninsula glaciers into the sea will be tens of centimeters. The main mechanism for the destruction of ice shelves is disintegration and collapse, in other words, the transformation of a monolithic ice shelf into mélange—an ice mixture consisting of individual small ice fragments.
A different setting is typical for most of the area of the more southern part of West Antarctica. It features an increased heat flux in the WARS region, the presence of subglacial volcanoes, and, unlike the Antarctic Peninsula, the bedrock topography here is mainly below sea level. The main flow of ice in the central and most elevated part of West Antarctica occurs in four directions: Filchner–Ronne Ice Shelf, Ross Glacier, Pine Glacier, Thwaites Glacier (Doomsday Glacier) (Figure 21). The last three are characterized by a high heat flux, but the rates of ice retreat into the ocean for the Filchner–Ronne and Ross glaciers are lower than for the Pine and Thwaites glaciers [80,81]. In addition, for the latter two, the shelf part is relatively small and is immediately followed by ice sheets that do not float on the water, while for Filchner–Ronne and Ross, the shelf part extends for hundreds of km, so that ice sheets that can cause a significant rise in sea level are far away (Figure 21).
The main concerns are due to the Pine Island Glacier and Thwaites Glacier—the speeds of their outlet areas have recently increased many times and reach a few kilometers per year relative to their grounding boundaries. The two red-colored regions in Figure 21 are Pine (number 3) and Thwaites (number 4), with speeds of 3 km/year and more. The black line marks the areas of ice feeding the outlets [80,81]. Pine Island Glacier is comparable in size to the neighboring Thwaites Glacier and the direct contributions of each of them to the SLR (sea-level rise) are 51 and 65 cm, respectively [82]. The Pine Island Glacier began to retreat in the 1940s, which may be associated, according to our seismogenic trigger hypothesis, with a large earthquake of magnitude greater than 8 that occurred in 1906 in the southern part of the Chilean subduction zone.
The main ice loss in Antarctica in recent decades has also been observed for the Pine Island Glacier and the Thwaites Glacier [82]. Both areas have active volcanoes (Figure 17 and Figure 18) [79]. In 2018 it was found that there is a substantial volcanic heat source beneath the Pine Island Glacier approximately half (~2500 MW) as large as the active Grimsvötn volcano on Iceland [83]. In recent years, both of these glaciers have accelerated, their surfaces have lowered, and their grounding lines have receded. In the study [84], the “rapid retreat” of the Thwaites Glacier was described, and it conclusions about its past movement in the pre-satellite epoch were reached by analyzing the sedimentary ridges formed on the ocean floor by tides and ice. The study found that sustained impulses of rapid retreat have occurred in the Thwaites Glacier over the past two centuries. Similar rapid retreat impulses are likely to occur in the near future as the grounding zone recedes from stabilizing high points on the seafloor. According to existing estimates, in the event of a rapid retreat, the Thwaites Glacier will pull the ice caps that support it and the neighboring Pine Island Glacier with the ice caps behind it. In this case, the global rise in sea level can reach 2–3 m due to the displacement of ocean water by huge masses of ice previously located on land. In contrast to the slow melting, a catastrophic sliding process can occur in a relatively short time.

5. Discussion

Let us derive theoretical estimates of the glacial body spreading velocities in the central part of Western Antarctica towards the outlet of the Thwaites and Pine glaciers, considering adhesion and slip conditions at the glacier bed. The internal structure of the Thwaites and Pine Island glaciers is fundamentally different from the Larsen glaciers. The bed of these glaciers lies below sea level and descends in the direction inland from the grounding line [85]. This suggests that there is no geological barrier that could stop the ice retreat once it has begun. Here, the shelf part is relatively small, but the sheets behind it are large and thick. The bed of the Thwaites and Pine Island glaciers lies below sea level (Figure 22 and Figure 23), and further inland, the bedrock topography lowers to 2000 m below sea level. At the same time, the topography of the glacier surface gradually elevates up to 2000 m above sea level, forming a huge ice dome in the center of West Antarctica (Figure 24). The movement of the outlet glaciers of Thwaites and Pine Island is driven by the gravitational spreading of this giant ice mass, up to 4000 m thick (Figure 22 and Figure 24) [86]. The increased heat flux beneath it creates the setting for ice melting at the boundary of the glacier and bedrock and the occurrence of slip conditions.
In the next subsection, we derive theoretical estimates of the glacial body spreading velocities in the central part of Western Antarctica towards the outlet Thwaites and Pine glaciers, considering adhesion and slip conditions at the glacier bed.

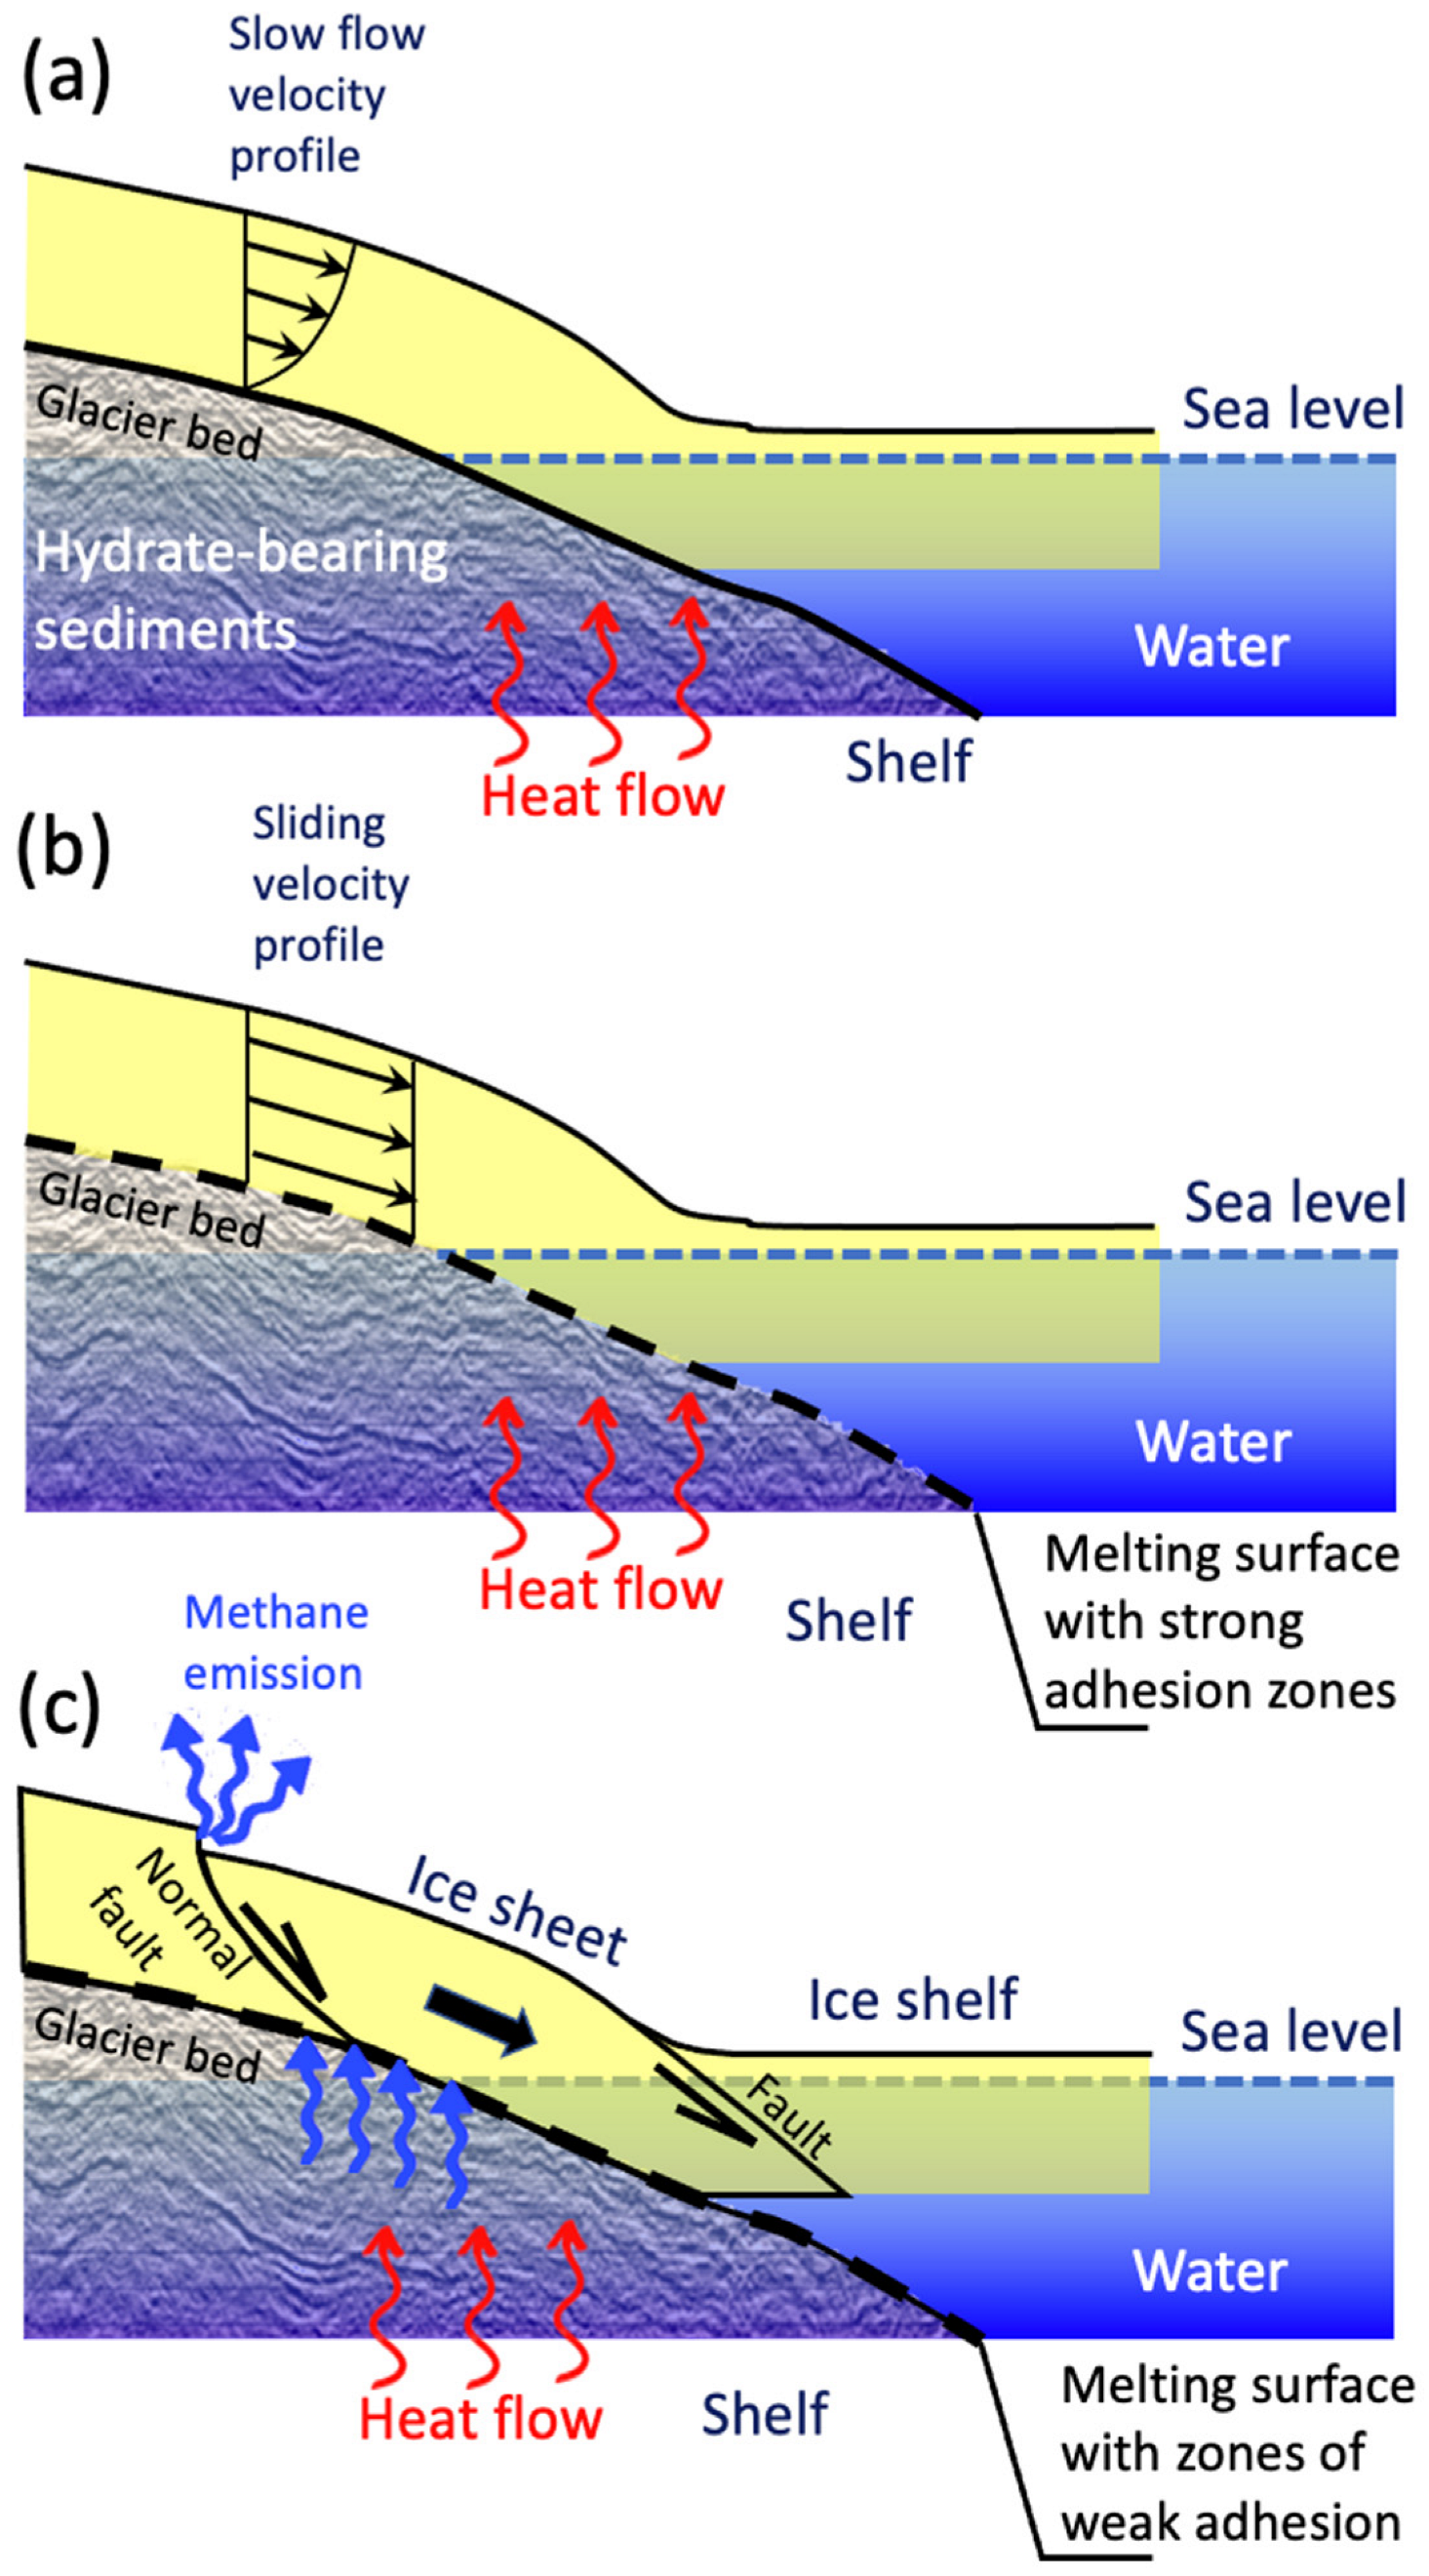
5.1. Flow Velocity Estimates for the Ice Sheet

The equations of glacier motion can be found in many studies; they correspond to the Stokes equations with appropriate rheology (for example, Glen’s law) and effective viscosity [87,88]. Usually, if the friction is high, the lubricating layer equations with adhesion conditions and Glen’s rheology are used; the corresponding model is referred to as SIA. In case of significant slip, the shallow ice approximation is used, and the corresponding model is obtained by averaging the equations over the thickness of the glacier and is known as SSA. A hybrid model can also be applied, which is obtained by combining these models or simply by summation of the velocity fields of both models [87,88].
Based on these models, assuming Glen’s rheology with the index n = 3, one can derive the estimates for the glacier flow (movement) velocities, as follows.
2 x η u x + y η u y + v x p x = 0 , 2 y η v y + x η u y + v x p y = 0 , η = A 1 / 3 2 u x 2 + v y 2 + 1 4 u y + v x 2 1 / 3 .
Here, u and v are the horizontal ice velocities in x and y directions, respectively, η is effective viscosity, and p is pressure.
  • In case of adhesion at the glacier bed.
From the second Equation in (1), we have an estimate for p as
p ~ ρ i g z s ,
where, z s is the glacier’s surface vertical elevation.
Using (2), we can write the first Equation in (1) as
2 x η u x + y η u y + v x ρ i g z s x + z b x = 0 ,
where, z b is the bedrock elevation.
We assume that ice thickness h is much less than its lateral size L ,
h L .
Given the adhesion scenario, the ratio of the first and second terms in Equation (3) is h L 2 1 . Then, the ice flow rate estimate can be obtained through comparison of the second and third terms, which gives:
u y 1 / 3 ~ A 1 / 3 ρ i g h h s + h b x     u ~ A h ρ i g h z s + z b z min L 3 ~ A h ρ i g h h L 3 .
where, h s = z s , h b is ice bottom elevation.
Thus,
u ~ A h ρ i g h h L 3
For A , we use an expression from [88]:
A = E f · 5.47 · 10 10 · exp 13.9   ·   10 4 R T , T 263.15   K E f · 1.14 · 10 5 · exp 6.0   ·   10 4 R T , T < 263.15   K
Here, E f is the adjustment factor in Arrhenius equation.
2.
In case of slip, assuming Coulomb’s law of friction [88],
u ~ 3 + h γ h γ   A h ρ g h z s + z b z min L 3
Here, γ characterizes the friction and is determined from the base slip boundary condition.
z = 0 :     u z = γ u .
If γ , we arrive at the adhesion condition. From (7), it follows that with a decrease in γ , the velocity increases monotonically.
Assuming Coulomb’s friction, we have
η u h ~ F t r ~ μ ρ i g h p w ,
where, μ is the friction coefficient and p w is the pressure in a partially melted layer at the glacier bed.
Following [88], we assume
p w = 0.96 ρ i g h .  
By making use of (7), (9) and expression for viscosity from (1), for γ , we have
γ ~ 5 10 4 h μ 3 A h h L 3 ,
And the velocity estimate is
u ~ 3 + h γ h γ A h ρ i g h h L 3 ,
where, A is given by (6).
Taking the following parameter values, L ~ 8 · 10 5 ;   ρ i 900 ;   T = 263 ; E f = 1 ;   μ = 0.5 (where μ = 0.5 is taken from [89]), we arrive at the following estimates of characteristic glacier velocities for two different thickness values (Table 1):
The above estimates show that during the spreading of a huge ice mass of more than 3 km thick in the central part of West Antarctica, the flow rates equal tens of meters per year in case of adhesion at the glacier bed, but reach kilometers per year under the slip condition. At present, the Thwaites and Pine Glaciers are characterized mainly by slip conditions at the lower boundary, with ice flow rates of kilometers per year. Other researchers’ models give similar velocities for the Thwaites and Pine glaciers, e.g., assuming the slip condition at the glacier bed [90,91]. Such high speeds of ice movement in Antarctica are not observed anywhere else.
As noted above, the main factor contributing to ice sheet sliding is the increased heat flux in West Antarctica, which creates the potential for ice melting at the glacier base. However, the melting process occurs unevenly in time and space. According to the seismogenic trigger concept, melting begins in particular regions at the glacier base, where subglacial volcanoes are activated due to the arrival of deformation waves from the sources of large earthquakes surrounding Antarctica. This is the reason for the sharp transition of the Thwaites and Pine glaciers from a stable state, lasting thousands of years, to an accelerated movement that has been observed only in recent decades/years. Earlier in recent centuries, such accelerations also took place [92]. It should be noted that the largest ice loss occurs in the Thwaites and Pine glaciers, as well as for the subglacial volcanic massif Mary Byrd Land [79], which has the greatest concentration of subglacial volcanoes. The slip at the glacier’s lower boundary can lead to a rapid sliding of the shelf parts of the Thwaites and Pine glaciers into the sea, which will open the way to a more rapid gravitational spreading of the ice mass of the central part of West Antarctica precisely towards the Thwaites and Pine glaciers and, consequently, to a rapid rise in sea level in a short period time. Thus, the seismogenic trigger mechanism proposed by us to explain the transition from adhesion to sliding at the glacier base, can also explain the phenomenal acceleration of the movement of the Thwaites and Pine glaciers in recent years and the abrupt acceleration of their movement in the past.
The transition from the stable regime of sheet glaciers, lasting thousands of years, to their rapid sliding along the bedrock towards the sea due to ice melting at the glacier base is accompanied by the destruction of ice shelves floating in the water and adjoining the frontal part of the sheet glaciers at their grounding zone. For example, along with the modern rapid sliding of the Thwaites and Pine Island glaciers, the collapse of adjacent ice shelves occurs, resulting in large icebergs separation. These events could be triggered by the above-mentioned large earthquakes of 1989 and 1998, with sources located quite close to the Thwaites and Pine Island Glaciers (Figure 16a). Deformation waves from these foci may have stimulated the breakaway of large iceberg B-22 from Thwaites Glacier Tongue in 2002, as well as the breakaway of large icebergs from the neighboring Pine Island Glacier in 2013 (B-31) and 2020.

5.2. Mechanics of the Ice Shelves Collapse

Let us consider mechanical models of the destruction of ice shelves.
Figure 25 shows a cross-section of an ice shelf, which is an ice mass floating in the ocean, attached to the frontal part of a sheet glacier sliding along the bedrock towards the ocean.
The cross-section is based on high-precision mapping using satellite data [93]. From the side of the sea, tidal oscillations [94] and vibrational waves [95] affect the glacier. In addition, lateral forces act in the horizontal plane of the glacier [87]. We will consider the ice shelf as an elastic plate floating on the water and attached to the frontal part of the ice sheet at the grounding point [96].
The equation for cylindrical bending of the ice plate can be written as
4 w x 4 + 4 β 4 w = 0 ,
where, β = ρ w ρ i g 4 D 4 and D = E h 3 12 1 ν 2 is bending stiffness, E is Young’s modulus, ν is Poisson’s ratio, ρ w is water density, ρ i is ice density, w is vertical displacement.
The solution of Equation (13) is presented in the form [97]:
w = C 1 sin β x sh β x + C 2 sin β x ch β x + C 3 cos β x sh β x + C 4 cos β x ch β x ,
while, C 1 , C 2 , C 3   and C 4   are the integration constants.
We find the integration constants from the condition that at grounding point x = 0 , the edge of the floating ice field is elevated by a value δ = ρ i ρ w h (Figure 25) and satisfies the anchorage condition, while the bending moment and shearing force vanish at the opposite free edge x = l . This implies the boundary conditions as follows:
w x = 0 = δ , w x x = 0 = 0 ,
2 w x 2 x = l = 0 , 3 w x 3 x = l = 0 .
Here, δ = ρ i ρ w h is the depth of glacier subsidence (Figure 25).
We consider an ice plate of length l = 50 km, having mechanical properties as follows: E = 2 · 10 9   Pa; ν = 0.2 ;   ρ w = 1000 kg/m3; ρ i = 920 kg/m3. Let us compare the displacements and stress state for two different thickness values, h = 200 m and h = 600 m. Figure 26a shows the rise of ice above sea level w i for h = 200 m (curve 1) and h = 600 m (curve 2). Changes in the maximum horizontal stresses at the lower ice boundary,
σ x x m a x = D h 2 2 w i x 2 ,
are shown in Figure 26b for the selected thicknesses (curves 1 and 2). Note that the shape of the ice surface is consistent with satellite measurements given in [93]. At the same time, the maximum tensile stresses at the glacier’s lower surface near the point of its separation from the bedrock significantly exceed the limiting values characteristic of ice σ t e n s = 0.7 3.1 · 10 6   Pa .
Incremental displacements Δ w and stresses Δ σ x x m a x caused by daily tides are superimposed on the background stress state of the glacier. According to Figure 27a, the local maximum of displacements corresponding to the sea tide height of Δ δ = 2 m are observed in the same places as the maxima of the main ice plate curvature (Figure 27a). In this case, the increments of stresses Δ σ x x m a x (Figure 27b) reach a few percent of the main bending stresses (Figure 26b). However, the tide-associated increments occur day by day in the regions of maximum background stress, while their sign alternates depending on the sign of Δ δ . Note that long-term periodic loading should contribute to the destruction of the ice layer.
The glacier’s motion towards the sea occurs under conditions of constrained compression. As a result, horizontal compressive forces arise in it [87], which lead to ice hummocking [66], as can be seen on satellite images of the Larsen glacier (Figure 28a).
Consider the process of the ice plate destruction. A reasonably good approximation for ice flow modeling is a nonlinear creep model combined with a strength criterion dependent on internal friction [97,98]. For the further analysis we apply the model of non-associated plastic flow with the Drucker–Prager yield criterion and softening [99,100]. It is known that the softening of the medium leads to the development of flow instability and shear strain localization within narrow zones.
The modeling domain of the ice field is shown in Figure 28b. For simulation purposes, we specified the angle of internal friction ϕ = 30 ° and the maximum cohesion c max = 2 · 10 6   Pa , which gradually decreases with the accumulation of inelastic shear strain [97]. The calculations were performed using the FLAC3D simulation code [101]. Figure 29a shows that an increase in load first leads to the emergence of a dense system of inelastic deformation localization zones (ice hummocking), some of which continue to develop, as can be seen in Figure 29b,c.
In the localization zones, in addition to the shear strain accumulation, the ice surface experiences upward motion. According to Figure 30, the vertical displacements first measure a few centimeters (Figure 30a) and then reach tens of meters (Figure 30b,c) in certain bands as the compressional stresses increase.
In general, we can state that bending and horizontal stresses break the ice field into separate fragments, preparing the breakaway of icebergs. If the area of the ice shelf, which already contains the linear zones of strain localization, is subjected to additional stresses, this will lead to rupturing and fragmentation of the glacier with the appearance of individual icebergs or ice mélange areas. Such additional trigger stresses will arise in the body of the ice shelf due to the arrival of deformation waves in the area of the adjacent ice sheet, the occurrence of slip zones at the contact of the glacier base and the bedrock, accompanied by small earthquakes and seismic waves along the elastic plate of the ice shelf.

6. Conclusions

In conclusion, we emphasize that the paper discusses the implications of the seismogenic trigger hypothesis in application to climate warming and glacier collapse in the Polar regions of the Earth. The hypothesis is based on the concept of deformation waves propagating through the lithosphere at a speed of about 100 km/year, excited by large earthquakes in the subduction zones surrounding the Arctic and Antarctic. The presented results correspond to the first step in the study of trigger mechanisms leading to a sharp increase in methane emissions in the Arctic and the accelerated movement of ice sheets in the Antarctic. Further analysis will include expanding the range of parameters that determine the described processes, in particular, different deformation wave velocities, different conditions for methane emission, non-uniform thermomechanical conditions for the movement of glaciers, etc. The study of the correlation between the change in the total seismic activity of the Earth, determined by the number of large earthquakes and the increase in the atmospheric methane concentration should take into account the geographical reference associated with the spatial distribution of subduction zones, where deformation waves are generated, and sedimentary basins containing large amounts of natural gas. Another direction of research may be related to the inclusion of the World Ocean in the general analysis of possible relations between variations in seismic and hydrothermal activity of the ocean floor in spreading zones and changes in the temperature of the water column and atmosphere [102,103]. The theory of deformation waves, as well as terrestrial and space methods for their registration, should be further developed.

Author Contributions

Conceptualization, L.I.L.; methodology, L.I.L., I.S.V. and A.A.B.; validation, I.S.V., A.A.B. and L.I.L.; formal analysis, I.S.V., A.A.B., Y.V.G., L.I.L., I.A.G. and M.M.R.; investigation, L.I.L., I.S.V., Y.V.G., I.A.G., A.A.B., M.M.R., D.A.A. and I.P.S.; resources, L.I.L. and I.P.S.; data curation, Y.V.G., M.M.R., A.A.B. and D.A.A.; writing—original draft preparation, L.I.L., I.S.V. and A.A.B.; writing—review and editing, all authors; visualization, L.I.L., I.S.V., A.A.B., I.A.G. and D.A.A.; supervision, L.I.L.; project administration, L.I.L. and I.P.S.; funding acquisition, I.P.S. All authors have read and agreed to the published version of the manuscript.

Funding

This work was partly carried out within the framework of the state order of the P.P. Shirshov Institute of Oceanology RAS No. FMWE-2021-0015. Authors gratitude the Russian Ministry of Science and High Education for support in the framework of the project Priority-2030 given to Tomsk State University. We also acknowledge partial support from the state assignment of the Institute of Earthquake Prediction Theory and Mathematical Geophysics of the Russian Academy of Sciences No. AAAA-A19-119011490131-3, and the Russian Scientific Foundation (grant No. 21-77-30001). Ice motion and deformation modelling was done under Project 22-67-00025 funded by Russian Science Foundation.

Data Availability Statement

Not applicable.

Conflicts of Interest

The authors declare no conflict of interest.

References

  1. Lobkovsky, L.I. Seismogenic-triggering mechanism of gas emission activizations on the Arctic shelf and associated phases of abrupt warming. Geosciences 2020, 10, 428. [Google Scholar] [CrossRef]
  2. Yakushev, V.S.; Chuvilin, E.M. Natural gas and hydrate accumulation within permafrost in Russia. Cold Reg. Sci. Technol. 2000, 149, 46–50. [Google Scholar] [CrossRef]
  3. Takeya, S.; Ebinuma, T.; Uchida, T.; Nagao, J.; Narita, H. Self-preservation effect and dissociation rates of CH4 hydrate. J. Cryst. Growth 2002, 237–239, 379–382. [Google Scholar] [CrossRef]
  4. Leibman, M.O.; Kizyakov, A.; Plekhanov, A.V.; Streletskaya, I. New permafrost feature—Deep crater in Central Yamal (West Siberia, Russia) as a response to local cli mate fluctuations. Geogr. Environ. Sustain. 2014, 7, 68–79. [Google Scholar]
  5. Kizyakov, A.; Leibman, M.; Zimin, M.; Sonyushkin, A.; Dvornikov, Y.; Khomutov, A.; Dhont, D.; Cauquil, E.; Pushkarev, V.; Stanilovskaya, Y. Gas emission craters and mound-predecessors in the north of West Siberia, similarities and differences. Remote Sens. 2020, 12, 2182. [Google Scholar] [CrossRef]
  6. Bogoyavlensky, V.; Bogoyavlensky, I.; Nikonov, R.; Kargina, T.; Chuvilin, E.; Bukhanov, B.; Umnikov, A. New Catastrophic Gas Blowout and Giant Crater on the Yamal Peninsula in 2020: Results of the Expedition and Data Processing. Geosciences 2021, 11, 71. [Google Scholar] [CrossRef]
  7. Yakushev, V.S. Natural Gas and Gas Hydrates in Cryolithic Zone; VNIIGAZ: Moscow, Russia, 2009; p. 192. (In Russian) [Google Scholar]
  8. Baranov, B.V.; Lobkovsky, L.I.; Dozorova, K.A.; Tsukanov, N.V. The fault system controlling methane seeps on the shelf of the Laptev Sea. Dokl. Earth Sci. 2019, 486, 571–574. [Google Scholar] [CrossRef]
  9. Wallmann, K.; Riedel, M.; Hong, W.L.; Patton, H.; Hubbard, A.; Pape, T.; Hsu, C.W.; Schmidt, C.; Johnson, J.E.; Torres, M.E.; et al. Gas hydrate dissociation off Svalbard induced by isostatic rebound rather than global warming. Nat. Commun. 2018, 9, 83. [Google Scholar] [CrossRef] [Green Version]
  10. Davidson, D.W.; Garg, S.K.; Gough, S.R.; Handa, Y.P.; Ratcliffe, C.I.; Ripmeester, J.A.; Tse, J.S.; Lawson, W.F. Laboratory analysis of naturally occurring gas hydrate from sediment of the Gulf Mexico. Geochim. Cosmochim. Acta 1986, 50, 619–623. [Google Scholar] [CrossRef]
  11. Yakushev, V.S.; Istomin, V.A. Gas hydrates self-preservation effect. In Physics and Chemistry of Ice; Maeno, N., Hondoh, T., Eds.; Hokkaido University Press: Sapporo, Japan, 1992; pp. 136–140. [Google Scholar]
  12. Chuvilin, E.; Bukhanov, B.; Davletshina, D.; Grebenkin, S.; Istomin, V. Dissociation and Self-Preservation of Gas Hydrates in Permafrost. Geosciences 2018, 8, 431. [Google Scholar] [CrossRef] [Green Version]
  13. Barenblatt, G.I.; Lobkovsky, L.I.; Nigmatulin, R.I. A mathematical model of gas outflow from gas-saturated ice and gas hydrates. Dokl. Earth Sci. 2016, 470, 1046–1049. [Google Scholar] [CrossRef]
  14. Lobkovsky, L.I.; Ramazanov, M.M. Theory of filtration in a double porosity medium. Dokl. Earth Sci. 2019, 484, 105–108. [Google Scholar] [CrossRef]
  15. Lobkovsky, L.I.; Baranov, A.A.; Ramazanov, M.M.; Vladimirova, I.S.; Gabsatarov, Y.V.; Semiletov, I.P.; Alekseev, D.A. Trigger Mechanisms of Gas Hydrate Decomposition, Methane Emissions, and Glacier Breakups in Polar Regions as a Result of Tectonic Wave Deformation. Geosciences 2022, 12, 372. [Google Scholar] [CrossRef]
  16. Domack, E.; Ishman, S.; Leventer, A.; Sylva, S.; Willmont, V.; Huber, B. A chemotrophic ecosystem found beneath Antarctic Ice Shelf. Eos Trans. Am. Geophys. Union 2005, 86, 269–272. [Google Scholar] [CrossRef] [Green Version]
  17. Wadham, J.L.; Arndt, S.; Tulaczyk, S.; Stibal, M.; Tranter, M.; Telling, J.; Lis, G.P.; Lawson, E.; Ridgwell, A.; Dubnick, A.; et al. Potential methane reservoirs beneath Antarctica. Nature 2012, 488, 633–637. [Google Scholar] [CrossRef]
  18. Thurber, A.R.; Seabrook, S.; Welsh, R.M. Riddles in the cold: Antarctic endemism and microbial succession impact methane cycling in the Southern Ocean. Proc. R. Soc. B Biol. Sci. 2020, 287, 20201134. [Google Scholar] [CrossRef] [PubMed]
  19. Lobkovsky, L.I.; Baranov, A.A.; Vladimirova, I.S.; Gabsatarov, Y.V. Possible seismogenic-trigger mechanism of activation of glacier destruction, methane emission, and climate warming in Antarctica. Oceanology 2023, 63, 131–140. [Google Scholar] [CrossRef]
  20. Lobkovsky, L.I.; Baranov, A.A.; Ramazanov, M.M.; Vladimirova, I.S.; Gabsatarov, Y.V.; Alekseev, D.A. Possible seismogenic-trigger mechanism of methane emission, glacier destruction and climate warming in the Arctic and Antarctic. Izv. Phys. Solid Earth 2023, 63, 33–47. [Google Scholar]
  21. Wille, J.D.; Favier, V.; Jourdain, N.C.; Kittel, C.; Turton, J.V.; Agosta, C.; Gorodetskaya, I.V.; Picard, G.; Codron, F.; Leroy-Dos Santos, C.; et al. Intense atmospheric rivers can weaken ice shelf stability at the Antarctic Peninsula. Commun. Earth Environ. 2022, 3, 90. [Google Scholar] [CrossRef]
  22. Bykov, V.G. Nonlinear waves and solitons in models of fault block geological media. Russ. Geol. Geophys. 2015, 56, 793–803. [Google Scholar] [CrossRef]
  23. Bykov, V.G. Stick-slip and strain waves in the physics of earthquake rupture: Experiments and models. Acta Geophys. 2008, 56, 270–285. [Google Scholar] [CrossRef]
  24. Nikolaevskii, V.N. Mathematical modeling of the solitary deformation and seismic waves. Dokl. Acad. Sci. 1995, 341, 403–405. (In Russian) [Google Scholar]
  25. Nikolaevskii, V.N. Geomechanics and Fluid Dynamics; Nedra: Moscow, Russia, 1996; p. 447. (In Russian) [Google Scholar]
  26. Nikolaevskii, V.N.; Ramazanov, T.K. Theory of the fast tectonic waves. J. Appl. Math. Mech. 1985, 49, 462–469. (In Russian) [Google Scholar] [CrossRef]
  27. Nikolaevskii, V.N.; Ramazanov, T.K. Generation and propagation of tectonic waves along the deep faults. Izv. Acad. Sci. USSR Ser. Fiz. Zemli 1986, 10, 3–13. [Google Scholar]
  28. Elsasser, W.V. Convection and stress propagation in the upper mantle. In The Application of Modern Physics to the Earth and Planetary Interiors; Runcorn, S.K., Ed.; John Wiley: New York, NY, USA, 1969; pp. 223–246. [Google Scholar]
  29. Anderson, D.L. Accelerated plate tectonics. Science 1975, 187, 1077–1079. [Google Scholar] [CrossRef]
  30. Melosh, H.J. Nonlinear stress propagation in the Earth’s upper mantle. J. Geophys. Res. 1976, 32, 5621–5632. [Google Scholar] [CrossRef] [Green Version]
  31. Garagash, I.A.; Lobkovsky, L.I. Deformation tectonic waves as a possible trigger mechanism for the activation of methane emissions in the Arctic. Arct. Ecol. Econ. 2021, 11, 42–50. (In Russian) [Google Scholar] [CrossRef]
  32. Lobkovsky, L.I.; Ramazanov, M.M. Thermomechanical waves in the elastic lithosphere–viscous asthenosphere system. Fluid Dyn. 2021, 56, 765–779. [Google Scholar] [CrossRef]
  33. Dziewonski, A.M.; Chou, T.-A.; Woodhouse, J.H. Determination of earthquake source parameters from waveform data for studies of global and regional seismicity. J. Geophys. Res. 1981, 86, 2825–2852. [Google Scholar] [CrossRef]
  34. Ekström, G.; Nettles, M.; Dziewonski, A.M. The global CMT project 2004–2010: Centroid-Moment tensors for 13,017 earthquakes. Phys. Earth Planet. Inter. 2012, 200–201, 1–9. [Google Scholar] [CrossRef]
  35. Climate at a Glance: Global Time Series. NOAA National Centers for Environmental Information. Available online: https://www.ncei.noaa.gov/cag/ (accessed on 14 April 2023).
  36. Lay, T. The surge of great earthquakes from 2004 to 2014. Earth Planet. Sci. Lett. 2015, 409, 133–146. [Google Scholar] [CrossRef]
  37. Lan, X.; Thoning, K.W.; Dlugokencky, E.J. Trends in Globally-Averaged CH4, N2O, and SF6 Determined from NOAA Global Monitoring Laboratory Measurements. Version 2023-02. Available online: https://0-doi-org.brum.beds.ac.uk/10.15138/P8XG-AA10 (accessed on 15 April 2023).
  38. Dlugokencky, E.J.; Steele, L.P.; Lang, P.M.; Masarie, K.A. The growth rate and distribution of atmospheric methane. J. Geophys. Res. 1994, 99, 17021–17043. [Google Scholar] [CrossRef]
  39. Kasahara, K. Migration of crustal deformation. Tectonophysics 1979, 52, 329–341. [Google Scholar] [CrossRef]
  40. Di Giovambattista, R.; Tyupkin, Y. Cyclic migration of weak earthquakes between Lunigiana earthquake of October 10, 1995 and Reggio Emilia earthquake of October 15, 1996 (Northern Italy). J. Seismol. 2001, 5, 147–156. [Google Scholar] [CrossRef]
  41. Liu, M.; Stein, S.; Wang, H. 2000 years of migrating earthquakes in North China: How earthquakes in midcontinents differ from those at plate boundary. Lithosphere 2011, 3, 128–132. [Google Scholar] [CrossRef] [Green Version]
  42. Trofimenko, S.V.; Bykov, V.G.; Merkulova, T.V. Space-time model for migration of weak earthquakes along the northern boundary of the Amurian microplate. J. Seismol. 2017, 21, 277–286. [Google Scholar] [CrossRef]
  43. Kuz’min, Y.O. Deformation autowaves in fault zones. Izv. Phys. Solid Earth 2012, 48, 1–16. [Google Scholar] [CrossRef]
  44. Bykov, V.G. Prediction and observation of strain waves in the Earth. Geodyn. Tectonophys. 2018, 9, 721–754. [Google Scholar] [CrossRef] [Green Version]
  45. Reuveni, Y.; Kedar, S.; Moore, A.; Webb, F. Analyzing slip events along the Cascadia margin using an improved subdaily GPS analysis strategy. Geophys. J. Int. 2014, 198, 1269–1278. [Google Scholar] [CrossRef] [Green Version]
  46. Harada, M.; Furuzawa, T.; Teraishi, M.; Ohya, F. Temporal and spatial correlations of the strain field in tectonic active region, southern Kyusyu, Japan. J. Geodyn. 2003, 35, 471–481. [Google Scholar] [CrossRef]
  47. Bella, F.; Biagi, P.F.; Caputo, M.; Della Monica, G.; Ermini, A.; Manjgaladze, P.; Sgrigna, V.; Zilpimian, D. Very slow-moving crustal strain disturbances. Tectonophysics 1990, 179, 131–139. [Google Scholar] [CrossRef]
  48. Bott, M.H.P.; Dean, D.S. Stress diffusion from plate boundaries. Nature 1973, 243, 339–341. [Google Scholar] [CrossRef]
  49. Savage, J.C. A theory of creep waves propagating along a transform fault. J. Geophys. Res. 1971, 76, 1954–1966. [Google Scholar] [CrossRef]
  50. Ida, Y. Slow-moving deformation pulses along tectonic faults. Phys. Earth Planet. Inter. 1974, 9, 328–337. [Google Scholar] [CrossRef]
  51. Rice, J.R. The mechanics of earthquake rupture. In Physics of the Earth’s Interior; Dziewonski, A.M., Boschi, E., Eds.; Italian Physical Society/North-Holland: Amsterdam, The Netherlands, 1980; pp. 555–649. [Google Scholar]
  52. Birger, B.I. Propagation of stresses in the Earth’s lithosphere. Izv. Akad. Nauk SSSR Ser. Fiz. Zemli 1989, 12, 3–18. (In Russian) [Google Scholar]
  53. Chuvilin, E.M.; Tumskoy, V.E.; Tipenko, G.S.; Gavrilov, A.V.; Bukhanov, B.A.; Tkacheva, E.V.; Audibert-Hayet, A.; Cau-quil, E. Relic gas hydrate and possibility of their existence in permafrost within the South-Tambey gas field. In Proceedings of the SPE Arctic and Extreme Environments, Moscow, Russia, 15–17 October 2013; pp. 1–9. [Google Scholar]
  54. Wallmann, K.; Pinero, E.; Burwicz, E.; Haeckel, M.; Hensen, C.; Dale, A.; Ruepkeet, L. The global inventory of methane hydrate in marine sediments: A theoretical approach. Energies 2012, 5, 2449–2498. [Google Scholar] [CrossRef] [Green Version]
  55. Dickens, G.R.; O’Neil, J.R.; Rea, D.K.; Owen, R.M. Dissociation of oceanic methane hydrate as a cause of the carbon isotope excursion at the end of the Paleocene. Paleoceanography 1995, 10, 965–971. [Google Scholar] [CrossRef]
  56. Maslin, M.; Owen, M.; Day, S.; Long, D. Linking continental-slope failure and climate change: Testing the clathrate gun hypothesis. Geology 2004, 32, 53–56. [Google Scholar] [CrossRef]
  57. Ruppel, C.D.; Kessler, J.D. The interaction of climate change and methane hydrates. Rev. Geophys. 2017, 55, 126–168. [Google Scholar] [CrossRef]
  58. Kennett, J.; Cannariato, K.G.; Henry, I.L.; Behl, P.J. Methane Hydrate in Quaternary Climate Change: The Clathrate Gun Hypothesis; American Geophysical Union: Washington, DC, USA, 2003; p. 217. [Google Scholar]
  59. Kvenvolden, K.A. Methane hydrates and global climate. Glob. Biogeochem. Cycles 1988, 2, 221–229. [Google Scholar] [CrossRef] [Green Version]
  60. Koven, C.D.; Ringeval, B.; Friedlingstein, P.; Ciais, P.; Cadule, P.; Khvorostyanov, D.; Krinner, G.; Tarnocai, C. Permafrost carbon-climate feedback accelerated global warming. Proc. Natl. Acad. Sci. USA 2011, 108, 14769–14774. [Google Scholar] [CrossRef] [PubMed] [Green Version]
  61. Shakhova, N.; Semiletov, I.; Gustafsson, O.; Sergienko, V.; Lobkovsky, L.; Dudarev, O.; Tumskoy, V.; Grigoriev, M.; Mazurov, A.; Salyuk, K.; et al. Current rates and mechanisms of subsea permafrost degradation in the East Siberian Arctic Shelf. Nat. Commun. 2017, 8, 15872. [Google Scholar] [CrossRef] [PubMed] [Green Version]
  62. Sergienko, V.I.; Lobkovsky, L.I.; Semiletov, I.P.; Dudarev, O.V.; Dmitrievskii, N.N.; Shakhova, N.E.; Romanovskii, N.N.; Kosmach, D.A.; Nikol’skii, D.N.; Nikiforov, S.L.; et al. The degradation of submarine permafrost and the destruction of hydrates on the shelf of East Arctic seas as a potential cause of the methane catastrophe: Some results of integrated studies in 2011. Dokl. Earth Sci. 2012, 446, 1132–1137. [Google Scholar] [CrossRef]
  63. Chuvilin, E.; Ekimova, V.; Davletshina, D.; Sokolova, N.; Bukhanov, B. Evidence of Gas Emissions from Permafrost in the Russian Arctic. Geosciences 2020, 10, 383. [Google Scholar] [CrossRef]
  64. Lobkovsky, L.I.; Ramazanov, M.M. A generalized model of filtration in a fractured-porous medium with low-permeable inclusions and its possible applications. Izv. Phys. Solid Earth 2022, 58, 281–290. [Google Scholar] [CrossRef]
  65. Cook, A.J.; Vaughan, D.G. Overview of areal changes of the ice shelves on the Antarctic Peninsula over the past 50 years. Cryosphere 2010, 4, 77–98. [Google Scholar] [CrossRef] [Green Version]
  66. Scambos, T.A.; Bohlander, J.A.; Shuman, C.A.; Skvarca, P. Glacier acceleration and thinning after ice shelf collapse in the Larsen B embayment, Antarctica. Geophys. Res. Lett. 2004, 31, L18402. [Google Scholar] [CrossRef] [Green Version]
  67. Wang, S.; Liu, H.; Jezek, K.; Alley, R.B.; Wang, L.; Alexander, P.; Huang, Y. Controls on Larsen C Ice Shelf retreat from a 60-year satellite data record. J. Geophys. Res. 2022, 127, e2021JF006346. [Google Scholar] [CrossRef]
  68. Domack, E.; Duran, D.; Leventer, A.; Ishman, S.; Doane, S.; McCallum, S.; Amblas, D.; Ring, J.; Gilbert, R.; Prentice, M. Stability of the Larsen B ice shelf on the Antarctic Peninsula during the Holocene epoch. Nature 2005, 436, 681–685. [Google Scholar] [CrossRef]
  69. Jones, R.S.; Johnson, J.S.; Lin, Y.; Mackintosh, A.N.; Sefton, J.P.; Smith, J.A.; Thomas, E.R.; Whitehouse, P.L. Stability of the Antarctic Ice Sheet during the pre-industrial Holocene. Nat. Rev. Earth Environ. 2022, 3, 500–515. [Google Scholar] [CrossRef]
  70. Kaufman, D.S.; Broadman, E. Revisiting the Holocene global temperature conundrum. Nature 2023, 614, 425–435. [Google Scholar] [CrossRef]
  71. Lösing, M.; Ebbing, J.; Szwillus, W. Geothermal heat flux in Antarctica: Assessing models and observations by Bayesian inversion. Front. Earth Sci. 2020, 8, 105. [Google Scholar] [CrossRef] [Green Version]
  72. Baranov, A.; Morelli, A. The Moho depth map of the Antarctica region. Tectonophysics 2013, 609, 299–313. [Google Scholar] [CrossRef]
  73. Baranov, A.; Tenzer, R.; Morelli, A. Updated Antarctic Crustal Model. Gondwana Res. 2021, 89, 1–18. [Google Scholar] [CrossRef]
  74. Baranov, A.; Tenzer, R.; Bagherbandi, M. Combined Gravimetric-Seismic Crustal Model for Antarctica. Surv. Geophys. 2018, 39, 23–56. [Google Scholar] [CrossRef] [Green Version]
  75. Baranov, A.; Morelli, A. The structure of sedimentary basins of Antarctica and a new three-layer sediment model. Tectonophysics 2023, 846, 299–313. [Google Scholar] [CrossRef]
  76. Baranov, A.; Morelli, A.; Chuvaev, A. ANTASed—An Updated Sediment Model for Antarctica. Front. Earth Sci. 2021, 9, 722699. [Google Scholar] [CrossRef]
  77. Morelli, A.; Danesi, S. Seismological imaging of the Antarctic continental lithosphere: A review. Glob. Planet. Change 2004, 42, 155–165. [Google Scholar] [CrossRef]
  78. Danesi, S.; Morelli, A. Structure of the upper mantle under the Antarctic Plate from surface wave tomography. Geophys. Res. Lett. 2001, 28, 4395–4398. [Google Scholar] [CrossRef]
  79. van Wyk de Vries, M.; Bingham, R.; Hein, A. A new volcanic province: An inventory of subglacial volcanoes in West Antarctica. Geol. Soc. Spec. Publ. 2018, 461, 231. [Google Scholar] [CrossRef]
  80. Mouginot, J.; Rignot, E.; Scheuchl, B. Continent-wide, interferometric SAR phase, mapping of Antarctic ice velocity. Geophys. Res. Lett. 2019, 46, 9710–9718. [Google Scholar] [CrossRef]
  81. Mouginot, J.; Rignot, E.; Scheuchl, B.; Millan, R. Comprehensive annual ice sheet velocity mapping using Landsat-8, Sentinel-1, and RADARSAT-2 data. Remote Sens. 2017, 9, 364. [Google Scholar] [CrossRef] [Green Version]
  82. Rignot, E.; Mouginot, J.; Scheuchl, B.; van den Broeke, M.; van Wessem, M.J.; Morlighem, M. Four decades of Antarctic Ice Sheet mass balance from 1979–2017. Proc. Natl. Acad. Sci. USA 2019, 116, 1095–1103. [Google Scholar] [CrossRef] [Green Version]
  83. Loose, B.; Naveira Garabato, A.C.; Schlosser, P.; Jenkins, W.J.; Vaughan, D.; Heywood, K.J. Evidence of an active volcanic heat source beneath the Pine Island Glacier. Nat. Commun. 2018, 9, 2431. [Google Scholar] [CrossRef] [PubMed] [Green Version]
  84. Graham, A.G.C.; Wåhlin, A.; Hogan, K.A.; Nitsche, F.O.; Heywood, K.J.; Totten, R.L.; Smith, J.A.; Hillenbrand, C.-D.; Simkins, L.M.; Anderson, J.B.; et al. Rapid retreat of Thwaites Glacier in the pre-satellite era. Nat. Geosci. 2022, 15, 706–713. [Google Scholar] [CrossRef]
  85. Morlighem, M.; Rignot, E.; Binder, T.; Blankenship, D.; Drews, R.; Eagles, G.; Eisen, O.; Ferraccioli, F.; Forsberg, R.; Fretwell, P.; et al. Deep glacial troughs and stabilizing ridges unveiled beneath the margins of the Antarctic ice sheet. Nat. Geosci. 2020, 13, 132–137. [Google Scholar] [CrossRef] [Green Version]
  86. Fretwell, P.; Pritchard, H.D.; Vaughan, D.G.; Bamber, J.L.; Barrand, N.E.; Bell, R.; Bianchi, C.; Bingham, R.G.; Blankenship, D.D.; Casassa, G.; et al. Bedmap2: Improved ice bed, surface and thickness datasets for Antarctica. Cryosphere 2013, 7, 375–393. [Google Scholar] [CrossRef] [Green Version]
  87. Winkelmann, R.; Martin, M.A.; Haseloff, M.; Albrecht, T.; Bueler, E.; Khroulev, C.; Levermann, A. The Potsdam Parallel Ice Sheet Model (PISM-PIK)—Part 1: Model description. Cryosphere 2011, 5, 715–726. [Google Scholar] [CrossRef] [Green Version]
  88. Pattyn, F. Sea-level response to melting of Antarctic ice shelves on multi-centennial timescales with the fast Elementary Thermomechanical Ice Sheet model (f.ETISh v1.0). Cryosphere 2017, 11, 1851–1878. [Google Scholar] [CrossRef] [Green Version]
  89. Epifanov, V.P. Physical simulation of glacier motion modes. Ice Snow 2016, 56, 333–344. (In Russian) [Google Scholar] [CrossRef] [Green Version]
  90. Feldmann, J.; Levermann, A. Collapse of the West Antarctic Ice Sheet after local destabilization of the Amundsen Basin. Proc. Natl. Acad. Sci. USA 2015, 112, 14191–14196. [Google Scholar] [CrossRef] [Green Version]
  91. Li, L.; Aitken, A.R.A.; Lindsay, M.D.; Kulessa, B. Sedimentary basins reduce stability of Antarctic ice streams through groundwater feedbacks. Nat. Geosci. 2022, 15, 645–650. [Google Scholar] [CrossRef]
  92. Mackintosh, A. Thwaites Glacier and the bed beneath. Nat. Geosci. 2022, 15, 687–688. [Google Scholar] [CrossRef]
  93. Bindschadler, R.; Choi, H.; Wichlacz, A.; Bingham, R.; Bohlander, J.; Brunt, K.; Corr, H.; Drews, R.; Fricker, H.; Hall, M.; et al. Getting around Antarctica: New high-resolution mappings of the grounded and freely-floating boundariesof the Antarctic ice sheet created for the International Polar Year. Cryosphere 2011, 5, 569–588. [Google Scholar] [CrossRef] [Green Version]
  94. Rosier, S.; Gudmundsson, G. Tidal bending of ice shelves as a mechanism for large-scale temporal variations in ice flow. Cryosphere 2018, 12, 1699–1713. [Google Scholar] [CrossRef] [Green Version]
  95. Holdsworth, G.; Glynn, J. Iceberg calving from floating glaciers by a vibrating mechanism. Nature 1978, 274, 464–466. [Google Scholar] [CrossRef]
  96. Timoshenko, S.P.; Voinovskii-Kriger, S. Plates and Shells; Nauka: Moscow, Russia, 1966; p. 635. (In Russian) [Google Scholar]
  97. Fish, A.M.; Zaretsky, Y.K. Ice Strength as a Function of Hydrostatic Pressure and Temperature; CRREL Report 97-6; U.S. Army Corps of Engineers: Washington, DC, USA, 1997; p. 14. [Google Scholar]
  98. Bogoyavlensky, V.I.; Garagash, I.A. Substantiation gas emission craters formation in the Arctic by mathematical modeling. Arct. Ecol. Econ. 2015, 3, 12–17. (In Russian) [Google Scholar]
  99. Rudnicki, J.W.; Rice, J.R. Conditions for localization of deformation in pressure-sensitive dilatant materials. J. Mech. Phys. Solids 1975, 23, 371–390. [Google Scholar] [CrossRef]
  100. Garagash, I.A.; Nikolaevskii, V.N. Non-associated flow laws and plastic strain localization. Adv. Mech. 1989, 12, 131–183. [Google Scholar]
  101. Itasca Consulting Group, Inc. FLAC3D—Fast Lagrangian Analysis of Continua in 3 Dimension; Version 3.1, User’s Manual; Itasca: Minneapolis, MN, USA, 2006. [Google Scholar]
  102. Viterito, A. The Correlation of Seismic Activity and Recent Global Warming. J. Earth Sci. Clim. Change 2016, 7, 345. [Google Scholar] [CrossRef]
  103. Viterito, A. The relationship between mid-ocean spreading zone seismic activity and global temperatures remains strong through 2018. Int. J. Environ. Sci. Nat. Res. 2019, 20, 556039. [Google Scholar] [CrossRef]
Figure 1. Global earthquake foci distribution in 1976–2020 based on GCMT catalog data, https://www.globalcmt.org (accessed on 16 April 2023) [33,34].
Geosciences 13 00171 g001
Figure 2. Comparison of changes in the average temperature anomaly in the Arctic during the 20th and early 21st centuries (a) and the release of seismic energy, shown in the form of large earthquake sequence (b) and cumulative seismic moment (c), modified from [35,36].
Geosciences 13 00171 g002
Figure 3. Propagation of tectonic waves towards Arctic from the large earthquakes in the Aleutian and Kuril–Kamchatka subduction zones in the second half of the 20th century.
Geosciences 13 00171 g003
Figure 4. (a) The graphs showing globally averaged, monthly mean atmospheric methane [37]; (b) Plot of the annual increments of the atmospheric CH4 based on globally averaged marine surface data [38].
Geosciences 13 00171 g004
Figure 5. Correlation between changes in the Earth’s seismic activity and variations in the atmospheric methane concentration. The blue line shows the envelope curve for the change in the average annual increments of methane concentration during 1984–2022, calculated by means of cubic spline approximation. The red line corresponds to the variation in the Earth’s seismic activity level during 1964–2002.
Geosciences 13 00171 g005
Figure 6. Schematic representation of the seismogenic trigger mechanism of methane emission on the polar shelf due to the destructive effect on gas hydrates of deformation waves caused by strong earthquakes in the subduction zone: (a) Large-magnitude earthquake generating the tectonic wave; (b) Tectonic wave propagation; (c) Methane emission caused by the stresses arriving in methane-saturated and hydrate-bearing permafrost area.
Geosciences 13 00171 g006
Figure 7. Lithosphere-asthenosphere system model after [28].
Geosciences 13 00171 g007
Figure 8. Thermomechanical tectonic deformation wave parameter profiles: (a) group velocity of the wave propagation versus normalized asthenosphere viscosity ηa0 = 5 × 10¹⁷ Pa∙s); (b) Tensile stresses’ attenuation over the distance from the wave source.
Geosciences 13 00171 g008
Figure 9. Hydrate stability (HSZ) and metastability (HUZ) domains shown on the depth–temperature plot. The red line indicates the temperature profile, and the green curve corresponds to the equilibrium P-T conditions of methane hydrate formation.
Geosciences 13 00171 g009
Figure 10. Evidence of the bubble methane release on the East Siberian Arctic Shelf, being the main methane transport mechanism from the seafloor sediments into the water and atmosphere: photos of the bubbles in the surface ice (a) and sonar images showing underwater emissions (b) [61].
Geosciences 13 00171 g010
Figure 11. Residual crater from a suspected methane blast near the Bovanenkovo oil and gas field in the Yamal Peninsula after [6].
Geosciences 13 00171 g011
Figure 12. Metastable gas hydrate structure.
Geosciences 13 00171 g012
Figure 13. The total area of ice shelves in the Antarctic Peninsula over the past decades according to [65], modified.
Geosciences 13 00171 g013
Figure 14. Sources of the large earthquakes in the Chilean subduction zone during 1940–1943. Red stars correspond to focal zones.
Geosciences 13 00171 g014
Figure 15. An elevation map of the surface of the Antarctic Peninsula, showing, in blue, the current largest ice shelves: Larsen (32,000 km2); George VI (24,000 km2) and Wilkins (10,000 km2), sea without shelf ice is shown in white.
Geosciences 13 00171 g015
Figure 16. Foci of the large earthquakes in the Chilean and Kermadec–Macquarie subduction zones in 1960–2000 (a) and 2001–2022 (b).
Geosciences 13 00171 g016
Figure 17. Heat flux map of Antarctica, modified after [71]. Black dots show locations of volcanoes. Deception and Erebus volcanoes are marked by red stars.
Geosciences 13 00171 g017
Figure 18. Different modes of ice sheet movement in West Antarctica.
Geosciences 13 00171 g018
Figure 19. Sources of the large earthquakes in the Kermadec-Macquarie subduction zone during 1917–1920 and deformation wave propagation towards Mount Erebus. Red stars correspond to focal zones.
Geosciences 13 00171 g019
Figure 20. Stages of ice sheet movement for the Antarctic Peninsula: (a) Slow stage of the viscous flow of a glacier with adhesion to the bed (~1000 years); (b) Stage of glacier sliding along the bed due to the melting of its base with the presence of adhesion zones (~100 years); (c) Stage of rapid glacier sliding after destruction of adhesion zones by the deformation wave accompanied by the rear fault emergence and methane emission (~10 years).
Geosciences 13 00171 g020
Figure 21. Ice velocity distribution of the West Antarctic Ice Sheet derived from multisensor data for the time period 2014–2016 modified after [80,81]. Black lines delineate the catchment area for each drainage ice stream using surface slope and ice flow direction data. Used abbreviation: 1—Larsen C Ice Shelf; 2—Filchner–Ronne Ice Shelf; 3—Pine Island Glacier; 4—Thwaites Glacier; 5—Ross Ice Shelf.
Geosciences 13 00171 g021
Figure 22. Bedrock and ice topography profiles across the Thwaites Glacier.
Geosciences 13 00171 g022
Figure 23. Subglacial topography of West Antarctica according to the model BEDMACHINE [85]. Red line—topography profile from South Pole to the Thwaites Glacier. Volcanoes are marked by yellow points. Deception and Erebus volcanoes are marked by red stars.
Geosciences 13 00171 g023
Figure 24. Ice thickness map for Antarctica from BEDMAP 2 model [86]. Used abbreviation: 1—Larsen C Ice Shelf; 2—Pine Island Glacier; 3—Thwaites Glacier.
Geosciences 13 00171 g024
Figure 25. Sketch of the Antarctic glacier cross-section.
Geosciences 13 00171 g025
Figure 26. Ice elevation above sea level (a) and distribution of maximum tensile stresses at the glacier’s lower boundary (b). Curves 1 and 2 correspond to thicknesses values of h = 200 m and h = 600 m, respectively.
Geosciences 13 00171 g026
Figure 27. Incremental displacements (a) and maximum tensile stress at the lower boundary of a glacier (b) calculated for maximum tide height of 2 m. Curves 1 and 2 correspond to thicknesses values of h = 200 m and h = 600 m, respectively.
Geosciences 13 00171 g027
Figure 28. (a) System of cracks in the Larsen glacier and (b) the calculation domain of the ice field.
Geosciences 13 00171 g028
Figure 29. Development of shear strain localization zones in the ice field associated with the increase of compressional stresses. Panels (ac) represent three successive stages of inelastic shear strain build up.
Geosciences 13 00171 g029
Figure 30. Vertical displacement patterns within the shear strain localization zones growing from a few centimeters (a) to around 1 m (b) and further to tens of meters (c) as the compressional stresses increase.
Geosciences 13 00171 g030
Table 1. Flow velocity estimates.
Glacier ThicknessVelocity
in Case of Adhesion
Velocity
in Case of Slip (Sliding)
3000 m22.7 m/year3.2 × 103 m/year
3500 m66.7 m/year6.0 × 103 m/year
Disclaimer/Publisher’s Note: The statements, opinions and data contained in all publications are solely those of the individual author(s) and contributor(s) and not of MDPI and/or the editor(s). MDPI and/or the editor(s) disclaim responsibility for any injury to people or property resulting from any ideas, methods, instructions or products referred to in the content.

