Slope Stability in a Multi-Hazard Eruption Scenario (Santorini, Greece)


1
DICEA, Dipartimento d’Ingegneria Civile, Edile e Ambientale, Università degli Studi di Napoli Federico II, 80138 Napoli, Italy
2
DISTAR, Dipartimento di Scienze della Terra, dell’Ambiente e delle Risorse, Università degli Studi di Napoli Federico II, 80138 Napoli, Italy
*
Author to whom correspondence should be addressed.
Geosciences 2019, 9(10), 412; https://0-doi-org.brum.beds.ac.uk/10.3390/geosciences9100412
Submission received: 10 September 2019
/
Accepted: 19 September 2019
/
Published: 24 September 2019
(This article belongs to the Special Issue Seismic Multi-Hazard Mitigation from Source to Satellite: Applications and Technological Development)
Abstract
:Under the European FP7 SNOWBALL project (2014–2017), the island of Santorini was used as a case study to validate a procedure to assess the possible multiple cascading effects caused by volcanic eruptions. From January 2011 to April 2012, the area was affected by low to moderate (Mw <3.2) seismic shaking, which caused concern regarding a possible volcanic eruption that ultimately failed to materialize. Assuming the worst-case scenario of a sub-Plinian eruption, this study provides insights into the approach adopted by the SNOWBALL project to identify the most critical areas (hot spots) for slope stability. Geological field surveys, thematic maps, and geomorphological data on aerial photos and landform interpretation were adopted to assess the static susceptibility. The eruption scenario is related to two different phenomena: a pre-eruption earthquake (Mw 5.2) and the subsequent ash fallout deposition following the prevailing winds. Landslide susceptibility in seismic conditions was assessed through the HAZUS approach and the estimate of Newmark displacements (u), while the critical areas for ash fallout mobilization were assessed adopting empirical relationships. The findings are summarized in a scenario map reporting the most critical areas and the infrastructures most vulnerable to such phenomena.
1. Introduction
Many areas of the world are affected by several different types of hazards, which can occur individually or in combination. In the latter case, the term generally used is “multi-hazard”, indicating all the major hazards that are present in a specific area [1]. The relationships between the various types of hazard may range from interactions to cascades and domino effects [2,3,4,5,6]. In such cases, assessment and mitigation of the risk at a given location requires non-conventional approaches that allow for possible interactions among the hazards. This has given rise to several loss estimation methodologies, such as HAZUS [7] for hurricanes, earthquakes and floods, PTVA in its updated version for multi-hazards [8], and the method proposed by [9] to assess multi-hazards due to climate variations and so on. Thus, local, regional, and state officials are provided with state-of-the-art decision support tools for estimating potential losses from natural hazards. The identification of areas likely to be most affected by a certain hazard is based on spatial analyses carried out by geographic information systems (GIS), while forecasting capability will enable stakeholders to develop plans and strategies for reducing the risk.
The European FP7 project SNOWBALL (2014–2017) represented an excellent opportunity to develop and validate a specific platform for the assessment of multiple cascading effects caused by volcanic eruptions. From this perspective, possible cascading events induced by volcanic eruption and the associated seismic shaking are analyzed. The selected case study was the island of Santorini (Greece), because it is an active volcanic area, which up to 1950 A.D. produced several eruptions with damages and casualties. In 2011–2012, the island was characterized by unprecedented seismic and geochemical unrest, which led to fear of an imminent eruption. The island is also crossed by the seismogenic Kameni and Columbos lines, which could originate high-magnitude tectonic earthquakes. Given that Santorini is one of the most popular tourist resorts in the Mediterranean Sea, with more than 100,000 visitors from May to October, it is crucial to take cascading effects into account when performing accurate evaluations of multi-hazard scenarios.
The main aim of the SNOWBALL Project was the development and testing of a support tool provided to decision makers for emergency planning at several scales. The crisis simulations evaluated chains of cascading events following three main volcanic scenarios for the multi-hazard characterization, i.e., volcanic unrest, vulcanian eruption, and sub-Plinian eruption. The results were adopted to investigate the vulnerability of the exposed elements, i.e., people, buildings, and infrastructures. In this paper, the methods and the results for the assessment of slope stability are described, while overall project results can be found in [10]. In particular, the paper focuses on the characterization of the landslides hazard and the identification of the most critical areas (hot spots), assuming the worst-case scenario of a sub-Plinian eruption.
The paper first presents the geological and volcanological setting of the area (Section 2), followed by the methods to produce thematic maps for the analyzed eruption scenario (Section 3): (i) landslide susceptibility before the eruption (static case), which represents the actual state of the slopes; (ii) susceptibility in seismic conditions due to pre-eruptive moderate earthquakes; and (iii) ashfall remobilization. The data adopted are discussed in Section 3.4, together with the identification of the geomorphological units, while the thematic maps and the relative results can be found in Section 4. The final scenario map and the identified hot spots are discussed in Section 5. The latter provides information on the areas that are most prone to be affected by these phenomena, where vulnerability analysis as well as risk mitigation strategies are required.
2. Geological and Volcanological Background
Santorini belongs to the southern Aegean volcanic arc located at the north of the convergent plate boundary between the African and the Eurasian plate. The volcanic complex consists of five islands that are the remnants of volcanic collapses: Nea Kameni and Palea Kameni in a flooded caldera, surrounded by the islands of Thira, Thirasia, and Aspronisi (see Figure 1).
The pre-volcanic bedrock, consisting mainly of late Mesozoic–early Cenozoic schists and marbles, is exposed on Mt. Profitis Ilias [11,12] in the southeastern part of the island.
Volcanic activity on Santorini started two million years ago, and the caldera cliffs preserve well-exposed sequences of lavas and pyroclastic deposits, which record the long development of the volcano. These include the products of 12 major explosive eruptions and the dissected remains of several ancient lava shields, stratovolcanoes, and lava dome complexes [13].
Subaerial volcanic activity began about 650 ka ago, and has continued without significant interruption to the present day, with alternated mafic/intermediate extrusive and effusive eruptions. The shape of the actual caldera was formed by the acidic Plinian Minoan eruption around 1650 B.C. [11,12,13,14]. Post-Minoan volcanic activity progressively formed inside the caldera the volcanic islets of Palea Kameni and Nea Kameni by the effusive dacitic activity associated with vulcanian eruptions, the last of which occurred in 726 A.D. To the northeast of Santorini, the active submarine volcano of Columbo is located, whose most recent explosive eruption occurred in 1649–1650 and killed 70 people due to ash fallout, volcanic gas clouds, and a tsunami [15,16]. All historic eruptions of Santorini occurred from vents located on two parallel NE–SW volcano-tectonic lines, the Kameni line in the Santorini caldera running from the Kameni islets to the main island of Thira, and the Columbos line, running from northern Thira to the submarine volcano, Columbo [17].
These major eruptions are comprehensively referred to as the Thira Pyroclastic Formation (TPF). Prominent examples of the 12 eruptions of the TPF are the Cape Therma ignimbrites, the Lower Pumice 1, the Lower Pumice 2 [18], the Middle Pumice, the Cape Riva Eruption [19], and finally, the Minoan event [20,21]. All 12 eruptions started with Plinian (or sub-Plinian) fall phases generating generally well-sorted dacitic to rhyo-dacitic pumice deposits with accessory lithics. Between the 12 major eruptions, relatively smaller inter-Plinian eruptions were recognized. The products of the 12 Plinian and inter-Plinian eruptions of the Thira Pyroclastic Formation are well exposed in the caldera wall succession of Thira, Thirasia, and Aspronisi. In 2011–2012, the island was characterized by unprecedented seismic and geochemical unrest, which led to fear of an imminent eruption [22].
The landslide hazard in Santorini was discussed in a recent paper by [23], who adopted nine weighted causative factors to assess landslide susceptibility based on the application of multi-criteria analysis (multicriteria decision analysis, or MCDA), which weighted the predisposing factors by the judgment of the experts. The highest risk value is obtained for the central and northern part of the inner caldera, where high slope angles and lithologies with poor mechanical properties are present. [24] evaluated landslide susceptibility through overlay analysis based on broad geologic, geomorphologic, and geotechnical factors combined with man-made works resulting in a low, medium, and high grading map. The results found that the most critical areas were in the towns of Oia, Thira, Athinios and Cape Alonaki. Conversely, [25] focused in detail on the condition of slope stability near Athinios harbor, which was adopted to assess the probability of rock block invasion through a geostructural approach adopting a commercial software. The results found that the most susceptible areas were those upslope and downslope the road to the harbor. These studies reported rockfalls and debris flows as the most prevalent landslide types, while within the caldera, rock slides and soil slips are also common.
3. Materials and Methods
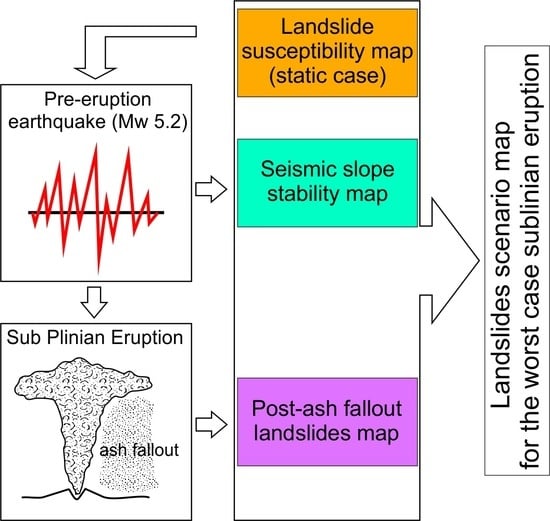
In this study, the identification of the most critical areas and infrastructures (hot spots) for slope stability is assessed through the approach of overlaying thematic maps and verification in the field. First, a landslides-triggering susceptibility map is produced, in order to show the distribution of the most unstable slopes (static scenario). Afterwards, the maps of slope performance in the case of a sub-Plinian eruption are made; this event represents the less likely, but the worst of the three scenarios considered for the SNOWBALL project. The volcanic scenario is characterized by moderate precursory seismic shaking (Mw 5.2) and the subsequent ash fallout oriented along the dominant winds. Hence, other two maps accounting for the slope displacements due to the ground shaking (seismic scenario) and identifying the areas most prone to the mobilization of the fallen ash (post-ashfall deposition scenario) are produced.
3.1. Landslide Susceptibility Map (Static Scenario)
Following [26], susceptibility can be defined as the probability of the spatial occurrence of slope failures for different-sized landslides, given a set of geoenvironmental conditions. It neglects the size, length, width, depth, area, or volume of the landslides on the contrary of the hazard, where the probability that a landslide having a certain magnitude will occur in a given period and in a given area is considered. Susceptibility can be considered as the first step for the hazard assessment, or it can be assumed as a useful approach for areas where it is difficult to have information about historical landslide events, rainfall records, or the magnitude/intensity of the earthquakes that have triggered the landslides [27,28].
Landslide hazard assessment can be performed using different approaches: field-based, qualitative, or quantitative. Useful reviews of of concepts, principles, techniques, and methodologies for landslide susceptibility, hazard, and risk evaluation can be found in [28,29]. Furthermore, in [30], a review on the methods for assessing runout and vulnerability is presented, also highlighting the role of GIS in the model development [31]. Finally, [32] provides guidelines and recommendations for the quantitative analysis of landslide hazard, vulnerability, and risk at different spatial scales, and for the verification and validation of the results.
In this study, a triggering susceptibility map was based on the frequency ratio model [33,34,35]. It is based on the spatial relationship between the location of landslides and predisposing factors, while a ROC (receiver operating characteristic) curve was adopted as indicator to check the prediction performance of the method. A Landslide Inventory (LI), discussed in the Section 3.4, was randomly divided into two sub-sets: a training group to produce the map, and a testing group to validate. The dataset was split 50:50, in order to have a high validation set and to avoid an unbalanced spatial distribution of the landslides. The occurrence, frequency, and magnitude of the landslides are controlled by a large number of predisposing factors, and the weighting of each factor depends on the environmental setting (e.g., climatic conditions, internal relief, geological setting, geomorphological evolution, and processes) and the terrain conditions (e.g., soil properties and depth, subsurface hydrology, density and orientation of discontinuities, local relief). Hence, the choice of factors depends on the scale of analysis, the characteristics of the study area, the landslide type, and the failure [32].
In this paper, the chosen predisposing factors are the lithology, slope angle, aspect, main geomorphological units (MGU), and the Land Cover (CLC) [36]. The landslide dataset used for calibration was overlaid with each thematic map; then, the frequency ratio (FR) of each factor class was calculated following Equation (1):
where Nilp is the number of landslides pixels in each predisposing factor class, Nl is the number of total landslides pixels, Nip is the number of pixels in each predisposing factor class, and N is the number of total pixels of the study area. The calculated ratio values (FR) were used to produce weighted factor thematic maps, which were overlaid and numerically summed using a GIS to provide the Landslide Susceptibility Index (LSI) map following Equation (2):
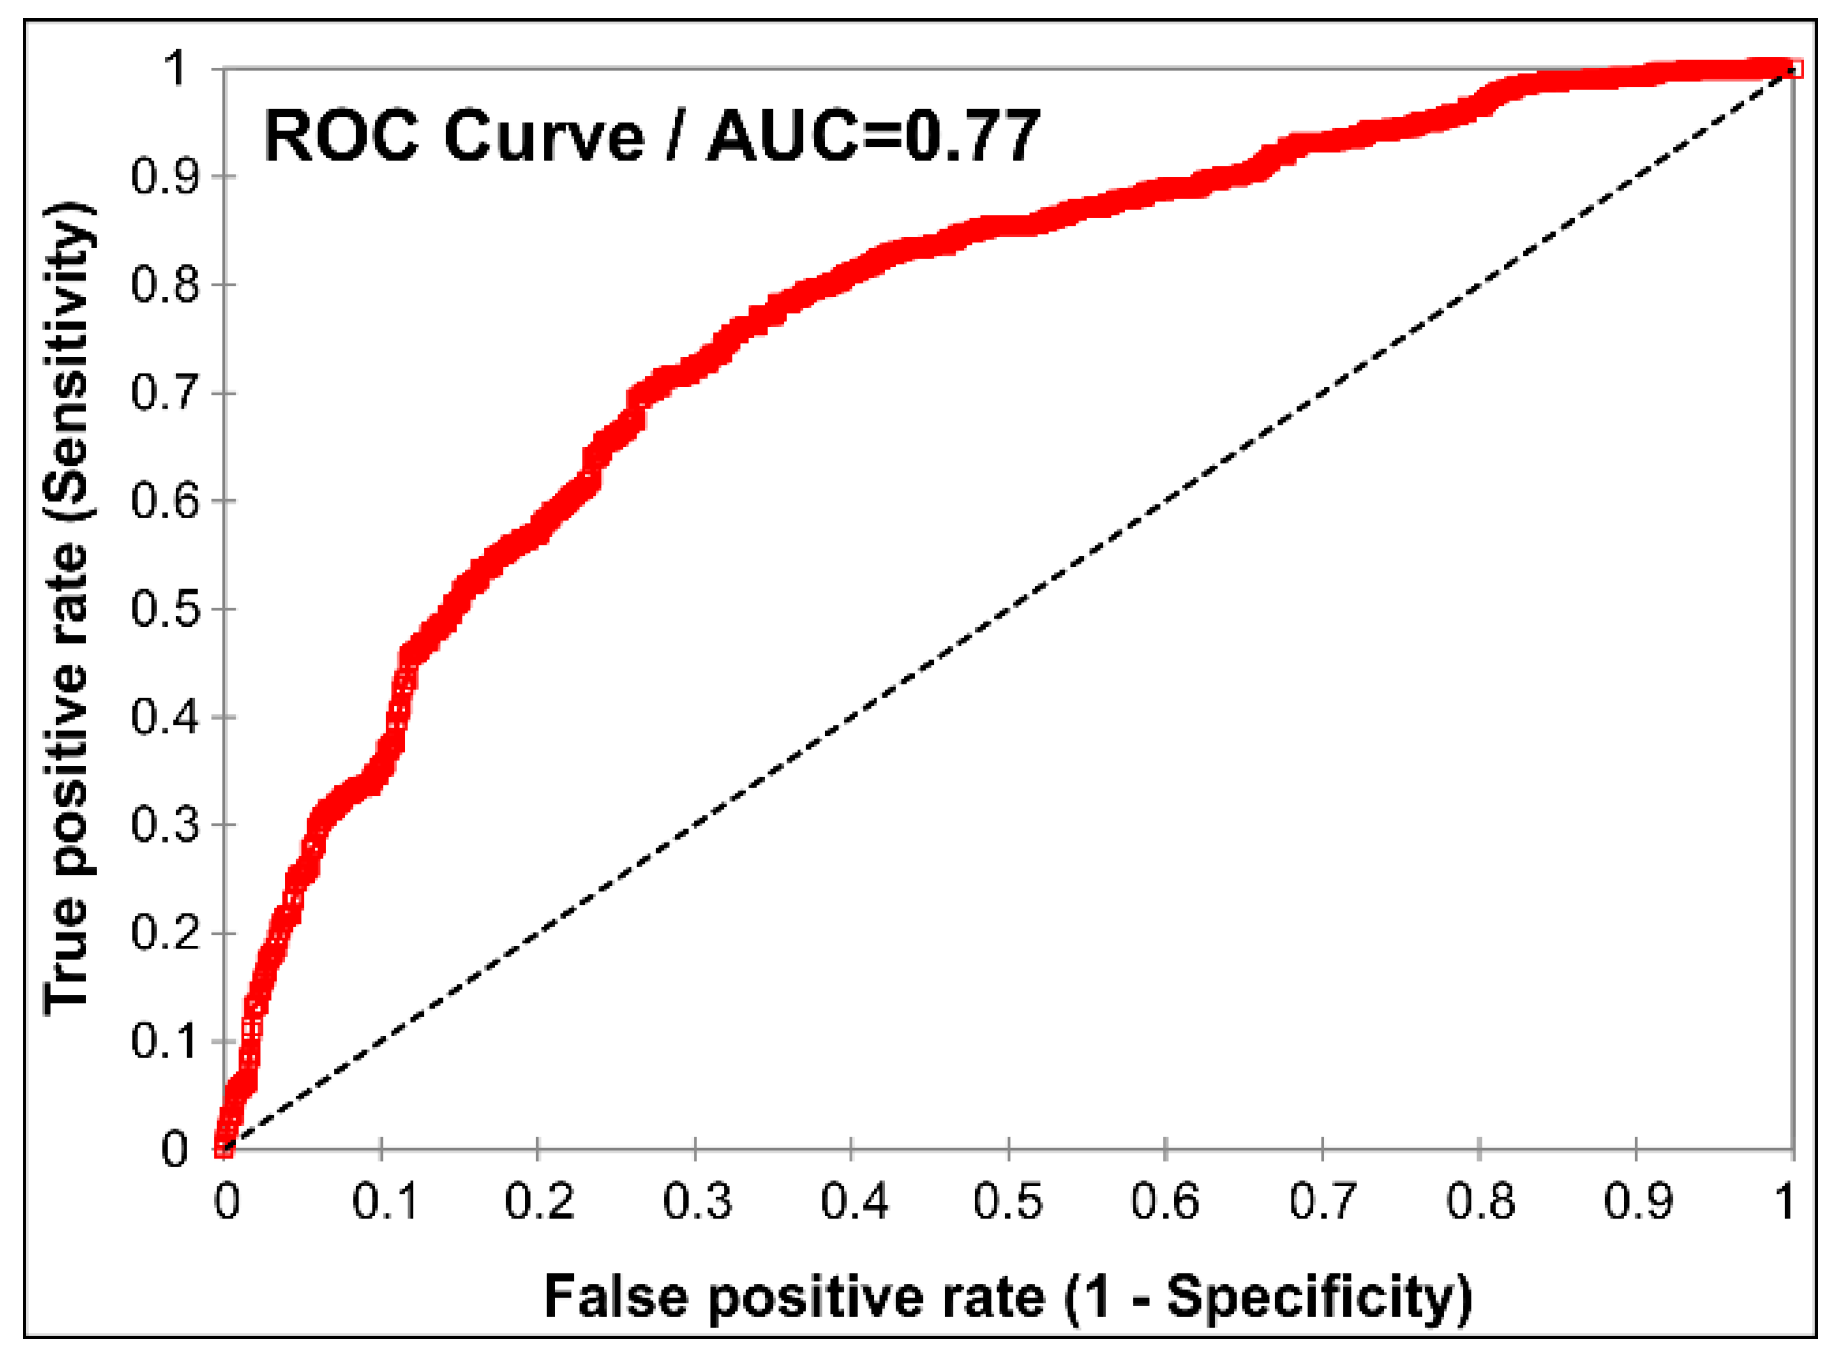
The ROC curve, adopted in several scientific papers (e.g., [37,38]), is a graphical representation of the model fit. This type of analysis measures, for different thresholds (e.g., different values of Factor of Safety, or Susceptibility Class), the proportion of positive values (i.e., landslide presence) that are correctly identified as such (TPR; true positive rate or sensitivity) together with the proportion of negative values (i.e., landslide absence) that are erroneously reported as positive (FPR; false positive rate or fall-out). The area under the curve (AUC) is the value that summarizes the expected performance: the larger the area, the better the accuracy of the model. An AUC higher than 0.7 represents a good model, while an AUC above 0.9 is excellent.
3.2. Seismic Slope Stability Map
In the literature, most large-scale methods proposed for seismic slope stability assessment refer to displacement-based methods [39,40,41,42,43,44]. They characterize the seismic hazard of some synthetic ground motion parameters and adopt empirical relationships to predict earthquake-induced displacements. The user judges the significance of the obtained displacement, since accurately predicting which slopes will move and quantifying the severity of that movement is quite difficult. Following the Newmark [45] approach, the triggering occurs when the acceleration overcomes a threshold value (ac, critical acceleration), which represents an index of landslide susceptibility in seismic conditions.
In order to calculate this parameter, data on the geotechnical characterization of the materials are required. For the case study, such information was not available; hence, the empirical HAZUS method [7] was applied. The HAZUS procedure relates landslide susceptibility classes to the local lithology, the slope angle, and extreme groundwater conditions. The latter may be defined as a groundwater table below the potential sliding surface (dry) or considering soil completely saturated (wet), without any reference to measurements of the soil strength parameters. The choice of this simplified procedure was induced by the unavailability of in situ and laboratory test data. For this study, dry conditions are more suitable, given that in 30 years (1974–2004), the mean annual rainfall recorded at Thira airport rain gauge station was 312 mm, while the maximum average monthly rainfall was 60 mm in January (data provided by Thira municipality). These rainfalls are scarce, and they are mainly distributed in high-intensity and short-duration events (flash floods), and they are assumed as not capable of saturating the soils.
As regards the lithological classification, three geological groups with decreasing degrees of mechanical strength (A, B, C) are defined, respectively represented by strongly cemented rocks, weakly cemented rocks, and argillaceous rocks. Following the HAZUS procedure, critical acceleration, ac (g) is attributed from the intersection of the lithological groups with slope angle values (assuming a reference groundwater condition), as reported in Table 1.
Permanent slope displacement (u) on a regional scale can be estimated by adopting predictive relationships expressing displacements as a function of critical acceleration and synthetic ground motion parameters [46,47,48,49,50], which in most cases accounts for the peak ground acceleration (PGA) at the surface. The adopted seismic input in terms of PGA is an intra-caldera seismic event representing the worst-case shaking scenario (Mw 5.2) due to the occurrence of a sub-Plinian eruption along the Kameni tectonic line (see Figure 1). The PGA distribution provided by [51] for the SNOWBALL project also accounted for topographic aggravation up to a factor of 1.5–2.0 in the area of Imerovigli/Skaros, Thira, Athinios, and soil classes A and B following the Eurocode 8 classification [52]. In this study, the relationship for the estimation of permanent displacements, u, proposed by [47] was adopted. It is shown in Equation (3) and was chosen among the many proposed in the technical literature, as it is an upper bound relationship (for the benefit of safety) and was calibrated on moderate magnitude earthquakes (ML 4.0–6.6) in agreement with the scenario earthquake generated for Santorini.
where ac is the critical acceleration and as is the amplified seismic acceleration.
3.3. Ash Fallout Mobilization
Post-eruptive ashfall deposition could be mobilized as lahars close to the vent, but also flow-like landslides [53,54,55]. They can occur during eruptive activity or in the post-eruptive stage. Their onset depends on unconsolidated debris/tephra and steep slopes as predisposing factors, while the triggering depends on the availability of water. In this study, the ashfall mobilization is assessed by adopting the empirical relationship between slope and the thickness of the pyroclastic soils found for Campania (southern Italy) by [56,57]. It identifies for slopes flatter than 30°, soil thickness corresponding approximately with the theoretical total ashfall deposit in the area; hence, no mobilization occurs. On slopes steeper than about 50°, the soil is absent due to total mobilization, while between 30°–50°, the mobilized thickness (tm) approximately follows Equation (4):
where t0 is the value of the ashfall contour line, and α is the slope. This approach permits to attempt the mapping of areas mostly prone to the ashfall mobilization. It was carried out considering the deposition of an ashfall coming from a 12-km height plume from the sub-Plinian scenario provided by [58] in terms of isolines.
3.4. Data
The application of methods described in the previous sections requires extensive basic data, i.e., a lithological map, landslide inventory map, slope angle map, aspect map, main geomorphological unit map (MGU), and land cover, respectively. To this aim, the study was preceded by the re-interpretation of the pre-existing geological maps by [14], which were adopted for the reconstruction of a lithological map, summarizing the main geological features and highlighting the bedrock formations in terms of similar lithology, as shown in Figure 2a.
Furthermore, the local authorities did not possess an inventory map of the landslides that was created for the SNOWBALL project through an aerial survey performed in 2015. The data permitted obtaining georeferenced digital ortho-photos and a detailed 1 × 1 m cell digital elevation model (DTM). The interpretation and identification of both the landforms and landslides on aerial pictures resulted in an original Landslide Inventory map (LI) and a DTM (1 × 1 m) used to produce the thematic maps of slope angle and aspect shown in Figure 2b–d.
The geolithological map (Figure 2a) comes from a reinterpretation of the pre-existing geological maps and was obtained by grouping the various geological formations according to lithological similarity. For example, the carbonates encompass the limestones of Mt. Profitis Ilias and Mesa Vouno Gavrilos, as well as the marbles from the Mesozoic to the Tertiary, while the metamorphic bedrock cropping out around Athinios, Plaka, and Thermia is made of metapelites and schists (Paleocene–Eocene). Igneous successions encompass lavas, tuffs, and pyroclastic deposits. Lavas extensively crop out in the whole of Thira and consist of both ancient deposits (around 600 ka) and historic events (46 A.D.–1950) in Kameni islands. Tuffs and pyroclastic soils are constituted by ancient deposits (around 500–300 ka), but also include the Minoan eruptive event, which covers most of Thira. Finally, debris and beach (Holocene) deposits are also highlighted.
The results of the landslide inventory using aerial pictures taken from a survey carried out in 2015 for SNOWBALL are reported in Figure 2b. The most frequent landslides can be classified as rockfalls/slides and debris flows; they mostly affect the inner rim of the caldera and some small cliffs close to the beaches on the eastern side of the island, and a few cases on the slopes of Mt. Profitis Ilias. According to [59,60], the southern part of the caldera wall has scallop shapes attributed to rotational landslips occurring during caldera formation that were significant to enlarge it beyond the main collapse faults [25]. For the whole island, 271 debris flows were identified through aerial photointerpretation of the crown; the slide and the invasion areas were also mapped in each case. Regarding rockfalls/slides, the scale of the study does not permit the crowns to be identified singularly. Hence, 84 polygons of affected areas—about a total of 0.6 km2—were recognized by following evidence on the cliffs and the relative landslide body at the base of the slope.
The maps of slope angles and aspect, respectively shown in Figure 2c,d were obtained from a detailed 1 × 1 m cell digital elevation model (DTM).
Figure 3a shows the Land-Cover Map [36], in which most of the area is made of cultivation and vineyards on more gentle slopes and bare rock on steeper ones; the legend of the map is reported in Table 2. Furthermore, the geolithological and slope maps together with georeferenced digital orthophotos allowed defining the main geomorphological units (MGU) present on the island, as shown in Figure 3b.
The MGU map shows the main geomorphological units and sub-units of the island, i.e., areas where the same lithological and morphodynamic conditions occur. They can be listed as follows:
These slopes are characterized by rectilinear, high-gradient (> 30°) profiles, and mainly consist of crystalline limestones, dolomites, and phyllites representing the pre-volcanic relief of Thira. They are located in the southeastern part of the island, which is also characterized by the highest relief, reaching an altitude of 550 m a.s.l. This unit is prone to landslides mainly along the coastal sector, where active sea cliffs up to 10-m high can be found. The most widespread geomorphic sub-unit is represented by small watersheds located along the southern slope of Mt. Profitis Ilias. These catchments feed some alluvial fans located in the vicinity of the village of Agio Georghios which, during concentrated/high-intensity rainfall events, may be prone to flash floods.
MGU II. Inner slopes of the Thira caldera
These slopes have the highest gradients (> 30°) and show a typical stepped profile due to the interbedding of strata made up by hard (generally lavas) and soft pyroclastic rocks. They are located all along the western perimeter of the island, and with their concave planar shape contribute to create the crescent morphologies of Thira Island. At the base, these slopes always show an active coastal cliff, up to tens of meters high. The main morphodynamic processes occurring in this unit are gravity processes controlled by selective erosion and coastal erosion. The most widespread landslide types belong to rockfalls, toppling, and debris flows.
MGU III. and MGU IV Outer slopes of the Thira caldera
This unit is divided according to slope gradient in III and IV. The first (MGU III) includes the slopes with mean gradients between 20°–30°, in the northeastern and southwestern part of Thira. They are generally associated with volcanic clusters, mainly formed by lavas, and are characterized by a regular longitudinal profile, which testifies to a general condition of stability. In the area surrounding Vourvoulos and Firostefani, they are also dissected by deep gullies. MGU IV is associated with the lowest gradient slopes (< 20°), where the most erodible pyroclastic successions crop out. These slopes show a very irregular planar shape and have irregular profiles but, due to the low gradient, are generally not affected by major landslide phenomena. Gravity processes concentrate along the scarp of the main gullies dissecting the unit; here, erosion and deposition processes due to running water also occur. Even if the island has a very low mean rainfall, the presence of small fan deltas at the mouth of the main streams and several historic flash floods testify to the activity of fluvial processes as morphodynamic agents. Along the eastern perimeter of the island, the transition between the slopes of this unit and the coastal cliffs is characterized by the presence of terraced surfaces located at different elevations (from 80 to 10 m a.s.l.). These surfaces may be interpreted as “marine terraces” uplifted by volcano-tectonics. The coastal cliffs located in units III and IV show a very different morphology and evolution with respect of those of units I and II. They are made of soft pyroclastic deposits, and are therefore very sensitive to erosion. All along the eastern coast of the island, it is possible to observe coastal cliffs affected by severe badland and gully erosion phenomena. Moreover, in most cases, the gully profiles are “hanging” over the cliffs, testifying to a very high rate of cliff retreat.
4. Results
The worst-case sub-Plinian eruption scenario is made of moderate precursory seismic shaking (Mw 5.2) and the subsequent ash fallout. It was developed through the elaboration of three thematic maps respectively for the susceptibility in static and the seismic conditions and the ashfall mobilization.
The susceptibility in static conditions represents the benchmark on which the considered scenario was built. It was made following the approach described in Section 3, while the calculated FR for each class of the considered parameters are summarized in Table 2.
The classes adopted for the susceptibility map (static case) were based on the approach proposed by [61,62]. The cumulative density function (cdf) of LSI is compared with the cdf of the areas affected by landslides. A sudden increase in the landslide cdf curve represents a threshold value that might be set as a limit between susceptibility classes.
Thus, in order to obtain a validation of the performance of the susceptibility assessment, ROC (receiver operating characteristic) curve analysis was carried out. The area under curve (AUC) is the parameter that gives an indication of the predictive capability, it varies between 0.5 (random model) and 1 (fully predictive model). In the case proposed for this study, it is equal to 0.77 (Figure 4).
Following this validation tool, a model with an AUC value higher than 0.7 provides a fair estimate of the landslide triggering susceptibility. Generally, landslides triggering could be affected by many factors, which also depend on the local geological and geomorphological setting. These could be sources of uncertainty and variability, which is further affected by the lack of landslide typology distinction. The method adopted in this paper attempts to provide a general landslide susceptibility, which is strongly dependent on the choice and the number of factors identified as predisposing. An improvement of the predictions could be achieved through an advanced statistical treatment of the data. Nevertheless, the results of this simplified analysis found positive feedback with the geological observation made during the field surveys and the high-risk areas identified by [23,24,25].
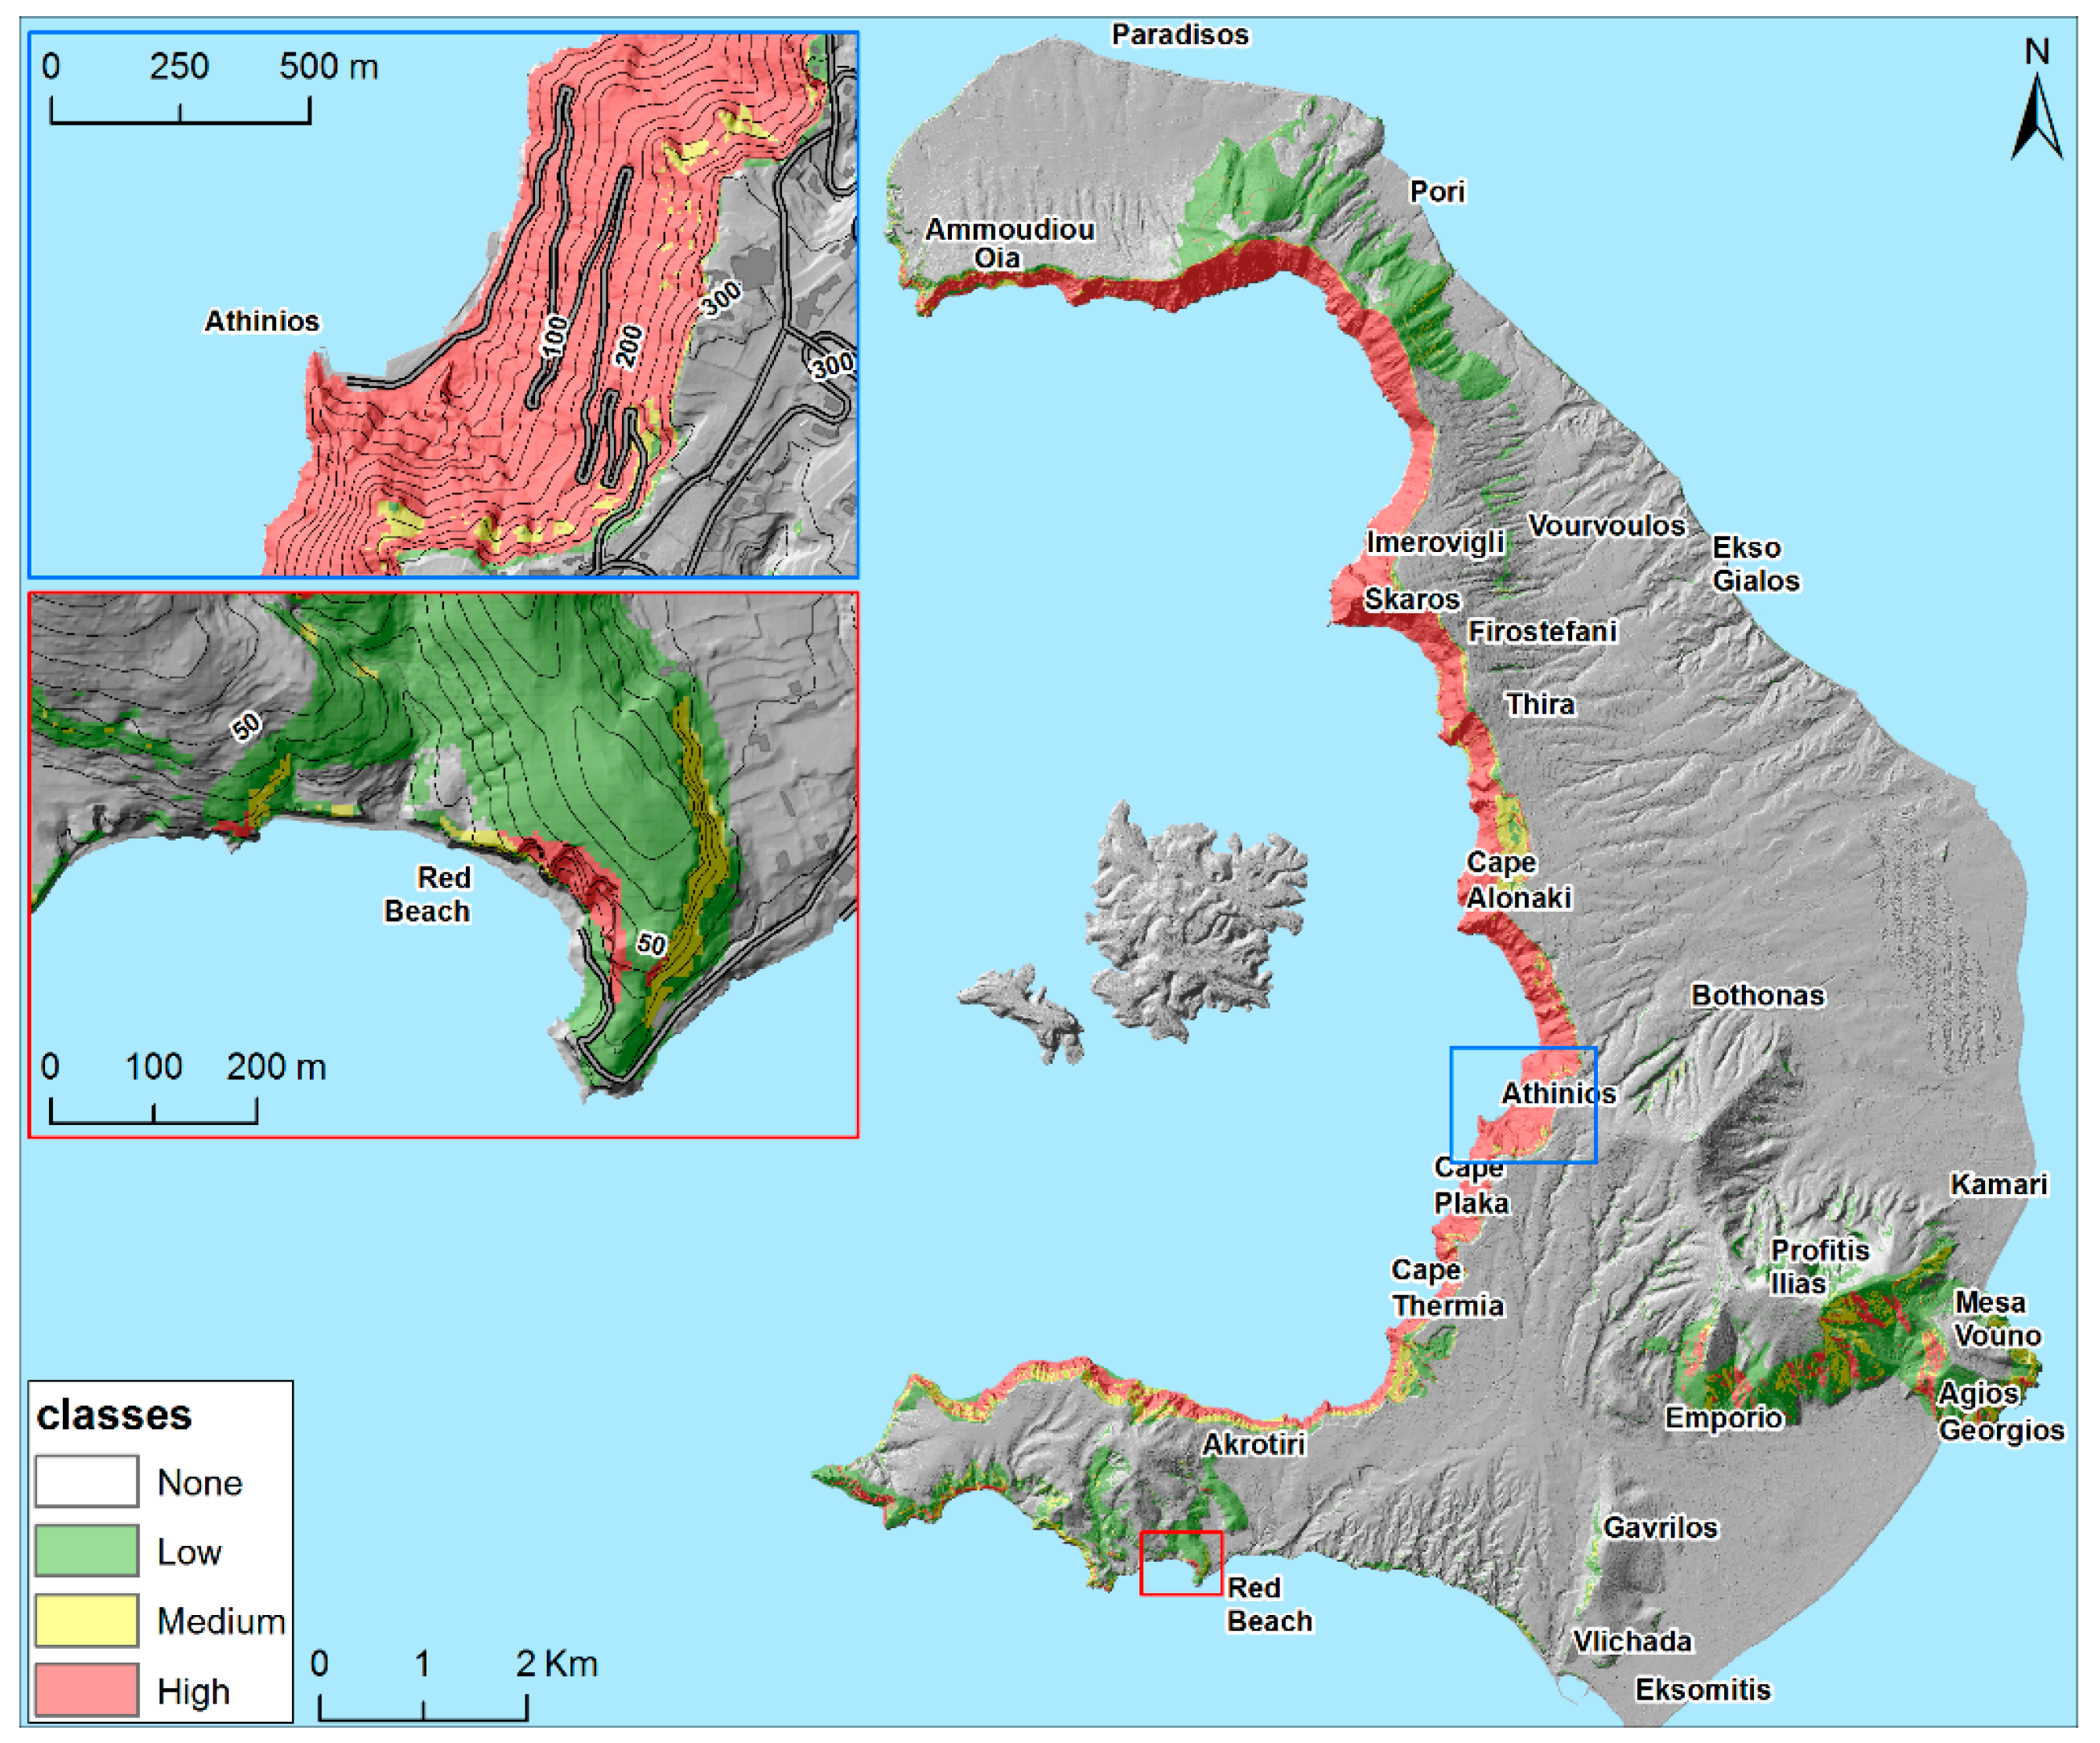
The map in Figure 5 shows a low susceptibility for the southeastern sector (MGU I), as no debris flow was identified, and few areas are characterized by high susceptibility due to rockfalls, as the carbonates are fractured and affected by faults. The inner rim (MGU II) in the western area is mainly characterized by high susceptibility. It is made of a complex interbedding of volcanic sequences, with considerable strength contrasts between soft and hard rocks, which result in a step-like morphology due to morphoselection. Furthermore, the slopes are also very steep, and evidence of past landslide events can be observed. In this unit, several strategic infrastructures and tourist points are located, i.e., Oia docks, Thira and Athinios harbors, Oia and Akrotiri desalination plants, and some pocket beaches. The outer slopes (MGU III) are made of lavas that are characterized by a variable degree of fracturing and slope angles. In the northern area, low susceptibility prevails; by contrast, in the southern area, all the classes are represented, the low is dominant, while the high susceptibility is found for the famous Red Beach, which is highly frequented by tourists in summer. Conversely, low or no susceptibility is found where gradients are low on watersheds and flat areas, due to the outcrop of Minoan tuff, which constitutes the MGU IV.
The slope stability map in seismic conditions in terms of displacements (u), obtained as discussed in Section 3.2, is reported in Figure 6. The values obtained were grouped into four classes, respectively between 0–2 cm, 2–10 cm, 10–50 cm, and higher than 50 cm, the ranges used in the map may correspond to the limit states for vulnerability assessment specified by [43]. The distribution of values is strongly related to the seismic acceleration and its amplifications. The latter spans from 0.5 g mainly due to topographic amplification effects to 0.2 g in the areas farther away from the epicenter. The displacements (u) show that the most critical areas are those of the inner rim of the caldera (MGU II), with the highest displacement class (> 50 cm) between Skaros and Athinios, which are closer to the epicenter, characterized by the higher slope angles and presence of soft rocks. Conversely, the gentle areas and the carbonate slopes have respectively no displacements or little ones (0–2 cm).
The ashfall distribution from the sub-Plinian eruption scenario in the Nea Kameni volcano is eastward oriented along the dominant winds, as shown in Figure 7 [59]. The contours display thickness values starting from a minimum of 5 cm to a maximum of 50 cm; the highest values are located close to the eruptive center, and do not reach Thira Island. The results of the potential ashfall mobilization are strongly conditioned by ash distribution and thickness. Generally, the highest values are found in a central sector of the inner rim (MGU II), between Cape Alonaki and Athinios.
5. Discussion
As highlighted in the preceding sections, the island of Thira (Santorini) represents the remnant of a more extensive volcanic system of which only the easternmost part of the caldera is preserved. Nevertheless, the area is still active, as demonstrated by the seismic unrest occurring between January 2011 and April 2012. The presence of active volcanic activity on the island cannot be neglected. It led to the study of the slope stability during pre-eruptive and post-eruptive stages, as represented by seismic shaking (Mw 5.2 earthquake) and ash fallout, which could also be responsible for triggering landslides.
In the previous sections, the methods, the adopted data, and the results of the three susceptibility studies for the static conditions, seismic conditions, and ash remobilization after the eruption were reported. The worst-case scenario is made of three thematic maps linked to cascading; however, they could also be considered independent of each other in the sense that they could occur at different times. Hence, it was decided to report in Figure 8 the highest grades of susceptibility for the three analyzed phenomena. The reported sketches also account for the hot spots (red circles), where the strategic structures are located, and are therefore to be considered more critical, while in Figure 9, the picture of the hot spots is shown.
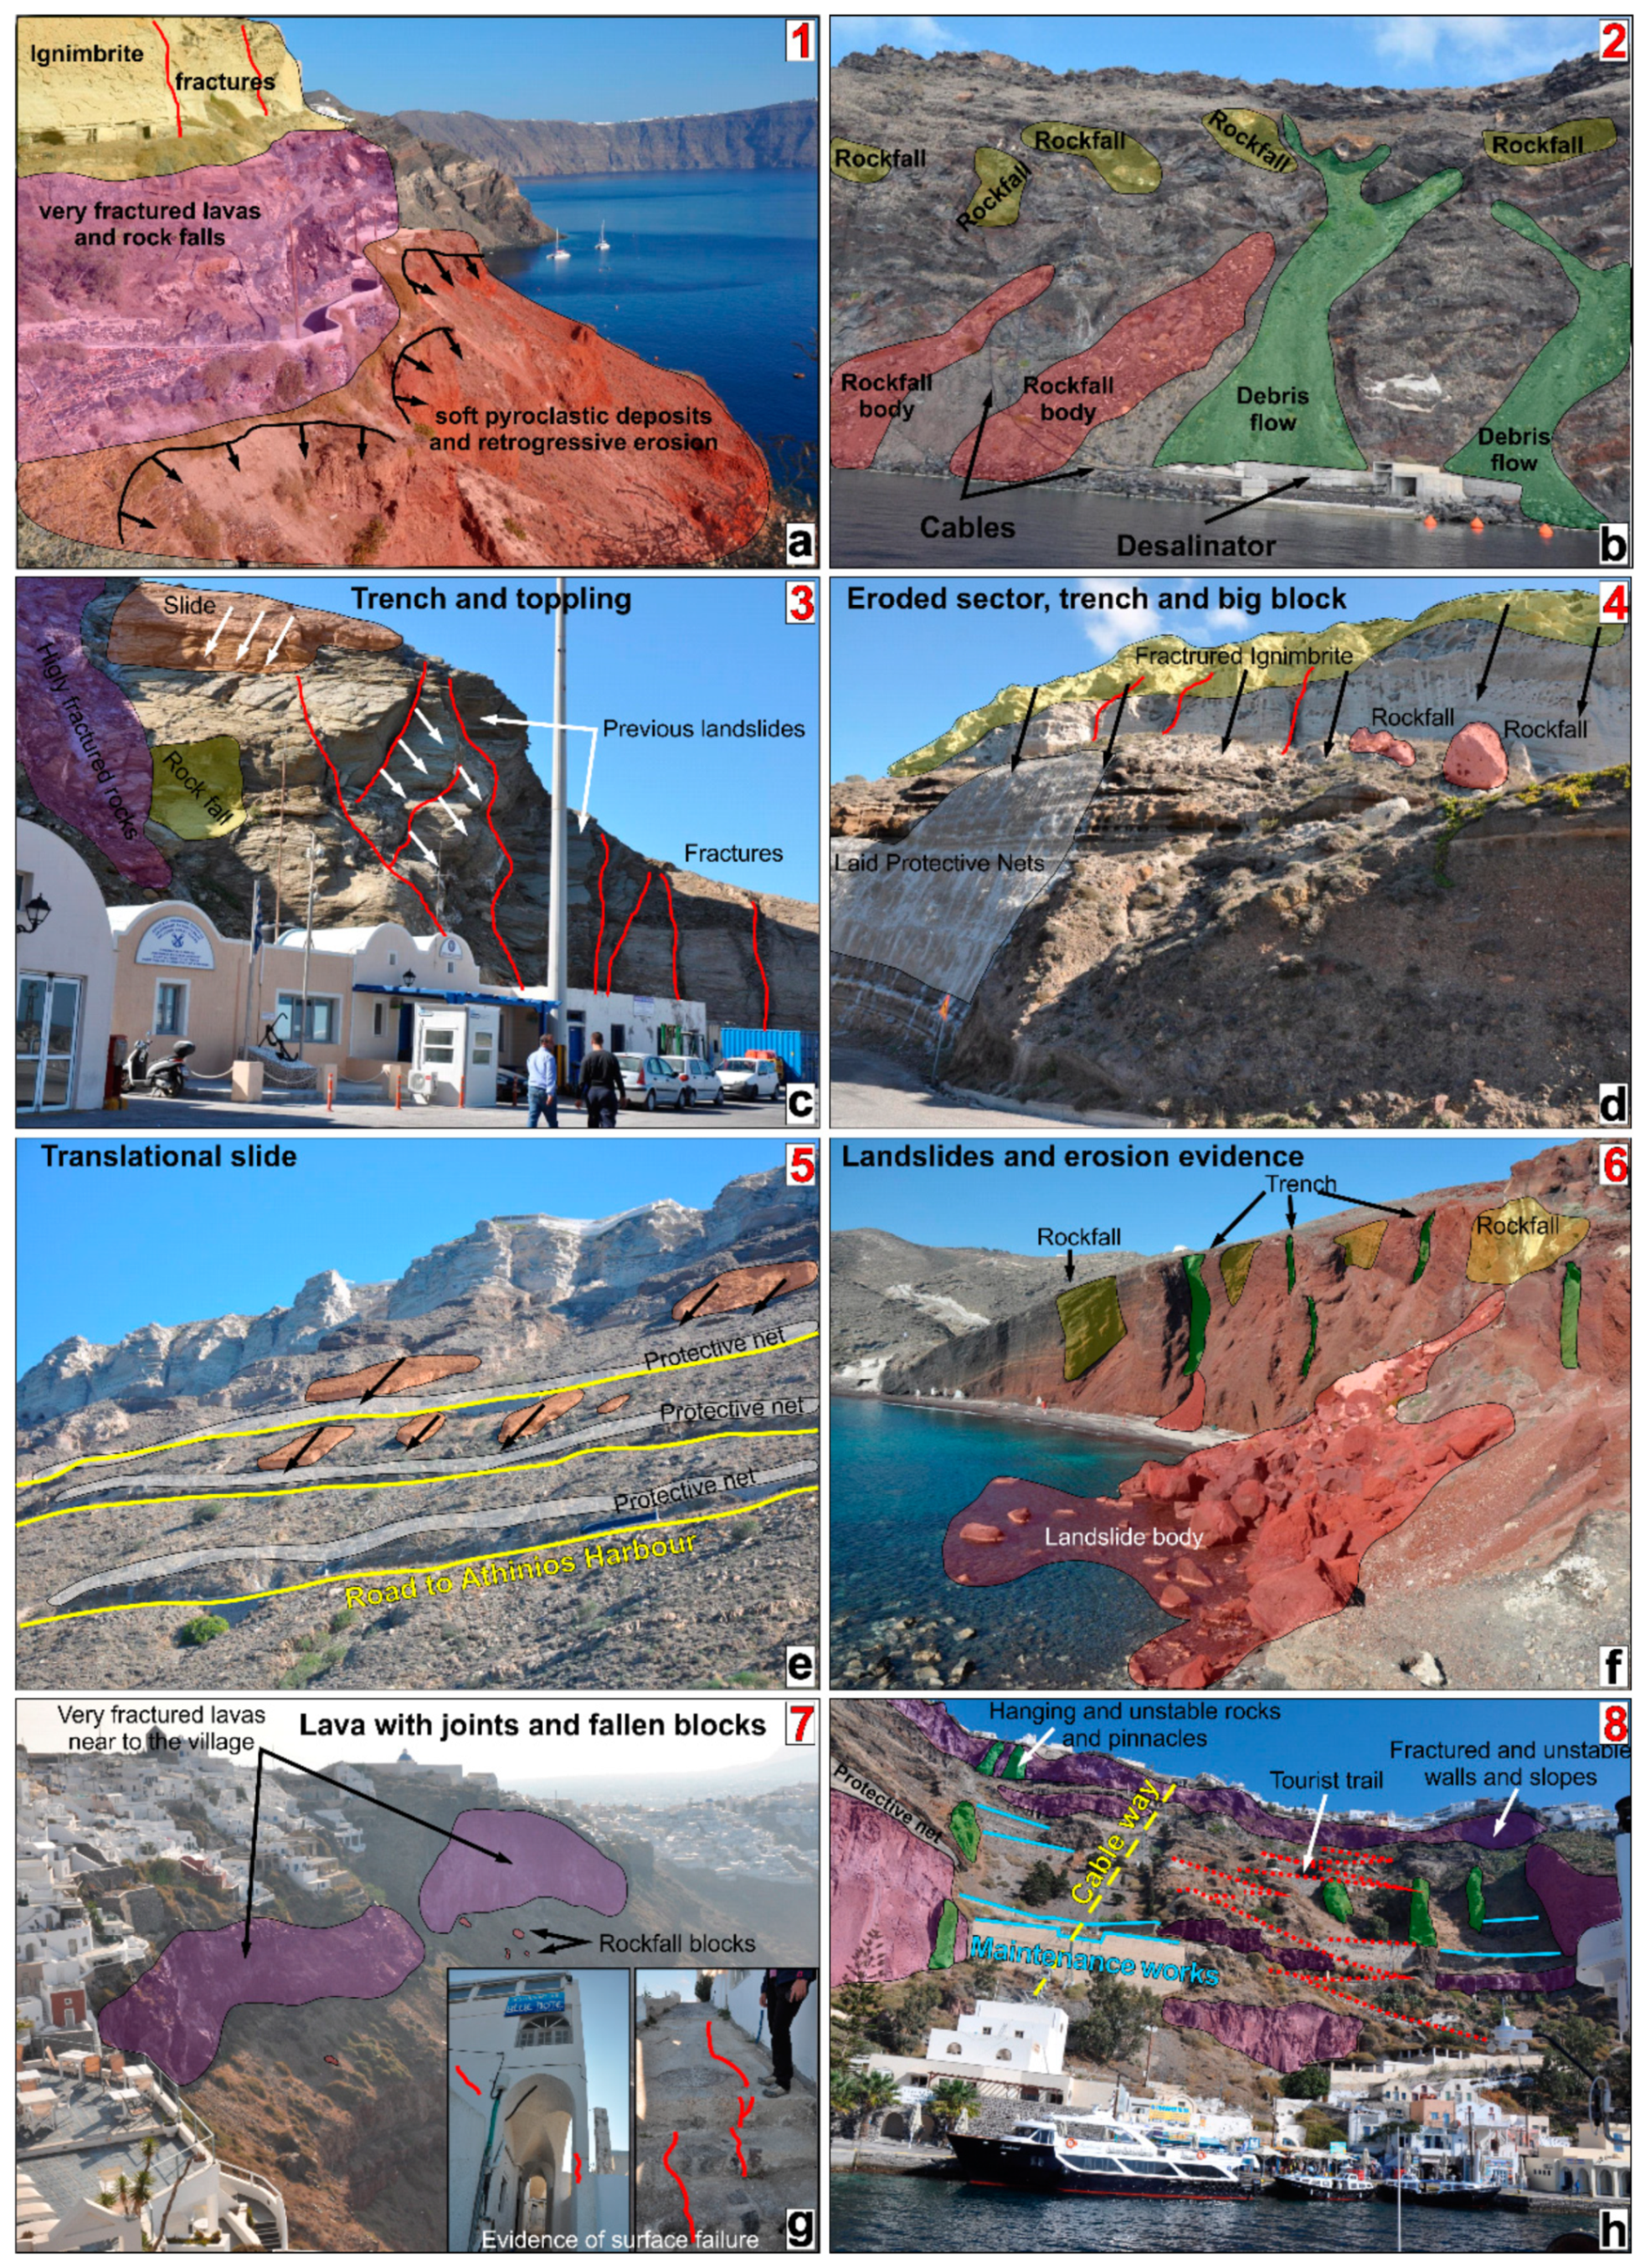
Figure 8a identifies very high landslide susceptibility for the cliffs over the harbors and the desalinization plant. In the area, soft pyroclastic deposits are overlaid by fractured lavas and white ignimbrites that are highly susceptible to rockfalls, which can affect the underlying road where maintenance work (protective nets and block barriers) has not been carried out. Furthermore, the soft red pyroclastic soils cropping out on the road toward the small harbor of Oia showed evidence of retrogressive movements (see Figure 9a). One of the most important strategic infrastructures that could be affected by landslides is the desalination plant (Figure 9b). The area also experiences displacement values in the range of 10–50 cm (see again Figure 6), which could be critical for landslide triggering following an earthquake, with consequent cable breakage and an interruption of the drinking water supply for this sector of the island.
Figure 8b reports the area characterized by the highest grade of susceptibility for the three events. Indeed, the slopes above Athinios harbor are unstable in static condition; in fact, they are affected by rockfalls, rockslides, and topples (Figure 9c–e). This is due to the geological setting made of lava interbedded with pyroclastic deposits, resting on 30°–35° slopes in metamorphic rocks. In the upper part of the slopes, wide fractures can be found in both white ignimbrite and metamorphic bedrock, which can trigger large topples, more than 10 m3, as testified by several blocks present on the road (Figure 9d). The inner rim of the caldera also has the highest values of displacements (u), closest to the most likely epicenter and to the volcanic vent. It is also located within the dispersion axis of the ashfall (see Figure 7), but the highest degree of potential ashfall mobilization affects the cliff without involving strategic infrastructures.
In the southern part of Thira, very critical areas can be found, e.g., the famous Red Beach (Figure 8c) is located at the base of a 30-m cliff made of lava and scoriae, and the trail to the beach crosses a large landslide body made of large blocks (up to thousands of m3). Despite the presence of warning signs, the beach is especially popular and attracts large numbers of visitors every summer (see Figure 9f).
Figure 8d represents the area close to the active Kameni seismic line; in fact, the town of Imerovigli above the Skaros cliff is in a critical condition, as evidenced by several fractures on buildings and walls (see Figure 9g). They could be associated with retrogressive movements related to the presence of fractured lavas resting on erodible scoriae. The seismic slope stability map results in displacement values as high as 50 cm, which is also due to the topographic conditions, and could locally increase seismic shaking. Indeed, the town and neighboring area was severely affected by volcanic earthquakes in historical times (1650, 1701, 1866), which also triggered a large rockfall. In Figure 9h, a detail of the critical area of Thira harbor is shown, which is one of the most important tourist attractions. Indeed, the area was affected in 2012 by a rockfall (around 0.5 m3), which impacted and destroyed part of the lower station building, leading to the execution of extensive maintenance work.
6. Conclusions
The European FP7 project SNOWBALL (2014–2017) considered the island of Santorini as a case study to validate a procedure for the assessment of possible multiple cascading effects caused by volcanic eruptions. Assuming the worst-case scenario of a sub-Plinian eruption, this study provided several insights about the approach adopted to characterize slope stability for SNOWBALL.
In the scenario provided, the most susceptible area is the inner rim of the caldera, as it is characterized by steep slopes and soft rocks, and it is close to the volcanic center (Nea Kameni) and the active Kameni tectonic line. The steep slope conditions and the soft rocks permit slope modeling processes on both the inner and outer rims of the caldera. Rockfalls and debris flow are the dominant processes of the inner rim, with the deposits reaching the coastline. Conversely, on the outer side, linear erosion phenomena (rills and gullies) and areal (badlands and sea cliff retrogression) occur, due to less steep slopes, except for the coastal stretch with its outcrops of soft rocks, where extensive coastal stretches are characterized by active cliffs. It is generally the western sector of the island that displays the most critical features for slope stability, which is probably due to the intense daily/hourly rainfall. High tourist flows increase the risk for both the harbor areas and along many paths and roads downstream of the main slopes. This is confirmed by the numerous works of maintenance such as barriers, nets, and retaining walls, which are nevertheless insufficient for the considerable extent of the critical areas.
In the event of an earthquake, the ground accelerations could trigger seismic-induced landslides in the western sector of the island and in the central sector between Skaros and Athinios. The most affected areas could be the harbors and the respective access roads.
Following a volcanic ashfall event, hypothesizing the direction of the prevailing winds, i.e., easterly, the affected areas would only be on the western side, and especially in the stretch between Cape Alonaki and Athinios. In this sector, the greater thickness of ash (30–40 cm) and the presence of high slope angles and some deep gullies would favour the ash mobilization.
The worst-case scenario accounts for three phenomena, which could be linked to cascading or could be considered independent of each other in the sense that they could occur at different times. For this reason, it was decided to show the sectors with the highest susceptibility and the hot spot areas in the final scenario map.
The findings of this study provide detailed and useful information for the development of volcanic and seismic emergency plans. Indeed, the thematic maps can provide local, state, and regional officials with state-of-the-art decision support tools for estimating potential losses and enable stakeholders to develop strategies for reducing the risk, which consider, at a local level, the assessment of the impacts of possible cascade effects. Furthermore, the approach in question could be used for other areas where multi-hazard scenarios occur.
Author Contributions
Conceptualization, G.F., M.D.F., and A.S.; Funding acquisition, A.S.; Methodology, G.F. and M.D.F.; Supervision, N.S. and A.S.; Writing—original draft, G.F. and M.D.F.; Writing—review and editing, G.F., M.D.F., and N.S.
Funding
“This research was funded by the European Project SNOWBALL ‘Lower the impact of aggravating factors in crisis situations thanks to adaptive foresight and decision-support tools’ “FP7/2007-2013, Grant Agreement no. 606742”.
Acknowledgments
The authors acknowledge the project coordinator Giulio Zuccaro for promoting and inspiring the research activities.
Conflicts of Interest
The authors declare no conflict of interest.
References
- van Westen, C.J.; Kappes, M.S.; Luna, B.Q.; Frigerio, S.; Glade, T.; Malet, J.P. Medium-Scale Multi-hazard Risk Assessment of Gravitational Processes. In Mountain Risks: From Prediction to Management and Governance. Advances in Natural and Technological Hazards Research; Van Asch, T., Corominas, J., Greiving, S., Malet, J.P., Sterlacchini, S., Eds.; Springer: Dordrecht, The Netherland, 2014; Volume 34. [Google Scholar]
- Marzocchi, W.; Mastellone, M.; Di Ruocco, A. Principles of Multi-Risk Assessment: Interactions amongst Natural and Man-Induced Risks; Project Report; European Commission: Brussels, Belgium, 2009; printed in Luxembourg and coordinated by Doppiavoce, Napoli (Italy). [Google Scholar]
- Zuccaro, G.; Leone, M. Volcanic Crisis Management and Mitigation Strategies: A Multi-Risk Framework Case Study. Earthzine. 2011. Available online: https://earthzine.org/2011/03/21/volcanic-crisis-management-and-mitigation-strategies-a-multi-risk-framework-case-study/ (accessed on 20 September 2019).
- Fan, X.; Scaringi, G.; Korup, O.; West, A.J.J.; van Westen, C.; Tanyas, H.; Hovius, N.; Hales, T.C.; Jibson, R.W.; Allstadt, K.E.; et al. Earthquake-induced chains of geologic hazards: Patterns, mechanisms, and impacts. Rev. Geophys. 2019, 57, 421–503. [Google Scholar] [CrossRef]
- Gill, J.C.; Malamud, B.D. Reviewing and visualizing the interactions of natural hazards. Rev. Geophys. 2014, 52, 680–722. [Google Scholar] [CrossRef] [Green Version]
- Gill, J.C.; Malamud, B.D. Hazard interactions and interaction networks (cascades) within multi-hazard methodologies. Earth Syst. Dyn. 2016, 7, 659–679. [Google Scholar] [CrossRef] [Green Version]
- NIBS (National Institute of Building Science). Earthquake loss estimation methodology. In HAZUS Technical Manual; FEMA: Washington, DC, USA, 2004. [Google Scholar]
- Kappes, M.S.; Gruber, K.; Frigerio, S.; Bell, R.; Keiler, M.; Glade, T. The MultiRISK platform: The technical concept and application of a regional-scale multihazard exposure analysis tool. Geomorphology 2012, 151, 139–155. [Google Scholar] [CrossRef]
- Forzieri, G.; Feyen, L.; Russo, S.; Vousdoukas, M.; Alfieri, L.; Outten, S.; Migliavacca, M.; Bianchi, A.; Rojas, R.; Cid, A. Multi-hazard assessment in Europe under climate change. Clim. Chang. 2016, 137, 105–119. [Google Scholar] [CrossRef] [Green Version]
- Junttila, K.; Zuccaro, G.; De Gregorio, D.; Leone, M.F. D7.2: Report on Simulation. The Results of the Crisis Simulations in Finland, Poland and Greece (Santorini Reference Test Case). Deliverable of SNOWBALL FP7 EU-Project ‘Lower the Impact of Aggravating Factors in Crisis Situations Thanks to Adaptive Foresight and Decision-Support Tools’. 2017. Available online: https://cordis.europa.eu/project/rcn/185475/reporting/en (accessed on 16 July 2019).
- Papastamatiou, I. The age of crystalline limestones of Thira. Bull. Geol. Soc. Greece 1958, 3, 104–113. [Google Scholar]
- Tataris, A. The Metamorphic basement (Holocene) of Thira. Bull. Geol. Soc. Greece 1965, 6, 232–238. [Google Scholar]
- Druitt, T.H.; Mellors, R.A.; Pyle, D.M.; Sparks, R.S.J. Explosive volcanism on Santorini, Greece. Geol. Mag. 1989, 126, 95–126. [Google Scholar] [CrossRef]
- Druitt, T.H.; Edwards, L.; Mellors, R.M.; Pyle, D.M.; Sparks, R.S.J.; Lanphere, M.; Davies, M.; Barriero, B. Santorini Volcano; Memoir N. 19; Geological Society of London: London, UK, 1999; p. 165. [Google Scholar]
- Vespa, M.; Keller, J.; Gertisser, R. Interplinian explosive activity of Santorini volcano (Greece) during the past 150,000 years. J. Volcanol. Geotherm. Res. 2006, 153, 262–286. [Google Scholar] [CrossRef]
- McCoy, F.W.; Heiken, G. Tsunami generated by the Late Bronze Age Eruption of Thera (Santorini), Greece. Pure Appl. Geophys. 2000, 157, 1227–1256. [Google Scholar] [CrossRef]
- Vougioukalakis, G.E.; Fytikas, M. Volcanic Hazards in the Aegean Area, Relative Risk Evaluation, Monitoring and Present State of the Active Volcanic Centers, in The South Aegean Active Volcanic Arc, Development in Volcanology; Fytikas, M., Vougioukalakis, G.E., Eds.; Elsevier: Amsterdam, The Netherlands, 2005; Volume 7, pp. 161–183. [Google Scholar]
- Gertisser, R.; Preece, K.; Keller, J. The Plinian Lower Pumice 2 eruption, Santorini, Greece: Magma evolution and volatile behaviour. J. Volcanol. Geotherm. Res. 2009, 186, 387–406. [Google Scholar] [CrossRef]
- Fabbro, G.; Druitt, T.H.; Scaillet, S. Evolution of the crustal magma plumbing system during the build-up to the 22-ka caldera-forming eruption of Santorini (Greece). Bull. Volcanol. 2013, 75, 767. [Google Scholar] [CrossRef]
- Friedrich, W.L.; Kromer, B.; Friedrich, M.; Heinemeier, J.; Pfeiffer, T.; Talamo, S. Santorini eruption radiocarbon dated to 1627–1600 B.C. Science 2006, 312, 548. [Google Scholar] [CrossRef] [PubMed]
- Druitt, T.H. New insights into the initiation and venting of the Bronze-Age eruption of Santorini, from component analysis. Bull. Volcanol. 2014, 76, 794. [Google Scholar] [CrossRef]
- Rizzo, A.L.; Barberi, F.; Carapezza, M.L.; Di Piazza, A.; Francalanci, L.; Sortino, F.; D’Alessandro, W. New mafic magma refilling a quiescent volcano: Evidence from He-Ne-Ar isotopes during the 2011–2012 unrest at Santorini, Greece. Geochem. Geophys. Geosyst. 2015, 16, 798–814. [Google Scholar] [CrossRef]
- Antoniou, V.; Lappas, S.; Leoussis, C.; Nomikou, P. Landslide Risk Assessment of the Santorini Volcanic Group. In Proceedings of the 3rd International Conference on Geographical Information Systems Theory, Applications and Management (GISTAM 2017), Porto, Portugal, 27–28 April 2017; pp. 131–141. [Google Scholar]
- Lekkas, E. Landslide hazard and risk in geologically active areas. The case of the caldera of Santorini (Thira) volcano island complex (Greece). In Proceedings of the 7th Asian Regional Conference for IAEG (International Association for Engineering Geology), Chengdu, China, 9–11 September 2009; pp. 417–423. [Google Scholar]
- Antoniou, A.A.; Lekkas, E. Rockfall susceptibility map for Athinios port, Santorini Island, Greece. Geomorphology 2010, 118, 152–166. [Google Scholar] [CrossRef]
- Reichenbach, P.; Rossi, M.; Malamud, B.D.; Mihir, M.; Guzzetti, F. A review of statistically-based landslide susceptibility models. Earth Sci. Rev. 2018, 180, 60–91. [Google Scholar] [CrossRef]
- Brabb, E.E. Innovative approaches to landslide hazard and risk mapping. In Proceedings of the 4th International Symposium on Landslides, Toronto, ON, Canada, 16–21 September 1984; Volume 1, pp. 307–323. [Google Scholar]
- Varnes, D.J. Landslide hazard zonation: A review of principles and practice. UNESCO, Paris. Nat. Hazard Ser. 1984, 3, 63. [Google Scholar]
- Aleotti, P.; Chowdhury, R. Landslide hazard assessment: Summary review and new perspectives. Bull. Eng. Geol. Environ. 1999, 58, 21–44. [Google Scholar] [CrossRef]
- Dai, F.C.; Lee, C.F.; Ngai, Y.Y. Landslide risk assessment and management: An overview. Eng. Geol. 2002, 64, 65–87. [Google Scholar] [CrossRef]
- van Westen, C.J. Geo-information tools for landslide risk assessment: An overview of recent developments. In Landslides Evaluation and Stabilization; Lacerda, W.A., Ehrlich, M., Fountoura, S.A.B., Sayao, A.S.F., Eds.; Balkema: Rotterdam, The Netherland, 2004; pp. 39–56. [Google Scholar]
- Corominas, J.; van Westen, C.; Frattini, P.; Cascini, L.; Malet, J.P.; Fotopoulou, S.; Catani, F.; van den Eeckhaut, M.; Mavrouli, O.; Agliardi, F.; et al. Recommendations for the quantitative analysis of landslide risk. Bull. Eng. Geol. Environ. 2014, 73, 209–263. [Google Scholar] [CrossRef]
- Lee, S.; Talib, J.A. Probabilistic landslide susceptibility and factor effect analysis. Environ. Geol. 2005, 47, 982–990. [Google Scholar] [CrossRef]
- Yilmaz, I. Landslides susceptibility mapping using frequency ratio, logistic regression, artificial neural networks and their comparison: A case study from Kat landslides (Tokat, Turkey). Comput. Geosci. 2009, 35, 1125–1138. [Google Scholar] [CrossRef]
- Yan, F.; Zhang, Q.; Ye, S.; Ren, B. A novel hybrid approach for landslide susceptibility mapping integrating analytical hierarchy process and normalized frequency ratio methods with cloud model. Geomorphology 2019, 327, 170–187. [Google Scholar] [CrossRef]
- CLC (Corine Land Cover). 2018. Available online: https://land.copernicus.eu/pan-european/corine-land-cover/clc2018 (accessed on 16 July 2019).
- Adams, N.M.; Hand, D.J. Comparing classifiers when the misallocations costs are uncertain. Pattern Recogn. 1999, 32, 1139–1147. [Google Scholar] [CrossRef]
- Provost, F.; Fawcett, T. Analysis and visualization of classifier performance: Comparison under imprecise class and cost distributions. In Proceedings of the Third International Conference on Knowledge Discovery and Data Mining, AAAI, Menlo Park, CA, USA, 14–17 August 1997; pp. 43–48. [Google Scholar]
- Miles, S.B.; Ho, C.L. Rigorous landslide hazard zonation using Newmark’s method and stochastic ground motion simulation. Soil Dyn. Earthq. Eng. 1999, 18, 305–323. [Google Scholar] [CrossRef]
- Jibson, R.W. Methods for assessing the stability of slopes during earthquakes—A retrospective. Eng. Geol. 2011, 122, 43–50. [Google Scholar] [CrossRef]
- d’Onofrio, A.; Mastrangelo, A.; Penna, A.; Santo, A.; Silvestri, F. Seismic risk analysis of buried pipelines: The case of L’Aquila gas network. Rivista Italiana Geotecnica 2013, 47, 65–86. [Google Scholar]
- Forte, G.; Fabbrocino, S.; Santucci de Magistris, F.; Silvestri, F. Seismic permanent ground deformations: Earthquake-triggered landslides in Molise Apennines. Rendiconti Online Della Società Geologica Italiana 2013, 24, 134–136. [Google Scholar]
- Silvestri, F.; Forte, G.; Calvello, M. Multi-level approach for zonation of seismic slope stability: Experiences and perspectives in Italy. In Landslides and Engineered Slopes. Experience, Theory and Practice; Aversa, S., Cascini, L., Picarelli, L., Scavia, C., Eds.; Associazione Geotecnica Italiana: Rome, Italy, 2016. [Google Scholar]
- Caccavale, M.; Matano, F.; Sacchi, M. An integrated approach to earthquake-induced landslide hazard zoning based on probabilistic seismic scenario for Phlegrean Islands (Ischia, Procida and Vivara), Italy. Geomorphology 2017, 295, 235–259. [Google Scholar] [CrossRef]
- Newmark, N.M. Effects of earthquakes on dams and embankments. Géotechnique 1965, 15, 139–160. [Google Scholar] [CrossRef]
- Ambraseys, N.; Srbulov, M. Earthquake induced displacement of slopes. Soil Dyn. Earthq. Eng. 1995, 14, 59–71. [Google Scholar] [CrossRef]
- Ausilio, E.; Silvestri, F.; Troncone, A.; Tropeano, G. Seismic displacement analysis of homogeneous slopes: A review of existing simplified methods with reference to Italian seismicity. In Proceedings of the IV International Conference on Earthquake Geotechnical Engineering, Thessaloniki, Greece, 25–28 June 2007; p. 1614. [Google Scholar]
- Bray, J.D.; Rathje, E.M. Earthquake-induced displacements of solid–waste landfills. J. Geotech. Geoenviron. Eng. 1998, 124, 242–253. [Google Scholar] [CrossRef]
- Rampello, S.; Callisto, L.; Fargnoli, P. Valutazione del coefficiente sismico equivalente. In Report of Task 6.3 ‘Slope stability’; Internal Research Reports; ReLUIS Consortium: Rieti, Italy, 2006; pp. 23–38. (In Italian) [Google Scholar]
- Tropeano, G.; Silvestri, F.; Ausilio, E. An uncoupled procedure for performance assessment of slopes in seismic conditions. Bull. Earthq. Eng. 2017, 15, 3611–3637. [Google Scholar] [CrossRef] [Green Version]
- Papazachos, C. Annex II Earthquakes in Santorini. 127–194. In D7.2: Report on Simulation. The Results of the Crisis Simulations in Finland, Poland and Greece (Santorini Reference Test Case); Junttila, K., Zuccaro, G., De Gregorio, D., Leone, M.F., Eds.; Deliverable of SNOWBALL FP7 EU-project ‘Lower the impact of aggravating factors in crisis situations thanks to adaptive foresight and decision-support tools’; 2017. [Google Scholar]
- Code, P. Eurocode 8: Design of Structures for Earthquake Resistance—Part 1: General Rules, Seismic Actions and Rules for Buildings; CEN European Committee for Standardization: Brussels, Belgium, 2005. [Google Scholar]
- Frattini, P.; Crosta, G.; Fusi, N.; Dal Negro, P. Shallow landslides in pyroclastic soils: A distributed modelling approach for hazard assessment. Eng. Geol. 2004, 73, 277–295. [Google Scholar] [CrossRef]
- Hungr, O.; Evans, S.G.; Bovis, M.J.; Hutchinson, J.N. A review of the classification of landslides of the flow type. Environ. Eng. Geosci. 2001, 7, 221–238. [Google Scholar] [CrossRef]
- Mead, S.; Magill, C.; Hilton, J. Rain-triggered lahar susceptibility using a shallow landslide and surface erosion model. Geomorphology 2016, 273, 168–177. [Google Scholar] [CrossRef]
- De Vita, P.; Agrello, D.; Ambrosino, F. Landslide susceptibility assessment in ash-fall pyroclastic deposits surrounding Mount Somma-Vesuvius: Application of geophysical surveys for soil thickness mapping. J. Appl. Geophys. 2006, 59, 126–139. [Google Scholar] [CrossRef]
- De Vita, P.; Napolitano, E.; Godt, J.W.; Baum, R.L. Deterministic estimation of hydrological thresholds for shallow landslide initiation and slope stability models: Case study from the Somma-Vesuvius area of southern Italy. Landslides 2013, 10, 713–728. [Google Scholar] [CrossRef]
- Jenkins, S.F.; Barsotti, S.; Hincks, T.K.; Neri, A.; Phillips, J.C.; Sparks, R.S.J.; Sheldrake, T.; Vougioukalakis, G. Rapid emergency assessment of ash and gas hazard for future eruptions at Santorini Volcano, Greece. J. Appl. Volcanol. 2015, 4, 16. [Google Scholar] [CrossRef]
- Druitt, T.H.; Francaviglia, V. Caldera formation on Santorini and the physiography of the islands in the late Bronze Age. Bull. Volcanol. 1992, 54, 484–493. [Google Scholar] [CrossRef]
- Lipman, P.W. Caldera-collapse breccias in the western San Juan Mountains, Colorado. Geol. Soc. Am. Bull. 1976, 87, 1397–1410. [Google Scholar] [CrossRef]
- Ermini, L.; Catani, F.; Casagli, N. Artificial neural networks applied to landslide susceptibility assessment. Geomorphology 2005, 66, 327–343. [Google Scholar] [CrossRef]
- Catani, F.; Casagli, N.; Ermini, L.; Righini, G.; Menduni, G. Landslide hazard and risk mapping at catchment scale in the Arno River basin. Landslides 2005, 2, 329–342. [Google Scholar] [CrossRef]
Figure 1.
(a) Location of Cyclades Islands and Santorini (Greece). (b) Geodynamic and volcanological setting (modified after [19]) keys: (1) Active volcanoes; (2) Caldera boundary; (3) Tectonic lines; (4) Kameni Island volcanoes (197 B.C.–1950 A.D.); (5) Minoan tuff formation; (6) Skaros volcanic complex; (7) Thirasia volcanic complex; (8) Peristeria volcanic complex; (9) Megalo Vouno volcanic complex; (10) Akrotiri volcanic complex; (11) Pre-volcanic bedrock (Trias–Eocene).

Figure 2.
(a) Geolithological map after [11]; (b) Inventory of landslides; (c) Slope angle map; (d) Aspect map derived from 1 x 1 m digital elevation model (DTM).
Figure 2.
(a) Geolithological map after [11]; (b) Inventory of landslides; (c) Slope angle map; (d) Aspect map derived from 1 x 1 m digital elevation model (DTM).

Figure 3.
(a) Corine Land Cover (2018); the legend codes are reported in Table 2. (b) Geomorphological map of Thira Island: (1) Caldera rim; (2) Volcanic cone; (3) High cliff on hard/soft interbedded pyroclastic rocks; (4) High cliff on limestone bedrock; (5) Low cliff (<10 m) on soft pyroclastic rocks close to a beach; (6) Low cliff (>10 m) on soft pyroclastic rocks close to a beach; (7) Flat coast (beach); (8) Marine terrace; (9) Down-cutting gully; (10) Main stream; (11) Footslope area; (12) Alluvial fan and fan deltas; (13) Structural slope; (14) Triangular facet; (15) Quarry.

Figure 4.
Receiver operating characteristic (ROC) curve and area under the curve (AUC) value for the validation of the susceptibility.
Figure 4.
Receiver operating characteristic (ROC) curve and area under the curve (AUC) value for the validation of the susceptibility.

Figure 5.
Landslide susceptibility map in static conditions for Thira Island.

Figure 6.
Seismic displacements (u) map for Thira Island.

Figure 7.
Potential ashfall mobilization map. Contour values by [59].
Figure 7.
Potential ashfall mobilization map. Contour values by [59].

Figure 8.
Details of the highest susceptibility areas for the three phenomena (see Section 4) and main critical areas (red circles, which are representative of the pictures shown in Figure 9). (a) Oia docks and desalinization plant; (b) Athinios harbor and its road; (c) Red beach; (d) Thira and Imerovigli.

Figure 9.
Images representing the most critical areas due to active or potential landslide triggering (location in Figure 8). (a) Cliffs over Oia; (b) Cliffs over desalinization plant; (c–e) Cliffs over Athinios; (f) Red Beach; (g) Skaros Cliff; (h) Thira harbor.
Figure 9.
Images representing the most critical areas due to active or potential landslide triggering (location in Figure 8). (a) Cliffs over Oia; (b) Cliffs over desalinization plant; (c–e) Cliffs over Athinios; (f) Red Beach; (g) Skaros Cliff; (h) Thira harbor.


Table 1.
HAZUS seismic susceptibility classes (modified after [7]).
Table 1.
HAZUS seismic susceptibility classes (modified after [7]).
| DRY CONDITIONS (Groundwater Table Below the Sliding Surface) | ||||||
|---|---|---|---|---|---|---|
| Geolithological Group | Slope Angle (Degrees) | |||||
| 0–10 | 10–15 | 15–20 | 20–30 | 30–40 | >40 | |
| A | None | None | 0.6 | 0.5 | 0.35 | 0.25 |
| B | None | 0.4 | 0.35 | 0.3 | 0.25 | 0.2 |
| C | 0.3 | 0.25 | 0.2 | 0.1 | 0.1 | 0.1 |
Table 2.
Frequency ratio (FR) values of predisposing factors for landslides susceptibility.
| Factor | Class | N° of Pixels in Factor Class | Factor Class (%) | N° of Landslides Pixels within the Factor Class | Landslides (%) | FR |
|---|---|---|---|---|---|---|
| Lithology (HAZUS class) | Lavas (B) | 379,352 | 11.80 | 1758 | 50.21 | 4.26 |
| Tuff (B) | 2,512,417 | 78.12 | 649 | 18.54 | 0.24 | |
| Metamorphic rocks (B) | 21,475 | 0.67 | 229 | 6.54 | 9.80 | |
| Carbonates (A) | 195,486 | 6.08 | 7 | 0.20 | 0.03 | |
| Pyroclastic deposits (B) | 64,631 | 2.01 | 752 | 21.48 | 10.69 | |
| Sandy beach (C) | 23,865 | 0.74 | 0 | 0.00 | 0.00 | |
| Debris (C) | 18,898 | 0.59 | 106 | 3.03 | 5.15 | |
| SLOPE Angle (Degree) | 0–10 | 1,756,692 | 54.44 | 8 | 0.23 | 0.00 |
| 10–15 | 435,677 | 13.50 | 20 | 0.57 | 0.04 | |
| 15–20 | 276,025 | 8.55 | 26 | 0.74 | 0.09 | |
| 20–30 | 335,243 | 10.39 | 132 | 3.77 | 0.36 | |
| 30–40 | 252,708 | 7.83 | 853 | 24.35 | 3.11 | |
| >40 | 170,201 | 5.28 | 2464 | 70.34 | 13.33 | |
| Aspect | flat | 139,041 | 4.31 | 0 | 0 | 0.00 |
| North | 191,437 | 5.93 | 226 | 6.45 | 1.09 | |
| Northeast | 540,487 | 16.75 | 149 | 4.25 | 0.25 | |
| East | 555,459 | 17.22 | 60 | 1.71 | 0.10 | |
| Southeast | 463,310 | 14.36 | 169 | 4.82 | 0.34 | |
| South | 330,241 | 10.24 | 786 | 22.44 | 2.19 | |
| Southwest | 297,117 | 9.21 | 763 | 21.78 | 2.37 | |
| West | 255,385 | 7.92 | 721 | 20.58 | 2.60 | |
| Northwest | 265,937 | 8.24 | 432 | 12.33 | 1.50 | |
| North | 188,138 | 5.83 | 197 | 5.62 | 0.96 | |
| MGU | Structural (MGU I) | 391,226 | 13.33 | 20 | 0.57 | 0.04 |
| Inner slope (MGU II) | 252,953 | 8.62 | 3134 | 89.49 | 10.38 | |
| Outer slope (20°–35°) (MGU III) | 347,456 | 11.84 | 307 | 8.77 | 0.74 | |
| Outer (slope < 20°) (MGU IV) | 1,943,575 | 66.22 | 41 | 1.17 | 0.02 | |
| Land Cover (CLC) | (111) Continuous urban fabric | 13,083 | 0.41 | 9 | 0.25 | 0.62 |
| (112) Discontinuous urban fabric | 390,992 | 12.26 | 81 | 2.29 | 0.19 | |
| (124) Airports | 69,214 | 2.17 | 0 | 0.00 | 0.00 | |
| (131) Mineral extraction sites | 10,156 | 0.32 | 22 | 0.62 | 1.95 | |
| (142) Sport and leisure facilities | 103,711 | 3.25 | 72 | 2.04 | 0.63 | |
| (211) Non-irrigated arable land | 22,685 | 0.71 | 0 | 0.00 | 0.00 | |
| (221) Vineyards | 562,301 | 17.63 | 20 | 0.57 | 0.03 | |
| (231) Pastures | 72,841 | 2.28 | 6 | 0.17 | 0.07 | |
| (242) Complex cultivation pattern | 936,460 | 29.37 | 62 | 1.75 | 0.06 | |
| (243) Land occupied by agriculture and natural vegetation | 287,800 | 9.02 | 38 | 1.08 | 0.12 | |
| (321) Natural grassland | 111,591 | 3.50 | 0 | 0.00 | 0.00 | |
| (323) Sclerophyllous vegetation | 118,459 | 3.71 | 154 | 4.36 | 1.17 | |
| (332) Bare rocks | 260,516 | 8.17 | 1855 | 52.49 | 6.43 | |
| (333) Sparsely vegetated area | 229,139 | 7.19 | 1215 | 34.38 | 4.78 |
© 2019 by the authors. Licensee MDPI, Basel, Switzerland. This article is an open access article distributed under the terms and conditions of the Creative Commons Attribution (CC BY) license (http://creativecommons.org/licenses/by/4.0/).
Share and Cite
MDPI and ACS Style
Forte, G.; De Falco, M.; Santangelo, N.; Santo, A. Slope Stability in a Multi-Hazard Eruption Scenario (Santorini, Greece). Geosciences 2019, 9, 412. https://0-doi-org.brum.beds.ac.uk/10.3390/geosciences9100412
AMA Style
Forte G, De Falco M, Santangelo N, Santo A. Slope Stability in a Multi-Hazard Eruption Scenario (Santorini, Greece). Geosciences. 2019; 9(10):412. https://0-doi-org.brum.beds.ac.uk/10.3390/geosciences9100412
Chicago/Turabian StyleForte, Giovanni, Melania De Falco, Nicoletta Santangelo, and Antonio Santo. 2019. "Slope Stability in a Multi-Hazard Eruption Scenario (Santorini, Greece)" Geosciences 9, no. 10: 412. https://0-doi-org.brum.beds.ac.uk/10.3390/geosciences9100412
Note that from the first issue of 2016, this journal uses article numbers instead of page numbers. See further details here.