Article

Effect of Communication Regarding Dam Operation on the Evacuation of Residents: A Case Study of the 2018 Inundation of the Hijikawa River in Japan

1
Faculty of Sociology, Toyo University, Tokyo 112-8606, Japan
2
Faculty of Humanities, Matsuyama University, Matsuyama Ehime 790-8578, Japan
*
Author to whom correspondence should be addressed.
Submission received: 27 August 2019 / Revised: 8 October 2019 / Accepted: 15 October 2019 / Published: 18 October 2019
(This article belongs to the Special Issue Flood Frequency and Inundation Modelling)

Abstract

:
Communication on the operation of a dam is crucial in evacuating residents before downstream flooding occurs. This paper examines the effect of communication regarding dam operation on evacuation, studying the case of the 2018 flooding of the Hijikawa River in Japan. After confirming the communication process and the messages of warning, we conducted a questionnaire survey of affected residents. The findings of the survey are as follows. (1) The discharge warnings issued by dam operators had no effect, because few people heard the warnings and even those who heard them were not inclined to evacuate. (2) Accepting the notifications from dam operators, local governments issued evacuation instructions. These instructions promoted evacuation. The most effective trigger of evacuation was route alerting by the volunteer fire corps. Information from dam operators induced the issuing of evacuation instructions, which activated the route alerting, and the information therefore indirectly promoted evacuation. (3) The Public Warning System operating on mobile phones had a certain effect in disseminating evacuation instructions where the system was used. (4) The messages issued here had insufficient specificity and clarity. A flood simulation considering the discharge flow of a dam needs to be conducted in addressing this issue.

1. Introduction

In July 2018, wet air from the south generated heavy rainfall in western Japan. In the city of Seiyo, rainfall registered 347 millimeters per 24 h (JMA, 2018) [
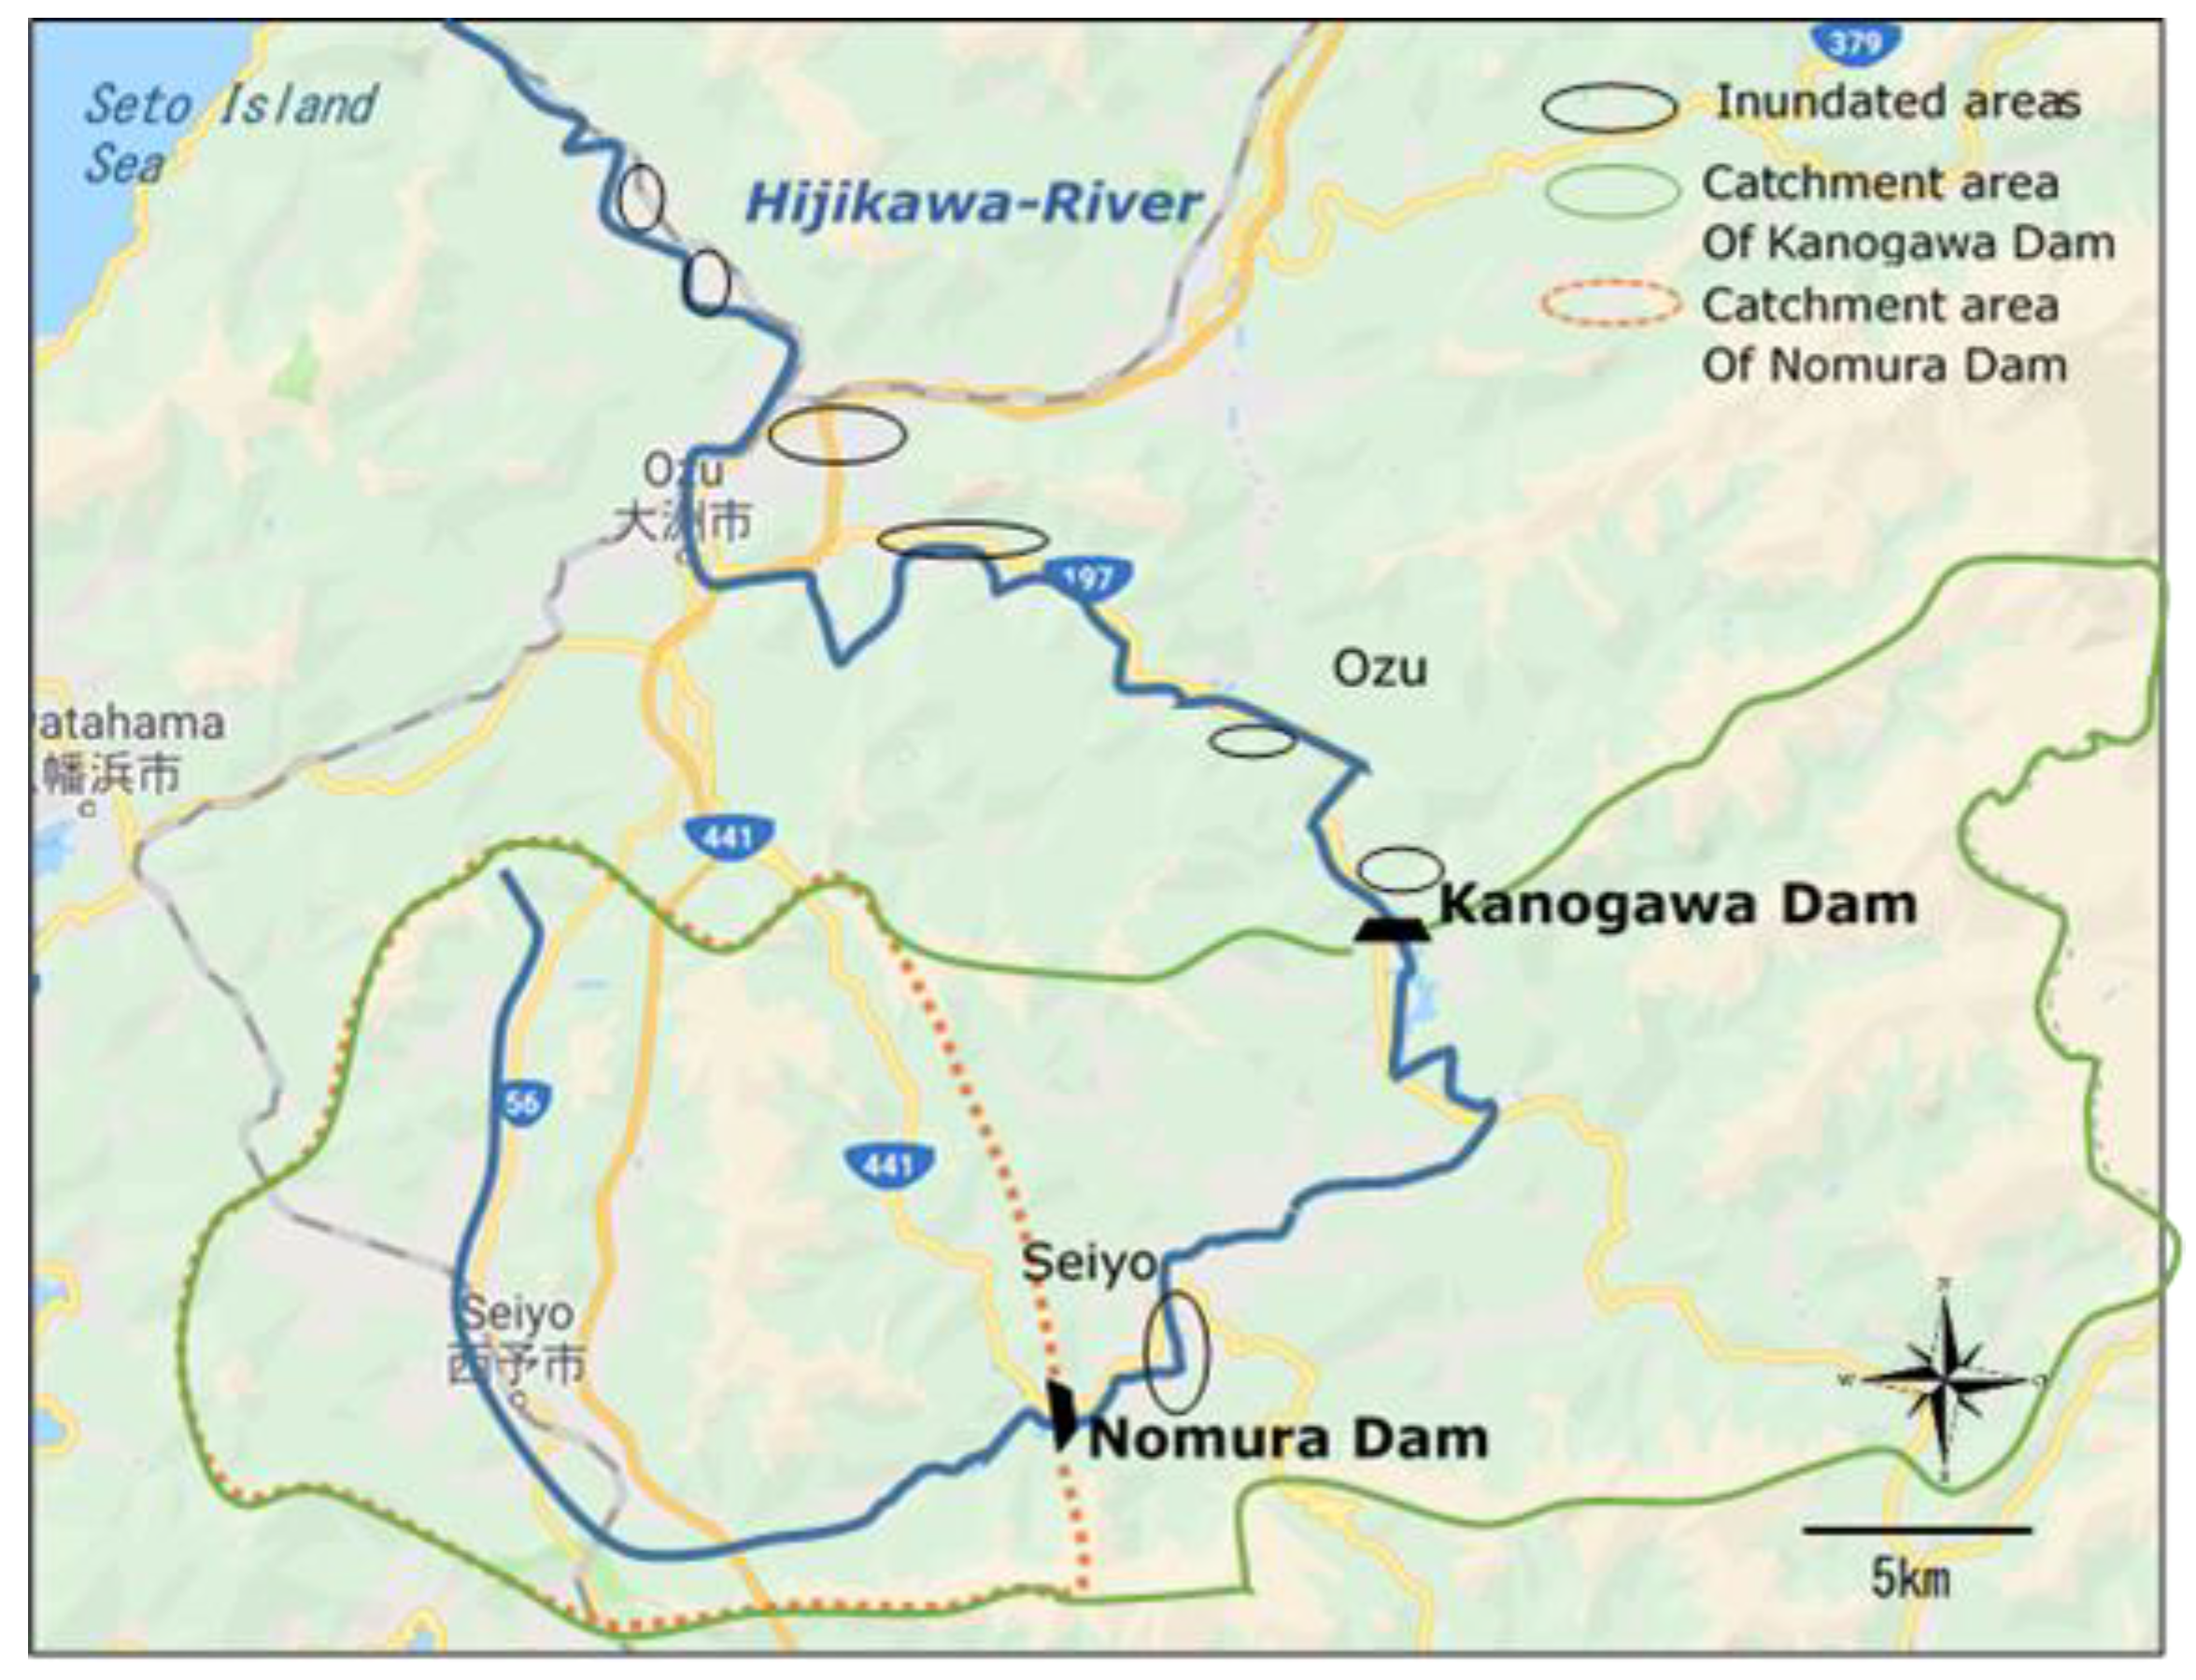
1]. Inundation in the Hijikawa River Basin of Ehime Prefecture killed nine people (Ehime Prefecture, 2018) [2]. The inundation began soon after a discharge operation of two dams on the Hijikawa River.
Communication on the operation of a dam is crucial in evacuating residents before downstream flooding occurs because the release of a dam suddenly raises the river level.
This paper examines the functions of and problems relating to information provided by dam operators for the evacuation of residents during the July 2018 flooding of the Hijikawa River. We investigate what types of warnings were issued by dam operators and emergency managers of local government, in which channels those warnings were sent, and how residents reacted to the warnings.
The population’s response to warnings is a main theme in the field of the sociology of disasters and has been well researched (e.g., Dabek, 1986 [3]; Perry, 1994 [4]). Quarantellit (1982) [5], for example, pointed out three elements of the warning process: assessment, dissemination, and response. Furthermore, Mileti and Sorensen (1990) [6] conceptualized the warning response process as hearing, understanding, believing, personalizing, deciding and responding, and confirming. Moreover, Sorensen and Sorensen (2006) [7] summarized the results of research conducted in the United States on factors that affect the responses of people. They cited the residents’ knowledge of hazards, personal warning channels, frequency of warnings, message consistency, message certainty, and source credibility as factors that promote evacuation. Additionally, several empirical studies were conducted in Europe (e.g., Parker et al. 2009) [8]. Those studies, like the present study, are interested in the effects of warnings and we can learn much from them.
However, warnings can now be sent through newly emerging media. The Public Warning System (PWS), in the case of mobile phones, allows warnings to be sent directly and with geo-targeting. In Japan, the PWS (which began as the Cell Broadcast Service) has been used to send disaster warnings since 2007. Although the PWS has been experimentally and conceptually studied (e.g., Jagtman, 2010 [9]; Beanet et al., 2015 [10]; National Academies of Sciences, 2018 [11]), the role of the PWS in actual disaster situations has not been sufficiently investigated.
Meanwhile, although case studies of dam failures have been investigated (e.g., Wayne et al., 2008 [12]), few publications have analyzed the warnings of discharges of dams (e.g., Katada and Kuwasawa, 2009 [13]). There is some literature, such as dam operation manuals and textbooks (e.g., Water Resources Environment Center [14], 2004; United Nations, 2008 [15]). There is also a guidebook (Mileti and Sorensen, 2015 [16]) for dam operators that is based on studies of the sociology of disasters. One report (Yoshii, et al. 2007 [17]) describes the attitude of emergency managers and residents toward warnings of dam discharge.
Moreover, floods due to dam discharge are similar to flash floods in that the river level rises rapidly. Gruntfest (1977 [18]), for example, conducted a sociological study on the relationship between warnings and evacuations in the event of flash floods. Furthermore, with development of weather forecasting technology, advanced flash-flood early-warning systems have been developed (Carpenter et al., 1999 [19]; Georgakakos, et al., 2006 [20]; Liu, et al. 2018 [21]). However, dam discharge floods differ from flash floods in that warnings are issued by the dam operators who trigger the floods.
It is therefore important to investigate the residents’ reactions toward warnings of the 2018 flooding of the Hijikawa River as a case study of an actual disaster.

2. Materials and Methods

2.1. Investigation Area

The Hijikawa River is 103 km long and has a catchment area of 1210 km2. It has two dams: The Nomura Dam in Seiyo located upstream and the Kanogawa Dam in Ozu located in the middle basin (Figure 1 and Figure 2). The effective capacity of the Nomura Dam is 12,700,000 m3 while that of the Kanogawa Dam is 29,800,000 m3 (Figure 3). In July 2018, about 8000 people lived in Nomura District of Seiyo and about 43,000 people lived in Ozu. During the flooding disaster of July 2018, 70 ha of land and 650 houses were inundated below the Nomura Dam and 925 ha of land and 3053 houses were inundated below the Kanogawa Dam (MLIT, a [22]). Hijikawa River also flooded in 1995, 2004, 2005 and 2011 (MLIT, 2012 [23]).

2.2. Dam Information and Routes of Communication with Residents

In the case of the July 2018 flood, the most important information provided by the dam operators was information on the “Flood Control Operation for Extreme Floods (FCOEF)”. The FCOEF is an operation that increases the discharge flow rate to the inflow rate by operating the gate according to the stored water level when the stored water level is predicted to exceed the surcharge water level (MLIT [24]). The surcharge water level is the highest level of water that can be temporarily stored in a reservoir during a flood. It is set slightly lower than the maximum water level at which the dam does not break. The amount of inflow into the dam is calculated from the temporal change in the reservoir level. The discharge flow rate is determined by the angle at which the gate is opened. The discharge flow during FCOEF is increased and decreased over time according to the amount of inflow.
The FCOEF starts when a certain water level (approximately 80% of the capacity to control flooding) is exceeded. To predict the start time and the amount of discharge during FCOEF, the amount of rain that has fallen across the catchment area and the future predicted value are used.
When the FCOEF starts, the dam begins to lose the capacity to store more water, and when the water reaches the surcharge level, the dam loses completely its capacity to store more water. Although the FCOEF does not necessarily mean an overtopping of the dam or dam failure, large releases after the FCOEF often cause inundation. In heavy rainfall during July 2018, for example, eight dams in Japan carried out FCOEF and there were inundation disasters downstream of three of these dams. FCOEF was conducted 40 times in the 10 years from 2008 to 2017 in Japan (Yomiuri Shimbun 2018.7.12 [25]). There were large-scale floods with FCOEF in 2011, 2013, and 2014 in Japan. FCOEF was conducted for the Hijikawa River in 2004 and 2005 (Okamura et al., 2006 [26]).
Dam operators are regulated to notify local government and to alert residents before starting the FCOEF. A dam has three routes along which to communicate this information to residents: the direct route to residents, the route via local government, and the route via television and Internet websites. We here focus on the first and second routes because television channels did not notify residents of FCOEF for this flood and few residents saw the website that indicated FCOEF was about to occur.

2.3. Information Issued and Its Communication Channels

An investigation committee comprising the Japanese Ministry of Land, Infrastructure, Transport and Tourism (MLIT), local governments, and experts investigated this flood and published papers (MLIT a, b, c [22,27,28]). The papers provide the timeline (Table 1) and contents (Table 2 and Table 3) of the dam information communicated. At 2:30 a.m. on 7 July, the operation office of the Nomura Dam notified the city of Seiyo that an FCOEF was inevitable and the estimated start time of the FCOEF would be 6:50 a.m. The channel used here was a mobile phone carried by the executive officer of the local government. The phone line is referred to a hot line because it allows the dam operator to communicate with local government 24 h a day. Accepting the notification, the city decided at 3:30 a.m. to issue evacuation instructions to residents and did so at 5:10 a.m. (Table 3). The channels used here were indoor receivers of the Disaster Prevention Radio Broadcasting System (DRS) (Figure 4) and route alerting by volunteer fire corps (through house-to-house visits). Meanwhile, the dam operation office issued a warning (Table 2) to residents at 5:15 a.m. using sirens and loudspeakers (Figure 5) controlled by the dam office. About 1 h later, the dam operator started the FCOEF at 6:20 a.m.
The operation office of the Kanogawa Dam notified the city of Ozu of the possibility of an FCOEF at 5:50 a.m. using a hot line (Table 1). The dam office communicated a warning of FCOEF to residents at 6:18 a.m. using sirens and loudspeakers. The dam office then informed the city that the water level of the Hijikawa River would reach a historic high. The city issued evacuation instructions at 7:30 a.m. in response to the predicted water level of the river. The city communicated the warning by loudspeakers of the DRS (Figure 6) and route alerting by volunteer fire corps (through house-to-house visits). At 8:43 a.m., the city issued a warning via the PWS (Figure 7).
Originally, the word “alert” was the information that indicated danger while the word “warning” was used to indicate a protective action (the National Academic of Science, 2018 [11]). However, the actual information provided to residents on the flood included both words, and the words “warning” and “alert” are thus not distinguished in this paper.

2.4. Questionnaire Survey

A questionnaire survey was conducted with the residents to clarify how they received warnings sent by the dam operators and local government. The targets of survey were residents of temporary housing in Seiyo and Ozu, whose original houses were damaged by the flood (Table 4). The temporary housing was built by local governments and was provided free of charge for two years to residents whose houses were severely damaged by the disaster. Most applicants who applied for temporary housing were able to move into temporary housing. The residents surveyed in the present study were thus residents living in areas facing the highest flood risk. We focused on such residents, to achieve a good response rate with our limited financial resources and thus obtain useful results that will help in planning for future flooding events. The survey was conducted in February 2019. Although there were 74 temporary housings in Seiyo and 60 in Ozu at that time, the targeted households were 68 households in Seiyo and 53 households in Ozu, a total of 121 households, because there were some vacant houses and households damaged by landslides. Each household selected one person to be surveyed arbitrarily. There were thus 121 targets in our survey. We visited each house, asked for cooperation with the survey, and distributed the questionnaire. Responses were self-recorded and returned by mail. As a result, we received a total of 79 responses, 35 in Seiyo and 44 in Ozu. The overall response rate was 65.2% (51.5% in Seiyo and 83.0% in Ozu). The questionnaire was created on the basis of an unstructured interview survey conducted for four residents in July 2018.

3. Results

3.1. Discharge Warnings Issued by Dam Operators

As previously mentioned, the dam operators provided residents with advance notice of FCOEF. This was in line with dam operation manuals. However, only 33% of respondents reported that they had heard the discharge warning issued by the dam operator (Figure 8). One of the reasons is that loudspeakers were installed along the river regardless of the residential area (Figure 9). Hence, the warning of discharge was ineffective in the first stage of dissemination.
We next asked the 26 respondents who heard the discharge warning how they felt in response to the warning. Of those respondents, 62% responded “I thought the water flow was about the same level as usual” and 39% said “I could not hear well what was said” (Figure 10). Only 23% reported “I felt a sense of urgency”. Therefore, even a resident who heard the discharge warning was unlikely to have felt a sense of crisis.
We calculated the percentage of people who evacuated before the disaster according to whether or not they heard the discharge warning. The early evacuation rate for those who heard the discharge warning was 61% while the early evacuation rate for those who did not hear the discharge warning was almost the same, at 60%. This difference was not significant according to a chi-square test (p > 0.1). Therefore, the discharge warning was heard by few people, and even those who heard it were not encouraged to evacuate.

3.2. Evacuation Order Issued by Local Government

In Japan, an “evacuation recommendation” and “evacuation instructions (emergency)” are almost equivalent to an evacuation order. The latter is issued when the situation is more urgent, but neither is legally enforceable. After receiving information from the dam operators, local government issued evacuation instructions before flooding occurred. Forty-seven percent of respondents reported that they had heard the instructions (Figure 11). The hearing rate was slightly higher than that for the dam discharge information but still less than half the residents.
We asked the participants who heard the evacuation instructions how they felt at the time. Whereas 22% of respondents felt that there was some danger, 49% thought they had to evacuate (Figure 12). This is an interesting result showing that the dangers were not convincingly communicated and yet many people thought they had to evacuate.
We asked participants who heard the evacuation instructions how they heard them. Sixty percent of participants in Seiyo said they heard the evacuation instructions from “firefighters, police, or city officials” (Figure 13). This group would have included volunteer fire corps considering that the evacuation instructions were issued early in the morning and many members of the flood-fighting corps were working in the area. (In Japan, the volunteer fire corps also serve as flood-fighting corps). Furthermore, at this time, the headquarters of the volunteer fire corps asked members to visit each house to recommend residents to evacuate. The volunteer fire corps were thus the most effective channel through which evacuation instructions were communicated in Seiyo. In addition, 27% of respondents heard evacuation instructions via indoor receivers of the DRS, which were installed in almost all households in the Nomura area of Seiyo. In Ozu, 55% of respondents heard evacuation instructions via loudspeakers of the DRS, 41% via the PWS, and 41% via “firefighters, police, or city officials”. Although the local government in Seiyo did not use the PWS as they considered the PWS problematic, the PWS was useful in disseminating evacuation instructions in Ozu. However, it is strange that the PWS was not more effective than the loudspeakers. The reason for this result is not clear, but the delay in using the PWS is a potential factor.
We calculated the percentage of residents who evacuated before the disaster according to whether or not they heard the evacuation instructions. The evacuation rate was 77% for those who heard the evacuation instructions and 50% for those who did not hear the evacuation instructions. This difference is significant (p < 0.05) according to a Chi-squared test.
Furthermore, logistic regression analysis was adopted to calculate p values and odds ratios (95% confidence intervals) after controlling simultaneously for potential confounders. A dependent variable considered in the model was early evacuation (did: 1, did not: 0), and covariates were the hearing of discharge warning (yes: 1, no: 0), the hearing of evacuation instructions (yes: 1, no: 0), the recognition of flood risk to the home (yes: 1, no: 0), and city (Ozu: 1, Seiyo: 2). Various tests (i.e., the omnibus test, Cox–Snell R-square test, test of Hosmer and Lemeshow, and percentage of correct estimation test) indicate a high degree of model fit. As a result (Table 5), hearing evacuation instructions and the city were significantly related to early evacuation (p < 0.01). According to the odds ratio, those who heard the evacuation instructions were 7.8 times more likely to evacuate early while those who lived in Seiyo were 13 times more likely to evacuate early. However, hearing discharge warnings and recognizing the flood risk to the home had no significant relationship with early evacuation (p > 0.05). It is thus considered that evacuation instructions promoted early evacuation.

3.3. Evacuation Trigger and Effective Communication Channels

Fifty-eight percent of all respondents evacuated before their homes were damaged (Figure 14). The evacuation rate was particularly high (77%) in Seiyo; although less than half the respondents heard the dam discharge warning and the evacuation instructions were disseminated insufficiently, 77% of people evacuated early.
We asked respondents who evacuated before their home was damaged what triggered their evacuation. Most (61%) said the recommendation of firefighters and other officials present at the scene was the trigger (Figure 15). Other triggers were “I watched the river level rising” (33%), “I saw the area around my house flooded” (30%), and ”I was recommended to evacuate by family and neighbors” (30%). A recommendation by the volunteer fire corps was thus the most effective means to facilitate an evacuation. As the volunteer fire corps were organized by the city and started route alerting with evacuation instructions, the information provided by dam operators was used by local government to promote evacuation.
There is a difference in results between Seiyo and Ozu. Although 70% respondents reported the recommendation of firefighters and other officials present as a trigger in Seiyo, the percentage was only 47% in Ozu. Meanwhile, 68% of the respondents in Ozu said that their trigger was that “I saw the area around my house flooded”. This suggests that because the recommendation of volunteer fire corps was insufficient, the evacuation was delayed in Ozu. In fact, evacuation instructions were announced in Seiyo 1 h and 10 min before the FCOEF whereas the announcement was only 5 min before the FCOEF in Ozu, and the volunteer fire corps therefore did not have enough time to move around the district. In addition, according to Table 5, after controlling other variables, the probability of early evacuation in Seiyo is 13 times higher than that in Ozu. This difference can also be explained by the delay in issuing evacuation instructions in Ozu.
We calculated the percentage of people who evacuated early according to the channels through which evacuation instructions were heard. The early evacuation rate was 88% for respondents who heard evacuation instructions from “firefighters and other officials” present but only 56% for respondents who did not hear it from them. The difference is significant according to a Chi-squared test (p < 0.05).
In addition, we adopted logistic regression analysis to determine the channels effective in promoting early evacuation. The dependent variable considered in the model was early evacuation (did: 1, did not: 0) while covariates were the hearing of the discharge warning (yes: 1, no: 0), the seven channels through which residents heard evacuation instructions (yes: 1, no: 0), the recognition of flood risk to the home (yes: 1, no: 0), and the city (Ozu: 1, Seiyo: 2). The goodness of fit for this model was adequate according to the tests. As a result, among the channels through which evacuation instructions were issued, only the channel of being told by a firefighter, police officer or other official was significant for the model (p < 0.05), and its odds rate was 11.2 (Table 6). Although the odds rate of receiving evacuation instructions via an indoor receiver was extremely high, as few (i.e., only four) residents used this channel, the p value did not show significance (p > 0.05). These data show that the recommendation of volunteer fire corps was effective.
Furthermore, to investigate the duplication effect of communication, we examined the overlap of the three most used channels through which evacuation instructions were heard; i.e., the DRS (loudspeaker), PWS, and firefighter/police officer/official. A Venn diagram (Figure 16) shows the percentage of early evacuation rate for residents in each category. It is seen that, when the DRS (loudspeaker) and PWS were used, the early evacuation rate was slightly higher. However, in the case of the firefighter/police officer/official channel, the use of an additional channel did not increase the evacuation rate. Notification by a firefighter/police officer/official alone thus promoted early evacuation.

4. Discussion

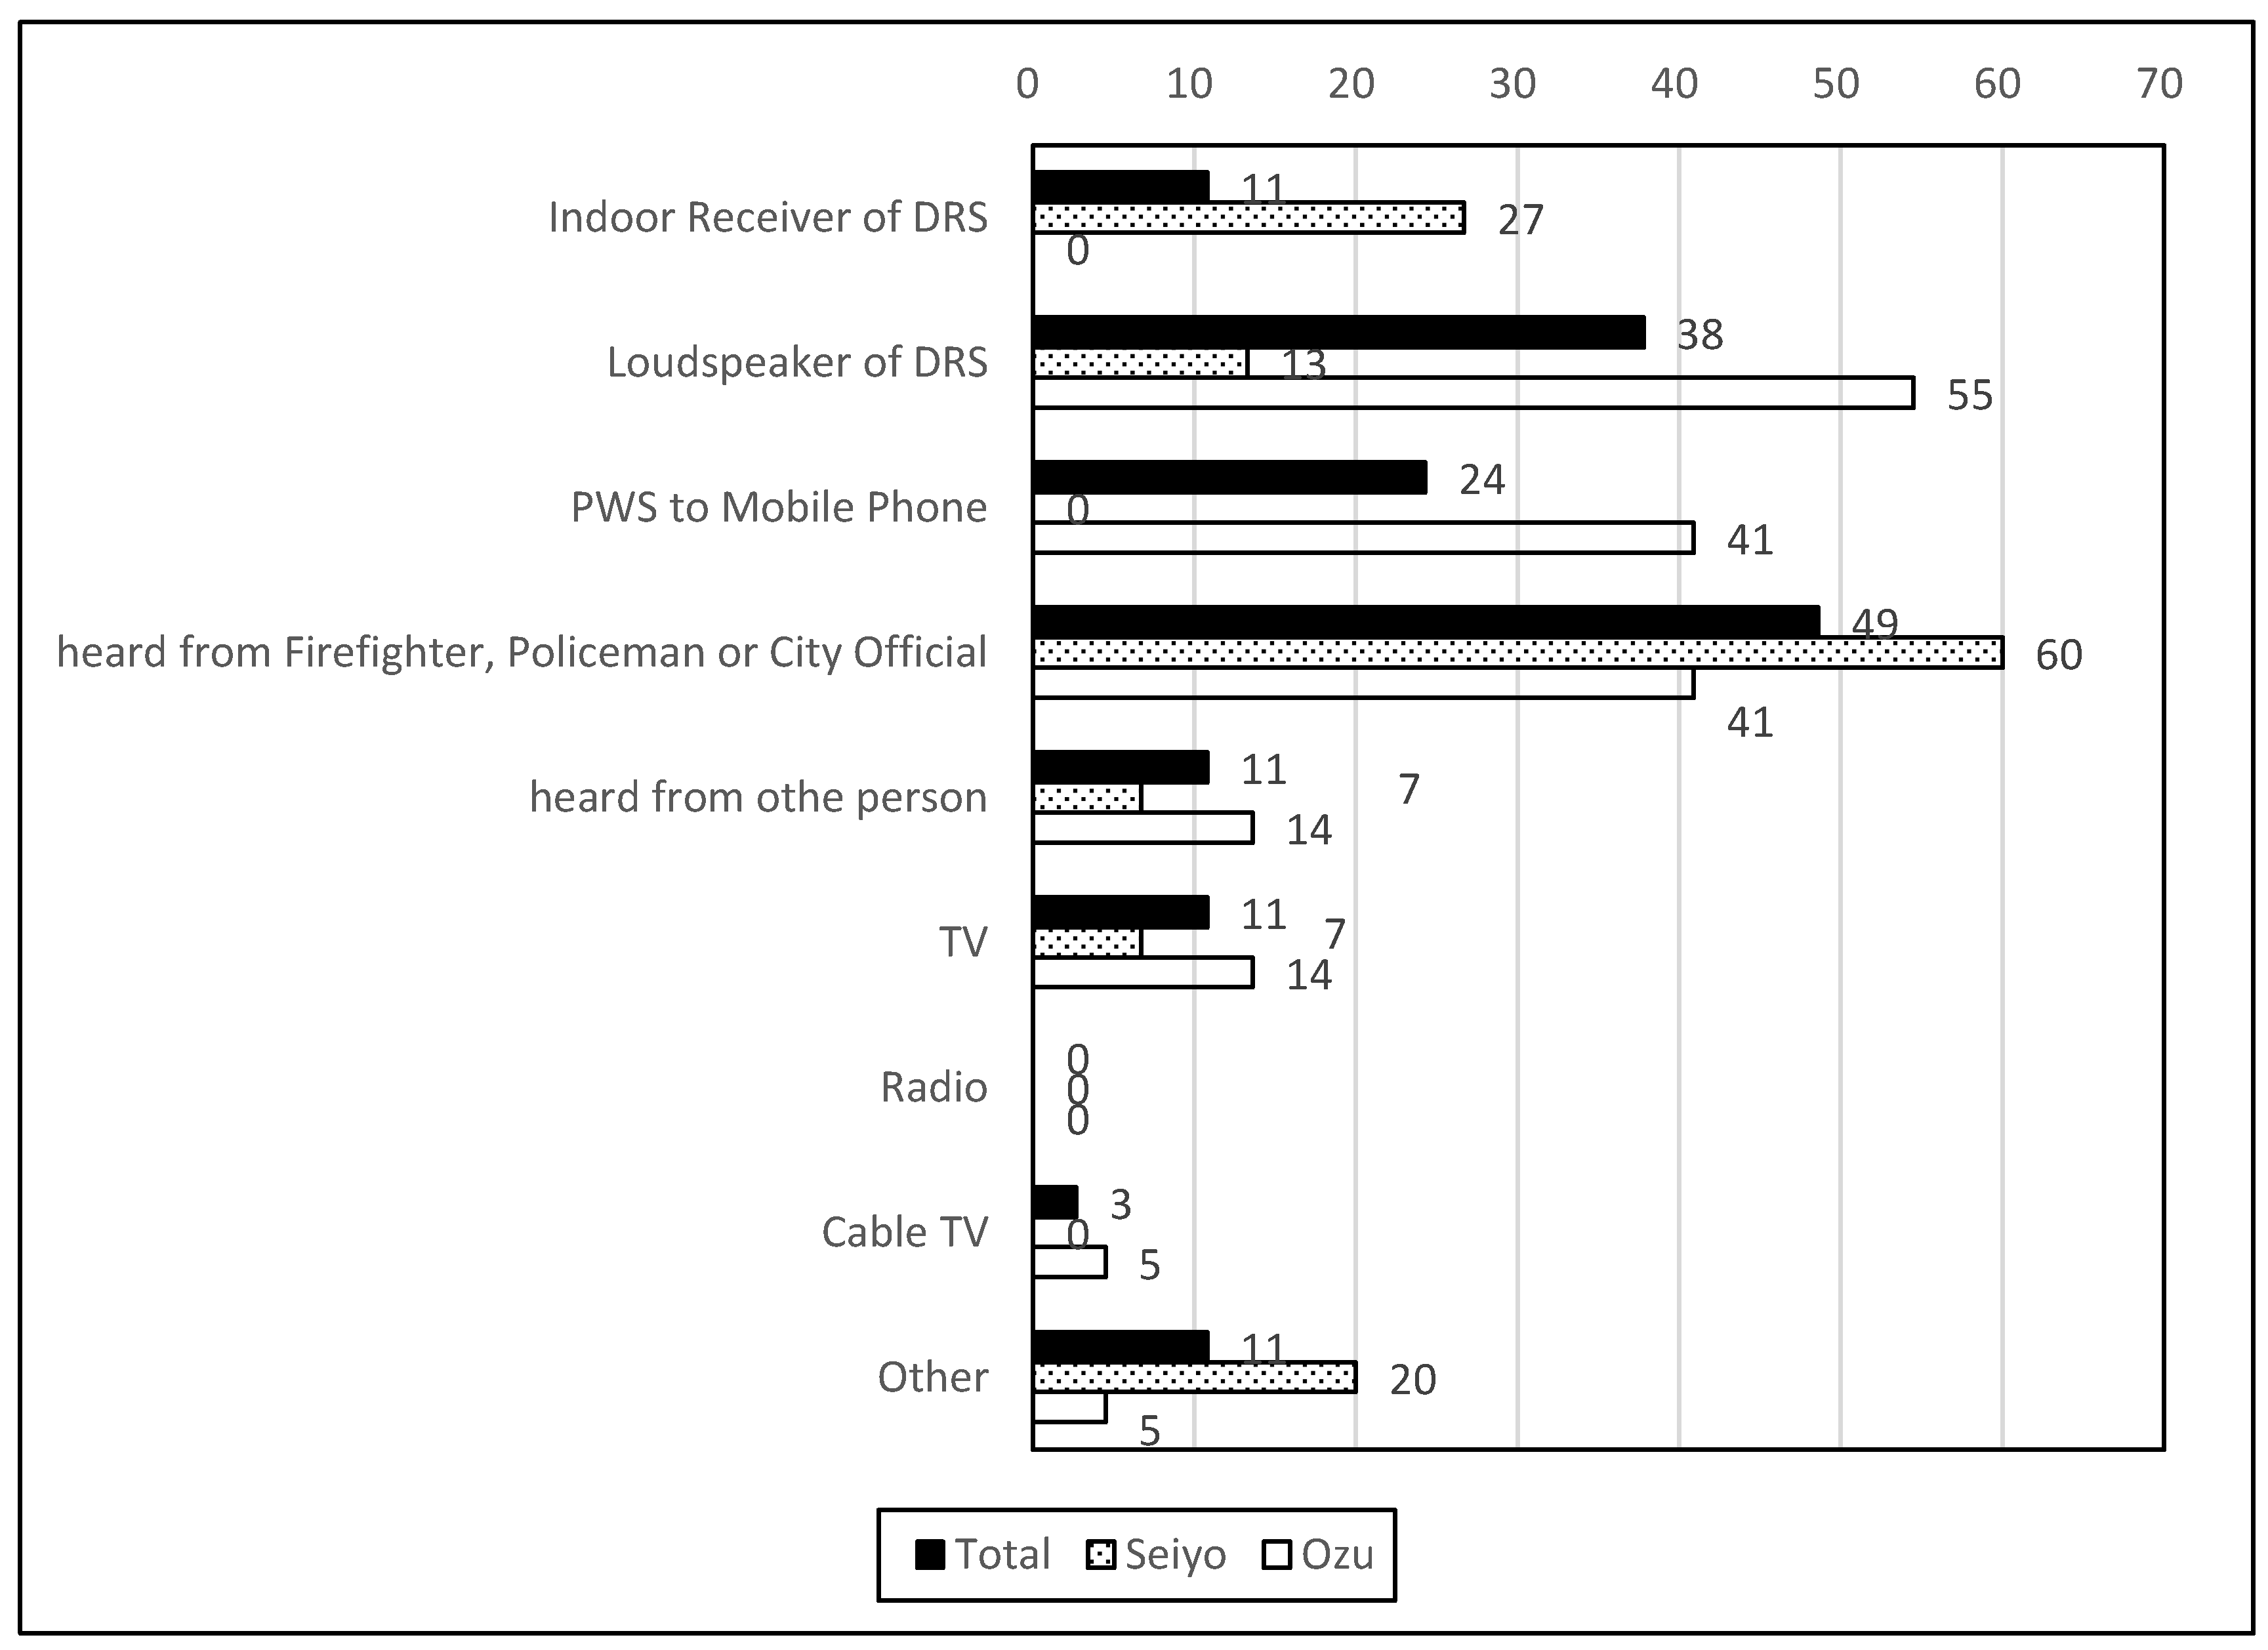
The survey results show the function of information provided by dam operators as follows. First, the discharge warning issued by the dam operators had no effect, because few people heard the warning and even those who heard it were not encouraged to evacuate. Second, the evacuation instructions provided by the local government were received by half the residents, and few residents who heard the instructions felt a sense of danger. However, the evacuation rate of those who heard these instructions was higher. Third, the most effective channel for the dissemination of evacuation instructions was route alerting by the volunteer fire corps. Therefore, information from the dam operators had an indirect effect in promoting evacuation through the route alerting of the volunteer fire corps. Fourth, the PWS was useful in disseminating evacuation instructions where it was used.
We found problems with the warning process in the case study. According to Mileti and Sorensen (2015) [
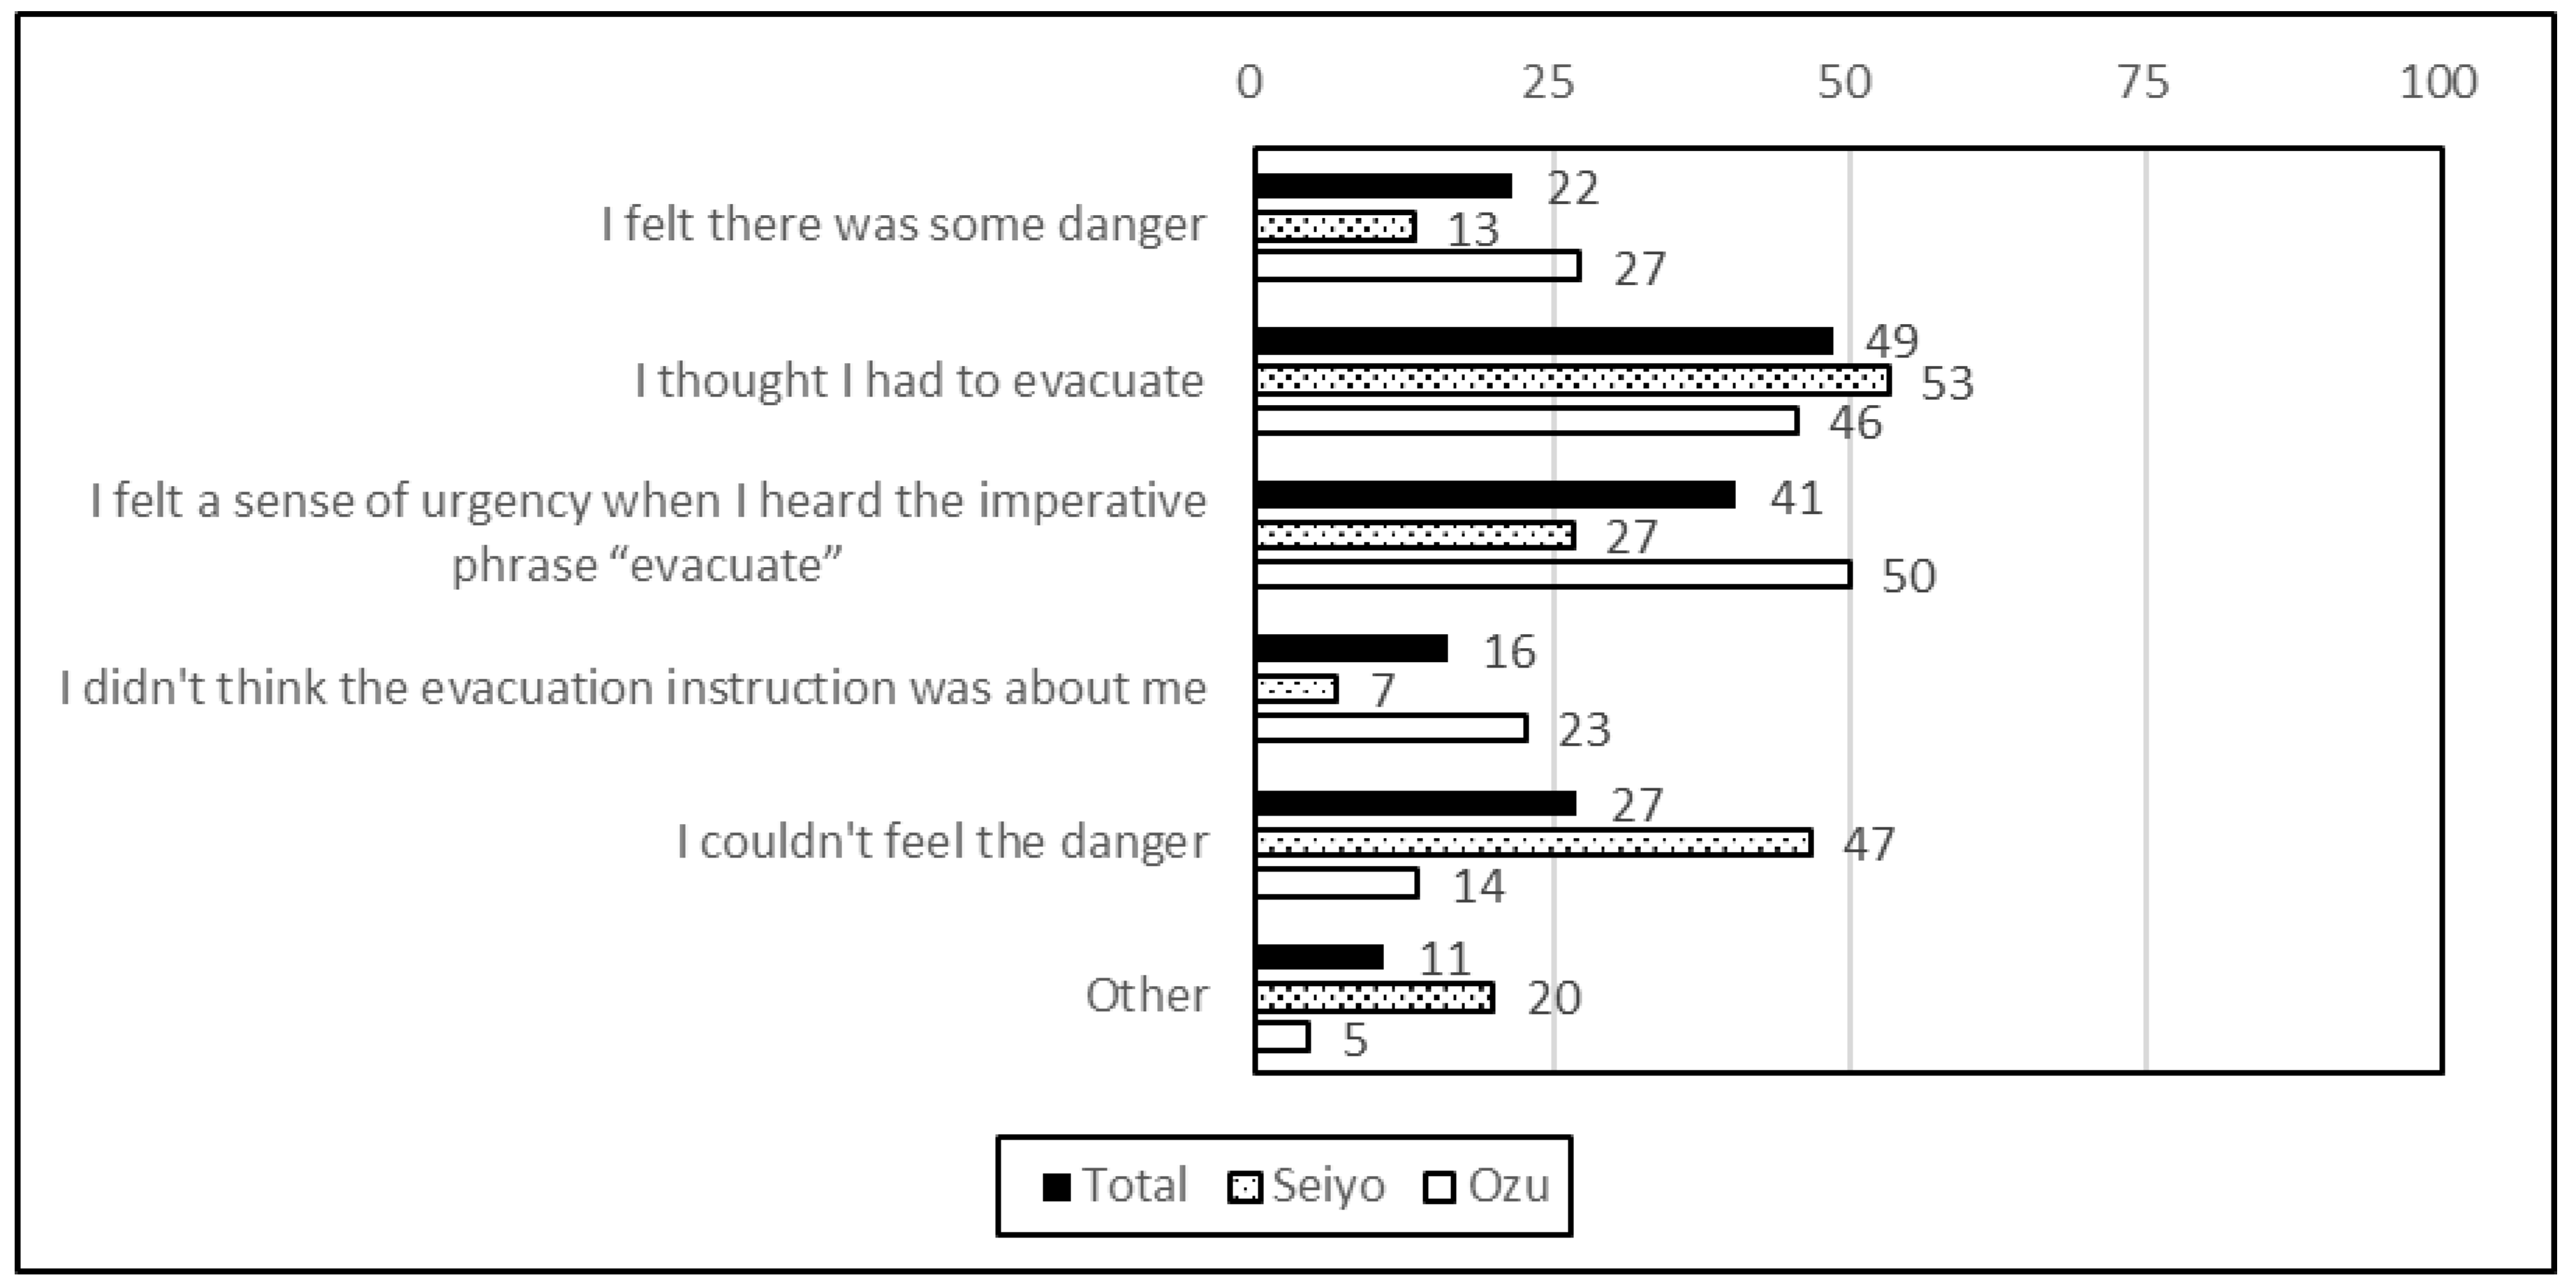
16], the warning and protective action process can be divided into the three time periods: warning delay time (issuing), warning diffusion time, and protective action initiation time. In the case study, there were problems in all these stages. In the first stage, the delay in issuing evacuation instructions shortened the time for route alerting. The issuing of evacuation instructions took 2 h and 40 min in Seiyo and 2 h and 20 min in Ozu after notification of the FCOEF. In the second stage, the channels used to transmit warnings did not work efficiently. In the third stage, residents did not feel a sense of danger when hearing a warning. This is a problem relating to the content of the message.
We propose the following solutions to the above problems using knowledge of disaster sociology such as that reported by Milleti and Sorensen (2015) [16]. For the first stage, Mileti and Sorensen (2015) [16] recommended that an emergency manager in local government makes a public protective action list, classifies flood threat levels, and establishes thresholds. For example, we can create danger thresholds according to the notification of the FCOEF and the predicted amount of discharge flow. In addition, we can create warning levels according to these thresholds and determine the evacuation area according to the warning level. These measures can prevent delays in alarm announcements.
For the second stage, the effective use of communication channels needs to be researched. We found an example of the effectiveness of the volunteer fire corps in the free-answer column of the questionnaire.
“I suspected that my house (would be flooded), but I was evacuated early because a firefighter let me know. I thought I wouldn’t evacuate because my home was on the third floor, but I thought I shouldn’t bother neighbors because I was old, so I did what the firefighters said.”
(A resident in Seiyo)
Communication through the volunteer fire corps has some effectiveness. This is the so-called “persuasion without conviction” effect (Lazarsfeld et al. 1948 [29]) of personal communication. In other words, one can be persuaded without agreeing to the reason. However, this communication has its limits because it takes time to visit each house, and the area that can be covered is therefore limited. In the considered flood event, 77 volunteer firefighters visited 912 houses and called for evacuation in Seiyo (Ehime Newspaper 14 September 2018 [30]). This would be an upper limit of what is possible. Furthermore, it is difficult to use this channel in urban areas because there are few volunteer fire corps members.
A city’s disaster prevention radio system (i.e., indoor receivers and loudspeakers) has a certain effectiveness but is adversely affected by the noise of rain because it uses voice. Meanwhile, the PWS will be effective during heavy rain because people carry their mobile phones with them. However, Ozu used the PWS late and Seiyo did not use it at all, because officials in Ozu forgot to send warnings via the PWS and officials in Seiyo were worried about an inundation of inquiries from citizens (JASDIS, 2019 [31]).
There are many channels through which a warning can be disseminated. However, each channel has advantages and disadvantages. Hence, we compare major channels according to four technological characteristics: ability to force notification, ease with which a notification is heard in heavy rain, coverage area, and ease in using the channel (Table 7). First, the ability to force notification is high for the DRS and mobile phone, because a warning is automatically received even when residents do not have any intention to search for information. Second, the sound of heavy rain does not greatly interfere with hearing a notification via indoor speakers and mobile phones. Third, notification through route alerting only reaches some parts of a city, while the DRS, PWS, and e-mail from local government cover the entire city, and television and mobile applications cover the whole country. Fourth, the DRS and television do not require complicated operations to use, whereas e-mail from local government requires registration and disaster-prevention mobile applications need to be downloaded. In particular, at night during rain as in the case of the considered flood, it is difficult to disseminate warnings. Warnings should therefore be disseminated through all media channels to ensure that all residents hear them.
For the third stage, an effective message is needed. In general, residents do not evacuate immediately when they hear warnings, and it is thus necessary to send appropriate messages frequently from an early stage (Mileti and Sorensen, 2015 [16]). A warning message requires five elements: source, threat (i.e., the possible event and its impact), location, guidance (i.e., the protective action to take), and expiration time (Mileti and Sorensen, 2015 [16]). In addition, the specificity (e.g., a place name) and clarity (e.g., a message free from jargon such as “10,000 m3/s flow” or “spillway”) are most important in the style of the message (Mileti and Sorensen, 2015 [16]). Table 8 presents example messages in the case of controlled dam discharge.
Compared with the examples given in Table 8, the messages issued in the case study were insufficient in terms of both specificity and clarity. For example, in the dam operator’s warning in Table 2, the location and possibility of flooding are ambiguous in the expression “the water level of the downstream river will rise rapidly”. In addition, the action to be taken is not concrete in the expression “take certain precautions”. In the evacuation instructions of the local government in Table 3, the cause, possibility of inundation, inundation depth, and time are ambiguous in the message “Because the river has reached the level where the river is likely to flood”. Moreover, the location is not specific in the expression “As the water of the river will reach the highest level ever, it is supposed that land that has never been inundated before can be inundated.” These inadequate messages did not generate a sense of crisis in residents. It is therefore necessary to improve the specificity and clarity of the warning message. However, to do so, it is essential to conduct a flood simulation that matches the discharge volume of the dam.
Certainly, it is not easy to simulate the flooded area accurately. However, in the case of a dam, the discharge flow is predicted several hours before. Therefore, if simulations corresponding to the discharge were conducted, they would be used effectively, especially in areas immediately downstream of the dam where dam discharge directly affects the river water level.
Another problem was the low frequency of message dissemination. Here, each dam operator sent the discharge information of the dam only once, while the city of Seiyo sent the evacuation instructions three times but it did not send anything between the first FCOEF notification and evacuation instructions. The low frequency at which messages were sent resulted in the residents not listening to the messages and not feeling a sense of crisis. It is necessary to send messages more frequently to encourage residents to evacuate.
Furthermore, the sender’s credibility is important in promoting evacuation (Mileti and Sorensen, 1990 [6], Quarantelli, 1980 [32], Stallings, 1984 [33]). Although the credibility of the dam operator before the flood was not clear, 82.3% of respondents answered that “the discharge operation of the dam was inappropriate” and 68.4% of respondents answered that “dam information was insufficient” in our questionnaire survey. Therefore, the credibility of the dam operator is presently low.
The effectiveness of the volunteer fire corps revealed in this study is consistent with the results of previous sociological studies. It was also as expected that the PWS played a certain role in the dissemination of warnings. Meanwhile, it was a new discovery that direct public information provided by dam operators to residents was ineffective.
The present study has its limitations. For example, we could not reveal why the transmission capability of the PWS and Indoor receiver of DRS did not work completely. Moreover, this case study has geographical limitation that only covers the rural area where the volunteer fire corps are relatively active. Therefore, further empirical studies on the effective use of dam discharge information and new dissemination channels are needed.

Author Contributions

Conceptualization, I.N. and C.M.; unstructured interview research, I.N. and C.M.; questionnaire survey, I.N. and C.M.; data analysis, I.N.; writing—original draft preparation, I.N.; writing—review and editing, I.N. and C.M.; funding acquisition, I.N.

Funding

This research was funded by Toyo University (Research incentive).

Acknowledgments

The authors thank the respondents of our survey research in Seiyo and Ozu, members of the research group from the Japan Society for Disaster Information Studies (JASDIS), and Glenn Pennycook, MSc, from Edanz Group for editing a draft of this manuscript.

Conflicts of Interest

The funders had no role in the design of the study; in the collection, analyses, or interpretation of data; in the writing of the manuscript; or in the decision to publish the results.

References

  1. Japan Meteorological Agency (JMA). Meteorological Event which Caused Disaster, 13 July 2018. Available online: https://www.data.jma.go.jp/obd/stats/data/bosai/report/2018/20180713/jyun_sokuji20180628-0708.pdf (accessed on 2 August 2019). (In Japanese)
  2. Ehime Prefecture, on damage of disaster caused by heavy rain July 2018 (the 43th report). Available online: http://ehime.force.com/servlet/servlet.FileDownload?file=00P0K000011c7gBUAQ (accessed on 2 August 2019). (In Japanese).
  3. Drabek, T.E. Human System Responses to Disaster: An Inventory of Sociological Findings; Springer-Verlag New York: Berlin Heidelberg, Germany, 1986. [Google Scholar]
  4. Perry, R.W. A Model of Evacuation Compliance Behavior. In Disasters, Collective Behavior, and Social Organization; Dynes, R.R., Tierney, K.J., Eds.; Associated University Press: Plainsboro, NJ, USA, 1994; pp. 85–98. [Google Scholar]
  5. Quarantelli, E.L. People’s reactions to emergency warnings. University of Delaware Disaster Research Center, Preliminary Paper #75, 1982. Available online: http://udspace.udel.edu/handle/19716/452 (accessed on 2 August 2019).
  6. Mileti, D.S.; Sorensen, J.H. Communication of Emergency Public Warnings: A Social Science Perspective and the State of the Art Assessment; Oak Ridge National Laboratory: Oak Ridge, TN, USA, 1990. [CrossRef]
  7. Sorensen, J.H.; Sorensen, B.V. Community Processes: Warning and Evacuation, In Handbooks of Disaster Research; Rodríguez, H., Quarantelli, E.L., Dynes, R.R., Eds.; Springer: Berlin, Germany, 2006; pp. 183–199. ISBN 978-0-387-32331-2. [Google Scholar]
  8. Parker, D.J.; Priest, S.J.; Tapsell, S.M. Understanding and enhancing the public’s behavioural response to flood warning information. Meteorol. Appl. 2009, 16, 103–114. [Google Scholar] [CrossRef]
  9. Jagtman, H.M. Cell broadcast trials in the Netherlands: Using mobile phone technology for citizens’ alarming. Reliab. Eng. Syst. Saf. 2010, 95, 18–28. [Google Scholar] [CrossRef]
  10. Bean, H.; Sutton, J.; Liu, B.F.; Madden, S.; Wood, M.M.; Mileti, D. The study of mobile public warning messages: A research review and agenda. Rev. Commun. 2015, 15, 60–80. [Google Scholar] [CrossRef]
  11. National Academies of Sciences. Emergency Alert and Warning Systems: Current Knowledge and Future Research Directions; National Academies Press: Washington, DC, USA, 2018. [Google Scholar]
  12. The Teton Dam Failure—An Effective Warning and Evacuation, For Presentation at the Association of State Dam Safety Officials 25th Anniversary Conference, Indian Wells, California, September 7–11, 2008. Available online: http://damfailures.org/wp-content/uploads/2015/07/075_The-Teton-Dam-Failure.pdf (accessed on 2 August 2019).
  13. Katada, T.; Kuwasawa, N. Development of Simulation System for Flood Control that Considers Dam Effect in Downstream Area. J. Jpn. Soc. Civ. Eng. 2009, 65, 280–292. (In Japanese) [Google Scholar] [CrossRef]
  14. Water Resources Environment Center Japan, Practice of Dam Management, Kowa, Tokyo, Japan, 2004. Available online: http://www.wec.or.jp/library/image/Dam_management_practices.pdf (accessed on 12 September 2019). (In Japanese).
  15. United Nations Economic and Social Commission for Asia and the Pacific (ESCAP), 2008, Guideline for Reservoir Operation in Relation to Flood Forecasting. Available online: http://typhooncommittee.org/docs/publications/WMO_TD1471_2008.pdf (accessed on 2 August 2019).
  16. Mileti, D.S.; Sorensen, J.H. A Guide to Public Alerts and Warnings for Dam and Levee Emergencies, 2015. Available online: https://www.jma-net.go.jp/matsuyama/saigai/H30/sokuho20180709.pdf (accessed on 2 August 2019). (In Japanese)
  17. Yoshii, N.; Tanaka, A.; Nakamura, I.; Fukuda, M.; Sekiya, N.; Jibiki, Y.; Morioka, C.; Chida, Y. The Problem of Information Dissemination and Inhabitant’s Behaviors in Heavy Rainfall Disaster in July 2006. Disaster Inf. Manag. Res. Cent. 2007, 12, 1–163. [Google Scholar]
  18. What people did during the Big Thompson Flood. Available online: https://www.google.com.hk/url?sa=t&rct=j&q=&esrc=s&source=web&cd=4&ved=2ahUKEwjFlrnRzJ3lAhVBzmEKHTByBSIQFjADegQIAhAC&url=http%3A%2F%2Fwww.ilankelman.org%2Fbluecover%2Fnhcwp32.pdf&usg=AOvVaw1Qxo-VHqy3ThxL6nJ66nGQ (accessed on 2 August 2019).
  19. Carpenter, T.M.; Sperfslage, J.A.; Georgakakos, K.P.; Sweeney, T.; Fread, D.L. National threshold runoff estimation utilizing GIS in support of operational flash flood warning systems. J. Hydrol. 1999, 224, 21–44. [Google Scholar] [CrossRef]
  20. Georgakakos, K.P. Analytical results for operational flash flood guidance. J. Hydrol. 2006, 317, 81–103. [Google Scholar] [CrossRef]
  21. Liu, C.; Guo, L.; Ye, L.; Zhang, S.; Zhao, Y.; Song, T. A review of advances in China’s flash flood early-warning system. Nat. Hazards 2018, 92, 619–634. [Google Scholar] [CrossRef]
  22. Ministry of Land, Infrastructure, Transport and Tourism (MLIT a), The Investigation on Information regarding the operation of Nomura Dam and Kanogawa Dam (Summary of Discussions), conference material. Available online: http://www.skr.mlit.go.jp/kasen/kensyounoba/matomesankou.pdf (accessed on 2 August 2019).
  23. Ministry of Land, Infrastructure, Transport and Tourism (MLIT), 2012, Study report on verification of Yamatosaka dam construction project. Available online: https://www.skr.mlit.go.jp/kasen/kensyou_yamatosaka/houkokusyo/houkokusyo.html (accessed on 12 September 2019). (In Japanese)
  24. Ministry of Land, Infrastructure, Transport and Tourism (MLIT) web site, River Flood Information. Available online: https://www.river.go.jp/kawabou/reference/index10.html (accessed on 12 September 2019).
  25. Heavy Rainfall in Western Japan 8 Dams Full Emergent Release. Yomiuri Shimbun, 12 July 2018; 1. (In Japanese)
  26. Okamura, Y.; Sunahachi, S.; Kasuya, J.; Nitta, A.; Mizuguchi, T.; Kitano, S. Roundtable: Response to Extreme Flood in 2004 and 2005, Reservoir, 2006.3, 3-8. Available online: http://www.dam-net.jp/reserver_pdf/Vol_9.pdf (accessed on 12 September 2019). (In Japanese).
  27. Ministry of Land, Infrastructure, Transport and Tourism (MLIT b), The Investigation on Information regarding the operation of Nomura Dam and Kanogawa Dam (a material of first conference) 19 July 2018. Available online: http://www.skr.mlit.go.jp/kasen/kensyounoba/setsumeisiryou.pdf (accessed on 2 August 2019).
  28. Ministry of Land, Infrastructure, Transport and Tourism, Ehime Prefecture, Ozu City, Seiyo City (MLIT c), The Investigation on Information regarding the operation of Nomura Dam and Kanogawa Dam (A Material of Second Conference), On Measures for More Effective Dissemination of Information. Available online: http://www.skr.mlit.go.jp/kasen/kensyounoba/02setumei0202.pdf (accessed on 2 August 2019).
  29. Lazarsfeld, P.F.; Berelson, B.; Gaudet, H. The People’s Choice; Columbia University Press: New York, NY, USA, 1948; p. 157. [Google Scholar]
  30. 39 persons were left after the evacuation guidance. Available online: https://www.ehime-np.co.jp/article/news201809140064 (accessed on 15 August 2019). (In Japanese).
  31. Japan Society for Disaster Information Studies (JASDIS), Report of JASDIS Research Group on Disaster by Heavy Rainfall in July 2018, Tokyo, Japan. (In Japanese)
  32. Evacuation behavior and problems: Findings and implications from the research literature. Available online: http://udspace.udel.edu/handle/19716/1283 (accessed on 2 August 2019).
  33. Stallings, R.A. Evacuation behavior at Three Mile Island. Int. J. Mass Emergencies Disasters 1984, 2, 11–26. [Google Scholar]
Figure 1. Location of the Hijikawa River. This map is based on a digital map published by the Geospatial Information Authority of Japan.
Geosciences 09 00444 g001
Figure 2. Location of two dams on the river.
Geosciences 09 00444 g002
Figure 3. Kanogawa Dam and its management office (left).
Geosciences 09 00444 g003
Figure 4. Indoor receiver of the DRS.
Geosciences 09 00444 g004
Figure 5. Siren and loudspeaker of the dam operator.
Geosciences 09 00444 g005
Figure 6. Loudspeaker of the DRS (Seiyo) (Ozu).
Geosciences 09 00444 g006
Figure 7. PWS on a mobile phone (Ozu).
Geosciences 09 00444 g007
Figure 8. Rate at which the discharge warning was heard (%), n = 79.
Geosciences 09 00444 g008
Figure 9. Location of loudspeakers in the inundated area of Seiyo. This map is based on a digital map published by the Geospatial Information Authority of Japan. ★: Loudspeaker of the dam operator. Red: residential area.
Geosciences 09 00444 g009
Figure 10. Feeling induced by the discharge warning (%), n = 26.
Geosciences 09 00444 g010
Figure 11. Rate at which evacuation instructions were heard (%), n = 79.
Geosciences 09 00444 g011
Figure 12. Feelings induced when residents heard the evacuation instructions (%), n = 37, (multiple answers).
Geosciences 09 00444 g012
Figure 13. Channels through which evacuation instructions were heard (%), n = 37, (multiple answers).
Geosciences 09 00444 g013
Figure 14. Evacuation rate (%), n = 79.
Geosciences 09 00444 g014
Figure 15. Trigger of early evacuation (%), n = 46.
Geosciences 09 00444 g015
Figure 16. Early evacuation rate and duplication effects of major communication channels, n = 73. A number in parentheses is the number of people in the category.
Geosciences 09 00444 g016
Table 1. Information provided by the dam operator and its response of local government. Constructed from MLIT a [22].
HourRouteInformationChannelMessage
<Nomura Dam>
2:30Dam→CityFCOEF is inevitableHL
3:30CityCity decided to issue evacuation instructions
5:10City→ResidentsEvacuation instructions were issued
(They were repeated at 5:35 and 6:10)
DRS,
Route alerting
Tab. 3, C
5:15Dam→ResidentsDam warned FCOEFS & LTab. 2, A
6:20DamDam started FCOEF
<Kanogawa Dam>
5:10Dam→CityFCOEF is possibleHL
6:18Dam→ResidentsFCOEF was warnedS & LTab. 2, B
6:20Dam→CityOutflow discharge will be the largest everHL
6:50Dam→CityOutflow discharge will be 6000 m3/sHL
6:58Dam→CityDam sent prediction on water levele-mail
7:30City→ResidentsCity issued evacuation instructionsDRS, Route alertingTab. 3, D
7:35DamDam started FCOEF
8:43City→ResidentsCity issued evacuation instructions using PWSPWSTab. 3, D
FCOEF: Flood Control Operation for Extreme Floods. HL: Hot line to a mobile phone. S&L: Sirens and loudspeakers of the dam operator; 11 loudspeaker stations were installed downstream of the Nomura Dam and 26 loudspeaker stations were installed downstream of the Kanogawa Dam. DRS: Disaster Prevention Radio Broadcasting System. PWS: Public Warning System on mobile phones (WEA or EU-Alert).
Table 2. Warning messages from dam operators (MLIT b [27]).
A. <Nomura Dam>
This is operation office of the Nomura Dam. While we are doing flood control, the inflow to the dam will continue to increase. So we will move into emergent dam operation. As the water level of the downstream river will rise rapidly, we ask you to take certain precautions.
B. <Kanogawa Dam>
Notification from Kanogawa Dam. While we are doing flood control, the inflow to the dam will continue to increase. So we will move in to operation for extreme flood. As the water will increase rapidly, we ask you to take certain precautions.
Table 3. Warning messages from local government (MLIT c [28]).
C. <Seiyo City>
This is Emergency Management Office of Seiyo City. Since the Hijikawa river has reached the level where the river is likely to flood, we have issued evacuation instructions to Nomura district. We provide shelters in Nomura Junior High School, Nomura Elementary School and Nomura Community Center. If it is danger to evacuate to the shelter, you can evacuate to safer place nearby or you can shelter to the higher floor in your house.
D. <Ozu City>
This is Emergency Management Office of Ozu City. We notice the evacuation instructions. The water level of the Hijikawa-River is supposed to arise and flow over the bank. As the water of the river will reach the highest level ever, it is supposed that the land which has never been inundated before can be inundated. Evacuate immediately to the shelter or higher places.
Table 4. Overview of the questionnaire survey.
Target of SurveyResidents of temporary housing in Seiyo and Ozu who were damaged by the flood. Each household selected one person. Total number of targets was 121.
Number of responses79 (Ozu 44, Seiyo 35)
Response rate65.2% (Ozu 83.0%, Seiyo 51.5%)
Survey methodSelf-registration method, visit distribution/mail collection
Survey periodFebruary 2019
Major contents of surveyOn damage to own house, On warning issued by the dam operator, On evacuation instructions, On evacuation, On weather information for disaster prevention, On dam operation, On disaster prevention, Face sheet.
Table 5. Variables related to early evacuation (1) (logistic regression analysis).
BStandard ErrorWaldDegrees of FreedomP ValueOdds Ratio
Discharge warnings−1.3680.7543.29010.0700.255
Evacuation instructions **2.0590.7717.13110.0087.834
Recognizing flood risk to the home0.8310.7441.24710.2642.296
City ***2.5680.70313.33810.00013.043
Constant−3.6341.07511.43110.0010.026
**: p < 0.01, ***: p < 0.001; Dependent variable: Early evacuation (yes: 1, no: 0); Covariates: I heard the discharge warning (yes: 1, no: 0); I heard the evacuation instructions (yes: 1, no: 0); Before this flood, I was aware of the danger to my home of being affected by a flood (yes: 1, no: 0); The city in which I live (Ozu: 1, Seiyo: 2); Goodness of fit: Omnibus test: p < 0.001, Cox & Snell R-square test: 0.290, Test of Hosmer & Lemeshow: p ≥ 0.05, Percentage of correct estimation: 77.8%. We conducted all analyses using IBM SPSS version 24.
Table 6. Variables related to early evacuation (2) (logistic regression analysis).
BStandard ErrorWaldDegrees of FreedomPValueOdds Ratio
Discharge warnings−0.6860.8960.58610.4440.503
Evacuation instructions via an indoor receiver of the DRS19.84018,913.9780.00010.999413,509,581.300
Evacuation instructions via a loudspeaker of the DRS−1.0061.5210.43710.5080.366
Evacuation instructions via the PWS0.3360.9310.13010.7181.399
Evacuation instructions from a firefighter, police officer or official *2.4171.1614.33410.03711.210
Evacuation instructions from another person2.4271.8581.70710.19111.326
Evacuation instructions via television1.0331.8410.31510.5752.808
Evacuation instructions via cable television−19.69340,192.9700.00011.0000.000
Recognizing flood risk to the home1.3160.8042.67810.1023.730
City **2.1100.7218.56010.0038.250
Constant−0.6860.8960.58610.4440.503
*: p < 0.05, **: p < 0.01; Dependent variable: Early evacuation (yes: 1, no: 0); Covariates: I heard the discharge warning. (yes: 1, no: 0); I heard the evacuation instructions via an indoor receiver of the DRS. (yes: 1, no: 0); I heard the evacuation instructions via a loudspeaker of the DRS. (yes: 1, no: 0); I heard the evacuation instructions via the PWS alerting my mobile phone. (yes: 1, no: 0); I heard the evacuation instructions from a firefighter, police officer or official. (yes: 1, no: 0); I heard the evacuation instructions from another person. (yes: 1, no: 0); I heard the evacuation instructions via television. (yes: 1, no: 0); I heard the evacuation instructions via cable television. (yes: 1, no: 0); Before this flood, I was aware of the danger of my home being hit by a flood (yes: 1, no: 0); The city where I live (Ozu: 1, Seiyo: 2); Goodness of fit: Omnibus test: p < 0.01, Cox & Snell R- square test: 0.303, Test of Hosmer & Lemeshow: p ≥ 0.05, Percentage of correct estimation: 77.8%.
Table 7. Characteristics of major dissemination channels of warnings.
Dissemination ChannelCapability to Force NotificationEase in Hearing Notification in Heavy RainCoverage AreaEase in Using the Channel
Indoor speaker of DRSForcedModerately difficultLimitedEasy
Loudspeaker of DRS/damForcedDifficultLimitedEasy
Route alerting of firefighterForcedEasyLimitedEasy
PWS on mobile phoneForcedEasyMediumModerately difficult
e-mail on mobile phoneForcedEasyMediumDifficult
TelevisionIntentionalModerately difficultWidespreadEasy
WebsiteIntentionalEasyWidespreadDifficult
Application on mobile phoneForcedEasyWidespreadDifficult
(Constructed under the framework of Mileti and Sorensen, 2015 [16], p23).
Table 8. Example messages for controlled dam release (Mileti and Sorensen, 2015 [16]).
Short Example: Jackson Co EMA. Evacuate Away from Crystal River Now. Water Release from Parker Dam Flooding Downstream to US79. Warning Expires 6 PM CST
Longer Example: Director of Emergency Management, Jackson County. The Parker Dam north of Kingston on Crystal River will release a large amount of water beginning at 5:00 p.m. CST. This will cause flooding downstream. The water will reach the Parkside Marina at about 6:03 p.m., the Overland Bridge at 6:42 p.m., and the northern boundary of Kingston at 6:53 p.m. Some structures and roads one-half mile to either side of the river will be flooded to a maximum depth of 3 feet. Roads will be dangerous to travel on or not be passable. The flooded areas will include: from Parker Dam to Kingston’s boundary at U.S. 79, and extend from the Crystal River for one-half mile on both sides of the river. The flooded area on the west will include River Bend Road and Bluff Ridge Hwy. On the east, the floodwaters will almost reach Highway 321. If you are in this area, evacuate now. Do not travel on roads along the river or on bridges that cross it. People west of the river should evacuate toward Centerville. People east of the river should evacuate to Highway 321. Take your pets, prescription medications, and important papers with you. You should be out of the evacuation area by 5:00 p.m. to avoid being impacted by the floodwaters. Do not drive onto water-covered roads because your car may be washed away. Move to the highest level of your home if you cannot evacuate. If you are not in the area, stay out. Keep listening to local media for more information and official updates. This message will be updated in 1 h, or sooner if new information is available.

