Institutional, Economic, and Socio-Economic Determinants of the Entrepreneurial Activity of Nations


1
NECE-Research Center in Business Sciences, Faculty of Social and Human Sciences, University of Beira Interior, 6200-001 Covilhã, Portugal
2
Centre of Management Studies of Instituto Superior Técnico (CEG-IST), University of Lisbon, 1049-001 Lisbon, Portugal
3
Instituto de Ciências Sociais (ICS), University of Lisbon, 1649-004 Lisboa, Portugal
4
Faculty of Human and Social Sciences, University of Beira Interior, 6200-209 Covilhã, Portugal
*
Author to whom correspondence should be addressed.
Adm. Sci. 2021, 11(1), 26; https://0-doi-org.brum.beds.ac.uk/10.3390/admsci11010026
Submission received: 19 January 2021
/
Revised: 19 February 2021
/
Accepted: 20 February 2021
/
Published: 4 March 2021
(This article belongs to the Special Issue Re-designing the Entrepreneurship Policy Agenda Based on Individual and Context Singularities: Evidence from Gem)
Abstract
:This empirical study analyses the effects of institutional, economic, and socio-economic determinants on total entrepreneurial activity in the contexts of developed and developing countries. It fills a gap in the literature, regarding the lack of empirical studies about the relationships among entrepreneurial activity, corruption, commercial freedom, economic growth, innovativeness, inward foreign direct investment, unemployment, households, and non-profit institutions serving households (NPISHs)’ final consumption expenditure, age dependency ratio, education index, and life expectancy at birth. The empirical application uses annual panel data for the 2003–2018 period, with a total sample of 21 countries, analysed in a two-stage empirical application, including preliminary analysis and a quantile regression model. New empirical evidence is provided, revealing a significantly positive role played by commercial freedom, innovativeness, inward foreign direct investment, households, and NPISHs’ final consumption expenditure and education on entrepreneurial activity. Corruption, unemployment, age dependency ratio, and life expectancy at birth have a significantly negative influence on entrepreneurial activity. In terms of implications, greater government control is recommended, in order to foster the quality of nations’ institutional environment. Additionally, suggested is the launch of new incentives to stimulate research and development activities aimed at registering international patents with a global impact, sourced from new ventures and transnational collaboration.
1. Introduction
Entrepreneurial activity is an economic and social phenomenon, on a global scale, where entrepreneurs take on various responsibilities and face the risks inherent to creating a new venture, hoping this attitude will make a difference, in some way, and contribute to higher levels of productivity and income. Entrepreneurs’ desire, motivation, and passion for autonomy and independence in their new ventures are of major determining importance (GEM 2019/2020). However, the literature still reveals the need for prosecuting additional empirical studies, at the macro level, on the role of the context and quality of the institutional environment in determining entrepreneurial activity (Honig and Karlsson 2013; Smallbone and Welter 2020).
Bearing in mind that entrepreneurship is one of the factors contributing to structural change in countries (Tiberius et al. 2020), it can be a fundamental lever of economic development and growth (Stel et al. 2005; Stam et al. 2009), especially through strengthening the competitive dynamics and innovative capacity of small and medium-sized enterprises (Nunes et al. 2010; Leitão et al. 2011; Baptista and Leitão 2015; Cubico et al. 2018). In this line of thought, it is hoped that governments will produce measures to combat institutional weaknesses, aiming to stimulate and increase entrepreneurial activity (Albulescu et al. 2016) and raise the quality of their institutions (Riaz et al. 2018).
The literature addressing the relationships between the institutional environment and entrepreneurial activity, deals with the first concept in terms of stability, restrictions, control, and hardness of measures, while the second is approached alluding to change, the increasing of new agents, creativity, and innovation, being highlighted, in this context, the pioneering contributions of the institutional theory, with regard to the determining factors of entrepreneurial activity (Sine and David 2003). In addition, Sine and David (2010) underline that institutional change has positive effects in terms of exploiting new opportunities for the growth of entrepreneurial activity.
Chowdhury et al. (2019) argue that entrepreneurship is essential for the vitality of economies, stressing that institutions are vital both to the quantity and quality of entrepreneurial activity, so countries need to fight corruption, and thereby improve their institutional environments. Following the institutional theory, the observance of high levels of corruption perception interacts with the level of aspirations and motivations of new entrepreneurs. Thus, as core agents of entrepreneurial activity, entrepreneurs need governments that have the capacity for creating favourable environments, which are able to ensure efficient property rights and to prevent corruption (Estrin et al. 2013).
Returning to the inspiring vision of Acs et al. (2018), increased entrepreneurial activity associated with an efficient institutional environment leads to greater economic growth in countries. By ensuring control of corruption, entrepreneurial and innovative activity becomes more attractive (Anokhin and Schulze 2009). In a related vein, Buchanan et al. (2012) confirm that high quality institutions lead to increased entrepreneurial activity, whereas weaker institutions limit the supply of resources available to entrepreneurs.
Consequently, it is especially relevant for countries to promote greater efficiency in economic activity, as this is usually associated with those having stable macroeconomic fundamentals, which in turn can encourage entrepreneurs to exploit new growth opportunities, through the creation of new ventures, implying greater flows of innovation, technology, and knowledge (Castaño et al. 2015).
At present, a common topic concerns low levels of growth and so-called growth traps, which prevents countries from achieving high levels of macroeconomic performance. In addition, the intense competition in global markets affects economic agents and areas of business in a great variety of ways. Then, the adverse effects of successive global crises have caused a slowing down of countries’ economic growth and shown the weaknesses of inefficient measures they have adopted (Pradhan et al. 2020).
Supported by institutional theory, Anokhin and Schulze (2009) signal the presence of limitations and the lack of studies on relations between entrepreneurial activity, corruption, and innovation. Here lies one of the main motivations for carrying out this empirical study, i.e., to determine in an innovative way the relations between entrepreneurial activity, corruption, free trade, innovativeness, economic growth, foreign direct investment, and unemployment.
This article focuses on analysing new entrepreneurial activity, considered as one of the pillars of countries’ economic development and growth. This matter is also considered very important in order to define countries’ new public policies, oriented towards strengthening the competitiveness and innovative capacity of new ventures. Therefore, the relevance and topicality of the subject justify this research into the unexplored institutional, economic, and socio-economic factors determining entrepreneurial activity in developed and developing countries.
This empirical study makes the distinction between institutional, economic, and socio-economic factors, and how they can influence entrepreneurial activity in 21 countries, 16 of which are developed and 5 developing, in the period between 2003 and 2018. Therefore, a selected specification of a quantile regression model was tested, allowing detailed analysis of the different determinant factors, and taking as a reference total distribution of the explained variable regarding the rate of entrepreneurial activity in the different countries. This type of model was chosen as it is shown to be very efficient in the presence of heterogeneous panels and high values of the asymmetry statistic (i.e., skewness), providing an appropriate adjustment even in the presence of outliers, and a more robust analysis compared to the ordinary least squares (OLS) model.
As for contributions, regarding institutional factors, the evidence obtained here indicates that when countries control their institutions, fighting corruption and expanding free trade, they achieve better performance in entrepreneurial activity, which ratifies the previous evidence found by Anokhin and Schulze (2009). Regarding economic factors, there is confirmation of the expected positive and significant influence of innovativeness, economic growth, and foreign direct investment on entrepreneurial activity. Concerning unemployment, this has non-linear effects on entrepreneurial activity, corroborating the evidence obtained previously by Faria et al. (2009). In relation to the remaining socio-economic determinants, namely, households and NPISHs’ final consumption expenditure, education index, and life expectancy at birth, denote positive and significant effects on the entrepreneurial activity. On the contrary, the age dependency ratio has a negative and significant influence.
The study is structured as follows. First, the theoretical framework is presented, dealing with the institutional and socio-economic determinants of countries’ entrepreneurial activity and going on to develop the research hypotheses. Secondly, the methodological design is presented, including the period studied, variables, data sources, and descriptive statistics. Thirdly, a two-stage empirical application is carried out: (i) preliminary analysis; and (ii) estimation of the quantile regression model; followed by presentation and discussion of the results, contrasting developed countries and developing countries. The study ends with the conclusions, limitations, and implications.
2. Theoretical Framework and Hypothesis Development
2.1. Institutional Determinants
2.1.1. Corruption
Using institutional theory, North (1990) states it is important for countries not only to pay attention to institutions and institutional relations but also to monitor the conditions of society’s evolution regarding levels of social, cultural, and political development. The same author also underlines the power of institutions, both formal (e.g., laws and regulations) and informal (i.e., culture, practices, customs, pressure groups, etc.), exercised on the quality and movement of the business environment.
The role of institutions is strengthened through the implementation of efficient government with political, civil, and human rights, and through greater control of corruption (Castaño et al. 2015). Economies need strong institutions as pillars supporting their competitiveness, in order to generate innovations and thereby achieve economic development and sustainable growth (Riaz et al. 2018).
Corruption is a social and institutional plague of extreme relevance, and it is up to all national governments to try to control and improve performance regarding institutional quality and the perception of corruption. In order to deepen knowledge of corruption, different aspects should be considered, at the cultural, economic, and political level, and countries’ history (Tavares 2004). Corruption in countries is usually associated with abuse of power, in positions of public authority, for private benefits (Rodriguez et al. 2006; Anokhin and Schulze 2009).
Entrepreneurial activity is affected by different institutions: social, political, and economic, but there has been limited study of the institutional environment and the impacts of entrepreneurial activity (Bylund and McCaffrey 2017).
There are two perspectives according to which corruption can have effects of entrepreneurial activity. The first, proposed by Dreher and Gassebner (2013), indicates that corruption can sometimes facilitate entrepreneurial activity and countries’ economic growth. The second indicates the contrary, i.e., that corruption harms certain countries’ entrepreneurial activity and economic growth (Glaeser and Saks 2006; Anokhin and Schulze 2009; Albulescu et al. 2016; Ojeka et al. 2019).
Anokhin and Schulze (2009) conclude that the level of corruption influences entrepreneurial activity and innovation in all 64 countries studied. The empirical evidence found by the same authors reveals a negative effect of corruption on entrepreneurial activity and innovation. In stylized terms, corruption restrains the entrepreneurial activity and innovation. Accordingly, the nations that are able to implement more effective measures to combat corruption present greater opportunities to create and exploit more innovative ideas through creating new ventures, aiming to originate unique, efficient, and competitive opportunities.
Entrepreneurship shows more robust results in countries where the institutional environment is more efficient, also presenting better results in relation to the corruption phenomenon (Simón-Moya et al. 2014). As for entrepreneurs, they can introduce new technology and innovations in their production processes to improve their efficiency, as long as the institutional environment they are part of is competent and has the most appropriate government measures. An increased rate of entrepreneurial activity combined with an efficient institutional environment leads to countries increased economic growth (Acs et al. 2018). So high quality institutions increase entrepreneurial activity while weaker institutions reduce the supply of resources available to entrepreneurs (Buchanan et al. 2012).
In order to capture institutional connections and assess the hypothetical effects on entrepreneurial activity, this study will use as an explanatory variable the perception of corruption index, which is considered one of the important institutional variables in explaining entrepreneurial activity. The index has been produced annually since 1995, by Transparency International, with a methodological change in 2012 aiming to make it more robust. This index is comparable, considering the period of time envisaged, and has been subject to analysis in different studies of reference (Anokhin and Schulze 2009; Budsaratragoon and Jitmaneeroj 2020; Erum and Hussain 2019; Ojeka et al. 2019). From the above, the first research hypothesis arises:
Hypothesis 1 (H1).
Corruption has a negative and significant effect on entrepreneurial activity.
2.1.2. Free Trade
In this study, free trade was included in the institutional approach, despite having adjoining characteristics of a commercial, political, and socio-economic nature. Considering the main focus of the study, i.e., the institutional and socio-economic determinants of entrepreneurial activity, governments are expected to tackle the need to produce norms to combat institutional weaknesses, aiming to ensure improved levels of free trade and thereby encourage increased entrepreneurial activity through strengthening the flows of international trade (Simón-Moya et al. 2014; Albulescu et al. 2016).
The most developed countries usually have strong mechanisms, based on efficient institutions, aiming to ensure greater freedom in international trade, allowing them to reach higher levels of entrepreneurial activity. In turn, effective legislation regarding the creation of new business and high levels of protection of intellectual property rights contributes positively to increased entrepreneurial activity (Simón-Moya et al. 2014).
Summarizing, free trade is associated with eliminating tariff and institutional barriers that can influence relations of economic diplomacy and international trade, involving two-directional flows of exports and imports of goods and services, which can intensify entrepreneurial activity. This leads to the second research hypothesis:
Hypothesis 2 (H2).
Free trade has a positive and significant effect on entrepreneurial activity.
2.2. Economic Determinants
2.2.1. Innovativeness
Entrepreneurs have a fundamental role in economies, by introducing new knowledge and innovations that favour improved quality and market efficiency (Salman 2016). Innovation is taken to be an idea followed up and subsequently presented and introduced to markets (Shah et al. 2014). Alluding to the pioneering work of Schumpeter (1934), the same authors propose the existence of five types of innovation, namely: (i) introducing new products or services; (ii) improving those products or services; (iii) extending products or services to new markets; (iv) innovation through new machinery to produce those goods or services; and (v) introducing new business models to help both national and international trade. However, in the global economy, it is technological innovations that are focused on more intensely and given greatest prominence (Solow 1956).
Innovativeness is very relevant for all countries in that it lets them attain competitive advantages to compete globally. Therefore, innovation consists of making goods and services more competitive and efficient, allowing introduction in various markets, which is especially important in spreading new knowledge and technology (Galindo and Méndez 2014). Entrepreneurship and innovation are considered important phenomena to ensure countries’ sustainable economic growth, through stimulating employment, quality of life, the number of innovations, and entrepreneurial activity (Baumol 2014; Rusu and Dornean 2019; Pradhan et al. 2020).
Stel et al. (2005) show the continuity of less innovative companies in developing countries, whereas the tendency to innovate is greater in firms in developed countries, due to the business sector’s growth also being greater in these countries.
Adopting a Neo-Schumpeterian vision, society in different countries has a fundamental role in the evolutionary adjustment of good social, cultural, economic, and institutional climates, which enable the conception of innovations and new business initiatives (cf. Schumpeter 1934).
Concerning countries’ innovativeness, the total number of patent applications is generally used to measure the level of economies’ innovation and macroeconomic performance (Riaz et al. 2018). This indicator is also used to evaluate countries’ innovation intensity, and for that reason, will be used in this study to measure the effects of innovation on entrepreneurial activities in 21 countries.
Countries must evolve and invest in policies that promote research and development, as this produces favourable conditions to originate and absorb more and better innovations, both now and in the future. It is important for those policies to include operational measures that allow the rapid spread of innovations, as the faster innovations are created, the greater the potential to generate countries’ entrepreneurial activity and economic growth (Pradhan et al. 2020).
In an empirical study using panel data for countries with great innovative capacity, Salman (2016) shows that policies to help entrepreneurs produce positive effects on economic development and growth, essentially through raising the quality of education, subsidies for research and development (R&D) activities, appropriate tax policies, and stability in monetary policy.
Economic growth refers to increasing the level of economic activity based on the production and consumption of goods and services in a given country, over several years, with long-term economic growth being calculated through the rate of technological progress, considered as an amount determined exogenously (Solow 1956).
When efficient, economic activity in countries corresponds to a stable macroeconomic environment, and so entrepreneurs make the most of opportunities to create business, increasing the flows and quality of innovations, technology, and new knowledge, for better exploitation of growth opportunities (Castaño et al. 2015; Acs et al. 2018).
Various studies in the empirical literature of reference converge in concluding that new knowledge, new technology, and innovations lead to increased entrepreneurial activity and naturally to increased economic growth (Schumpeter 1934; Audretsch and Feldman 1996; Romer 1997; Turró et al. 2014; Castaño et al. 2015; Acs et al. 2018). Therefore, the third research hypothesis is formulated:
Hypothesis 3 (H3).
Innovativeness has a positive and significant effect on entrepreneurial activity.
2.2.2. Foreign Direct Investment
Foreign direct investment (FDI) is one of the relevant determinant factors for countries being able to increase entrepreneurial activity, and this is affected by a wide range of variables of both an institutional or commercial, and economic and social nature. Economic analysis of FDI flows implies incorporating variables that may be correlated with entrepreneurial activity (Eren et al. 2019).
In this connection, it should be pointed out that corruption can hinder FDI and increase the costs of employees integrated in the country’s government, which together can restrict economic growth, innovative and business capacity, the capacity to collect tax income and actions to regulate and implement public policies (Ojeka et al. 2019). Consequently, in this line of thought, it is argued that countries must focus on improving the quality of institutions and reducing the perception of corruption, in order to increase the attractiveness of the economy as a destination for FDI.
For Herrera-Echeverri et al. (2014), it is also relevant to ensure the design of public policies destined to attract inward FDI. This investment is seen as activating new firm creation and an efficient mechanism of technology transfer (Alfaro et al. 2009) or a technological driver of entrepreneurial activity (Leitão and Baptista 2009; Leitão and Baptista 2011).
Therefore, FDI should be stimulated in order to serve as an activator of entrepreneurial activity and other economic activities, expecting a positive association between this type of investment and firms and countries’ economic activity (Teixeira and Heyuan 2012). This investment is also considered as a factor stimulating new technology and innovations (Alfaro et al. 2009). Furthermore, FDI can serve as a driver of technological progress in developing countries (Anokhin and Schulze 2009).
Barbosa and Eiriz (2009) claim that inward FDI causes positive impacts on entrepreneurial activity, but only in the short term, applying this to Portugal. Other authors argue that the impacts of this type of investment on countries and companies are positive but of very little significance (Aitken and Harrison 1999; Konings 2001). However, Eren et al. (2019) found the opposite, revealing that inward FDI has a negative impact on new business creation in the period 1996–2008, in the context of the USA. Barbosa and Eiriz (2009) demonstrated that inward FDI in Portugal discourages increased entrepreneurial activity in the long term, a finding corroborated by Leitão and Baptista (2011), in a comparative study of Portugal and Finland, regarding analysis of technological drivers of entrepreneurial activity in these European countries. This leads to the fourth research hypothesis:
Hypothesis 4 (H4).
Inward FDI has a positive and significant effect on entrepreneurial activity.
2.3. Socio-Economic Determinants
2.3.1. Unemployment
Studying the impacts of unemployment on entrepreneurial activity is relevant for this research, in that it can be addressed as an activator of the option for self-employment, with the expectation that it can stimulate entrepreneurial activity, despite the risks and uncertainties associated with following this option as a mechanism of job creation (Faria et al. 2009).
Audretsch and Fritscht (1994) analyzed the relation between unemployment and entrepreneurial activity, concluding that unemployment has a negative effect on new firm creation. Other authors conclude precisely the opposite, that unemployment has a positive impact (Evans and Leighton 1990; Cumming et al. 2014). Therefore, the theoretical and empirical literature shows a lack of agreement on the sign of this relation.
Audretsch and Thurik (2000) found that entrepreneurship has negative effects on the unemployment rate. In a study applied to the USA, Beynon et al. (2019) found that less developed states have higher levels of entrepreneurial activity, above all due to the lack of competition in some markets, causing an exponential growth in the number of entrepreneurs, which ultimately favours economic growth in these states.
Faria et al. (2009) concluded that unemployment and entrepreneurial activity show non-linear effects, being a very dynamic phenomenon, which contrasts with the pioneering result obtained by Audretsch and Fritscht (1994), who indicated a negative relation between unemployment and new business creation.
Castaño et al. (2016) highlighted the importance of public policies in countries, focusing on increased rates of economic growth and the creation of economic activities, in order to reduce unemployment and stimulate the population’s well-being. Nevertheless, it should be noted that the rate of entrepreneurial activity is significantly higher in countries with more unstable unemployment rates, and where there are greater discrepancies in income and lower levels of development (Simón-Moya et al. 2014). Therefore, the fifth hypothesis is as follows:
Hypothesis 5 (H5).
Unemployment has a negative and significant effect on entrepreneurial activity.
2.3.2. Age
The ageing of the population in developed countries stems from increases in average life expectancy and decreased fertility rates. One way to combat the inversion of the base of the age pyramid is through the adoption of (pro)active aging policies, which advocate raising the retirement age, promoting senior entrepreneurship, and involving the elderly in social, economic, cultural, religious, spiritual, civic actions, among others (Jackson 2000; Kurek and Rachwal 2011).
The latest trends point to the increase in average life expectancy, as well as the overlap of the dependency ratio of the elderly relative to the ratio of young people’s dependency, which puts pressure on national governments to design new reform financing solutions and to consider new ways of integrating the older population into the labor market (Bohlmann et al. 2017; Guimarães and Tiryaki 2020).
The need to promote new forms of senior entrepreneurship should be addressed through the creation of specially designed programs, aiming to ensure that the older population can succeed in exploiting new business opportunities, taking advantage of the experience, career path, and relational capital of seniors (Kinsella and Phillips 2005).
For its turn, the aging of the population also creates the need to develop innovative ideas and entrepreneurial initiatives with regard to the commercialization of goods and services to support this growing segment of the population (Kurek and Rachwal 2011).
Lévesque and Minniti (2006) highlight the existence of a negative relationship between age and entrepreneurial activity, stating that the higher the population’s life expectancy and the discrepancy in relation to the age dependency ratio, the lower will be the level of entrepreneurial activity.
Thus, the following sixth hypothesis is considered:
Hypothesis 6 (H6).
The age dependency ratio has a negative and significant effect on entrepreneurial activity.
2.3.3. Households Consumption
Households and NPISHs’ final consumption expenditure (% of GDP) brings together the final consumption of households and expresses the value added of goods and services acquired by national families, both nationally and abroad. This variable is one of the plots that most influences GDP behaviour, about 60% (OECD 2020), therefore, it is considered as a fundamental indicator of a robust economic analysis.
The consumption of goods and services, income and wealth of households are framed as vital elements of the economic well-being of the populations, and it is essential for countries to measure and control these three indicators in order to achieve a state of equilibrium and an optimal point (OECD 2013).
The variable used to measure the final consumption of expenses made by households and NPISHs’ final consumption basically corresponds to the consumption associated with the meeting of daily needs, such as food, clothing, housing, energy, transport, automobiles, machinery, health and leisure expenses, among other goods and services (OECD 2020). This consumption variable allows for an interesting analogy, based on the measurement of well-being in relative terms of different countries, so we can analyse and compare the expenditure of final consumption between the different countries.
As far as developing countries, such as South Africa, which is included in this sample taken from WESP (2014), positive developments in structural levels of household income patterns have very significant impacts on their economies, all because a substantial part of the population has reached the level of average incomes, through increased purchasing power and consumer spending (Ligthelm 2010). However, there is a peculiar problem with this group of countries, which relates to the difficulties in measuring much of their economic activity (Aparicio et al. 2021).
Nandamuri and Gowthami (2013) investigate the influence of sociodemographic factors on entrepreneurial activity, concluding that household income has a huge impact on the ability to create new businesses. Therefore, it is expected that increasing household incomes will stimulate consumption and be the source of more entrepreneurial activities in different nations.
From the previous, it results in the seventh hypothesis:
Hypothesis 7 (H7).
Households and NPISHs’ final consumption expenditure has a positive and significant effect on entrepreneurial activity.
2.3.4. Education
Following the view expressed by Boubker et al. (2021), entrepreneurship education takes a key role in the development and creation of new businesses, therefore, it is mainly suggested that universities strengthen and create a more entrepreneurial culture, providing students with training on this theme, in order to amplify the entrepreneurial intentions of the younger community.
Students in developing countries require a structural change in education programmes, which provide the creation of teaching and learning mechanisms tailored to an entrepreneurial culture, in order to strengthen entrepreneurial intent and thus improve students’ perception skills in the business sector (Hadi et al. 2015).
Acs et al. (2014) stress that each country has its mechanisms and regulations regarding institutions, so the level of education, the will and motivation of entrepreneurs, take a key role in promoting new entrepreneurial initiatives.
It is vital both for the improvement of education activities and for the increase of entrepreneurial activity, for students to participate in business and trade activities, to acquire new competences and skills (Hadi et al. 2015).
Education is fundamental for entrepreneurial activity, assuming a lever role of regional development, and education is expected to have positive and significant effects on entrepreneurial activity (Galvão et al. 2018).
Thus, from the statements presented above, the eighth research hypothesis is considered:
Hypothesis 8 (H8).
The education index has a positive and significant effect on entrepreneurial activity.
2.3.5. Life
The ageing of the population is a common denominator for most countries, particularly developed countries. This, combined with the trend of increasing average life expectancy, and the overlap of the dependency ratio of the elderly in relation to the dependency ratio of young people, makes room for a new generation of public policies promoting the (pro)active integration of the older population into the labour market (Bohlmann et al. 2017; Guimarães and Tiryaki 2020).
In developed countries, there has been an increase in the longevity of the population and a decrease in the infant mortality rate, which is justified by the sharp increase in health expenses (Jaba et al. 2014). Gains related to life expectancy at birth can be justified by several factors, such as access to health services, education, and healthier lifestyles (OECD 2019).
The increase in average life expectancy can also have negative impacts, on the sustainability of public budgets, from the point of view of increasing public spending on health and social security. In turn, entrepreneurs as they age become more risk-averse, and one of the direct consequences is reduced investment volatility and decreased consumption (Aiyar et al. 2016; Guimarães and Tiryaki 2020).
According to the previous, the ninth research hypothesis is formulated:
Hypothesis 9 (H9).
The life expectancy at birth has a negative and significant effect on entrepreneurial activity.
3. Methodological Design
3.1. Period of Study, Data Sources, and Variables
The period of analysis is between 2003 and 2018, i.e., 16 years. This period was chosen based on data availability for the sample of countries studied (cf. Table 1), which are divided according to the criteria in the report drawn up by the United Nations: World Economic Situation and Prospects (WESP 2014).
The countries were chosen according to the availability of data, and later divided following the criteria of the World Economic Situation and Prospects (WESP), which employs a wide range of trends in various dimensions of the global economy, being prepared by the Development Policy and Analysis Division (DPAD) of the Department of Economic and Social Affairs of the United Nations Secretariat (UN/DESA) (WESP 2014).
In analytical terms, the World Economic Situation and Prospects (WESP) categorizes countries by the following groups: developed economies; economies in transition; and developing economies, however, from the availability of data, the countries that were chosen for this empirical study fall into the categories of developed economies, and developing economies (WESP 2014).
The largest differences between groups of countries with developed economies, and countries with developing economies, are due to disparities in the percentages of exports and imports of fuel; gross domestic income (countries divided into high income; high middle income; low middle income; and low income (countries under $1035 are considered low-income countries; between $1036 and $4085 are considered countries with low average incomes; between $4086 and $12,615 are countries with high average incomes; and finally countries with incomes higher than $12,615 are high-income countries.
The Crisis Dummy represents the global financial crisis of 2008–2009. This global crisis began with the housing market’s bubble, created by an overwhelming load of mortgage-backed securities that bundled high-risk loans. This recessive crisis implied a global economic downturn that negatively impacted world financial markets, as well as the banking and real estate industries. The crisis rapidly spread into a global economic shock, resulting in several bank failures. Economies worldwide slowed during this period since credit tightened and international trade declined. Housing markets deteriorated and unemployment raised. In short, the Crisis Dummy was created for capturing the effects caused by the global economic and financial crisis of 2008–2009. It assumes a value of 1 in the years 2008 and 2009, and a value of 0 for the remaining years 2003 to 2018.
Table 2 describes the variables considered in this study: dependent and independent; to analyse the factors determining countries’ entrepreneurial activity; organized in four categories: institutional; economic; socio-economic; and dummies; with the description and the corresponding source. The variables were obtained from the following international data sources: Global Entrepreneurship Monitor (GEM); Transparency International; Heritage Database; WIPO Statistics Database; World Development Indicators; Human Development Data Center; and Unctadstat. The countries and period studied were limited to the availability of data for the variables chosen to measure both institutional, economic, and socio-economic factors.
TEA is the dependent variable in this study and represents the rate of entrepreneurial activity in the initial state, expressed by the percentage of the population between 18 and 64 who are latent entrepreneurs and those who intend to start a business within three years, excluding individuals who are already involved in any stage of entrepreneurial activity (GEM 2019/2020). The remaining variables are considered independent, except for the last two, which are used as control variables. Subsequently, 3 more variables of interest are used: DTEA (lagged dependent variable); CPI2 (squared CPI variable); and CPI3 (cubic CPI variable); tested at the second stage of the empirical application.
3.2. Descriptive Statistics
In a preliminary assessment of the nature of the data used in this empirical application, some consideration is given to the descriptive statistics of the variables studied. These do not show great variability, except for the variable representing countries’ innovativeness (PATPC), which is due to analysing a very heterogeneous panel of countries with different capacities for innovation and the creation of national wealth expressed by the real GDP.
Table 3 below presents the descriptive variables studied, namely total observations, mean, coefficient of variation, minimum, maximum, and the results of the Jarque–Bera test and asymmetry and kurtosis statistics.
Regarding the values of the coefficient of variation (VC), the variables: DTEA; PATPC_LAG1; and DCRISIS, denote a higher VC, comparing with the remaining one.
The Jarque–Bera test was performed, to determine normality and combine the study of kurtosis with asymmetry. Observation of the results obtained reveals that the variables do not follow normal distribution. In addition, the skewness statistic was calculated, to determine the asymmetry of distribution. In this test, mostly positive values were obtained, so the distribution is single tailed to the right, as the curve on the right is seen to be greater than the curve on the left, showing positive asymmetry. This coefficient allows a comparison to be made between the distribution of the sample and normal distribution, and the greater the value of this coefficient, the greater the distance of the sample distribution from normal distribution.
Calculation of the kurtosis statistic can determine possible excess of kurtosis, i.e., the existence, or not, of outliers. Three possibilities are assessed: (i) leptokurtic variables (values above 3); (ii) platykurtic variables (values under 3); and (iii) mesokurtic variables (i.e., excess kurtosis equal to zero). Consequently, the test allows measurement of the peaks of the series’ distributions, confirming that the majority of variables are leptokurtic.
The asymmetry values (skewness) show in some cases a certain bias of the probability distribution of a random variable on its mean, above all when having values above 1 or even less than −1. In turn, kurtosis informs about the height and clarity of the central peak of the distribution, in relation to a standard sine curve, confirmed here by the concentration of values above 4.2321.
4. Empirical Application
The empirical application is in two phases, i.e., the first makes a preliminary analysis of the data, based on the results of calculating the correlation coefficients, variance inflation factors (VIF), unit root tests, specification tests, tests of specific behaviour of the distribution of data, and tests of normality of distribution; aiming to confirm the choice of the most suitable regression model and ensure the likelihood of results. The second phase arises from selection of a quantile regression model, which can cope appropriately with a panel of heterogeneous data, as well as testing hypothetical non-linear effects of the institutional and socio-economic determinants throughout the distribution of the explained variable, i.e., countries’ entrepreneurial activity.
4.1. First Stage: Preliminary Analysis
Table 4 presents the correlation coefficient matrix, which allows some preliminary considerations about the variables studied regarding signs, intensities, and statistical significance of the correlations, by pairs of variables. Considering the correlation coefficients, it is possible to observe that all are equal or lower than 0.7720, regarding the EDUCATION and CPI pair, signalling a positive association between education index and the perception of corruption. Thirty-seven statistically significant coefficients are detected, by pairs of variables studied, but there are no signs of potential problems of multicollinearity as they present absolute values under 0.80.
Table 5 presents the results of the test of the variance inflation factor (VIF), aiming to determine the hypothetical presence of multicollinearity among variables.
Considering the recommendation of Asteriou and Hall (2011), observation of the results presented in Table 5 above allows the conclusion that the variables do not show the presence of multicollinearity, as almost all the VIF values are around 2.
Table 6 presents the results of the unit root tests, which inform about the stationarity of the variables studied. The tests performed are: Levin, Lin, and Chu (LLC), which is usually effective for panel data (Levin et al. 2002); Im, Pesaran, and Shin (IPS) common for heterogeneous and dynamic panels (Im et al. 2003); and Phillips and Perron (PP), which serves as a supplement for greater robustness, the aim here being to detect the presence of unit roots in the time series studied and admitting the possibility of the distribution being heterogeneous (Phillips and Perron 1988; Maddala and Wu 1999). The results indicate that almost all the variables are stationary, at their normal level and in first differences of TEA (DTEA).
The null hypotheses (H0) and the alternative hypotheses (Ha) are the following. In the LLC test, H0—the panel has unit roots and Ha—the panel is stationary. In the IPS test, H0—all the panels have unit roots, and Ha—some panels are stationary. As for the last one, the PP test, H0—all the panels have unit roots, and Ha—only the last panel is stationary.
For the LLC test, H0 is rejected for all the variables, this means that all the variables are stationary. In the IPS test, H0 is rejected for the variables of TEA, DTEA, FT, UNEM, and LIFE so these are stationary and do not have unit roots. Regarding the other variables, CPI, PATPC_LAG1, INFDI, AGE, HOUSEHOLD, and EDUCATION are found not to be stationary and present unit roots. In the last unit root test (PP), the majority of variables do not show unit roots and, therefore, the last panel is stationary. Only UNEM, HOUSEHOLD, and CPI have unit roots.
Table 7 presents the results of some specification tests suitable for the data panel. Considering the significances detected for the different statistics, at a 1% level, the consistency of that panel is confirmed.
Concerning the Hausman test, the null hypothesis (H0) corresponds to the data panel being better adjusted with random effects, and so H0, is rejected for a 1% level of significance. It is concluded that the data panel is better adjusted with a fixed effects model, although the fixed effects (FE) and random effects (RE) models will be tested, in order to determine first, the signs and significance level of the explanatory variables of the dependent variable, i.e., entrepreneurial activity (Hausman 1978).
Next, the modified Wald test is performed, as is usual for fixed effects panels, concluding that this data panel presents heteroscedasticity (Goh and King 1996). This result agrees with the empirical literature of reference, which proposes that the quantile regression model admits the presence of heteroscedasticity and outliers (Koenker and Bassett 1978; Koenker and Machado 1999; Koenker and Hallock 2001).
Regarding the Wooldridge test, this was performed to determine the existence of first order autocorrelation, and as H0 is rejected, it is concluded that there is first order correlation in the data panel (Wooldridge 2002).
In determining the existence of the phenomenon of cross sectional dependence, the Pesaran test was performed, as is common in panels with fixed effects, concluding on the existence of cross sectional dependence (Pesaran 2004; Hoyos and Sarafidis 2006).
Another appropriate test for this model, presenting robust results in relation to the phenomenon of heteroscedasticity, is the Breusch–Pagan/Cook–Weisberg test, which as proposed in the corresponding H0, can test for the presence of homoscedasticity (Breusch and Pagan 1980).
Table 8 below presents the results of the test of the specific behaviour of the data distribution, using the Shapiro–Wilk W test (Shapiro and Wilk 1965; Shapiro and Wilk 1968).
According to the results shown in Table 8, all the variables are seen to differ significantly from normal distribution, i.e., data distribution follows a non-normal/non-linear distribution (Shapiro and Wilk 1968).
The test of normality was also performed, i.e., the skewness/kurtosis test (cf. Table 9), in order to determine the effects of normality on a data panel (Bai and Ng 2005) and assess the asymmetry of residuals’ normality.
The results of the test of asymmetry of residuals’ normality allow the conclusion that the variables have a non-linear distribution, i.e., the distribution of their values does not follow normality (Bai and Ng 2005).
4.2. Second Stage: Quantile Regression Model
4.2.1. Method
Koenker and Bassett (1978) were pioneers in presenting the quantile regression model, a method that can analyze the different effects independent variables can cause on the dependent variable’s conditional distribution. Subsequently, this model was tested by the same authors in other work to check its accuracy, confirming that it ensures obtaining robust results in the presence of outliers (Koenker and Machado 1999; Koenker and Hallock 2001).
A study of reference for this research, dealing with the relations between corruption, entrepreneurial activity, and innovation, used the same type of method (Anokhin and Schulze 2009), in order to determine the non-linear relations between the variables studied, added to the set of scientific and technical arguments, which help to justify the methodological option to use this type of regression model. Other studies of reference applying this model were also taken into account in this research (Buchinsky 2012; Keho 2016; Zhang et al. 2016; Aldieri and Vinci 2017; Afonso et al. 2019; Moreno-Izquierdo et al. 2020).
According to Koenker and Bassett (1978), a simplified expression of the model can be presented as follows:
where: Xit, corresponds to the coefficients of the explanatory variables; and β(τ) contains the regression coefficients by quantile (τ = 0.2;0.4;0.6;0.8;0.98) corresponding to the dependent variable Yit. Regarding μit, this corresponds to distribution of the error term. It is noted that as increases of τ between 0 and 1 are found, there is development of the conditional distribution of total entrepreneurial activity, the maximum value corresponding to 1, and the minimum to 0.
Yit = Xitβ(τ) + μit
4.2.2. Model Specification
In this study and to analyse the hypothetical effects of institutional and socio-economic factors on entrepreneurial activity, the following model specification is considered:
where: Q(TEAit): shows the quantile referring to entrepreneurial activity (TEA); the i parameter refers to the country in the data panel; and t corresponds to the period of time. TEA expresses the dependent variable measured by the rate of entrepreneurial activity; DTEA represents the lagged dependent variable; CPI expresses the corruption perceptions index; FT represents free trade; PATPC_LAG1 corresponds to the ratio of patents to real GDP per capita; INFDI represents the entry flows of FDI; UNEM corresponds to the unemployment rate; AGE represents the age dependency ratio; HOUSEHOLD corresponds to the households and NPISHs’ final consumption expenditure; EDUCATION expresses the education index; and LIFE corresponds to the life expectancy at birth.
Q(TEAit) = β0τ+β1τDTEAit +β2τCPIit+β3τFTit+β4τPATPC_LAG1it+β5τINFDIit+β6τUNEMit+β7τAGEit +β8τHOUSEHOLDit +β9τEDUCATIONit +β10τLIFEit + μit
The equation represents the hypothetical effects associated with the determinant factors of countries’ entrepreneurial activity. The interest of this study lies in contributing to advancing the still limited knowledge about the hypothetical non-linear effects of institutional, economic, and socio-economic determinant factors, considering the whole distribution of entrepreneurial activity. This line of reasoning justifies use of the econometric method of quantile regression, as it is considered appropriate to investigate those hypothetical effects of the independent variables on a given dependent variable, assessing different points of that dependent variable, throughout its conditional distribution.
4.3. Empirical Evidence
4.3.1. Results of Estimation of the Models
This sub-section presents the results of the models applied using the quantile regression method. Model 1 (cf. Table 10) considers all the independent variables, including the lagged dependent variable (DTEA), in order to determine the hypothetical effects of the independent variables on entrepreneurial activity, throughout the corresponding distribution. The CPI2 and CPI3 variables are also considered, in order to determine possible non-linear effects of perceived corruption on entrepreneurial activity. Model 2 (cf. Table 10) includes one of the control variables, the dummy referring to the 2008–2009 crisis. Model 3 (cf. Table 11) includes the second control variable, a dummy for developed and developing countries. Model 4 (cf. Table 11) includes all the independent variables and the two control variables.
Concerning the results of Model 1, in relation to corruption, the sign of the coefficient is as expected, being negative and very significant in all the quantiles, except for the Q80.
Free trade has negative and significant effects on entrepreneurial activity only in the last quantile (Q98), i.e., free trade is only significant for higher levels of the distribution of the entrepreneurial activity variable.
The ratio of patents to GDP per capita has positive and significant effects but shows coefficients with low values. This explanatory variable is more significant for higher levels of the TEA distribution (Q60; Q80; and Q98). Therefore, beneficial results are expected, in terms of entrepreneurial activity, as long as innovations continue.
In relation to FDI, this is found to have positive and very significant effects for all the quantiles of TEA distribution, except for the Q20. This being so, increases in this type of investment in countries is seen to promote increased levels of entrepreneurial activity. This variable is considered an incomplete proxy to represent technology transfer flows, and so the greater the FDI, the greater the technology transfer and higher levels of entrepreneurial activity will be achieved.
Unemployment is seen to have negative and significant effect on entrepreneurial activity, for most distributions, except for Q20 and Q40. These results contrast with the scarce most recent empirical literature regarding this relation but are explained by the sample being mostly formed of developed countries.
The age dependency ratio has negative and significant effects for all the quantiles of entrepreneurial activity distribution, except the Q20. This mean that the higher age dependency ratio, the lower will be the propensity for countries to create entrepreneurial activity.
Households and NPISHs’ final consumption expenditure exhibit significant and positive effects on quantile: 60; 80; and 98. The increase in household expenditure in relation to consumption, leads to higher levels of entrepreneurial activity.
The education index has positive and significant effects on large distributions of entrepreneurial activity, that is, the higher the number of years of schooling of the population, the higher will be the level of entrepreneurial activity.
On the contrary, the average life expectancy at birth has negative and significant effects on entrepreneurial activity in the 20, 40, and 60 years. Thus, the higher the life expectancy at birth, the lower will be the level of entrepreneurial activity.
As expected, the pseudo R2 and adjusted R2 become higher with increased quantile value. Therefore, for higher levels of the conditional distribution of entrepreneurial activity, the model’s explanatory power is reinforced. The model is found to adjust well to the data, and as the sample is of 315 observations, this R2 can be considered acceptable.
Concerning Model 2, whose differentiating element is the inclusion of the crisis dummy, the results are similar, with small changes in the coefficients and in the loss or gain of significance. Taking quantile 20 as a reference, the INFDI variable is statistically significant to 10% and the LIFE variable became statistically significant at 5%. Regarding quantile 40, gains of significance are found in relation to the AGE variable, which is now significant at 1%. The PATPC_LAG1 variable now shows a non-significance, taking Q60 as a reference. In quantile 80, HOUSEHOLD is significant at 1% and EDUCATION is no longer statistically significant. However, the coefficient of the control variable (DCRISIS) is negative, as expected, and significant for quantile 60 and 80, at 5% and 1%, respectively.
The adjusted R2 has changed to a slightly higher value, given the inclusion of a control variable showing statistical significance for Q60 and Q80.
Models 3 and 4 (cf. Table 11) include the control variable referring to the condition of developed or developing country, based on the WESP (2014) classification. In order to capture the effects that the different conditions of the countries in the sample can have on the distribution of entrepreneurial activity, a dummy variable was created to represent the status of developed country (value 1) and developing country (value 0).
In Model 3, including the new control variable means a loss of significance in relation to the corruption perceptions index. This index is no longer statistically significant for any quantile. However, the perception of the corruption squared index has negative effects and the cubic transformation of the same index denotes positive effects, both significant at 10%.
Free trade, considered as an institutional determinant factor, has no statistical significance for any of the quantiles of the TEA distribution.
Regarding the PATPC variable, for higher levels of entrepreneurial activity, this ratio shows positive and very significant effects (Q98). FDI has positive and very significant effects at the 1% level for most quantiles, except for Q98 of the third model, which presents significance at 5%.
Unemployment shows negative and significant effects for most quantiles of the distribution of entrepreneurial activity, except for Q20. The age dependency ratio variable has negative and significant effects across the distribution of TEA. The HOUSEHOLD variable has positive and significant effects for quantiles 60; 80; and 98 of the distribution of entrepreneurial activity.
The education index shows the expected results, for the entire distribution of TEA, there are positive and statistically significant effects. The LIFE variable, with the inclusion of dummy, presents contradictory results compared to the previous models, that is, for all the quantiles of the sample, the average life expectancy at birth presents positive and significant results.
As for the development dummy, this has negative and very significant effects all at 1%, and so the more developed countries are, the less likely they are to increase entrepreneurial activity.
Therefore, the countries under analysis that are grouped according to the criterion provided by WESP (2014), denote interesting results, from which it can be retained that the more developed the countries are, the less prone they will be to develop further entrepreneurial activity flows.
This set of results is aligned with the vision of Minniti et al. (2005), according to which the objectives of countries with high income levels, are essentially to maintain competitiveness levels; support companies with high added value and great growth potential; and develop its innovative capacity. In many of these countries, government policies are created to create efficient mechanisms for companies already installed to survive and grow in their business area, so that they try to increase their export levels. The same authors argue that countries with the average income level must create measures and mechanisms to support the adoption of new technologies and an entrepreneurial culture. Many of these countries choose to create measures to encourage the creation of new entrepreneurial activities; promote adoption measures for new innovations and new technologies, mainly through tax reductions; monetary incentives to create potential businesses; credit facilities; low interest rates, among other measures to encourage the creation of new businesses and an entrepreneurial culture mainly in developing countries.
The adjusted R2 and the pseudo R2 improve through including this control variable, shown by the significance and the effects observed in the distributions of entrepreneurial activity. Therefore, in this model, the explanatory variables show greater explanatory power of the dependent variable, as there are increases in the values of the adjusted R2 and the pseudo R2.
Referring to the results of Model 4, there are few changes in the coefficients and significances obtained for Model 3. Both control variables were included in this new model.
Taking the CPI variable first, it is still not statistically significant for any quantile of the distribution of entrepreneurial activity. CPI2 and CPI3 are statistically significant for the maximum quantile of the TEA distribution. The HOUSEHOLD in the fourth model becomes significant at 10% for Q40.
The crisis dummy continues to show a negative impact, with statistical significance for Q40, Q80, and Q98, while the development dummy is also negative as in the previous model and always very significant at 1%.
As expected, the pseudo R2 and adjusted R2 become higher with increased quantile value. Therefore, for higher levels of the conditional distribution of entrepreneurial activity, the model’s explanatory power is reinforced.
Concerning the global results of the four models, it is underlined that DTEA shows positive and significant effects (mostly at 1% significance), and coefficients with considerable values in all quantiles, leading to the conclusion that the greater entrepreneurial activity in the past, the greater it will be in the present. This is recurrent in all the models, so with inclusion of the control variables, the result presented above is ratified.
4.3.2. Results of the Robustness Tests
Table 12 and Table 13 present the results of the symmetry and equality tests, in order to assess the robustness of the results obtained for the different quantiles of conditional distribution of entrepreneurial activity (TEA).
In performing the symmetry test, three different pairs of quantiles are considered (2–98; 20–80; and 40–60), for the model without control variables and the model with both control variables.
For the first model, the results indicate that the unemployment variable shows significant and positive effects, only in the symmetry pair (2–98).
In the last model, the INFDI variable has negative and significant coefficient in pairs of symmetry (2–98 and 40–60). The PATPC_LAG1 variable has positive and significant coefficient in the quantile pairs (20–80 and 40–60).
The Wald test is only significant at 10% for the model with the control variables.
Table 13 presents the results of the equality test for the quantile regression model.
Application of the Wald test provides very robust results, all significant at 1%. The equality test shows the differences between the quantile pairs studied, revealing that they are mostly very different.
In the model without control variables, in the equality pair (20–40), the age shows positive and significant coefficient. In the next pair (40–60), the unemployment variable presents positive and significant effects and HOUSEHOLD variable must negative and significant effects at 5%, respectively. In the pair (60–80), CPI3 and PATPC_LAG1 show negative and positive significant effects. High−lighted in the last equality pair are the positive effects at 10% of AGE. The HOUSEHOLD and THE INFDI presents negative and significant effects at 1% and 10%, respectively.
In the last model with the control variables, in relation to the first equality pair (20–40), unemployment and AGE presents positive effects at 5% and 1%, respectively. In the pair (40–60), PATPC_LAG shows a negative and significant effect and UNEM presents positive and significant effects at 5%. In the pair (60–80), HOUSEHOLD shows negative and significant effects and DCRISIS presents positive and significant effects, both at 10%.
In the last equality test (80–98), DTEA presents positive and significant effects at 10%. The unemployment variable shows positive and significant effects at 1%.
4.3.3. Estimates with Confidence Intervals
Now, the estimates of the parameters of the quantile regression of the fourth model are presented, with confidence intervals of 95%, for the determinant factors: institutional; economic and socio-economic; of entrepreneurial activity.
Axis x presents the quantile studied in relation to the distribution of entrepreneurial activity, and axis y shows the values of the coefficients of the independent variables and the control variables for the respective quantiles. Therefore, the blue lines represent the estimates of the model’s parameters and the red lines correspond to the area of the 95% confidence interval (Figure 1).
4.4. Discussion and Summary of the New Evidence
The results obtained in relation to institutional factors agree with previous empirical evidence. However, there is new evidence of the negative and significant effects of the corruption and positive and significant effects of the free trade, meaning that H1 and H2 cannot be rejected. This indicates that more efficient state control will allow reaching higher levels in these indicators, leading to improvements in the business environment and an increased rate of entrepreneurial activity in countries, in the line defended by Glaeser and Saks (2006), Anokhin and Schulze (2009), and Ojeka et al. (2019).
Free trade and the corruption perceptions index present robust results, in that when flexibility is increased and barriers to international trade are lowered (Simón-Moya et al. 2014; Albulescu et al. 2016), together with greater efficiency in controlling corruption, it is possible to achieve higher levels of entrepreneurial activity. Countries should therefore combat the corruption phenomenon, to improve the efficiency of institutional channels of information transmission and ensure greater transparency of institutions (Glaeser and Saks 2006; Ojeka et al. 2019).
With expansion of the free trade index, it is possible to improve the economy’s effectiveness, obtain and introduce innovations, increase technological progress and thereby make countries more stable and sustainable in macroeconomic terms (Simón-Moya et al. 2014; Albulescu et al. 2016; Youssef et al. 2017).
The strong and significant evidence obtained here corroborates the expected positive effect of the patent to real GDP per capita ratio on entrepreneurial activity, also leading to non-rejection of H3. Therefore, the State should ensure the adoption of new, improved measures, so as to attract even more and better innovations, to increase entrepreneurial activity and originate more economic growth. This being so, the interconnection between innovations and economic growth contributes to increased entrepreneurial activity in countries (Castaño et al. 2015; Acs et al. 2018; Tunali and Sener 2019).
It is very important for companies to have competitive advantages in relation to entrepreneurial activity and innovations. However, for countries and their companies to achieve advantages, in comparative terms, it is necessary to optimize strategies and public policies that can contribute to greater effectiveness of governments and countries’ ecosystems (Pradhan et al. 2020). Innovation has an essential role in the vitality of global economies, but it is necessary to implement the most effective measures to promote greater benefits for the population. Innovations allied to entrepreneurship can create more jobs, a higher quality of life and improve countries’ competitiveness in global terms.
Concerning the results obtained for INFDI, this is found to have positive effects on entrepreneurial activity in the 21 countries studied in the period 2003–2018, which also means non-rejection of H4. This type of investment is used as a mechanism of technological progress, but it is up to governments to create measures with high quality information to try to capture greater flows of this investment (Alfaro et al. 2009; Anokhin and Schulze 2009; Herrera-Echeverri et al. 2014). In the line proposed by Stiglitz (2000), increased FDI is a strong mechanism to improve international trade, being positively correlated with institutions’ quality.
As for unemployment, this has a negative effect on entrepreneurial activity, i.e., with increased unemployment, entrepreneurial activity is expected to diminish (Audretsch and Fritscht 1994), meaning H5 is not rejected. The result obtained here may be explained by the data panel containing mostly developed countries (71%), as sometimes in these more advanced countries rates of entrepreneurial activity are not so high, due to the co-existence of good social protection and strong aversion to risk, with the effects of unemployment being apparently unlike those experienced in less developed countries (Audretsch and Fritscht 1994; Simón-Moya et al. 2014).
The age dependency ratio leads to the non-rejection of the H6 hypothesis, since it presents the expected results, that is, negative and significant effects on entrepreneurial activity, which is in line with the studies conducted by Lévesque and Minniti (2006), Kurek and Rachwal (2011), and Guimarães and Tiryaki (2020). The larger the proportion of younger or elderly population depends on the active population, the lower will be the entrepreneurial activity. However, there are still gaps to be addressed in the areas of public policies that lead to greater social inclusion of older populations, making them more proactive and integrated into society, promoting the entrepreneurial activity of this age group.
As regards to the variable that controls the final expenditure stemming from household consumption, it denotes positive and significant effects on entrepreneurial activity, as happened with Ligthelm (2010). Therefore, H7 is not rejected for the sample under study.
Education is a significant determinant factor for the emergence of new entrepreneurial activities. Therefore, the increase in the schooling of the population has positive effects on entrepreneurial activity (Boubker et al. 2021). This result points in the sense of non-rejection of H8.
Life expectancy at birth has a negative and significant effect on entrepreneurial activity. Lévesque and Minniti (2006) point out that as the elderly population increases, labour productivity and the emergence of new entrepreneurs tend to decline. Guimarães and Tiryaki (2020) argue that the increase in average life expectancy has negative impacts on the sustainability of public budgets, through increasing public spending on health and social support. It should be noted that H9 is not rejected, bearing in mind the results obtained in this quantile regression model.
Regarding the control variables, it is noted that the crisis dummy shows a negative coefficient, as expected, but it is not significant for any distribution of TEA. However, the developed/developing country dummy shows negative and very significant effects. This leads to the conclusion that the more developed a country, the less likely it is to develop entrepreneurial activity, as was expected.
It is also expected that with the creation of new companies in countries which already have some diversity of business, positive externalities arise for new firms, and so they can benefit from the existing knowledge, technology, and innovation in those already established. These externalities will bring about various benefits for market competition; the quality of products and the companies themselves (Stel et al. 2005; Pradhan et al. 2020).
In relation to countries’ competitive advantages, these must exist in order to allow positive effects on the quality and efficiency of business environments, contributing to stronger information channels, a more qualified workforce and increased technological progress (Pradhan et al. 2020). Therefore, countries must be able to generate added value in various areas of entrepreneurial activity and in this way have competitive advantages over rivals.
Table 14 presents a summary of the research hypotheses, contrasting previous and new evidence.
4.4.1. Contrasting Developed vs. Developing Countries
For contrasting purposes, several empirical findings are presented concerning the different types of countries include in the sample, for the 2003–2018 period.
In order to control and observe the effects that the different conditions of the countries in the sample can have on the distribution of entrepreneurial activity, a dummy was created to represent the status of developed country (value 1), and developing country (value 0).
Table 15 and Table 16 show the three models, divided from the perspective of the institutional, economic, and socio-economic determinant factors, incorporating the interaction terms related to each group of factors, i.e., the explanatory variables to be multiplied by the dummy of developed country and developing country status.
In relation to model 5, with the inclusion of terms of interaction referring to the two institutional factors, corruption perception index and freedom of trade, it can be concluded that the condition of developed country only accelerates the positive effect of freedom of trade on the total entrepreneurial activity, in quantile 20 and 40, both at 10% significance.
With regard to the model with economic factors, it should be noted that the dummy referring to the status of developed countries and developing countries, catalyses the intensity of innovation for the quantile 60 and 80 to 1% significance, as well as it accelerates the inward FDI for the quantile 20 and 60 to 5% of statistical significance, and for the quantile 40 to 1% of significance.
In the latter model, it is important to highlight the accelerating effects that developed country status causes on the age dependency ratio, in all quantiles, mostly at 1% significance, except for quantile 80. The same condition as a developed country restrains the behaviour of the education index for quantile 40, to 5% of statistical significance. Furthermore, the country-condition dummy also restrains the relationship between life expectancy at birth and entrepreneurial activity in the generality of quantiles, with the exception of Q98.
Thus, it can be concluded that the more developed, the economies of the countries have a lower propensity for the development of entrepreneurial activity.
For countries whose economies are developing, these have positive effects in capturing higher rates of entrepreneurial activity, as expected. For example, countries such as South Africa; Argentina; Brazil; China; and Mexico, need to develop new generation public policies aimed at enhancing the competitiveness of their entrepreneurial and innovative ecosystems, as well as the quality and efficiency of business environments, thereby ensuring sustainable competitive advantages over countries with more developed economies.
4.4.2. Evaluating the Quantile Regression
The quantile regression model allows analysing the different types of effects of explanatory variables, along the distribution of the explained variable. Thus, this empirical study contributes in a differentiated way to the advancement of knowledge about the effects of institutional, economic, and socio-economic determinants, along the distribution of entrepreneurial activity.
According to the results obtained in Table 1, Table 2, Table 3 and Table 4 of the quantile regression, it is possible to observe that the effects of independent variables along the distribution of the dependent variable (TEA) are very robust, that is, when the distribution of TEA increases from quantile to quantile, the significance and effects obtained from explanatory variables are relevant, being in line with the expected results (cf. Table 14).
In summary, for higher levels of the TEA distribution, the evidence shows to have a high explanatory power and robustness, which provides an extensive basis of empirical findings, of a global dimension, applicable to both developed and developing countries. Overall, in order to increase entrepreneurial activity, countries should stimulate innovative capacity, household income and the quality of their institutional and business environments.
5. Concluding Remarks
5.1. Empirical Findings
Regarding the first of the institutional factors studied here, countries should control corruption, to be more effective institutionally and convey more trust. When countries’ institutions are more efficient, this will give rise to higher levels of entrepreneurial activity and more new firm creations. It is therefore up to economic policy-makers to focus on this area and implement the most correct measures, in order to make countries less corrupt (Glaeser and Saks 2006; Anokhin and Schulze 2009; Ojeka et al. 2019).
Addressing the second institutional factor linked to economic diplomacy and international trade, it is concluded that the higher the free trade index, the greater countries’ entrepreneurial activity. However, the State must strive to improve this index, creating norms to try to attract even more trade, originate more entrepreneurial activity and more firm creation, thereby creating more innovation flows and economic growth (Simón-Moya et al. 2014; Albulescu et al. 2016; Youssef et al. 2017).
Regarding the variables selected to measure the institutional environment, as institutional determinants were selected, corruption and free trade, mainly due to the lack of data for the 21 countries under study, in the 2003–2018 period.
The study of socio-economic factors is in line with what is set out in the most recent global report from the Global Entrepreneurship Monitor (GEM 2019/2020), indicating as a guideline the stylized fact that entrepreneurial activity is a powerful enabler of countries’ sustainable economic growth, as a viable solution to combat poverty and social inequality. Another fact to retain is that entrepreneurial activity, in some countries, is extremely innovative (for example, in Canada, Colombia, Guatemala, Ecuador, Panama, Chile, and the United Arab Emirates), i.e., one in twenty adults in these countries begins a business based on innovative products or services (GEM 2019/2020).
Taking as a reference the empirical findings presented here, the ratio of patents to GDP per capita increases entrepreneurship, and so the more innovative countries are, the more they will grow, sustainably, and more entrepreneurial activity will be created (Castaño et al. 2015; Acs et al. 2018; Tunali and Sener 2019).
Concerning inward FDI, this produces positive and very significant effects on entrepreneurial activity (Herrera-Echeverri et al. 2014), and for that reason, this type of investment is essential for economic growth, being considered as a driver of technological transfer between countries. Therefore, the more FDI attracted, the more technology and innovations will be produced (Anokhin and Schulze 2009), attaining higher levels of technological progress and expanding the technological frontier of possibilities for countries’ production and consumption.
Unemployment restricts entrepreneurial activity, and the explanation for this arises from the fact that the data panel is made up mostly of developed countries (Audretsch and Fritscht 1994). More developed countries do not tend to achieve high levels of entrepreneurial activity, and so this result is expected considering the total of 16 developed and 5 developing countries in the data panel used here.
The upward trend of life expectancy and the age dependency ratio play an important role in the sense that countries need to create policy measures for (pro)active ageing, that is, promoting senior entrepreneurship and ensuring inclusion of the elderly in social, cultural, civic, and citizenship participation (Jackson 2000; Kurek and Rachwal 2011).
The importance of education along life is one of the key-factors for countries to create and develop their entrepreneurial activity capacity (Boubker et al. 2021).
5.2. Implications and Recommendations
In terms of the implications of this study, most of the evidence converges on revealing the need to develop a new generation of public policies and operational measures, oriented towards improving the quality of institutions and raising countries’ institutional effectiveness. One of the most imperative measures is to control corruption, to ensure greater entrepreneurial activity, flows of innovation and technological progress. In this way, countries can increase their rates of economic growth and harmonize levels of well-being.
In a related vein, Aidis et al. (2008) studied the effects of institutional weaknesses on entrepreneurship. The same authors concluded that there are low levels of entrepreneurship in Russia, especially due to institutional weaknesses. Therefore, those who benefit and take advantage of these effects are entrepreneurs already installed in their different business areas, because the opportunities and motivations for the increase of new entrepreneurs in the business system of Russia is quite scarce, however it is essential that the government establishes efficient measures that can stimulate new entrepreneurs to exploit new business opportunities (Radosevic and Yoruk 2013). There is a need to design and implement new public policies focused on different valences, such as resources, liaisons, dynamic capabilities, competences, and skills for entrepreneurship, because some countries that intend to create an efficient entrepreneurial ecosystem face a number of limitations in terms of these valences (Junior et al. 2020).
In developing countries, economic policy-makers should be aware of the adversities and discrepancies of indicators, and create supporting measures, thereby stimulating entrepreneurial activity, technological progress, and innovations, which can contribute to more sustainable creation of wealth.
From the empirical evidence found here, it is recommended that governments should improve the regulation and control of countries’ institutional environments. Besides this need for improvement, new incentives should be created, aiming to stimulate R&D activities and in this way, develop activities oriented towards creating new forms of qualified entrepreneurship (e.g., knowledge-based firms), registering new patents from new firms and the essential introduction of innovations.
Policy-makers play a vital role in ensuring the sustainable growth of their economies, and typically analyse and take action on production, for providing an increase in well-being to the population and thus leading to increases in household consumption (OECD 2020).
However, there are persisting gaps in addressing policies that lead to the rates of employability and entrepreneurial activity of older people, making them more (pro)active and integrated in society, and thus contributing to the increase in the rate of entrepreneurial activity of this age group (Kurek and Rachwal 2011; Guimarães and Tiryaki 2020).
With this new evidence, it is also recommended that developing countries should concentrate on measures to promote innovation, giving more incentives especially to female entrepreneurs, in order to stimulate new business creation and the adoption of new technology, to improve the population’s standard of living and combat social and gender inequality, which is still prevalent and becomes more obvious at times of serious economic, political, social, and public health crises.
5.3. Limitations
This study has several limitations, arising fundamentally from the data-collecting process. Some of these refer to the GEM data, which in some countries studied and others that could have been included present shortcomings in some years. Another is the number of explanatory variables, which could be greater, but sometimes the model’s explanatory power reveals greater weakness and is therefore less viable. This study analyses the direct effects of a limited number of determinant factors, both institutional, economic, and socio-economic, on entrepreneurial activity in developed and developing countries. It is therefore suggested that this limitation can be addressed in the future, including other types of factors: cultural; historical; political; geographical; demographic; financial; ethnic; religious; etc. For example, the use of socio-cultural variables could contribute to better explanation and clarification of the effects on entrepreneurial activity. Furthermore, the sample in this study is not particularly large, in terms of the number of countries and years, and so it would be interesting to use other variables and from other countries to be able to explore empirically a longer period of time.
Adding to the previous, it should be noted that, in an embryonic analysis of the present investigation, the variable Human Development Index was included as an explanatory variable, but it raised some problems regarding the correlation matrix (high correlation pairs with the variables trade freedom and corruption). This index would be very relevant to contrast the countries in the sample, especially, in terms of economic policy choices and regulatory actions, through its three dimensions: (i) average life expectancy; (ii) number of years of schooling; and (iii) standard of living; however, it was not possible to operationalize it in the context of the present empirical study, which is here addressed as a limitation that could be surpassed in future research using disaggregated data.
5.4. Future Research
The proposals for future research arise from the limitations of this study and could lead to different empirical conclusions related to entrepreneurial activity and its central element, i.e., the entrepreneur.
At present, the world is facing a sudden economic, financial, social, and sanitary crisis with many effects on our lives, all due to a mutating virus (Covid-19), which has already claimed thousands of human victims worldwide. Therefore, various studies will be necessary to capture the impacts of this virus on different determinant factors and in many countries. A proposal for future study following on from this one would be to use a variable to control and capture the impacts on entrepreneurial activity. At this moment, there are many measures to help companies’ financial health, but not all firms will manage to survive the major economic and social crisis that has arisen in a short period of time. Indices linked to entrepreneurship will show very negative impacts, and a suggestion is to study the determinant factors of survival and exit, especially regarding micro-firms.
Consequently, new research is suggested, attempting to address the following questions:
- What are the effects of rising unemployment rates and the difficulties already felt in attracting FDI on entrepreneurial activity and technological innovation?
- What are the effects of government measures implemented in the course of the pandemic and the post-pandemic to help the survival of micro-firms and ensure new innovation clusters?
Considering the inspiring research line followed by Radosevic and Yoruk (2013), in future studies, it would be interesting to be able to operationalize, empirically, an approach of structural equations of the PLS-SEM type, to measure, in alternative terms, the nonlinear effects of different categories of determining factors, incorporating a higher level of disaggregation and detail to the institutional factors of flexible environments versus non-flexible environments for the development of entrepreneurial activity, in the context of entrepreneurial, innovative, and sustainable ecosystems.
Finally, this study provides a range of scientific evidence that can be used in decision-making processes and in designing efficient policies to promote institutional quality and good business environments, resorting to effective mechanisms to diminish corruption and increase free trade. If these factors are effective and countries are more competent institutionally, it is hoped they can become more efficient in socio-economic terms. It is necessary to create a new generation of public policies, to attract more friendly, quality FDI, and thereby promote new venture creation, technology transfer, new management practices, training, and qualification of human capital. This will lead to a fall in unemployment and allow development and sustainable economic growth.
Author Contributions
Conceptualization: J.L. and J.C.; methodology: J.L. and J.C.; redaction—original preparation of the draft: J.L. and J.C.; redaction—revision and edition: J.L. and J.C.; viewing: J.L. and J.C.; supervision: J.L. All authors have read and agreed to the published version of the manuscript.
Funding
This research received no external funding.
Institutional Review Board Statement
Not applicable.
Informed Consent Statement
Not applicable.
Data Availability Statement
The data were collected in the sources identified in the manuscript, and it is available upon request from the authors.
Acknowledgments
The authors acknowledge the highly valuable comments and suggestions provided by the editors and reviewers, which contributed to the improvement in the clarity, focus, contribution, and scientific soundness of the current study.
Conflicts of Interest
The authors declare there are no conflict of interest. The funders had no role in the design of the study; in the collection, analysis, or interpretation of data; in the writing of the manuscript, or in the decision to publish the results.
References
- Acs, Zoltan J., Erkko Autio, and László Szerb. 2014. National systems of entrepreneurship: Measurement issues and policy implications. Research Policy 43: 476–94. [Google Scholar] [CrossRef]
- Acs, Zoltan J., Saul Estrin, Tomasz Mickiewicz, and László Szerb. 2018. Entrepreneurship, institutional economics, and economic growth: An ecosystem perspective. Small Business Economics 51: 501–14. [Google Scholar] [CrossRef]
- Afonso, Tiago L., António C. Marques, and José A. Fuinhas. 2019. Energy-growth nexus and economic development: A quantile regression for panel data. In The Extended Energy-Growth Nexus: Theory and Empirical Applications, 1st ed. London: Academic Press, pp. 1–25. [Google Scholar]
- Aidis, Ruta, Saul Estrin, and Tomasz Mickiewicz. 2008. Institutions and entrepreneurship development in Russia: A comparative perspective. Journal of Business Venturing 23: 656–72. [Google Scholar] [CrossRef] [Green Version]
- Aitken, Brian J., and Ann E. Harrison. 1999. Do domestic firms benefit from direct foreign investment? Evidence from Venezuela. American Economic Review 89: 605–18. [Google Scholar] [CrossRef] [Green Version]
- Aiyar, Shekhar, Christian Ebeke, and Xiaobo Shao. 2016. The Impact of Workforce Aging on European Productivity. IMF Working Paper 16: 1–29. [Google Scholar] [CrossRef]
- Albulescu, Claudiu T., Matei Tămăşilă, and Ilie M. Tăucean. 2016. Entrepreneurship, Tax Evasion and Corruption in Europe. Procedia—Social and Behavioral Sciences 221: 246–53. [Google Scholar] [CrossRef] [Green Version]
- Aldieri, Luigi, and Concetto P. Vinci. 2017. Quantile Regression for Panel Data: An Empirical Approach for Knowledge Spillovers Endogeneity. International Journal of Economics and Finance 9: 106–11. [Google Scholar] [CrossRef] [Green Version]
- Alfaro, Laura, Sebnem Kalemli-Ozcan, and Selin Sayek. 2009. FDI, Productivity and Financial Development. The World Economy 32: 111–31. [Google Scholar] [CrossRef]
- Anokhin, Sergey, and William S. Schulze. 2009. Entrepreneurship, innovation, and corruption. Journal of Business Venturing 24: 465–76. [Google Scholar] [CrossRef]
- Aparicio, Sebastian, David Audretsch, and David Urbano. 2021. Why is export-oriented Entrepreneurship more prevalente in some countries than other? Contextual antecedentes and economic consequences. Journal of World Business 56: 101177. [Google Scholar] [CrossRef]
- Asteriou, Dimitrios, and Stephen G. Hall. 2011. Applied Econometrics, 2nd ed. New York: Palgrave Macmillan. [Google Scholar]
- Audretsch, David B., and Maryann P. Feldman. 1996. Innovative Clusters and the Industry Life Cycle. Review of Industrial Organization 11: 253–73. [Google Scholar] [CrossRef]
- Audretsch, David B., and Michael Fritscht. 1994. The Geography of Firm Births in Germany. Regional Studies 28: 359–65. [Google Scholar] [CrossRef]
- Audretsch, David B., and A. Roy Thurik. 2000. Capitalism and democracy in the 21st century: From the managed to the entrepreneurial economy. Journal of Evolutionary Economics 10: 17–34. [Google Scholar] [CrossRef]
- Bai, Jushan, and Serena Ng. 2005. Tests for skewness kurtosis and normality for time series data. Journal of Business and Economic Statistics 23: 49–60. [Google Scholar] [CrossRef] [Green Version]
- Baptista, Rui, and João Leitão. 2015. Entrepreneurship, Human Capital and Regional Development. Series: International Studies in Entrepreneurship; Berlin/Heidelberg: Springer. [Google Scholar]
- Barbosa, Natália, and Vasco Eiriz. 2009. The role of inward foreign direct investment on entrepreneurship. International Entrepreneurship and Management Journal 5: 319–39. [Google Scholar] [CrossRef]
- Baumol, William J. 2014. Stimulating growth amid recession: Entrepreneurship, innovation, and the Keynesian revolution. Journal of Policy Modeling 36: 629–35. [Google Scholar] [CrossRef]
- Beynon, Malcolm J., Paul Jones, and David G. Pickernell. 2019. The role of entrepreneurship, innovation, and urbanity-diversity on growth, unemployment, and income: US state-level evidence and an fsQCA elucidation. Journal of Business Research 101: 675–87. [Google Scholar] [CrossRef]
- Bohlmann, Clarissa, Andreas Rauch, and Hannes Zacher. 2017. A lifespan perspective on entrepreneurship: Perceived opportunities and skills explain the negative association between age and entrepreneurial activity. Frontiers in Psychology 8: 2015. [Google Scholar] [CrossRef]
- Boubker, Omar, Maryem Arroud, and Abdelaziz Ouajdouni. 2021. Entrepreneurship education versus management students´entrepreneurial intentions. A PLS-SEM approach. The International Journal of Management Education. Available online: https://0-www-sciencedirect-com.brum.beds.ac.uk/science/article/pii/S1472811720304171 (accessed on 19 January 2021).
- Breusch, Trevor S., and Adrian R. Pagan. 1980. The Lagrange multiplier test and its applications to model specification in econometrics. The Review of Economic Studies 47: 239–53. [Google Scholar] [CrossRef]
- Buchanan, Bonnie G., Quan V. Le, and Meenakshi Rishi. 2012. International Review of Financial Analysis Foreign Direct Investment and Institutional Quality: Some empirical evidence. International Review of Financial Analysis 21: 81–89. [Google Scholar] [CrossRef]
- Buchinsky, Moshe. 2012. Recent Advances in Quantile Regression Models: A Practical Guideline for Empirical Research. The Journal of Human Resources 33: 88–126. [Google Scholar] [CrossRef]
- Budsaratragoon, Pornanong, and Boonlert Jitmaneeroj. 2020. A critique on the Corruption Perceptions Index: An interdisciplinary approach. Socio-Economic Planning Sciences 70: 100768. [Google Scholar] [CrossRef]
- Bylund, Per L., and Matthew McCaffrey. 2017. A theory of entrepreneurship and institutional uncertainty. Journal of Business Venturing 32: 461–75. [Google Scholar] [CrossRef]
- Castaño, María-Soledad, María-Teresa Méndez, and María-Ángel Galindo. 2015. The effect of social, cultural, and economic factors on entrepreneurship. Journal of Business Research 68: 1496–500. [Google Scholar] [CrossRef]
- Castaño, María-Soledad, María-Teresa Méndez, and María-Ángel Galindo. 2016. The effect of public policies on entrepreneurial activity and economic growth. Journal of Business Research 69: 5280–85. [Google Scholar] [CrossRef]
- Chowdhury, Farzana, David B. Audretsch, and Maksim Belitski. 2019. Institutions and entrepreneurship quality. Entrepreneurship Theory and Practice 43: 51–81. [Google Scholar] [CrossRef] [Green Version]
- Cubico, Serena, Giuseppe Favretto, João Leitão, and Uwe Cantner, eds. 2018. Entrepreneurship along the Industry Life Cycle: The Changing Role of Entrepreneurial Activities and Knowledge Competencies. Series: Studies on Entrepreneurship, Structural Change and Industrial Dynamics; Heidelberg: Springer. [Google Scholar]
- Cumming, Douglas, Sofia Johan, and Minjie Zhang. 2014. The economic impact of entrepreneurship: Comparing international datasets. Corporate Governance: An International Review 22: 162–78. [Google Scholar] [CrossRef]
- Dreher, Axel, and Martin Gassebner. 2013. Greasing the wheels? The impact of regulations and corruption on firm entry. Public Choice 155: 413–32. [Google Scholar] [CrossRef] [Green Version]
- Eren, Ozkan, Masayuki Onda, and Bulent Unel. 2019. Effects of FDI on entrepreneurship: Evidence from Right-to-Work and Non-Right-to-Work States. Labour Economics 58: 98–109. [Google Scholar] [CrossRef]
- Erum, Naila, and Shahzad Hussain. 2019. Corruption, natural resources and economic growth: Evidence from OIC countries. Resources Policy 63: 101429. [Google Scholar] [CrossRef]
- Estrin, Saul, Julia Korosteleva, and Tomasz Mickiewicz. 2013. Which institutions encourage entrepre- neurial growth aspirations? Journal of Business Venturing 28: 564–80. [Google Scholar] [CrossRef] [Green Version]
- Evans, David S., and Linda S. Leighton. 1990. Small Business Formation by Unemployed and Employed Workers. Small Business Economics 2: 319–30. [Google Scholar] [CrossRef]
- Faria, João R., Juna C. Cuestas, and Luis Gil-Alana. 2009. Unemployment and Entrepreneurship: A Cyclical Relation? Economics Letters 105: 318–20. [Google Scholar] [CrossRef]
- Galindo, Miguel-Ángel, and María T. Méndez. 2014. Entrepreneurship, economic growth, and innovation: Are feedback effects at work? Journal of Business Research 67: 825–29. [Google Scholar] [CrossRef]
- Galvão, Anderson, João J. Ferreira, and Carla Marques. 2018. Entrepreneurship education and training as facilitators of regional development: A systematic literature review. Journal of Small Business and Enterprise Development 25: 17–40. [Google Scholar] [CrossRef] [Green Version]
- Global Entrepreneurship Monitor (GEM). 2019/2020. Global Report. London: Global Entrepreneurship Research Association, London Business School. [Google Scholar]
- Glaeser, Edward L., and Raven E. Saks. 2006. Corruption in America. Journal of Public Economics 90: 1053–72. [Google Scholar] [CrossRef]
- Goh, Kim-Leng, and Maxwell L. King. 1996. Modified Wald tests for non-linear restrictions: A cautionary tale. Economic Letters 53: 133–38. [Google Scholar] [CrossRef]
- Guimarães, Silvana D., and Gisele F. Tiryaki. 2020. The impact of population aging on business cycles volatility: International evidence. The Journal of the Economics of Ageing 17: 100285. [Google Scholar] [CrossRef]
- Hadi, Cholichul, Ismail S. Wekke, and Andi Cahaya. 2015. Entrepreneurship and Education: Creating Business Awareness for Students in East Java Indonesia. Procedia—Social and Behavioral Sciences 177: 459–63. [Google Scholar]
- Hausman, Jerry A. 1978. Specification tests in econometrics. Econometrica 46: 1251–71. [Google Scholar] [CrossRef] [Green Version]
- Herrera-Echeverri, Hernán, Jerry Haar, and Juan B. Estévez-Bretón. 2014. Foreign direct investment, institutional quality, economic freedom and entrepreneurship in emerging markets. Journal of Business Research 67: 1921–32. [Google Scholar] [CrossRef] [Green Version]
- Honig, Benson, and Tomas Karlsson. 2013. An Institutional Perspective on Business Planning Activities for Nascent Entrepreneurs in Sweden and the US. Administrative Sciences 3: 266–89. [Google Scholar] [CrossRef]
- Hoyos, Rafael De, and Vasilis Sarafidis. 2006. XTCSD: Stata Module to Test for Cross-Sectional Dependence in Panel Data Models. The Stata Journal 6: 482–96. [Google Scholar] [CrossRef] [Green Version]
- Im, Kyung S., Mohammad H. Pesaran, and Yongcheol Shin. 2003. Testing for unit roots in heterogeneous panels. Journal of Econometrics 115: 53–74. [Google Scholar] [CrossRef]
- Jaba, Elisabeta, Christiana B. Balan, and Joan-Bogdan Robu. 2014. The relationship between life expectancy at birth and health expenditures estimated by a cross-country and time-series analysis. Procedia Economics and Finance 15: 108–14. [Google Scholar] [CrossRef] [Green Version]
- Jackson, Stephen. 2000. Age concern? The geography of greying Europe. Geography 85: 366–69. [Google Scholar]
- Junior, Edmundo I., Eduardo A. Dionisio, Bruno B. Fischer, Yanchao Li, and Dirk Meissner. 2020. The global entrepreneurship index as a benchmarking tool? Criticisms from an efficiency perspective. Journal of Intellectual Capital 22: 190–212. [Google Scholar] [CrossRef]
- Keho, Yaya. 2016. Non-Linear Effect of Remittances on Banking Sector Development: Panel Evidence from Developing Countries. Theoretical Economics Letters 6: 1096–104. [Google Scholar] [CrossRef] [Green Version]
- Kinsella, Kevin, and David R. Phillips. 2005. Global aging: The challenge of success. Population Bulletin 60: 3–40. [Google Scholar]
- Koenker, Roger, and Gilbert Bassett. 1978. Regression Quantiles. Econometrica 46: 33–50. [Google Scholar] [CrossRef]
- Koenker, Roger, and Kevin F. Hallock. 2001. Quantile Regression. Journal of Economic Perspectives 15: 143–56. [Google Scholar] [CrossRef]
- Koenker, Roger, and José A. F. Machado. 1999. Goodness of Fit and Related Inference Processes for Quantile Regression Goodness of Fit and Related Inference Processes for Quantile Regression. Journal of the American Statistical Association 94: 1296–310. [Google Scholar] [CrossRef]
- Konings, Jozef. 2001. The effects of foreign direct investment on domestic firms. Economics of Transition 9: 619–33. [Google Scholar] [CrossRef] [Green Version]
- Kurek, Slawomir, and Tomasz Rachwal. 2011. Development of Entrepreneurship in ageing populations of The European Union. Procedia Social and Behavioral Sciences 19: 397–405. [Google Scholar] [CrossRef] [Green Version]
- Leitão, João, and Rui Baptista. 2009. Public Policies for Fostering Entrepreneurship: A European Perpective. Series: International Studies in Entrepreneurship; New York: Springer. [Google Scholar]
- Leitão, João, and Rui Baptista. 2011. Inward FDI and ICT: Are They a Joint Technological Driver of Entrepreneurship? International Journal of Technology Transfer and Commercialization 10: 268–88. [Google Scholar] [CrossRef]
- Leitão, João, Frank Lasch, and Roy Thurik. 2011. Globalization, Entrepreneurship and Regional Environment. International Journal of Entrepreneurship and Small Business 12: 129–38. [Google Scholar] [CrossRef]
- Lévesque, Moren, and Maria Minniti. 2006. The effect of aging on entrepreneurial behavior. Journal of Business Venturing 21: 177–94. [Google Scholar] [CrossRef]
- Levin, Andrew, Chien-Fu Lin, and Chia-Shang J. Chu. 2002. Unit root tests in panel data: Asymptotic and finite-sample properties. Journal of Econometrics 108: 1–24. [Google Scholar] [CrossRef]
- Ligthelm, André A. 2010. Entrepreneurship and small business sustainability. Southern African Business Review 14: 131–53. [Google Scholar]
- Maddala, Gangadharrao S., and Shaowen Wu. 1999. A Comparative study of unit root tests with panel data and a new simple test. Oxford Bulletin of Economics and Statistics 61: 631–52. [Google Scholar] [CrossRef]
- Minniti, Maria, William D. Bygrave, and Erkko Autio. 2005. Global Entrepreneurship Monitor: 2005 Executive Report. Wellesley, MA: Babson College. [Google Scholar]
- Moreno-Izquierdo, Luis, Antonio Rubia-Serrano, Jose F. Perles-Ribes, Ana B. Ramón-Rodríguez, and María J. Such-Devesa. 2020. Determining factors in the choice of prices of tourist rental accommodation. New evidence using the quantile regression approach. Tourism Management Perspectives 33: 100632. [Google Scholar] [CrossRef]
- Nandamuri, Purna P., and Ch Gowthami. 2013. The Impact of Household Income on Being A Potential Entrepreneur. SCMS Jounral of Indian Management 10: 75–85. [Google Scholar]
- North, Douglass C. 1990. Institutions, Institutional Change and Economic Performance. Cambridge: Cambridge University Press. [Google Scholar]
- Nunes, Paulo M., Zelia Serrasqueiro, and João Leitão. 2010. Are there nonlinear relationships between the profitability of Portuguese service SME and its specific determinants? The Service Industries Journal 30: 1313–41. [Google Scholar] [CrossRef]
- OECD. 2013. Household Consumption, in OECD Framework for Statistics on the Distribution of Household Income, Consumption and Wealth. Paris: OECD Publishing. [Google Scholar]
- OECD. 2019. Health at a Glance 2019: OECD Indicators. Paris: OECD Publishing. [Google Scholar]
- OECD. 2020. National Accounts of OECD Countries. Paris: OECD Publishing. [Google Scholar]
- Ojeka, Stephen, Alex Adegboye, Kofo Adegboye, Olaoluwa Umukoro, Olajide Dahunsi, and Emmanuel Ozordi. 2019. Corruption perception, institutional quality and performance of listed companies in Nigeria. Heliyon 5: e02569. [Google Scholar] [CrossRef]
- Pesaran, Mohammad H. 2004. General Diagnostic Tests for Cross Section Dependence in Panels. Cambridge: Cambridge Working Papers in Economics. [Google Scholar]
- Phillips, Peter C. B., and Pierre Perron. 1988. Testing for a unit root in time series regression. Biometrika 75: 335–46. [Google Scholar] [CrossRef]
- Pradhan, Rudra P., Mak B. Arvin, Mahendhiran Nair, and Sara E. Bennett. 2020. The dynamics among entrepreneurship, innovation, and economic growth in the Eurozone countries. Journal of Policy Modeling 42: 1106–122. [Google Scholar] [CrossRef]
- Radosevic, Slavo, and Esin Yoruk. 2013. Entrepreneurial propensity of innovation systems: Theory, methodology and evidence. Research Policy 42: 1015–38. [Google Scholar] [CrossRef]
- Riaz, Muhammad F., Nataliia I. Cherkas, and João Leitão. 2018. Corruption and Innovation: Mixed Evidences on bidirectional Causality. Journal of Applied Economic Sciences 8: 1–6. [Google Scholar]
- Rodriguez, Peter, Donald S. Siegel, Lorraine Eden, and Amy J. Hillman. 2006. Three Lenses on the Multinational Enterprise: Politics, Corruption and Corporate Social Responsibility. Journal of International Business Studies 37: 733–46. [Google Scholar] [CrossRef]
- Romer, Paul. 1997. The origins of endogenous growth. A Macroeconomics Reader 8: 3–22. [Google Scholar]
- Rusu, Valentina D., and Adina Dornean. 2019. The Quality of Entrepreneurial Activity and Economic Competitiveness in European Union Countries: A Panel Data Approach. Administrative Sciences 9: 35. [Google Scholar] [CrossRef] [Green Version]
- Salman, Doaa M. 2016. What is the role of public policies to robust international entrepreneurial activities on economic growth? Evidence from cross country study. Future Business Journal 2: 1–14. [Google Scholar] [CrossRef] [Green Version]
- Schumpeter, Joseph A. 1934. The Theory of Economic Development: An Inquiry into Profits, Capital, Credits, Interest, and the Business Cycle. Cambridge, MA: Harvard University Press. [Google Scholar]
- Shah, Rajiv, Zhijie Gao, and Harini Mittal. 2014. Innovation, Entrepreneurship, and the Economy in the US, China, and India: Historical Prespectives and Future Trends, 1st ed. Cambridge, MA: Academic Press. [Google Scholar]
- Shapiro, Samuel S., and Martin B. Wilk. 1965. An analysis of variance test for normality (complete samples). Biometrika 52: 591–611. [Google Scholar] [CrossRef]
- Shapiro, Samuel S., and Martin B. Wilk. 1968. Approximations for the null distribution of the W statistic. Technometrics 10: 861–66. [Google Scholar] [CrossRef]
- Simón-Moya, Virginia, Lorenzo Revuelto-Taboada, and Rafael F. Guerrero. 2014. Institutional and economic drivers of entrepreneurship: An international perspective. Journal of Business Research 67: 715–21. [Google Scholar] [CrossRef]
- Sine, Wesley D., and Robert J. David. 2003. Environmental jolts, institutional change, and the creation of entrepreneurial opportunity in the US electric power industry. Research Policy 32: 185–207. [Google Scholar] [CrossRef]
- Sine, Wesley D., and Robert J. David. 2010. Institutions and entrepreneurship. Research in the Sociology of Work 21: 1–26. [Google Scholar]
- Smallbone, David, and Friederike Welter. 2020. A Research Agenda for Entrepreneurship Policy. Northampton, MA: Edward Elgar Publishing Ltd. [Google Scholar]
- Solow, Robert. 1956. A contribution to the theory of economic growth. Quarterly Journal of Economics 70: 65–94. [Google Scholar] [CrossRef]
- Stam, Erik, Kashifa Suddle, Jolanda Hessels, and André V. Stel. 2009. High-Growth Entrepreneurs, Public Policies, and Economic Growth. Public Policies for Forestering Entrepreneurship chapter 5: 91–110. [Google Scholar]
- Stel, André V., Martin Carree, and Roy Thurik. 2005. The Effect of Entrepreneurial Activity on National Economic Growth. Small Business Economics 24: 311–21. [Google Scholar] [CrossRef] [Green Version]
- Stiglitz, Joseph E. 2000. Capital Market Liberalization, Economic Growth, and Instability. World Development 28: 1075–86. [Google Scholar] [CrossRef] [Green Version]
- Tavares, Aida. 2004. As Causas Sócio-culturais e Político-económicas da Corrupção: uma análise para vários países. Notas Económicas 5: 58–67. [Google Scholar] [CrossRef]
- Teixeira, Aurora A. C., and Wei Heyuan. 2012. Is human capital relevnt in attracting innovative foreign direct investment to China? Asian Journal of Technology Innovation 20: 83–96. [Google Scholar] [CrossRef]
- Tiberius, Victor, Meike Rietz, and Ricarda B. Bouncken. 2020. Performance Analysis and Science Mapping of Institutional Entrepreneurship Research. Administrative Sciences 10: 69. [Google Scholar] [CrossRef]
- Tunali, Cigdem B., and Sefer Sener. 2019. The Determinants of Entrepreneurship in Turkey. Procedia Computer Science 158: 648–52. [Google Scholar] [CrossRef]
- Turró, Andreu, David Urbano, and Marta Peris-Ortiz. 2014. Culture and innovation: The moderating effect of cultural values on corporate entrepreneurship. Technological Forecasting and Social Change 88: 360–69. [Google Scholar] [CrossRef]
- WESP. 2014. World Economomic Situation and Prospects: Country classification: Data sources, country classifications and aggregation methodolology. United Nations 14: 144–46. [Google Scholar]
- Wooldridge, Jeffrey M. 2002. Econometric Analysis of Cross Section and Panel Data. Cambridge, MA: The MIT Press. [Google Scholar]
- Youssef, Adel B., Sabri Boubaker, and Anis Omri. 2017. Entrepreneurship and sustainability: The need for innovative and institutional solutions. Technological Forecasting and Social Change 129: 232–41. [Google Scholar] [CrossRef]
- Zhang, Yue-Jun, Yan-Lin Jin, Julien Chevallier, and Bo Shen. 2016. The effect of corruption on carbon dioxide emissions in APEC countries: A panel quantile regression analysis. Technological Forecasting and Social Change 112: 220–27. [Google Scholar] [CrossRef]
Figure 1.
Behavior of the variables in the model with the two control variables and a confidence interval of 95%. Source: Own elaboration.
Figure 1.
Behavior of the variables in the model with the two control variables and a confidence interval of 95%. Source: Own elaboration.


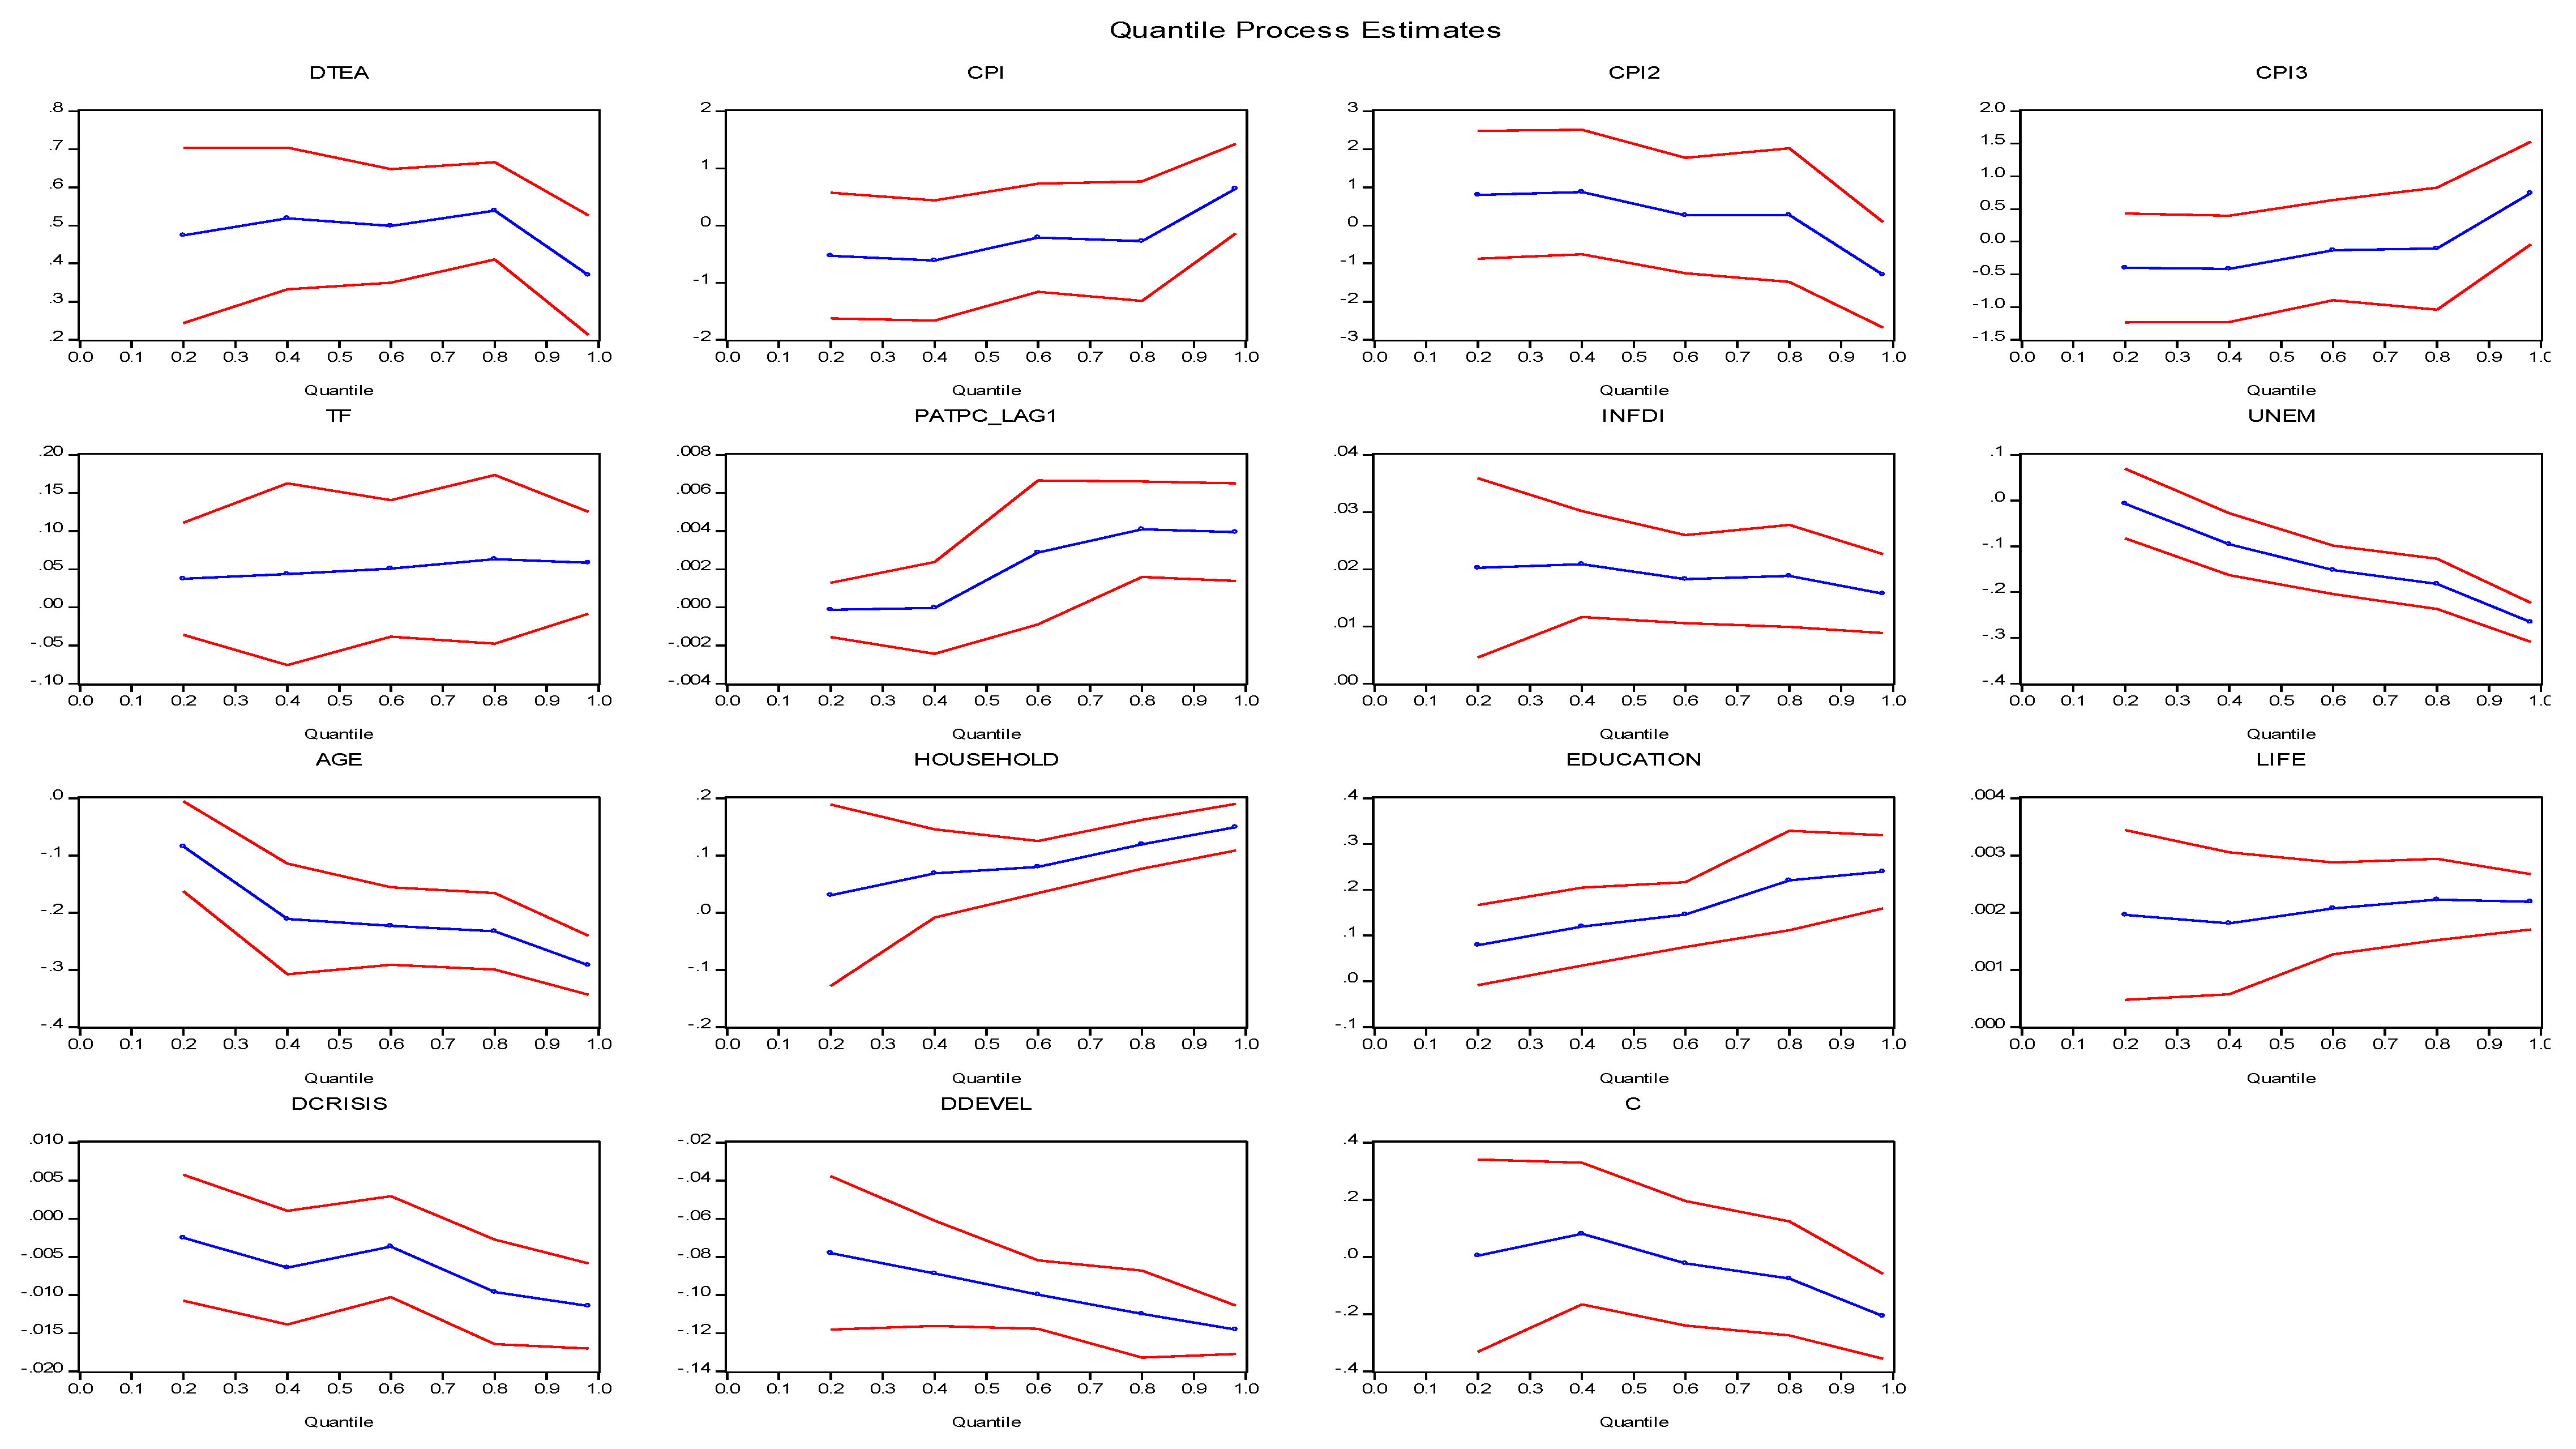
Table 1.
Distribution of countries according to WESP criteria.
| Developed Countries | Developing Countries |
|---|---|
| Germany | South Africa |
| Croatia | Argentina |
| Slovenia | Brazil |
| Spain | China |
| United States of America | Mexico |
| Finland | |
| France | |
| Greece | |
| Hungary | |
| Ireland | |
| Italy | |
| Japan | |
| Norway | |
| Netherlands | |
| United Kingdom | |
| Sweden |
Source: Own elaboration.
Table 2.
Variables: description and sources.
| Variables | Determinants | Description | Data Sources |
|---|---|---|---|
| TEA | Rate of entrepreneurial activity in the initial state. | Global Entrepreneurship Monitor | |
| CPI | Institutional | Corruption perceptions index. | Transparency International |
| FT | A measure formed by the absence of tariff and non-tariff barriers that affect the import and export of goods and services. | Heritage Database | |
| PATPC_LAG1 | Economic | Lagged ratio of total number of patents (direct entries and national PCT) to gross domestic product per capita constant lcu. | WIPO Statistics Database and World Development Indicators |
| INFDI | Stock of foreign direct investment entries as % of GDP. | Unctadstat | |
| UNEM | Socio-economic | Total unemployment as a % of the total workforce. | World Development Indicators |
| AGE | People younger than 15 or older than 64 that are dependent of to the working-age population. Proportion of dependents per 100 working-age population. | World Development Indicators | |
| HOUSEHOLD | Households and NPISHs’ final consumption expenditure (% of GDP) | World Development Indicators | |
| EDUCATION | Education index is an average of mean years of schooling (of adults) and expected years of schooling (of children), both expressed as an index obtained by scaling with the corresponding maxima. | Human Development Data Center | |
| LIFE | Number of years a new-born infant could expect to live if prevailing patterns of age-specific mortality rates at the time of birth stay the same throughout the infant’s life. | Human Development Data Center | |
| DCRISIS | Dummies | Crisis dummy. | Own elaboration |
| DDEVEL | Development dummy. | Own elaboration |
Source: Own elaboration.
Table 3.
Descriptive Statistics.
| Variables | Descriptive Statistics | |||||||
|---|---|---|---|---|---|---|---|---|
| Obs | Mean | Coefficient of Variation | Min. | Max. | Jarque-Bera | Skewness | Kurtosis | |
| TEA | 336 | 0.0793 | 0.51198 | 0.0148 | 0.2401 | 122.933 | 1.2991 | 4.425 |
| DTEA | 315 | 0.00104 | 20 | −0.1138 | 0.0964 | 708.403 | −0.8562 | 10.1443 |
| CPI | 336 | 0.6175 | 0.329879 | 0.25 | 0.97 | 28.0846 | −0.0681 | 1.5902 |
| FT | 336 | 0.8133 | 0.094012 | 0.506 | 0.894 | 183.135 | −1.499 | 5.0232 |
| PATPC_LAG1 | 315 | 1.3844 | 2.278677 | 0.003028 | 23.67596 | 7273.265 | 4.2321 | 24.9661 |
| INFDI | 336 | 0.40798 | 0.981813 | 0.02014 | 3.05778 | 3953.74 | 3.4576 | 18.3164 |
| UNEM | 336 | 0.08957 | 0.660936 | 0.02445 | 0.32456 | 319.187 | 1.8461 | 6.0276 |
| AGE | 336 | 0.5121 | 0.103476 | 0.364897 | 0.674291 | 18.90305 | −0.386124 | 3.918622 |
| HOUSEHOLD | 336 | 0.5568 | 0.161422 | 0.310226 | 0.707723 | 18.8731 | −0.565471 | 2.601351 |
| EDUCATION | 336 | 0.8073 | 0.120401 | 0.522 | 0.943 | 35.51182 | −0.817561 | 2.81013 |
| LIFE | 336 | 78.1863 | 0.068162 | 53.4 | 84.5 | 1149.202 | −2.551263 | 10.8463 |
| CPI2 | 336 | 0.42269 | 0.593106 | 0.0625 | 0.9409 | 27.0296 | 0.2239 | 1.6846 |
| CPI3 | 336 | 0.31152 | 0.79706 | 0.0156 | 0.91267 | 28.15 | 0.5034 | 2.0014 |
| DCRISIS | 336 | 0.125 | 2.64968 | 0 | 1 | 426.286 | 2.2678 | 6.1428 |
| DDEVEL | 336 | 0.7619 | 0.55985 | 0 | 1 | 88.0272 | −1.2298 | 2.5125 |
Source: Own elaboration.
Table 4.
Correlation coefficient matrix.
| 1. | 2. | 3. | 4. | 5. | 6. | 7. | 8. | 9. | 10. | 11. | |
|---|---|---|---|---|---|---|---|---|---|---|---|
| 1.TEA | 1.0000 | ||||||||||
| 2.CPI | −0.4775 *** (0.0000) | 1.0000 | |||||||||
| 3.FT | −0.4668 *** (0.0000) | 0.5991 *** (0.000) | 1.0000 | ||||||||
| 4.PATPC_LAG1 | 0.2257 *** (0.0001) | −0.0464 (0.4118) | −0.1314 ** (0.0197) | 1.0000 | |||||||
| 5.INFDI | 0.0116 (0.8381) | 0.2713 *** (0.0000) | 0.3125 *** (0.0000) | −01878 *** (0.0008) | 1.0000 | ||||||
| 6.AGE | −0.2821 *** (0.0000) | 0.1968 *** (0.0004) | 0.1759 *** (0.0017) | −0.3948 *** (0.0000) | 0.0082 (0.8844) | 1.0000 | |||||
| 7.HOUSEHOLD | 0.0654 (0.2474) | −0.3976 *** (0.0000) | −0.1331 ** (0.0181) | −0.2283 *** (0.0000) | −0.4188 *** (0.0000) | 0.3396 *** (0.0000) | 1.0000 | ||||
| 8.EDUCATION | −0.4260 *** (0.0000) | 0.7720 *** (0.0000) | 0.6825 *** (0.0000) | −0.1497 *** (0.0078) | 0.3024 *** (0.0000) | 0.3232 *** (0.0000) | −0.1544 *** (0.0060) | 1.0000 | |||
| 9.LIFE | −0.3237 *** (0.0000) | 0.5017 *** (0.0000) | 0.5211 *** (0.0000) | −0.0069 (0.9031) | 0.0758 (0.1796) | 0.1858 *** (0.0009) | −0.1873 *** (0.0029) | 0.5708 *** (0.0000) | 1.0000 | ||
| 10.UNEM | −0.1230 ** (0.0290) | −0.2981 *** (0.0000) | −0.0772 (0.1714) | −0.2120 *** (0.0001) | 0.0152 (0.7878) | 0.0677 (0.2310) | 0.3210 *** (0.0000) | −0.1888 *** (0.0008) | −0.4707 *** (0.0000) | 1.0000 | |
| 11.DTEA | 0.2167 *** (0.0001) | 0.0453 (0.4225) | 0.0560 (0.3214) | −0.0492 (0.3843) | 0.0483 (0.3928) | −0.0192 (0.7339) | −0.0231 (0.6835) | 0.0131 (0.8164) | −0.0114 (0.8400) | 0.0010 (0.9852) | 1.0000 |
Legend: *** 1% significance; ** 5% significance. All the variables are presented in levels, except for DTEA, which is presented in first differences. Source: Own elaboration.
Table 5.
VIF test.
| Dependent Variable—TEA Variables | Variance Inflation Factor (VIF) | ||
|---|---|---|---|
| VIF | 1/VIF | Mean of VIF | |
| DTEA | 1.01 | 0.987490 | |
| CPI | 3.38 | 0.296039 | |
| FT | 2.23 | 0.447789 | |
| PATPC_LAG1 | 1.33 | 0.751282 | |
| INFDI | 1.56 | 0.640276 | |
| UNEM | 1.56 | 0.640261 | |
| AGE | 1.54 | 0.650561 | |
| HOUSEHOLD | 2.09 | 0.479042 | |
| EDUCATION | 3.68 | 0.271929 | |
| LIFE | 2.09 | 0.447789 | |
| 2.05 | |||
Source: Own elaboration.
Table 6.
Unit root tests.
| Variables | Tests | ||
|---|---|---|---|
| LLC | IPS | PP | |
| TEA | −3.3110 *** | −1.476 * | 8.0564 *** |
| DTEA | −11.6089 *** | −10.8180 *** | 59.7210 *** |
| CPI | −3.5521 *** | −1.1299 | 0.8833 |
| FT | −21.9236 *** | −11.5725 *** | 6.7935 *** |
| PATPC_LAG1 | −2.8430 *** | 0.4492 | 3.9858 *** |
| INFDI | −2.3083 *** | 0.4278 | 3.4800 *** |
| UNEM | −4.5969 *** | −2.6966 ** | 0.6624 |
| AGE | −4.1563 *** | 1.3029 | 12.76 *** |
| HOUSEHOLD | −3.1904 *** | −0.3588 | −0.2789 |
| EDUCATION | −5.8857 *** | 0.0684 | 5.4550 *** |
| LIFE | −10.8124 *** | −4.6781 *** | 19.9759 *** |
Legend: LLC—Levin, Lin, and Chu unit root test (Levin et al. 2002); IPS—Im, Pesaran, and Shin unit root test (Im et al. 2003); PP—Phillips and Perron unit root test (Phillips and Perron 1988). *** 1% significance; ** 5% significance; and * 10% significance. All the variables are presented in levels, except for DTEA, which is presented in first differences. Source: Own elaboration.
Table 7.
Specification tests.
| Tests | Statistics |
|---|---|
| Hausman Test | Chi2(11) = 34.77 *** |
| Modified Wald Test | Chi2(21) = 8972.23 *** |
| Wooldridge Test | F(1,20) = 74.200 *** |
| Pesaran’s Test | 46.57 *** |
| Breusch–Pagan/Cook–Weisberg Test | Chi2(1) = 59.76 *** |
Legend: *** 1% significance. Source: Own elaboration.
Table 8.
Shapiro–Wilk W test.
| Variables | OBS | W | V | Z | Prob.> Z |
|---|---|---|---|---|---|
| TEA | 336 | 0.88658 | 26.723 | 7.754 | 0.00000 |
| DTEA | 315 | 0.90333 | 21.507 | 7.219 | 0.00000 |
| CPI | 336 | 0.93009 | 16.471 | 6.612 | 0.00000 |
| CPI2 | 336 | 0.92226 | 18.317 | 6.863 | 0.00000 |
| CPI3 | 336 | 0.90238 | 23.001 | 7.400 | 0.00000 |
| FT | 336 | 0.82514 | 41.199 | 8.776 | 0.00000 |
| PATPC_LAG1 | 315 | 0.47466 | 116.874 | 11.202 | 0.00000 |
| INFDI | 336 | 0.65474 | 81.348 | 10.381 | 0.00000 |
| UNEM | 336 | 0.78184 | 51.402 | 9.298 | 0.00000 |
| AGE | 336 | 0.97545 | 5.784 | 4.142 | 0.00002 |
| HOUSEHOLD | 336 | 0.96072 | 9.256 | 5.252 | 0.00000 |
| EDUCATION | 336 | 0.92455 | 17.777 | 6.792 | 0.00000 |
| LIFE | 336 | 0.73162 | 63.235 | 9.787 | 0.00000 |
| DCRISIS | 336 | 0.96230 | 8.883 | 5.155 | 0.00000 |
| DDEVEL | 336 | 0.99026 | 2.295 | 1.960 | 0.02499 |
Source: Own elaboration.
Table 9.
Skewness/kurtosis test.
| Variables | OBS | Pr(Skewness) | Pr(Kurtosis) | Adjchi2(2) | Prob > Chi2 |
|---|---|---|---|---|---|
| TEA | 336 | 0.0000 | 0.0003 | 56.91 | 0.0000 |
| DTEA | 315 | 0.0000 | 0.0000 | 65.01 | 0.0000 |
| CPI | 336 | 0.6034 | 0.0000 | . | . |
| CPI2 | 336 | 0.0907 | 0.0000 | . | 0.0000 |
| CPI3 | 336 | 0.0003 | 0.0000 | 58.29 | 0.0000 |
| FT | 336 | 0.0000 | 0.0000 | 70.70 | 0.0000 |
| PATPC_LAG1 | 315 | 0.0000 | 0.0000 | . | 0.0000 |
| INFDI | 336 | 0.0000 | 0.0000 | . | 0.0000 |
| UNEM | 336 | 0.0000 | 0.0000 | . | 0.0000 |
| AGE | 336 | 0.0122 | 0.0125 | 11.17 | 0.0038 |
| HOUSEHOLD | 336 | 0.0001 | 0.6588 | 15.99 | 0.0003 |
| EDUCATION | 336 | 0.0000 | 0.0000 | 25.00 | 0.0000 |
| LIFE | 336 | 0.0000 | 0.0000 | . | 0.0000 |
| DCRISIS | 336 | 0.0000 | 0.0000 | . | 0.0000 |
| DDEVEL | 336 | 0.0000 | 0.0231 | 48.05 | 0.0000 |
Source: Own elaboration.
Table 10.
Results of quantile regression models: 1 and 2.
| Model 1 | Model 2 | |||||||||
|---|---|---|---|---|---|---|---|---|---|---|
| Dependent Variable: TEA Independent Variables | Quantile | Quantile | ||||||||
| Q20 | Q40 | Q60 | Q80 | Q98 | Q20 | Q40 | Q60 | Q80 | Q98 | |
| DTEA | 0.3522 *** | 0.4578 *** | 0.5290 *** | 0.5590 *** | 0.5840 *** | 0.3519 ** | 0.4662 *** | 0.5093 *** | 0.5408 *** | 0.5228 *** |
| CPI | −2.0770 *** | −1.9419 *** | −2.0776 *** | −0.8181 | −2.2347 ** | −2.0287 *** | −1.9954 *** | −2.4926 *** | −1.1001 | −2.4623 ** |
| CPI2 | 3.1368 *** | 2.7842 *** | 2.9450 *** | 0.7033 | 2.2830 * | 3.0583 *** | 2.8965 *** | 3.6198 *** | 1.1862 | 3.2224 * |
| CPI3 | −1.5430 *** | −1.3041 *** | −1.3688 *** | −0.1264 | −1.1220 | −1.4983 *** | −1.3727 *** | −1.7156 *** | −0.3758 | −1.3290 |
| TF | 0.0659 | −0.0089 | −0.0255 | −0.1466 | −0.2269 *** | 0.0693 | −0.0145 | −0.0043 | −0.1471 | −0.2116 *** |
| PATPC_LAG1 | 0.0011 | 0.0011 | 0.0029 * | 0.0055 *** | 0.0042 *** | 0.0012 | 0.0011 | 0.0026 | 0.0048 *** | 0.0037 *** |
| INFDI | 0.0153 | 0.0181 *** | 0.0216 *** | 0.0223 *** | 0.0323 *** | 0.0169 * | 0.0186 *** | 0.0198 *** | 0.0238 *** | 0.0300 *** |
| UNEM | 0.0089 | −0.0398 | −0.1043 *** | −0.1527 *** | −0.2128 *** | 0.0213 | −0.0390 | −0.0974 *** | −0.1525 *** | −0.2177 *** |
| AGE | −0.0182 | −0.0816 ** | −0.1278 *** | −0.1871 *** | −0.2826 *** | −0.0380 | −0.1053 *** | −0.1502 *** | −0.2080 *** | −0.3001 *** |
| HOUSEHOLD | −0.0625 | −0.0110 | 0.0662 ** | 0.0836 ** | 0.1993 *** | −0.0398 | 0.0027 | 0.0630 ** | 0.1004 *** | 0.2133 *** |
| EDUCATION | −0.0263 | 0.0133 | 0.0655 | 0.0997 ** | 0.1043 ** | −0.0326 | 0.0225 | 0.0572 | 0.0584 | 0.1014 * |
| LIFE | −0.0008 * | −0.0009 ** | −0.0010 *** | −0.00005 | 0.0006 | −0.0006 | −0.0009 ** | −0.0011 *** | −0.0003 | −0.00008 |
| DCRISIS | − | − | − | − | − | −0.0054 | −0.0053 | −0.0096 ** | −0.0153 *** | −0.0033 |
| DDEVEL | − | − | − | − | − | − | − | − | − | − |
| Constant | 0.5578 | 0.6073 | 0.6233 | 0.4704 | 0.7860 | 0.5333 | 0.6163 | 0.7095 | 0.5422 | 0.8298 |
| N | 315 | 315 | 315 | 315 | 315 | 315 | 315 | 315 | 315 | 315 |
| Pseudo R2 | 0.2281 | 0.2991 | 0.3893 | 0.4928 | 0.6409 | 0.2303 | 0.3019 | 0.3977 | 0.5015 | 0.6432 |
| Adjusted R2 | 0.1975 | 0.2713 | 0.3650 | 0.4727 | 0.6266 | 0.1971 | 0.2718 | 0.3717 | 0.4800 | 0.6278 |
Legend: *** 1% significance; ** 5% significance; and * 10% significance. Source: Own elaboration.
Table 11.
Results of quantile regression models: 3 and 4.
| Model 3 | Model 4 | |||||||||
|---|---|---|---|---|---|---|---|---|---|---|
| Dependent Variable: TEA Independent Variables | Quantile | Quantile | ||||||||
| Q20 | Q40 | Q60 | Q80 | Q98 | Q20 | Q40 | Q60 | Q80 | Q98 | |
| DTEA | 0.4830 *** | 0.4735 *** | 0.5127 *** | 0.5571 *** | 0.4627 *** | 0.4738 *** | 0.5184 *** | 0.4986 *** | 0.5387 *** | 0.3696 *** |
| CPI | −0.5827 | −0.3301 | −0.0185 | −0.4404 | 0.3074 | −0.5288 | −0.6176 | −0.2156 | −0.2753 | 0.6378 |
| CPI2 | 0.8982 | 0.4294 | −0.0735 | 0.5417 | −0.6254 | 0.8013 | 0.8733 | 0.2590 | 0.2691 | −1.2928 * |
| CPI3 | −0.4547 | −0.1985 | 0.0473 | −0.2432 | 0.3289 | −0.4014 | −0.4175 | −0.1300 | −0.1065 | 0.7432 * |
| TF | 0.0362 | 0.0136 | 0.0355 | 0.0700 | 0.0477 | 0.0372 | 0.0434 | 0.0509 | 0.0631 | 0.0584 *** |
| PATPC_LAG1 | −0.0002 | −0.0002 | 0.0030 | 0.0040 *** | 0.0023 | −0.0001 | −0.00004 | 0.0029 | 0.0041 *** | 0.0039 *** |
| INFDI | 0.0195 *** | 0.0219 *** | 0.0193 *** | 0.0171 *** | 0.0122 ** | 0.0202 ** | 0.0209 *** | 0.0183 *** | 0.0188 *** | 0.0157 *** |
| UNEM | −0.0052 | −0.0906 ** | −0.1447 *** | −0.1735 *** | −0.2638 *** | −0.0067 | −0.0954 *** | −0.1517 *** | −0.1821 *** | −0.2662 *** |
| AGE | −0.0889 ** | −0.2014 *** | −0.2029 *** | −0.2358 *** | −0.3172 *** | −0.0843 ** | −0.2112 *** | −0.2236 *** | −0.2328 *** | −0.2923 *** |
| HOUSEHOLD | 0.0278 | 0.0661 | 0.0819 *** | 0.1239 *** | 0.1523 *** | 0.0305 | 0.0686 * | 0.0797 *** | 0.1195 *** | 0.1493 *** |
| EDUCATION | 0.0770 * | 0.1115 ** | 0.1466 *** | 0.2171 *** | 0.2833 *** | 0.0786 * | 0.1195 *** | 0.1456 *** | 0.2203 *** | 0.2392 *** |
| LIFE | 0.0020 *** | 0.0022 *** | 0.0022 *** | 0.0021 *** | 0.0022 *** | 0.0020 ** | 0.0018 *** | 0.0021 *** | 0.0022 *** | 0.0022 *** |
| DCRISIS | − | − | − | − | − | −0.0025 | −0.0064 * | −0.0036 | −0.0096 *** | −0.0114 *** |
| DDEVEL | −0.0782 *** | −0.0913 *** | −0.1010 *** | −0.1118 *** | −0.1216 *** | −0.0779 *** | −0.0887 *** | −0.0998 *** | −0.1010 *** | −0.1182 *** |
| Constant | 0.0197 | 0.0193 | −0.0721 | −0.0359 | −0.1669 | 0.0048 | 0.0815 | −0.0222 | −0.0752 | −0.2075 |
| N | 315 | 315 | 315 | 315 | 315 | 315 | 315 | 315 | 315 | 315 |
| Pseudo R2 | 0.3416 | 0.4057 | 0.4950 | 0.5992 | 0.7244 | 0.3430 | 0.4097 | 0.4971 | 0.6040 | 0.7342 |
| Adjusted R2 | 0.3132 | 0.3801 | 0.4732 | 0.5819 | 0.7125 | 0.3123 | 0.3822 | 0.4736 | 0.5855 | 0.7217 |
Legend: *** 1% significance; ** 5% significance; and * 10% significance. Source: Own elaboration.
Table 12.
Results of the symmetry tests.
| Symmetry Tests | ||||||
|---|---|---|---|---|---|---|
| Dependent Variable: TEA Independent Variables | Quantile | |||||
| Q2 = Q98 | Q20 = Q80 | Q40 = Q60 | Q2 = Q98 | Q20 = Q80 | Q40 = Q60 | |
| DTEA | −0.0782 | −0.1060 | −0.0304 | −0.3152 | −0.0192 | −0.0147 |
| CPI | 0.8650 | 1.3432 | 0.2188 | 0.5952 | 0.3976 | 0.3686 |
| CPI2 | −1.5376 | −2.2022 | −0.3131 | −1.1453 | −0.5989 | −0.5370 |
| CPI3 | 0.9204 | 1.1479 | 0.1443 | 0.6913 | 0.2788 | 0.2392 |
| TF | −0.1839 | −0.0993 | −0.0529 | 0.0266 | −0.0033 | −0.0092 |
| PATPC_LAG1 | 0.0022 | 0.0017 | −0.0009 | 0.0035 | 0.0037 ** | 0.0025 * |
| INFDI | 0.0134 | −0.0033 | −0.0012 | −0.0177 * | −0.0067 | −0.0066 * |
| UNEM | 0.2071 * | −0.0177 | −0.0181 | 0.0840 | 0.0533 | −0.0050 |
| AGE | −0.0395 | −0.0139 | −0.0180 | −0.1044 | 0.1080 | −0.0096 |
| HOUSEHOLD | 0.1292 | −0.0397 | −0.0055 | −0.0709 | −0.0429 | −0.0446 |
| EDUCATION | −0.0217 | 0.0003 | 0.0057 | 0.1034 | 0.0753 | 0.0416 |
| LIFE | 0.0002 | 0.0007 | 0.00007 | −0.0005 | −0.0002 | −0.0005 |
| DCRISIS | − | − | − | −0.0052 | −0.0037 | −0.0017 |
| DDEVEL | − | − | − | −0.0038 | −0.0022 | −0.0016 |
| Constant | −0.0556 | −0.1956 | 0.0067 | −0.0702 | −0.1607 | −0.0311 |
| Nº of tests | 5 | 5 | 5 | 5 | 5 | 5 |
| Wald test | 35.17 | 35.17 | 35.17 | 60.97 * | 60.97 * | 60.97 * |
Legend: ** 5% significance; and * 10% significance. Source: Own elaboration.
Table 13.
Results of the equality tests.
| Equality Tests | ||||||||
|---|---|---|---|---|---|---|---|---|
| Dependent Variable: TEA Independent Variables | Quantile | |||||||
| Q20 = Q40 | Q40 = Q60 | Q60 = Q80 | Q80 = Q98 | Q20 = Q40 | Q40 = Q60 | Q60 = Q80 | Q80 = Q98 | |
| DTEA | −0.1056 | −0.0712 | −0.0300 | −0.0251 | −0.0446 | 0.0198 | −0.0401 | 0.1690 * |
| CPI | −0.1350 | 0.1356 | −1.2595 | 1.4166 | 0.0887 | −0.4020 | 0.05971 | −0.9130 |
| CPI2 | 0.3526 | −0.1608 | 2.2417 | −2.1265 | −0.0720 | 0.6143 | −0.0101 | 1.5619 |
| CPI3 | −0.2389 | 0.0648 | −1.2425 * | 0.9956 | 0.0161 | −0.2875 | −0.0235 | −0.8497 |
| TF | 0.0747 | 0.0166 | 0.1212 | 0.0802 | −0.0062 | −0.0075 | −0.0122 | 0.0047 |
| PATPC_LAG1 | 0.00005 | −0.0019 | −0.0026 * | 0.0012 | −0.00009 | −0.0029 * | −0.0012 | 0.0001 |
| INFDI | −0.0028 | −0.0034 | −0.0007 | −0.0101 * | −0.0007 | 0.0026 | −0.0006 | 0.0031 |
| UNEM | 0.0487 | 0.0645 ** | 0.0484 | 0.0601 | 0.0887 ** | 0.0563 ** | 0.0304 | 0.0840 *** |
| AGE | 0.0634 * | 0.0462 | 0.0593 | 0.0955 * | 0.1269 *** | 0.0124 | 0.0093 | 0.0594 |
| HOUSEHOLD | −0.0515 | −0.0772 ** | −0.0174 | −0.1157 *** | −0.0381 | −0.0111 | −0.0398 * | −0.0299 |
| EDUCATION | −0.0397 | −0.0521 | −0.0343 | −0.0046 | −0.0410 | −0.0261 | −0.0747 | −0.0189 |
| LIFE | 0.0001 | 0.0002 | −0.0006 | −0.0005 | 0.0001 | −0.0003 | −0.0002 | 0.00004 |
| DCRISIS | − | − | − | − | 0.0039 | −0.0028 | 0.0060 * | 0.0018 |
| DDEVEL | − | − | − | − | 0.0107 | 0.0111 | 0.0102 | 0.0082 |
| Constant | − | − | − | − | − | − | − | − |
| Nº of tests | 5 | 5 | 5 | 5 | 5 | 5 | 5 | 5 |
| Wald test | 259.70 *** | 259.70 *** | 259.70 *** | 259.70 *** | 328.92 *** | 328.92 *** | 328.92 *** | 328.92 *** |
Legend: *** 1% significance; ** 5% significance; and * 10% significance. Source: Own elaboration.
Table 14.
Summing-up of research hypotheses and evidence.
| Hypotheses | Description | Evidence |
|---|---|---|
| H1 | Control of corruption has a negative and significant effect on entrepreneurial activity. | Negative & S |
| H2 | Free trade has a positive and significant effect on entrepreneurial activity. | Positive & S |
| H3 | Innovation intensity has a positive and significant effect on entrepreneurial activity. | Positive & S |
| H4 | FDI has a positive and significant effect on entrepreneurial activity. | Positive & S |
| H5 | Unemployment has a negative and significant effect on entrepreneurial activity. | Negative & S |
| H6 | Age dependency ratio has a negative and significant effect on entrepreneurial activity. | Negative & S |
| H7 | Households and NPISHs’ final consumption expenditure have a positive and significant effect on entrepreneurial activity. | Positive & S |
| H8 | Education index has a positive and significant effect on entrepreneurial activity. | Positive & S |
| H9 | Life expectancy at birth has a negative and significant effect on entrepreneurial activity. | Negative & S |
Legend: S: Significant. Source: Own elaboration.
Table 15.
Results of quantile regression models: 5 and 6.
| Model 5 | Model 6 | |||||||||
|---|---|---|---|---|---|---|---|---|---|---|
| Dependent Variable: TEA Independent Variables | Quantile | Quantile | ||||||||
| Q20 | Q40 | Q60 | Q80 | Q98 | Q20 | Q40 | Q60 | Q80 | Q98 | |
| DTEA | 0.4732 *** | 0.5272 *** | 0.5082 *** | 0.5322 *** | 0.4096 *** | 0.4379 *** | 0.4581 *** | 0.4525 *** | 0.5070 *** | 0.3696 *** |
| CPI | −0.5548 | −0.4752 | −0.4366 | −0.6368 | 0.8971 * | −0.8834 * | −0.6598 * | −0.3137 | −0.1155 | 1.1336 *** |
| CPI2 | 0.9510 | 0.9703 | 0.9140 | 1.0518 | −1.8665 * | 1.3460 | 0.9925 | 0.3564 | −0.0815 | −2.2213 *** |
| CPI3 | −0.4777 | −0.4845 | −0.4613 | −0.5368 | 1.0415 * | −0.6699 | −0.4842 | −0.1523 | 0.1114 | 1.2367 *** |
| TF | 0.0421 | 0.0137 | 0.0637 | 0.0970 * | 0.0471 | 0.1108 *** | 0.1105 *** | 0.1302 ** | 0.0922 | 0.0366 |
| PATPC_LAG1 | −0.0007 | −0.0012 | 0.0021 | 0.0039 ** | 0.0038 *** | −0.0009 | −0.0017 | −0.0024 ** | −0.0023 *** | 0.0007 |
| INFDI | 0.0160 * | 0.0192 *** | 0.0176 *** | 0.0169 *** | 0.0147 *** | −0.1674 * | −0.1901 *** | −0.1290 ** | −0.0846 | −0.0980 |
| UNEMP | −0.0820 | −0.3282 ** | −0.4140 *** | −0.3559 ** | −0.2454 *** | −0.0143 | −0.0676 ** | −0.1033 *** | −0.1128 *** | −0.1970 *** |
| HOUSEHOLD | −0.0085 | 0.0542 | 0.0722 *** | 0.1071 *** | 0.1484 *** | 0.0614 | 0.0807 ** | 0.0488 * | 0.0138 | −0.0171 |
| AGE | −0.0672 | −0.1550 *** | −0.1560 *** | −0.2013 *** | −0.3040 *** | −0.0910 ** | −0.1628 *** | −0.1913 *** | −0.2280 *** | −0.2629 *** |
| EDUCATION | 0.1022 * | 0.1338 *** | 0.1524 *** | 0.2105 *** | 0.2416 *** | 0.0995 ** | 0.0492 | 0.0944 ** | 0.1824 *** | 0.2413 *** |
| LIFE | 0.0017 | 0.0008 | 0.0001 | 0.0003 | 0.0022 *** | 0.0007 | 0.0004 | 0.0015 ** | 0.0023 *** | 0.0033 *** |
| DCRISIS | −0.0016 | −0.0059 | −0.0061 * | −0.0091 ** | −0.0131 *** | −0.0023 | −0.0047 | −0.0051 | −0.0084 ** | −0.0107 *** |
| DDEVEL | −0.0581 | −0.0509 | −0.0542 | −0.1046 | −0.1562 * | −0.1263 *** | −0.1387 *** | −0.1416 *** | −0.1438 *** | −0.1003 *** |
| CPI*DDEVEL | −0.0795 | −0.1748 | −0.1845 | −0.0653 | 0.1009 | − | − | − | − | − |
| TF*DDEVEL | 0.0928 | 0.2849 * | 0.3331 * | 0.2429 | −0.0204 | − | − | − | − | − |
| PATPC_LAG1*DDEVEL | − | − | − | − | − | −0.0011 | 0.0003 | 0.0075 *** | 0.0109 *** | 0.0094 |
| INFDI*DDEVEL | − | − | − | − | − | 0.1853 ** | 0.2134 *** | 0.1480 ** | 0.0983 | −0.0855 |
| Constant | 0.1870 | 0.1195 | 0.1310 | 0.0528 | −0.1175 | 0.1397 | 0.2001 | 0.0649 | −0.0110 | −0.2964 |
| N | 315 | 315 | 315 | 315 | 315 | 315 | 315 | 315 | 315 | 315 |
| Pseudo R2 | 0.3539 | 0.4316 | 0.5116 | 0.6129 | 0.7380 | 0.3726 | 0.4403 | 0.5331 | 0.6233 | 0.7497 |
| Adjusted R2 | 0.3192 | 0.4011 | 0.4854 | 0.5921 | 0.7239 | 0.3389 | 0.4102 | 0.5080 | 0.6031 | 0.7363 |
Legend: *** 1% significance; ** 5% significance; and * 10% significance. Source: Own elaboration.
Table 16.
Results of quantile regression model: 7.
| Model 7 | |||||
|---|---|---|---|---|---|
| Dependent Variable: TEA Independent Variables | Quantile | ||||
| Q20 | Q40 | Q60 | Q80 | Q98 | |
| DTEA | 0.4696 *** | 0.4465 *** | 0.4480 *** | 0.4983 *** | 0.4951 *** |
| CPI | −0.7743 | −0.7114 ** | −0.8254 ** | −1.2895 * | −0.5908 |
| CPI2 | 1.2951 | 1.2263 ** | 1.4334 ** | 2.1860 ** | 0.8792 |
| CPI3 | −0.6883 | −0.6727 ** | −0.7857 *** | −1.1735 ** | −0.4908 |
| TF | 0.0840 *** | 0.1078 ** | 0.1090 ** | 0.1082 * | 0.0451 |
| PATPC_LAG1 | −0.0028 *** | −0.0040 *** | −0.0035 *** | −0.0002 | 0.0042 |
| INFDI | 0.0190 *** | 0.0210 *** | 0.0204 *** | 0.0184 *** | 0.0101 ** |
| UNEM | −0.0360 | −0.0623 | −0.1200 | −0.0671 | −0.2768 *** |
| HOUSEHOLD | 0.1675 ** | 0.0247 | 0.0430 | 0.1162 | 0.2389 *** |
| AGE | −0.7703 *** | −0.5985 *** | −0.5761 *** | −0.5320 ** | −0.4867 *** |
| EDUCATION | 0.1601 | 0.2723 *** | 0.2680 *** | 0.2129 * | 0.2919 *** |
| LIFE | 0.0018 | 0.0029 * | 0.0023 * | 0.0030 | 0.0008 |
| DCRISIS | −0.0026 | −0.0047 | −0.0052 | −0.0053 | −0.0064 * |
| DDEVEL | −0.0710 | 0.1379 | 0.1279 | 0.2073 | −0.0227 |
| UNEM*DDEVEL | 0.1034 | 0.0650 | 0.0785 | −0.0103 | 0.1208 |
| HOUSEHOLD*DDEVEL | −0.1115 | 0.0733 | 0.0678 | 0.0452 | −0.1940 |
| AGE*DDEVEL | 0.8467 *** | 0.6695 *** | 0.5958 *** | 0.4764 ** | 0.2937 *** |
| EDUCATION*DDEVEL | −0.0357 | −0.1628 ** | −0.1578 ** | −0.0026 | 0.0314 |
| LIFE*DDEVEL | −0.0048 ** | −0.0067 *** | −0.0061 *** | −0.0075 *** | −0.0061 |
| Constant | 0.2507 | 0.0804 | 0.1335 | 0.1478 | 0.1217 |
| N | 315 | 315 | 315 | 315 | 315 |
| Pseudo R2 | 0.4851 | 0.5364 | 0.5836 | 0.6592 | 0.7596 |
| Adjusted R2 | 0.4519 | 0.5065 | 0.5567 | 0.6373 | 0.7441 |
Legend: *** 1% significance; ** 5% significance; and * 10% significance. Source: Own elaboration.
Publisher’s Note: MDPI stays neutral with regard to jurisdictional claims in published maps and institutional affiliations. |
© 2021 by the authors. Licensee MDPI, Basel, Switzerland. This article is an open access article distributed under the terms and conditions of the Creative Commons Attribution (CC BY) license (http://creativecommons.org/licenses/by/4.0/).
Share and Cite
MDPI and ACS Style
Leitão, J.; Capucho, J. Institutional, Economic, and Socio-Economic Determinants of the Entrepreneurial Activity of Nations. Adm. Sci. 2021, 11, 26. https://0-doi-org.brum.beds.ac.uk/10.3390/admsci11010026
AMA Style
Leitão J, Capucho J. Institutional, Economic, and Socio-Economic Determinants of the Entrepreneurial Activity of Nations. Administrative Sciences. 2021; 11(1):26. https://0-doi-org.brum.beds.ac.uk/10.3390/admsci11010026
Chicago/Turabian StyleLeitão, João, and João Capucho. 2021. "Institutional, Economic, and Socio-Economic Determinants of the Entrepreneurial Activity of Nations" Administrative Sciences 11, no. 1: 26. https://0-doi-org.brum.beds.ac.uk/10.3390/admsci11010026
Note that from the first issue of 2016, this journal uses article numbers instead of page numbers. See further details here.