Article

Comprehensive Analysis of RNA-Seq Gene Expression Profiling of Brain Transcriptomes Reveals Novel Genes, Regulators, and Pathways in Autism Spectrum Disorder

1
Department of Biotechnology and Genetic Engineering, Faculty of Biological Sciences, Islamic University, Kushtia 7003, Bangladesh
2
Department of Biochemistry and Biotechnology, Khwaja Yunus Ali University, Enayetpur, Sirajganj 6751, Bangladesh
3
IRCCS Bonino-Pulejo, 98123 Messina, Italy
4
Department of Biomedical and Biotechnological Sciences, University of Catania, 95124 Catania CT, Italy
5
Department of Statistics, Begum Rokeya University, Rangpur 5404, Bangladesh
6
Cancer Epidemiology Division, Population Sciences in the Pacific Program, University of Hawaii Cancer Center, University of Hawaii at Manoa, Honolulu, HI 96813, USA
7
College of Life Science, Longyan University, Longyan 364000, China
8
Fujian Provincial Key Laboratory for the Prevention and Control of Animal Infectious Diseases and Biotechnology, Longyan 364000, China
9
Department of Bioengineering, Marmara University, Istanbul 34722, Turkey
10
School of Biomedical Sciences, Faculty of Health, Institute of Health and Biomedical Innovation, Queensland University of Technology (QUT), Brisbane 4059, QLD, Australia
11
Department of Pharmacy, Faculty of Biological Science and Technology, Jashore University of Science and Technology, Jashore 7408, Bangladesh
*
Author to whom correspondence should be addressed.
Submission received: 17 September 2020 / Revised: 9 October 2020 / Accepted: 14 October 2020 / Published: 17 October 2020
(This article belongs to the Special Issue Advances in Autism Research: Series II)

Abstract

:
Background: Autism spectrum disorder (ASD) is a neurodevelopmental disorder with deficits in social communication ability and repetitive behavior. The pathophysiological events involved in the brain of this complex disease are still unclear. Methods: In this study, we aimed to profile the gene expression signatures of brain cortex of ASD patients, by using two publicly available RNA-seq studies, in order to discover new ASD-related genes. Results: We detected 1567 differentially expressed genes (DEGs) by meta-analysis, where 1194 were upregulated and 373 were downregulated genes. Several ASD-related genes previously reported were also identified. Our meta-analysis identified 235 new DEGs that were not detected using the individual RNA-seq studies used. Some of those genes, including seven DEGs (PAK1, DNAH17, DOCK8, DAPP1, PCDHAC2, and ERBIN, SLC7A7), have been confirmed in previous reports to be associated with ASD. Gene Ontology (GO) and pathways analysis showed several molecular pathways enriched by the DEGs, namely, osteoclast differentiation, TNF signaling pathway, complement and coagulation cascade. Topological analysis of protein–protein interaction of the ASD brain cortex revealed proteomics hub gene signatures: MYC, TP53, HDAC1, CDK2, BAG3, CDKN1A, GABARAPL1, EZH2, VIM, and TRAF1. We also identified the transcriptional factors (TFs) regulating DEGs, namely, FOXC1, GATA2, YY1, FOXL1, USF2, NFIC, NFKB1, E2F1, TFAP2A, HINFP. Conclusion: Novel core genes and molecular signatures involved with ASD were identified by our meta-analysis.

1. Introduction

Autism spectrum disorder (ASD) is a severe neurodevelopmental disorder that limits communication, social interactions, and repetitive behaviors are observed in ASD-affected people. There is no cure for this disease yet. The Centers for Disease Control (CDC) has reported that 1 in 54 children has ASD in the US, according to Autism and Developmental Disabilities Monitoring (ADDM) Network (Data published in 2016) [1]. The pattern of prevalence of ASD has been predicted to rise in the coming years. The pathophysiological mechanisms of ASD are very complex and multiple etiological processes are involved. Although genetic heritability is considered to be the principal cause of the disease, various immunological, neurological and environmental factors are involved in ASD. The pathophysiology of non-genetic forms of ASD has yet to be determined. Thus, identification of specific genes and molecular pathways is an unmet challenge, which will uncover potential mechanisms and new avenues to the development of treatment targets for ASD.
Changes in gene expression are widely studied to characterize various human diseases and successfully used to predict molecular and cellular processes in complex diseases [2,3]. Recently, some studies have been focused ASD pathogenesis to decode gene expression signatures specific for ASD. Previous studies found that several candidate genes demonstrated differential expression of ASD patients in brain and blood, as compared to healthy controls [4,5,6,7,8,9]. Despite some important data having been obtained from previous analyses [4,10], we here applied a System Biology approach to further deepen the understanding of the pathophysiological mechanisms in ASD. In this study, two independent publicly available ASD brain studies were used to perform a meta-analysis aimed at identifying novel ASD candidate genes. Additionally, functional enrichment, protein–protein interaction, DEGs-transcription factors, and diseasome analyses were carried out to shed light on potential mechanisms of ASD pathogenesis.

2. Materials and Methods

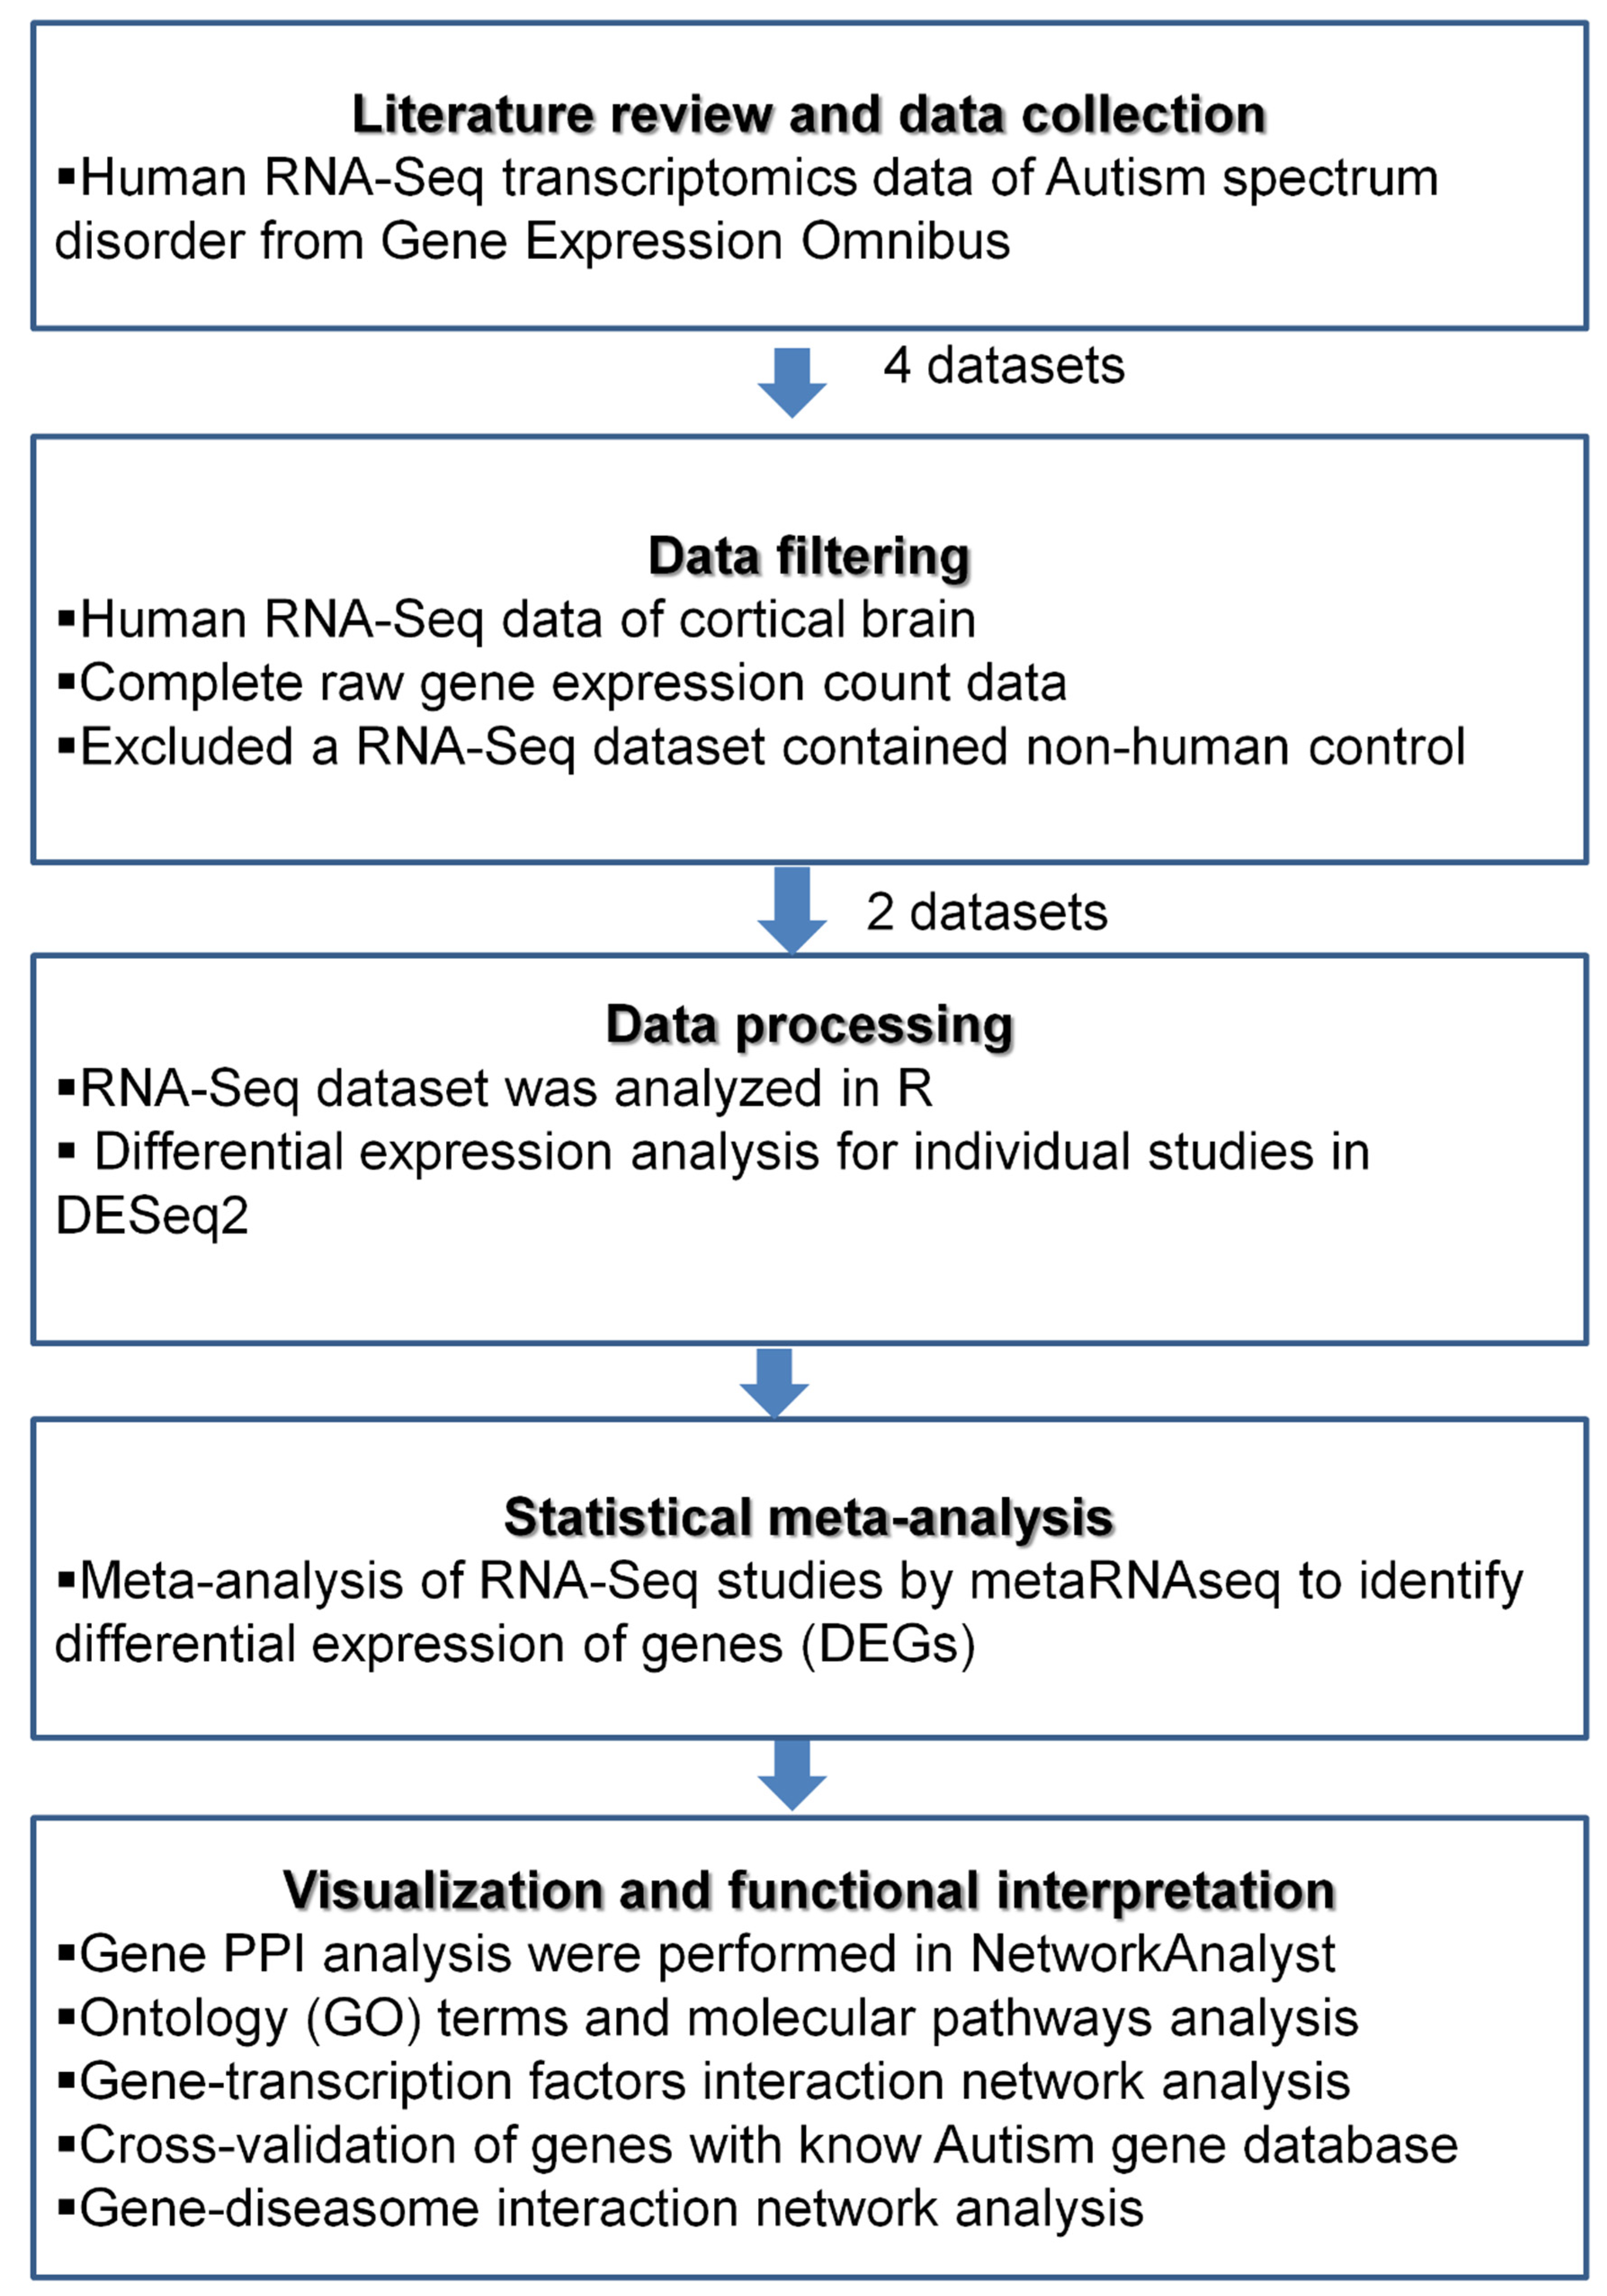
2.1. Acquisition of the Transcriptomics Data

We searched the big transcriptomics database Gene Expression Omnibus (GEO) in March 2020 to collect the RNA-Seq datasets of human ASD brain samples [11]. We focused on human RNA-Seq data. The criteria used for the selection of the datasets were: (1) human RNA-Seq data of brain cortex; (2) complete raw gene expression count data; (3) the tissues should be from the brain cortex; (4) excluded non-human samples. The detailed procedures are described in Figure 1. Finally, two RNA-Seq transcriptomics datasets from ASD brain cortex region were chosen for this study. The description and characteristics of the data are presented in Table 1. The GSE64018 included transcriptomes from post-mortem brain tissues from 12 ASD and 12 healthy controls, that were age and sex matched. The brain samples from superior temporal gyrus representing Brodmann areas BA41/42/22 were dissected, without harming the gray matter, from all cortical layers. The GSE30573 dataset contains gene expression profiling of post-mortem brain tissues from three ASD samples and three healthy controls from the brain cortex. The detailed demographic data of the samples included in this study is presented in Supplementary Tables S1 and S2.

2.2. Data Processing and Differential Expression Analysis of Individual Datasets

The differential expression of individual RNA-Seq dataset was analyzed in R using the package DESeq2 [12]. We used the filtering criteria to include genes that based on the mean of normalized counts as the filter statistic using independent filtering function in DESeq2 with default parameters. We used MetaRNASeq [13] package to perform Fisher’s combined probability test for meta-analysis. Fisher’s combination of p-values from independent datasets are combined via the following formula [13,14]:
F g = 2 t = 1 T ln ( P g t )
where P g t is the raw p-value obtained from gth gene for study t. For independent p-values the values of F g lies between 0 to + and it follows Chi-squared distribution with 2T degrees of freedom. It produces larger values corresponding to smaller values of P g t and smaller values corresponding to larger values of P g t . Therefore, the larger values of F g indicates the rejection of null hypothesis. p-values were adjusted by Benjamini–Hochberg false discovery rate (FDR).

2.3. Functional Enrichment Analysis

Functional annotation of the identified differentially expressed genes was performed using the clusterprofiler R package [15]. An adjusted p-value < 0.05 was considered for the selection of the enriched Gene Ontology (GO) terms and pathways.

2.4. Protein–Protein Interaction Analysis

We built a brain protein–protein interactome (PPI) network of the proteins encoded by the DEGs using NetworkAnalyst—an online web tool for data analysis and visualization [16]. The zero-order network was constructed. The hub proteins were selected based on a degree > 15.

2.5. Transcriptional Regulators of the DEGs

The network of interactions between DEGs-TFs was constructed using JASPAR database built in NetworkAnalyst [16]. The top 10 identified TFs were considered as principal transcriptional regulators of DEGs.

2.6. In Silico Cross-Validation and Gene Disease Association Network Analyses

We cross-checked the identified DEGs found in our meta-analysis with data from SFARI Gene 2.0, a community-driven knowledgebase for the autism spectrum disorders [17]. A gene-disease association network was also built using the DisGeNet database [18], implemented in NetworkAnalyst. DisGeNET is a wide database comprising links from numerous sources that include the complex biological features of disorders. Gene-disorder interaction with specific DEGs was analyzed via a NetworkAnalyst to identify related disease and chronic conditions. Top pathways were detected based on degree measure [19].

3. Results

3.1. Detection of Differentially Expressed Genes in Brain Cortex via Meta-Analysis of RNA-Seq Transcriptomics

We investigated the gene expression profile of the brain cortex of 15 ASD cases and 15 controls (Table 1, Tables S1 and S2). The ASD gene expression profile was obtained by performing a meta-analysis of the selected RNA-Seq studies. Based on the chosen statistical criteria—adjusted p-value < 0.05 and log2FC ≥ 1—we detected 1567 differentially expressed genes (DEGs), with 373 downregulated and 1194 upregulated genes in ASD compared to controls (Table S3). The counts of the common genes shared among individual studies/dataset and the meta-analysis are shown as Venn diagram (Figure 2). We identified 65 DEGs that were already known to be causal genes in ASD, from the SFARI autism research database. Among the DEGs identified in the meta-analysis, 235 DEGs were not identified by the analysis of the individual datasets. The top 50 DEGs, sorted by p-value, are presented in Table 2. Among these DEGs, seven overlapped with already known causal genes in ASD.

3.2. Data Visualization and Functional Interpretation

To decipher the biological involvement and the potential molecular mechanisms underlying the pathogenesis of ASD, we performed GO and Pathway analysis on the DEGs. The GO analyses showed biological process (BP) in the ASD cortex were mainly involved in inflammatory response and immune systems, in particular, regulation of leukocyte activation, leukocyte migration, neutrophil degranulation, and leukocyte migration (Figure 3A). The cellular components encoded by the DEGs were mainly extracellular matrix, secretory granule membrane, presynapse (Figure 3A). The mainly molecular functions (MF) were glycosaminoglycan binding, heparin binding, cytokine activity, ion gated channel activity enriched by the DEGs (Figure 3A).
The pathway analyses revealed that osteoclast differentiation, cytokine–cytokine receptor interaction, TNF signaling pathway, complement and coagulation cascade, pertussis, malaria, legionellosis, Kaposi sarcoma-associated herpesvirus infection were significantly enriched among the DEGs, as shown in Figure 3B.

3.3. Hub Proteins: Protein Interactome Analysis

We performed brain protein–protein interaction analysis of the DEGs identified by the meta-analysis using the brain (cortex) protein interactome data. We reconstructed a subnetwork around DEGs encoded protein in dataset or tissue (Figure 4). The first order subnetwork built using DEGs had 6231 nodes and 15,330 edges contained 946 seed nodes. Then, a zero-order network was reconstructed which had 471 nodes, 760 edges and 471 seeds (Figure 4). The degree-based topological analysis of the network revealed 10 hub genes (MYC, TP53, HDAC1, CDK2, BAG3, CDKN1A, GABARAPL1, EZH2, VIM, and TRAF1). Table 3 shows the details topological parameters, roles, and molecular significance of the hub proteins.

3.4. Regulatory Signature: DEGs-TFs Interaction Network

A network-based approach was employed to construct a DEGs-TFs interaction network, to identify potential TFs involved in the modulation of the DEGs. FOXC1, GATA2, YY1, FOXL1, USF2, NFIC, NFKB1, E2F1, TFAP2A, HINFP were detected as TFs regulating DEGs (Table 4 and Figure 5).

3.5. Cross-Validation and DEGs–Disease Association Network

We next compared the identified 1567 DEGs with known ASD genes from SFARI database and found that 65 overlapping genes, namely, RIT2, PAK1, HCN1, CECR2, KCNC1, DNAH17, KRT26, RBFOX1, SLC9A9, OXTR, DAPP1, CAPN12, KIF14, ATP1A1, DISC1, PBA2, CADPS2, FRMPD4, ATP2B2, MSR1, PCDH15, GABRG3, GRIN2A, PTPRC, DOCK1, C4B, SAMD11, THBS1, LRP2,ERBIN, SLC7A7, STXBP1, SHOX, PLAUR, KANK1, ATP1A3, DPP4, DOCK8, FBXO40, SNAP25, RIMS3, CADPS, GABRB2, ITPR1, SEZ6L2, PCDHAC2, VSIG4, CTNNA3, SLC4A10, VDR, SYT1, CDH22, IL1R2, SCN2A, BCAS1, GFAP, PRKAR1B, SERPINE1, HLA-B, SCN8A, ITGB3, PRICKLE1, RELN, KCNJ15, ARHGEF10.
By performing a gene–disease association analysis of the meta DEGs, we found a significant association with diseases such as, Mood Disorders, Autistic Disorder, Intellectual Disability, Unipolar Depression, Mental Retardation, Low intelligence, Global developmental delay, Depressive disorder, Seizures, Bipolar Disorder, Major Depressive Disorder, Mental Depression, Epilepsy, Cognitive delay, Cerebellar Ataxia, Inflammation (Figure 6). Our data suggest that the DEGs identified in ASD may be in common with other neurodevelopmental disorders.

4. Discussion

ASD is a prevalent neurodevelopmental disease that is characterized by impaired social communication and repetitive behaviors. To better understand the biological mechanisms of ASD, we decided to perform a comprehensive systems biology analysis of RNA-seq transcriptomics of the ASD brain cortex. With this aim, we performed an integrative RNA-Seq gene expression profiling in cortex to identify transcriptional gene signatures altered in 15 ASD and 15 controls (Table 1, Tables S1 and S2). From the quantitative meta-analysis, we identified 1567 differentially expressed genes (DEGs), 373 downregulated and 1194 upregulated.
Among the top DEGs, PVALB (encoding for parvalbumin) was identified as one of top DEGs (FDR < 0.05 and logFC = −3.3). Parvalbumin (PV) is a calcium-binding protein expressed in a subset of GABAergic interneurons in the brain. Recently, this population of inhibitory (GABAergic) interneurons, expressing the calcium-binding protein PV (here indicated as Pvalb neurons), has attracted much attention with regard to ASD [34]. Indeed, Pvalb neurons control the coordination of neuronal networks and studies on ASD animal models have shown a reduced number of PV-immunoreactive (PV+) cells. Moreover, mice with reduced (PV+/−) or absent (PV−/−) PV expression levels show behavioral deficits similar to those observed in human ASD patients [35]. On top of that, a decreased number of Pvalb neurons has been also found in ASD post-mortem brains [36]. However, the PVALB gene has not been identified as an ASD risk gene by GWAS studies, suggesting that functional alteration of Pvalb neurons are sufficient to promote the disease, despite the presence of PVALB genetic alterations.
With the present meta-analysis, we were able to detect 235 unique DEGs, not identified by the individual studies (Table 2), supporting the increased statistical power of the meta-analysis approach [13,37]. Seven of these DEGs (PAK1, DNAH17, DOCK8, DAPP1, PCDHAC2, and ERBIN, SLC7A7), have been reported to be deferentially expressed in ASD. Mutation of PAK1 has been reported to be involved in intellectual neurodevelopmental disorder [38,39]. Genetic variants in DNAH17 gene were reported to be associated with ASD [40]. Two separate ASD cases reported a novel repeated duplication of the DAPP1 gene [41]. In another study, two SNPs within PCDHAC2 gene were associated with ASD [41].
Among the enriched pathways in ASD, we found the osteoclast differentiation pathway, which has been previously associated with ASD. Indeed ASD children have been found to have low bone density and increased risk of fractures [42,43,44,45]. Many factors play a key roles in the establishment and maintenance of bone density suggesting that common factors could be commonly involved in regulating bone density and autism [46]. In addition, osteoclast dysfunction was also observed in another neurodevelopmental/intellectual development disorder, Snyder Robinson syndrome [47]. Another pathway, the TNF signaling pathway, was also significantly deregulated in ASD. Several studies have shown increased levels of TNF in ASD subjects in brain, cerebrospinal fluids and plasma indicating the crucial roles of TNF signaling in ASD [48,49,50]. In line with our observation, other recent studies have highlighted the immunological involvement in the pathogenesis of ASD [51]. Cytokines mainly function as immunological response mediators, but they also have major nervous system associations. They engage in normal neuronal growth and function and may have several neurological consequences for improper actions [52]. In addition, altered cytokine levels are associated with severity symptoms of ASD [53]. In a previous study, the complement protein C3 was identified to be differentially expressed in blood of ASD versus controls [54]. Therefore, the complement pathway might be linked with inflammatory processes underlying ASD. These observations corroborated our findings suggesting that the identified pathways are crucial in development of treatment strategies in ASD, and hence can be exploited to develop new drug targets.
In the present study, we also characterized the potential TFs involved in the regulation of DEGs expression. The FOXC1 plays a role in normal development of cerebellar and posterior fossa. It has been demonstrated that deletion or duplication of FOXC1 are associated with cerebellar malformation, suggesting the FOXC1 dysregulation play role in neurodevelopmental disease [28]. GATA2 is involved in maintaining the development of GABAergic neurons, movement and neuron-specific gene expression via direct action or control of other GABAergic genes [29]. However, its association with development of ASD is not known yet. YY1 is widely expressed in brain and have role in development and neurodegeneration. Gabriele et al. showed that both deletions and de novo point mutations affecting YY1 activity trigger Intellectual Disability syndrome of haploinsufficiency with a wide variety of development and psychiatric comorbidities [30]. Twelve known ASD SNPs are associated with validated TF binding sites of YY1, E2F1 and USF2 enriched in neurodevelopmental and neuro-psychiatric disorder PPI network [31]. Many of these SNPs are correlated with synaptic transmission. GWAS study revealed genetic variants of NFIC is associated with Alzheimer’s disease [32]. A genome-wide association study identified NFKB1 to play crucial role in etiology of treatment refractory schizophrenia in the Chinese Han population [33]. The roles of the TFAP2A and HINFP have not yet been described in other neurodevelopmental disorders.
The topological analysis of the protein–protein interactions is a useful approach to decode the critical signaling molecules in complex disease. The PPI analysis identified hub gene signatures, that included BAG3, CDK2, CDKN1A, EZH2, GABARAPL1, HDAC1, MYC, TP53, TRAF1 and VIM. BAG3 was identified to be significantly differentially expressed in Schizophrenia by gene and pathways-based meta-analysis of microarray data [55]. Genetic variants of BAG3 have been reported to be involved in Parkinson’s disease [20]. A recent report revealed that genetic variants of CDKN1A have been implicated in ASD in dorsolateral prefrontal cortex region of brain [21]. Another hub protein, EZH2, is a chromatin remodeler factor and it plays essential functional roles in nervous system biology, including differentiation, neurological and cognitive development. The genetic variation of EZH2-a chromatin remodeling factors is observed in intellectual disabilities and ASD [22]. Li et al. showed aberrant expression of EZH2 in human embryonic brain suggesting a contributory role of this gene in the etiology of ASD in the Chinese population [23]. Therefore, the hub protein EZH2 may be implicated in ASD, in accordance with these data. Several studies have suggested a role for HDAC1 and HDAC2 in learning and memory behaviors [24]. Assessment of copy number variations suggested GABARAPL1 involved in ASD associated pathway [25]. However, differential expression has not been previously reported. However, the roles of these genes in ASD are still unclear. The role of VIM and TRAF1 in ASD pathogenesis is also not known yet. Here, we suggest that further experimental studies are warranted to establish their role as biomarkers in ASD.
Despite the tremendous significance of the present study, several limitations can be noted, in that the two RNA-Seq datasets were obtained at different times and small samples size. Additionally, the racial and ethnic background of the subjects and control did not completely match.
Our study differs significantly from other studies performed on circulating blood cells from ASD toddlers [8]. It is likely that genes that are expressed across many tissues represent major contributors to the heritability of a complex disorders, such as ASD. Given the strong genetic basis of ASD, some dysregulated developmental pathways could continually reoccur in leukocytes and thus could be studied postnatally in tissues that are easily obtained. Blood cells from ASD toddlers show perturbations in several biological processes, that include cell proliferation, differentiation, and microtubules organization, and this is in accordance with some dysregulated processes that have been described in iPSC-derived neural progenitors and neurons from individuals with ASD [8].
However, the study of blood cells cannot provide several pieces of information on dysregulated biological processes that, irrespective of the presence of genetic alterations, occur in ASD brain. One particular example is provided by parvalbumin, which is not a bona fide ASD risk gene, but is significantly altered in a population of inhibitory interneurons, recently recognized to be implicated in ASD manifestations, as previously mentioned [34,35,36].

5. Conclusions

In conclusion, the present study aimed at characterizing the whole-genome transcriptomic profile of the brain cortex from ASD patients. Our meta-analysis and systems biology analyses revealed core gene signatures as candidate biomarkers and etiopathogenetic pathways in ASD. A proteomic signature of hub genes (MYC, TP53, HDAC1, CDK2, BAG3, CDKN1A, GABARAPL1, EZH2, VIM, and TRAF1) was identified as a key driver in ASD. In general, core signatures of DEGs associated with ASD genes, including already known markers of ASD and novel hub genes, were identified. Potential implicated TFs were also discovered. The identified core gene signatures may represent candidate biomarkers and drug targets. For many of the newly identified DEGs in this study, direct associations with ASD has not previously reported. Therefore, experimental research is needed to validate these new DEGs to decipher their biological roles in ASD in order to better understand the perturbed molecular mechanisms. The present study reported novel genes and pathways in ASD, and further investigation is required for validation of hub genes in the clinical setting.

Supplementary Materials

The following are available online at https://0-www-mdpi-com.brum.beds.ac.uk/2076-3425/10/10/747/s1, Table S1: Demographic description of post-mortem brain tissue (GSE64018) dataset. Table S2: Demographic description of post-mortem brain tissue (GSE30573) dataset. Table S3: A complete list of differential expressed genes identified in meta-analysis of ASD vs. controls.

Author Contributions

Conceptualization, M.R.R. and T.I.; methodology, M.R.R., T.I., B.T., and M.S.; software, M.R.R., T.I., and M.S.; validation, M.R.R., T.I., B.T., and M.S.; formal analysis, M.R.R., T.I., and M.S.; investigation, M.R.R., T.I., M.S., M.C.P., R.C., A.B., P.F., F.N., M.R.I., K.Y.A., L.W., and Y.S.; resources, M.R.R., T.I., and M.S.; data curation, M.R.R., T.I., and M.S.; writing—original draft preparation, M.R.R.; writing—review and editing, M.R.R., T.I., M.C.P., R.C., A.B., P.F., F.N., M.R.I., B.T., K.Y.A., L.W., and Y.S.; visualization, M.R.R., T.I., M.S., B.T., and M.R.I.; supervision, F.N., and P.F.; project administration, F.N., and P.F.; funding acquisition, F.N. All authors have read and agreed to the published version of the manuscript.

Funding

This study was supported by current research funds 2020 of IRCCS “Centro Neurolesi Bonino-Pulejo”, Messina, Italy.

Conflicts of Interest

The authors declare no conflict of interest.

References

  1. Maenner, M.J. Prevalence of Autism Spectrum Disorder Among Children Aged 8 Years—Autism and Developmental Disabilities Monitoring Network, 11 Sites, United States, 2016. MMWR Surveill. Summ. 2020, 69, 1–12. [Google Scholar] [CrossRef] [PubMed]
  2. Rahman, M.R.; Islam, T.; Zaman, T.; Shahjaman, M.; Karim, M.R.; Huq, F.; Quinn, J.M.W.; Holsinger, R.M.D.; Gov, E.; Moni, M.A. Identification of molecular signatures and pathways to identify novel therapeutic targets in Alzheimer’s disease: Insights from a systems biomedicine perspective. Genomics 2020, 112, 1290–1299. [Google Scholar] [CrossRef] [PubMed]
  3. Rahman, M.R.; Islam, T.; Turanli, B.; Zaman, T.; Faruquee, H.M.; Rahman, M.M.; Mollah, M.N.H.; Nanda, R.K.; Arga, K.Y.; Gov, E.; et al. Network-based approach to identify molecular signatures and therapeutic agents in Alzheimer’s disease. Comput. Biol. Chem. 2019, 78, 431–439. [Google Scholar] [CrossRef] [PubMed]
  4. Ch’ng, C.; Kwok, W.; Rogic, S.; Pavlidis, P. Meta-analysis of gene expression in autism spectrum disorder. Autism Res. 2015, 8, 593–608. [Google Scholar] [CrossRef] [PubMed]
  5. Glatt, S.J.; Tsuang, M.T.; Winn, M.; Chandler, S.D.; Collins, M.; Lopez, L.; Weinfeld, M.; Carter, C.; Schork, N.; Pierce, K. Blood-based gene expression signatures of infants and toddlers with autism. J. Am. Acad. Child Adolesc. Psychiatry 2012, 51, 934–944. [Google Scholar] [CrossRef] [PubMed] [Green Version]
  6. Hu, V.W.; Lai, Y. Developing a predictive gene classifier for autism spectrum disorders based upon differential gene expression profiles of phenotypic subgroups. N. Am. J. Med. Sci. Boston 2013, 6. [Google Scholar]
  7. Pramparo, T.; Pierce, K.; Lombardo, M.V.; Barnes, C.C.; Marinero, S.; Ahrens-Barbeau, C.; Murray, S.S.; Lopez, L.; Xu, R.; Courchesne, E. Prediction of autism by translation and immune/inflammation coexpressed genes in toddlers from pediatric community practices. JAMA Psychiatry 2015, 72, 386–394. [Google Scholar] [CrossRef] [Green Version]
  8. Gazestani, V.H.; Pramparo, T.; Nalabolu, S.; Kellman, B.P.; Murray, S.; Lopez, L.; Pierce, K.; Courchesne, E.; Lewis, N.E. A perturbed gene network containing PI3K–AKT, RAS–ERK and WNT–β-catenin pathways in leukocytes is linked to ASD genetics and symptom severity. Nat. Neurosci. 2019, 22, 1624–1634. [Google Scholar] [CrossRef]
  9. Oh, D.H.; Kim, I.B.; Kim, S.H.; Ahn, D.H. Predicting autism spectrum disorder using blood-based gene expression signatures and machine learning. Clin. Psychopharmacol. Neurosci. 2017, 15, 47. [Google Scholar] [CrossRef]
  10. Forés-Martos, J.; Catalá-López, F.; Sánchez-Valle, J.; Ibáñez, K.; Tejero, H.; Palma-Gudiel, H.; Climent, J.; Pancaldi, V.; Fañanás, L.; Arango, C. Transcriptomic metaanalyses of autistic brains reveals shared gene expression and biological pathway abnormalities with cancer. Mol. Autism 2019, 10, 1–16. [Google Scholar] [CrossRef] [Green Version]
  11. Clough, E.; Barrett, T. The Gene Expression Omnibus Database. Methods Mol. Biol. 2016, 1418, 93–110. [Google Scholar]
  12. Love, M.; Anders, S.; Huber, W. Differential analysis of count data–the DESeq2 package. Genome Biol. 2014, 15, 10–1186. [Google Scholar]
  13. Rau, A.; Marot, G.; Jaffrézic, F. Differential meta-analysis of RNA-seq data from multiple studies. BMC Bioinform. 2014, 15, 91. [Google Scholar] [CrossRef] [PubMed] [Green Version]
  14. Edwards, A.W.R.A. Fischer, Statistical Methods for Research Workers (1925). In Landmark Writings in Western Mathematics 1640–1940; Elsevier: Amsterdam, The Netherlands, 2005; pp. 856–870. [Google Scholar]
  15. Yu, G.; Wang, L.G.; Han, Y.; He, Q.Y. clusterProfiler: An R package for comparing biological themes among gene clusters. Omi. A J. Integr. Biol. 2012, 16, 284–287. [Google Scholar] [CrossRef] [PubMed]
  16. Xia, J.; Gill, E.E.; Hancock, R.E.W. NetworkAnalyst for statistical, visual and network-based meta-analysis of gene expression data. Nat. Protoc. 2015, 10, 823. [Google Scholar] [CrossRef]
  17. Abrahams, B.S.; Arking, D.E.; Campbell, D.B.; Mefford, H.C.; Morrow, E.M.; Weiss, L.A.; Menashe, I.; Wadkins, T.; Banerjee-Basu, S.; Packer, A. SFARI Gene 2.0: A community-driven knowledgebase for the autism spectrum disorders (ASDs). Mol. Autism 2013, 4, 36. [Google Scholar] [CrossRef] [Green Version]
  18. Piñero, J.; Queralt-Rosinach, N.; Bravo, A.; Deu-Pons, J.; Bauer-Mehren, A.; Baron, M.; Sanz, F.; Furlong, L.I. DisGeNET: A discovery platform for the dynamical exploration of human diseases and their genes. Database 2015, 2015. [Google Scholar]
  19. Uhlén, M.; Karlsson, M.J.; Hober, A.; Svensson, A.S.; Scheffel, J.; Kotol, D.; Zhong, W.; Tebani, A.; Strandberg, L.; Edfors, F. The human secretome. Sci. Signal. 2019, 12. [Google Scholar] [CrossRef] [Green Version]
  20. Nalls, M.A.; Blauwendraat, C.; Vallerga, C.L.; Heilbron, K.; Bandres-Ciga, S.; Chang, D.; Tan, M.; Kia, D.A.; Noyce, A.J.; Xue, A. Identification of novel risk loci, causal insights, and heritable risk for Parkinson’s disease: A meta-analysis of genome-wide association studies. Lancet Neurol. 2019, 18, 1091–1102. [Google Scholar] [CrossRef]
  21. Anitha, A.; Nakamura, K.; Thanseem, I.; Yamada, K.; Iwayama, Y.; Toyota, T.; Matsuzaki, H.; Miyachi, T.; Yamada, S.; Tsujii, M. Brain region-specific altered expression and association of mitochondria-related genes in autism. Mol. Autism 2012, 3, 12. [Google Scholar] [CrossRef] [Green Version]
  22. Ronan, J.L.; Wu, W.; Crabtree, G.R. From neural development to cognition: Unexpected roles for chromatin. Nat. Rev. Genet. 2013, 14, 347–359. [Google Scholar] [CrossRef] [PubMed]
  23. Li, J.; You, Y.; Yue, W.; Yu, H.; Lu, T.; Wu, Z. Chromatin remodeling gene EZH2 involved in the genetic etiology of autism in Chinese Han population. Neurosci. Lett. 2016, 610, 182–186. [Google Scholar] [CrossRef]
  24. Mahgoub, M.; Monteggia, L.M. A role for histone deacetylases in the cellular and behavioral mechanisms underlying learning and memory. Learn. Mem. 2014, 21, 564–568. [Google Scholar] [CrossRef] [PubMed] [Green Version]
  25. Griswold, A.J.; Ma, D.; Cukier, H.N.; Nations, L.D.; Schmidt, M.A.; Chung, R.-H.; Jaworski, J.M.; Salyakina, D.; Konidari, I.; Whitehead, P.L.; et al. Evaluation of copy number variations reveals novel candidate genes in autism spectrum disorder-associated pathways. Hum. Mol. Genet. 2012, 21, 3513–3523. [Google Scholar] [CrossRef] [PubMed] [Green Version]
  26. Chow, J.; Jensen, M.; Amini, H.; Hormozdiari, F.; Penn, O.; Shifman, S.; Girirajan, S.; Hormozdiari, F. Dissecting the genetic basis of comorbid epilepsy phenotypes in neurodevelopmental disorders. Genome Med. 2019, 11, 65. [Google Scholar] [CrossRef] [PubMed] [Green Version]
  27. Lalani, A.I.; Zhu, S.; Gokhale, S.; Jin, J.; Xie, P. TRAF molecules in inflammation and inflammatory diseases. Curr. Pharm. Rep. 2018, 4, 64–90. [Google Scholar] [CrossRef] [PubMed]
  28. Aldinger, K.A.; Lehmann, O.J.; Hudgins, L.; Chizhikov, V.V.; Bassuk, A.G.; Ades, L.C.; Krantz, I.D.; Dobyns, W.B.; Millen, K.J. FOXC1 is required for normal cerebellar development and is a major contributor to chromosome 6p25. 3 Dandy-Walker malformation. Nat. Genet. 2009, 41, 1037. [Google Scholar] [CrossRef] [PubMed] [Green Version]
  29. Shrestha, S.; Offer, S.M. Epigenetic regulations of GABAergic neurotransmission: Relevance for neurological disorders and epigenetic therapy. Med. Epigenetics 2016, 4, 1–19. [Google Scholar] [CrossRef] [Green Version]
  30. Gabriele, M.; Vulto-van Silfhout, A.T.; Germain, P.L.; Vitriolo, A.; Kumar, R.; Douglas, E.; Haan, E.; Kosaki, K.; Takenouchi, T.; Rauch, A. YY1 haploinsufficiency causes an intellectual disability syndrome featuring transcriptional and chromatin dysfunction. Am. J. Hum. Genet. 2017, 100, 907–925. [Google Scholar] [CrossRef] [Green Version]
  31. Cristino, A.S.; Williams, S.M.; Hawi, Z.; An, J.Y.; Bellgrove, M.A.; Schwartz, C.E.; da F Costa, L.; Claudianos, C. Neurodevelopmental and neuropsychiatric disorders represent an interconnected molecular system. Mol. Psychiatry 2014, 19, 294–301. [Google Scholar] [CrossRef]
  32. Jun, G.R.; Chung, J.; Mez, J.; Barber, R.; Beecham, G.W.; Bennet, D.A. Transethnic genome-wide scan identifies novel Alzheimer disease loci. Alzheimers Dement. 2017, 13, 727–738. [Google Scholar] [CrossRef] [PubMed]
  33. Liou, Y.J.; Wang, H.H.; Lee, M.T.M.; Wang, S.C.; Chiang, H.L.; Chen, C.C.; Lin, C.H.; Chung, M.S.; Kuo, C.C.; Liao, D.L. Genome-wide association study of treatment refractory schizophrenia in Han Chinese. PLoS ONE 2012, 7. [Google Scholar] [CrossRef] [Green Version]
  34. Filice, F.; Schwaller, B.; Michel, T.M.; Grünblatt, E. Profiling parvalbumin interneurons using iPSC: Challenges and perspectives for Autism Spectrum Disorder (ASD). Mol. Autism 2020, 11, 10. [Google Scholar] [CrossRef]
  35. Wöhr, M.; Orduz, D.; Gregory, P.; Moreno, H.; Khan, U.; Vörckel, K.J.; Wolfer, D.P.; Welzl, H.; Gall, D.; Schiffmann, S.N.; et al. Lack of parvalbumin in mice leads to behavioral deficits relevant to all human autism core symptoms and related neural morphofunctional abnormalities. Transl. Psychiatry 2015, 5, e525. [Google Scholar] [CrossRef] [PubMed]
  36. Hashemi, E.; Ariza, J.; Rogers, H.; Noctor, S.C.; Martínez-Cerdeño, V. The Number of Parvalbumin-Expressing Interneurons Is Decreased in the Medial Prefrontal Cortex in Autism. Cereb. Cortex 2017, 27, 1931–1943. [Google Scholar] [CrossRef] [PubMed] [Green Version]
  37. Walker, E.; Hernandez, A.V.; Kattan, M.W. Meta-analysis: Its strengths and limitations. Cleve. Clin. J. Med. 2008, 75, 431. [Google Scholar] [CrossRef]
  38. Harms, F.L.; Kloth, K.; Bley, A.; Denecke, J.; Santer, R.; Lessel, D.; Hempel, M.; Kutsche, K. Activating mutations in PAK1, encoding p21-activated kinase 1, cause a neurodevelopmental disorder. Am. J. Hum. Genet. 2018, 103, 579–591. [Google Scholar] [CrossRef] [PubMed] [Green Version]
  39. Horn, S.; Au, M.; Basel-Salmon, L.; Bayrak-Toydemir, P.; Chapin, A.; Cohen, L.; Elting, M.W.; Graham, J.M., Jr.; Gonzaga-Jauregui, C.; Konen, O. De novo variants in PAK1 lead to intellectual disability with macrocephaly and seizures. Brain 2019, 142, 3351–3359. [Google Scholar] [CrossRef] [PubMed]
  40. De Rubeis, S.; He, X.; Goldberg, A.P.; Poultney, C.S.; Samocha, K.; Cicek, A.E.; Kou, Y.; Liu, L.; Fromer, M.; Walker, S. Synaptic, transcriptional and chromatin genes disrupted in autism. Nature 2014, 515, 209–215. [Google Scholar] [CrossRef] [PubMed]
  41. Prasad, A.; Merico, D.; Thiruvahindrapuram, B.; Wei, J.; Lionel, A.C.; Sato, D.; Rickaby, J.; Lu, C.; Szatmari, P.; Roberts, W. A discovery resource of rare copy number variations in individuals with autism spectrum disorder. G3 Genes Genomes Genet. 2012, 2, 1665–1685. [Google Scholar] [CrossRef] [Green Version]
  42. Lewis, K.E.; Sharan, K.; Takumi, T.; Yadav, V.K. Skeletal Site-specific Changes in Bone Mass in a Genetic Mouse Model for Human 15q11-13 Duplication Seen in Autism. Sci. Rep. 2017, 7, 1–8. [Google Scholar] [CrossRef] [PubMed] [Green Version]
  43. Calarge, C.A.; Schlechte, J.A. Bone mass in boys with autism spectrum disorder. J. Autism Dev. Disord. 2017, 47, 1749–1755. [Google Scholar] [CrossRef]
  44. Neumeyer, A.M.; Sokoloff, N.C.; McDonnell, E.; Macklin, E.A.; McDougle, C.J.; Misra, M. Bone microarchitecture in adolescent boys with autism spectrum disorder. Bone 2017, 97, 139–146. [Google Scholar] [CrossRef] [PubMed]
  45. Ekhlaspour, L.; Baskaran, C.; Campoverde, K.J.; Sokoloff, N.C.; Neumeyer, A.M.; Misra, M. Bone density in adolescents and young adults with autism spectrum disorders. J. Autism Dev. Disord. 2016, 46, 3387–3391. [Google Scholar] [CrossRef] [Green Version]
  46. Karasik, D.; Rivadeneira, F.; Johnson, M.L. The genetics of bone mass and susceptibility to bone diseases. Nat. Rev. Rheumatol. 2016, 12, 323. [Google Scholar] [CrossRef] [PubMed]
  47. Albert, J.S.; Bhattacharyya, N.; Wolfe, L.A.; Bone, W.P.; Maduro, V.; Accardi, J.; Adams, D.R.; Schwartz, C.E.; Norris, J.; Wood, T. Impaired osteoblast and osteoclast function characterize the osteoporosis of Snyder-Robinson syndrome. Orphanet J. Rare Dis. 2015, 10, 27. [Google Scholar] [CrossRef] [Green Version]
  48. Li, X.; Chauhan, A.; Sheikh, A.M.; Patil, S.; Chauhan, V.; Li, X.M.; Ji, L.; Brown, T.; Malik, M. Elevated immune response in the brain of autistic patients. J. Neuroimmunol. 2009, 207, 111–116. [Google Scholar] [CrossRef] [Green Version]
  49. Ashwood, P.; Krakowiak, P.; Hertz-Picciotto, I.; Hansen, R.; Pessah, I.N.; Van de Water, J. Altered T cell responses in children with autism. Brain. Behav. Immun. 2011, 25, 840–849. [Google Scholar] [CrossRef] [Green Version]
  50. Chez, M.G.; Dowling, T.; Patel, P.B.; Khanna, P.; Kominsky, M. Elevation of tumor necrosis factor-alpha in cerebrospinal fluid of autistic children. Pediatr. Neurol. 2007, 36, 361–365. [Google Scholar] [CrossRef]
  51. Xie, J.; Huang, L.; Li, X.; Li, H.; Zhou, Y.; Zhu, H.; Pan, T.; Kendrick, K.M.; Xu, W. Immunological cytokine profiling identifies TNF-α as a key molecule dysregulated in autistic children. Oncotarget 2017, 8, 82390. [Google Scholar] [CrossRef] [Green Version]
  52. Goines, P.E.; Ashwood, P. Cytokine dysregulation in autism spectrum disorders (ASD): Possible role of the environment. Neurotoxicol. Teratol. 2013, 36, 67–81. [Google Scholar] [CrossRef] [PubMed] [Green Version]
  53. Masi, A.; Breen, E.J.; Alvares, G.A.; Glozier, N.; Hickie, I.B.; Hunt, A.; Hui, J.; Beilby, J.; Ravine, D.; Wray, J. Cytokine levels and associations with symptom severity in male and female children with autism spectrum disorder. Mol. Autism 2017, 8, 63. [Google Scholar] [CrossRef]
  54. Shen, L.; Feng, C.; Zhang, K.; Chen, Y.; Gao, Y.; Ke, J.; Chen, X.; Lin, J.; Li, C.; Javed, I. Proteomics study of peripheral blood mononuclear cells (PBMCs) in autistic children. Front. Cell. Neurosci. 2019, 13, 105. [Google Scholar] [CrossRef] [PubMed]
  55. Manchia, M.; Piras, I.S.; Huentelman, M.J.; Pinna, F.; Zai, C.C.; Kennedy, J.L.; Carpiniello, B. Pattern of gene expression in different stages of schizophrenia: Down-regulation of NPTX2 gene revealed by a meta-analysis of microarray datasets. Eur. Neuropsychopharmacol. 2017, 27, 1054–1063. [Google Scholar] [CrossRef] [PubMed]
Figure 1. Workflow of data selection and meta-analysis. The Gene Expression Omnibus was searched for human post-mortem RNA-Seq gene expression profiling datasets of brain cortex from autism spectrum disorder patients. Functional analysis was performed on the data obtained from the meta-analysis of the selected datasets.
Brainsci 10 00747 g001
Figure 2. Venn diagram showing the number of differential expressed genes from individual studies and meta-analysis.
Brainsci 10 00747 g002
Figure 3. (A) Dot plot showing the Gene Ontology (biological process, cellular process, molecular function) analysis for the differentially expressed genes (DEGs) identified in the meta-analysis. Dots are color-coded from blue to red based on the adjusted p-value. The size of the dots is proportional to gene count. (B) Bar plot shows KEGG molecular pathways enriched by the DEGs (p-value <0.05). Bars are color-coded from blue to red based on the adjusted p-value.
Brainsci 10 00747 g003
Figure 4. PPI subnetwork analysis of differentially expressed genes (DEGs). Circles represent nodes and grey lines represent interaction partners of the DEGs. The green nodes represent upregulated DEGs, while the red nodes represent downregulated DEGs.
Brainsci 10 00747 g004
Figure 5. Network constructions of differentially expressed genes and transcription factors. Pink indicates genes and blue squares represent transcription factor. The larger blue squares show the hub transcription factor. The grey lines represent interaction.
Brainsci 10 00747 g005
Figure 6. Network constructions of differentially expressed genes and transcription factors. Pink indicates genes and blue squares represent transcription factors. The grey lines represent interaction. The larger blue squares show important disease pathways.
Brainsci 10 00747 g006
Table 1. Characteristics of datasets employed in the study.
GEO AccessionBrainNo of Sample
GSE64018cortexControl: 12
ASD:12
GSE30573cortexControl: 3
ASD: 3
GEO: Gene Expression Omnibus.
Table 2. Newly differentially expressed genes newly identified in the meta-analysis.
Ensemble IDGene SymbolFDRAverage log2FCRegulation of Direction
ENSG00000077420APBB1IP5.92E-061.02Upregulated
ENSG00000134516DOCK26.38E-051.07Upregulated
ENSG00000142102PGGHG0.0002231.06Upregulated
ENSG00000146192FGD20.0003941.27Upregulated
ENSG00000142583SLC2A50.0004491.31Upregulated
ENSG00000188282RUFY40.0005372.67Upregulated
ENSG00000053918KCNQ10.0005531.11Upregulated
ENSG00000123338NCKAP1L0.0007031.15Upregulated
ENSG00000107099DOCK80.0008231.04Upregulated
ENSG00000249825AC012636.10.0012741.21Upregulated
ENSG00000128602SMO0.0014871.19Upregulated
ENSG00000213694S1PR30.0016251.06Upregulated
ENSG00000184574LPAR50.0018791.25Upregulated
ENSG00000198142SOWAHC0.0022181.07Upregulated
ENSG00000197324LRP100.0022691.22Upregulated
ENSG00000104903LYL10.002295-1.01Upregulated
ENSG00000152192POU4F10.0024493.19Upregulated
ENSG00000188511C22orf340.0025281.09Upregulated
ENSG00000132561MATN20.0031221.00Upregulated
ENSG00000137767SQOR0.0034061.14Upregulated
ENSG00000178623GPR350.0038681.10Upregulated
ENSG00000137693YAP10.0042741.18Upregulated
ENSG00000187554TLR50.0047641.05Upregulated
ENSG00000155465SLC7A70.0051331.10Upregulated
ENSG00000092531SNAP230.0053081.03Upregulated
ENSG00000183508TENT5C0.0054271.61Upregulated
ENSG00000136732GYPC0.0055341.03Upregulated
ENSG00000258701LINC006380.0056091.23Upregulated
ENSG00000158516CPA20.0057422.25Upregulated
ENSG00000135245HILPDA0.0060651.25Upregulated
ENSG00000125398SOX90.0062251.24Upregulated
ENSG00000142512SIGLEC100.0064481.31Upregulated
ENSG00000105137SYDE10.0067571.05Upregulated
ENSG00000084093REST0.0069651.20Upregulated
ENSG00000167393PPP2R3B0.0071561.02Upregulated
ENSG00000174348PODN0.0071831.08Upregulated
ENSG00000143384MCL10.0072611.05Upregulated
ENSG00000231327LINC018160.0074091.07Upregulated
ENSG00000168209DDIT40.0077871.04Upregulated
ENSG00000127418FGFRL10.0078331.05Upregulated
ENSG00000225032AL162586.10.0081331.14Upregulated
ENSG00000101916TLR80.0084092.09Upregulated
ENSG00000155926SLA0.0084771.07Upregulated
ENSG00000121933TMIGD30.0084911.16Upregulated
ENSG00000205336ADGRG10.0085431.04Upregulated
ENSG00000101057MYBL20.00873.23Upregulated
ENSG00000165806CASP70.0088791.09Upregulated
ENSG00000223764LINC025930.0088791.67Upregulated
ENSG00000104689TNFRSF10A0.0094341.10Upregulated
ENSG00000225684FAM225B0.0097461.62Upregulated
FDR: False Discovery Rate; FC: Fold Change.
Table 3. Hub proteins identified from protein–protein interaction network analysis of corresponding proteins encoded by the differentially expressed genes obtained in the meta-analysis.
Gene SymbolDescriptionRegulationDegreeBiological SignificanceReference
BAG3BAG cochaperone 3Up23Parkinson’s disease[20]
CDK2Cyclin dependent kinase 2Up25Involved in cell cycle regulationGeneCard
CDKN1ACyclin dependent kinase inhibitor 1AUp22Implicated in ASD in dorsolateral prefrontal cortex region of brain[21]
EZH2Enhancer of zeste 2 polycomb repressive complex 2 subunitUp18Genetic variation of EZH2-a chromatin remodeling factors is observed in intellectual disabilities and ASD; EZH2 in human embryonic brain suggesting a contributory role of this gene in etiology of ASD in Chinese population[22,23]
HDAC1Histone Deacetylase 1Up35Several studies have suggested a role for HDAC1 and HDAC2 in learning and memory behaviors[24]
GABARAPL1GABA Type A Receptor Associated Protein Like 1Down19ASD associated pathway[25]
MYCMYC proto-oncogeneUp54Implicated in tumorigenesis and metabolism[26]
TRAF1TNF receptor associated factor 1Up16Involved in inflammation and aberrant expression leads to inflammatory disease[27]
VIMVimentinUp16Disease involved in VIM is cataractGenecards database
Table 4. Post-transcriptional regulatory biomolecules identified from differentially expressed genes–transcriptional interaction networks.
TFsDescriptionDegreeMolecular SignificanceNoveltyReference
FOXC1forkhead box C1785deletion or duplication of FOXC1 are related with cerebellar and cerebellar malformationNovel[28]
GATA2GATA binding protein 2652GATA2 is involved in maintaining the development of GABAergic neurons, its association with development of ASD is not known yet.Novel[29]
YY1YY1 transcription factor413both deletions and de novo point mutations affecting YY1 activity trigger Intellectual Disability syndrome of haploinsufficiencyNovel[30]
FOXL1Forkhead Box L1353The role of the TF FOXL1 is not known in neurodevelopmental disorderNovel[31]
USF2Upstream Stimulatory Factor 2325USF2 is one of the major TFs that bind in brain.12 known ASD SNPs are associated validated TF binding sites of YY1, E2F1 and USF2 enriched in neurodevelopmental and neuropshiatric disorderKnown[31]
NFICNuclear Factor I C 305highly enriched in neurodevelopmental disorder, not known in ASDNovel[32]
NFKB1Nuclear Factor Kappa B Subunit 1297identified NFKB1 play crucial role in etiology of treatment refractory schizophrenia in Chinese Han population; not known in ASDNovel[33]
E2F1E2F Transcription Factor 128712 known ASD SNPs are associated validated TF binding sites of YY1, E2F1 and USF2 enriched in neurodevelopmental and neuropsychiatric disorder PPI network. Many of these SNPs are correlated with synaptic transmission.Known[31]
TFAP2ATranscription Factor AP-2 Alpha263The role of the TF TFAP2A is not known in neurodevelopmental disorder.Novel-
HINFPHistone H4 Transcription Factor258The role of the TF TFAP2A is not known in neurodevelopmental disorder.Novel-
Publisher’s Note: MDPI stays neutral with regard to jurisdictional claims in published maps and institutional affiliations.

