Article

Chronic Valproic Acid Administration Increases Plasma, Liver, and Brain Ammonia Concentration and Suppresses Glutamine Synthetase Activity

by
Abdelnaser A. Badawy
1,2,†,
Rasha Elghaba
3,†,
Mohamed Soliman
4,
Abdelaziz M. Hussein
3,*,
Sana A. AlSadrah
5,
Amira Awadalla
6 and
Osama A. Abulseoud
7,*
1
Department of Biochemistry, Faculty of Medicine, Northern Border University, Arar 73213, Saudi Arabia
2
Department of Biochemistry, Faculty of Medicine, Mansoura University, Mansoura 35516, Egypt
3
Department of Medical Physiology, Faculty of Medicine, Mansoura University, Mansoura 35516, Egypt
4
Department of Microbiology, Faculty of Medicine, Northern Border University, Arar 73213, Saudi Arabia
5
Department of Preventive Medicine, Governmental Hospital Khobar, Health Centers in Khobar, Ministry of Health, Khobar 34446, Saudi Arabia
6
Center of Excellence and Cancer Genome, Mansoura Urology and Nephrology Center, Mansoura 35516, Egypt
7
Neuroimaging Research Branch, IRP, National Institute on Drug Abuse, National Institutes of Health, Biomedical Research Center, Baltimore, MD 21224, USA
*
Authors to whom correspondence should be addressed.
These two authors contributed equally.
Submission received: 1 September 2020 / Revised: 7 October 2020 / Accepted: 15 October 2020 / Published: 21 October 2020

Abstract

:
Asymptomatic valproic acid (VPA)-induced hyperammonemia in the absence of liver impairment is fairly common. However, the underlying mechanisms through which VPA causes elevation in plasma ammonia (NH4) remains under investigation. Male Sprague Dawley rats (n = 72) were randomly allocated to receive VPA 400 mg/kg, 200 mg/kg, or vehicle IP daily for either 8, 14, or 28 consecutive days. The behavioral effects of VPA were assessed. Plasma, liver, and prefrontal cortex (PFC), striatum (Str), and cerebellum (Cere) were collected 1 h post last injection and assayed for NH4 concentration and glutamine synthetase (GS) enzyme activity. Chronic VPA treatment caused attenuation of measured behavioral reflexes (p < 0.0001) and increase in plasma NH4 concentration (p < 0.0001). The liver and brain also showed significant increase in tissue NH4 concentrations (p < 0.0001 each) associated with significant reduction in GS activity (p < 0.0001 and p = 0.0003, respectively). Higher tissue NH4 concentrations correlated with reduced GS activity in the liver (r = −0.447, p = 0.0007) but not in the brain (r = −0.058, p = 0.4). Within the brain, even though NH4 concentrations increased in the PFC (p = 0.001), Str (p < 0.0001), and Cere (p = 0.01), GS activity was reduced only in the PFC (p < 0.001) and not in Str (p = 0.2) or Cere (p = 0.1). These results suggest that VPA-induced elevation in plasma NH4 concentration could be related, at least in part, to the suppression of GS activity in liver and brain tissues. However, even though GS is the primary mechanism in brain NH4 clearance, the suppression of brain GS does not seem to be the main factor in explaining the elevation in brain NH4 concentration. Further research is urgently needed to investigate brain NH4 dynamics under chronic VPA treatment and whether VPA clinical efficacy in treating seizure disorders and bipolar mania is impacted by its effect on GS activity or other NH4 metabolizing enzymes.

1. Introduction

Valproic acid (VPA) is one of the most widely used medications for different types of seizures [1,2] bipolar mania [3], and migraine headache prophylaxis [4]. The clinical use of VPA is associated with a wide range of adverse events from mild nausea and vomiting to hepatotoxicity and pancreatitis [5]. However, VPA-induced elevation in plasma ammonia (NH4) concentration is one of the most intriguing side effects of VPA in patients with psychiatric disorders or epilepsy. A review of 24 studies reported that the prevalence of VPA-associated hyperammonemia ranged between 70% and 100% in prospective studies and between 16% and 100% in cross-sectional studies [6]. One retrospective chart review for 347 patients admitted to a psychiatric unit reported the incidence of VPA-hyperammonemia is about 36%, with 43.2% of those patients with VPA-induced hyperammonemia presenting with symptoms [7]. This incidence is very close to the 27.8% incidence reported in 158 patients with epilepsy [8]. However, other studies reported higher rates of 72.5% (27/40) in elderly psychiatric patients [9] and in patients with seizure disorder 52% (29/55) [10]. VPA-induced hyperammonemia is also reported during VPA loading dose (20 or 30 mg/kg) at 6 or 10 mg/kg/min, one-hour post-VPA infusion. Plasma NH4 doubled reaching 92.5 ± 38.2 µmol/L at 60 min and returned to baseline concentration at 24 h in 66% of cases [11]. Hyperammonemia has also been reported in a Chinese cohort of 21 patients with seizure disorder undergoing VPA treatment. The mean NH4 level was 138 ± 68 µmol/L [12]. In the vast majority of these studies, over 50% of patients remains asymptomatic, and, in those who present with encephalopathy, the level of NH4 does not seem to correlate with the severity of symptoms [6,13,14]. Equally important, liver functions were all within normal range, which raises the question about the mechanism of hyperammonemia [15].
Under normal physiological conditions, NH4 is generated in the gut through amino acid catabolism in the intestinal mucosal cells and by the bacterial microflora in the colon [16]. This NH4 is handled by liver hepatocytes through two different systems: the high-capacity, low-affinity urea cycle and the high-affinity, but low-capacity glutamine synthetase (GS) system. These two systems provide effective means of metabolizing NH4 delivered to the liver and ensuring low levels of NH4 reaching systemic circulation [17].
The kidney is another source of NH4 generation through the hydrolysis of glutamine in the proximal renal tubules by glutaminase enzyme. One study on 20 patients showed that the administration of 1500 mg VPA provoked in the kidney an increased glutamine uptake correlated with an increased NH4 release, as shown by the changes of the renal arterial–venous concentration differences of glutamine and NH4 [18]. This increase in NH4 is due to the activation of the glutaminase enzyme as shown by incubating VPA (0.01–10 mM) with human kidney cortex tubule slices for 60 min [19].
These data suggest that the kidneys contribute to VPA-induced hyperammonemia. However, the elevation in plasma NH4 could also be due to reduced NH4 clearance in other organs such as the liver and the brain. Since the human kidney cortex is devoid of GS activity [20] and urea cycle enzyme activities in the liver do not show changes reflecting inability of the liver to detoxify ammonia during VPA-induced hyperammonemia [21], the removal of excessive NH4 through incorporation into glutamine by glutamine synthetase (GS) enzyme in the liver and brain should be examined.
In the brain, NH4 is generated during glutamatergic and GABAergic neurotransmission by the phosphate-activated glutaminase enzyme (PAG), which generates NH4 and glutamate from glutamine [22]. Another portion of brain NH4 comes through diffusion from the plasma across the blood–brain barrier. Normally, the ratio of brain to blood NH4 ranges between 1.5:1 and 3.0:1 [23]. Brain NH4 is maintained at low concentrations through efficient clearance by the GS enzyme [23,24]. In addition, high brain NH4 could diffuse back into the blood [25] and cause elevation in plasma ammonia if the limited capacity of the GS enzyme is exceeded.
We have recently shown that transient elevation in plasma NH4 could originate from the brain after a single injection of tetrahydro-cannabinoid (THC) due to the suppression of striatal GS enzyme activity [26]. Similarly, a VPA 1.2 mM application to astrocyte cell culture was associated with 30% reduction in GS activity [27]. Furthermore, GS gene polymorphism (GLUL rs10797771) had significant associations with plasma NH4 level elevation during VPA treatment in a cohort of 202 Japanese pediatric patients with epilepsy [28]. The effect of VPA on GS activity depends on several factors. For example, hippocampal GS activity increased by 43% in male rats prenatally exposed to VPA when examined at post-natal day 15, but VPA caused significant reduction (27%) in GS activity at post-natal day 120 [29]. As such, the complex effects of VPA on brain GS activity and its potential contribution to the elevation in plasma NH4 is not entirely clear. In this study, we hypothesized that chronic VPA administration will induce elevation in plasma, brain, and liver NH4 concentration and concomitant reduction in GS activity.

2. Material and Methods

2.1. Animals

All experimental procedures were approved by and conducted according to the guidelines of the institutional animal care committee of Mansoura College of Medicine (# r/17.01.102). Eighty male Sprague Dawley rats, aged 12–16 weeks and weighing 200–250 g at the beginning of the study were used. Rats were individually housed in separate cages with a free supply of food (ad libitum) and tap water under a 12:12 light:dark cycle, with lights turned on at 6 a.m. Behavioral assessments were done during the light phase.

2.2. Study Design

Three main experimental groups (n = 24 each) were used; vehicle control, VPA 200 mg/kg, and VPA 400 mg/ kg. Each main group had three subgroups (n = 8 each) depending on the duration of VPA administration at 8, 14, and 28 days. Two groups of rats (n = 4 each) were used to measure VPA plasma level at 20 min (peak) and at 12 h (trough) post 400 mg/kg VPA administration.
Valproic acid sodium salt was purchased from Sigma-Aldrich (St. Louis, MO, USA, catalog # P4543-100G) and dissolved in saline for intraperitoneal (IP) injection (0.5 mL). Vehicle control group received IP injection of 0.5 mL of saline.

2.3. Behavioral Testing

The effect of chronic VPA administration on the level of rat alertness was assessed using the Irwin scoring system [30], which was originally used to assess animal models of hyperammonemia. Irwin’s scale includes the following items (a) Corneal reflex: 0 = none, 2 = sluggish closure, 4 = active single eye-blink, 6 = double eye-blink, and 8 = triple eye-blink; (b) Pinna reflex: 0 = none, 2 = moderate retraction, 3 = slight brisk flick, 4 = active retraction, 5 = moderate brisk flick, 6 = very brisk flick, and 8 = hyperactive repetitive flick barely touch with body withdrawal response; (c) Positional passivity: 0 = no struggle, 2 = held by neck, 4 = held supinely, 6 = held by foreleg, and 8 = held by hindlimbs; and (d) Pain (paw pressure) reflex: 0 = none, 2 = slight withdrawal, 4 = moderate rapid withdrawal, not brisk, 6 = brisk, rapid withdrawal, and 8 = very brisk withdrawal repetitive extension and flexion. Lower total or individual scores indicate more behavioral impairment. Behavioral assessment was done within 5 min from the last VPA administration.

2.4. Animal Euthanasia and Blood Sample Collections and Harvesting of Brain and Liver Tissues

Rats were anesthetized at 60 min post last VPA administration by halothane inhalation, and then euthanized by cervical decapitation. Trunk blood samples were collected in pre-cooled (4 °C) heparinized tubes and centrifuged at 10,000× g for 3 min. Plasma was used immediately for colorimetric ammonia assay as detailed before [26]. Immediately after the decapitation, the brain (prefrontal cortex (PFC), striatum (Str), and cerebellum (Cere)) and the liver tissues were dissected on ice water (4 °C) under light microscopy and transferred on dry ice to a liquid nitrogen till assay.

2.5. VPA Plasma Concentration

VPA assay was performed through chemiluminescent microparticle immunoassay following the manufacturer’s protocol (Abbott Laboratories, Lake Bluff, IL, USA).

2.6. Ammonia Determination in Plasma, Liver, and Brain Tissues

We followed the same methods detailed in our previous report. Briefly, rat plasma (25 µL) was deproteinized with an equal volume of 8% perchloric acid and centrifuged at 4000× g (4 °C) for 5 min. Specimens were neutralized with 2 M potassium bicarbonate and re-centrifuged at 4000× g (4 °C) for 10 min prior to analysis. Following the last collection, specimens were analyzed as mentioned above.
Brain and liver tissues were homogenized in 20 times w/v of ice-cold ammonia kit buffer (BioVision® Milpitas, CA, USA) and centrifuged at 4000× g (4 °C) for 5 min. The ammonia concentration was determined using a commercial ammonia colorimetric assay kit (Biovision®) [26].

2.7. Glutamine Synthetase (GS) Activity in Liver and Brain Tissues

By using a mortar and pestle, about 20–50 mg of brain and liver tissues were homogenized in 1–2 mL cold buffer (50 mm potassium phosphate, pH 7.5, 1 mm EDTA) and centrifuged for 15 min at 4000× g rpm (4 °C). The activity of GS (U/g tissues) was measured in the supernatant of brain and liver homogenates using commercially available kits (MyBio-Source, San Diego, CA, USA MBS8243181), according to the manufacturer’s instructions.

2.8. Statistical Analysis

All data were presented as mean ± SEM (standard error of the mean). Separate two-factor analyses of variance (ANOVAs) with VPA treatment (vehicle vs. 200 mg/kg/d vs. 400 mg/kg/d) and treatment duration (8 vs. 14 vs. 28 days) were used to examine the effect of VPA on behavioral and molecular variables. Tukey’s multiple comparisons tests were used to examine differences between individual groups when ANOVA showed significant effects. Pearson correlations were utilized to examine the relationships between plasma NH4 and behavioral scores and between tissue NH4 concentrations and GS activities. Analysis was performed using GraphPad Prism V8 software. Results are considered significant at p < 0.05.

3. Results

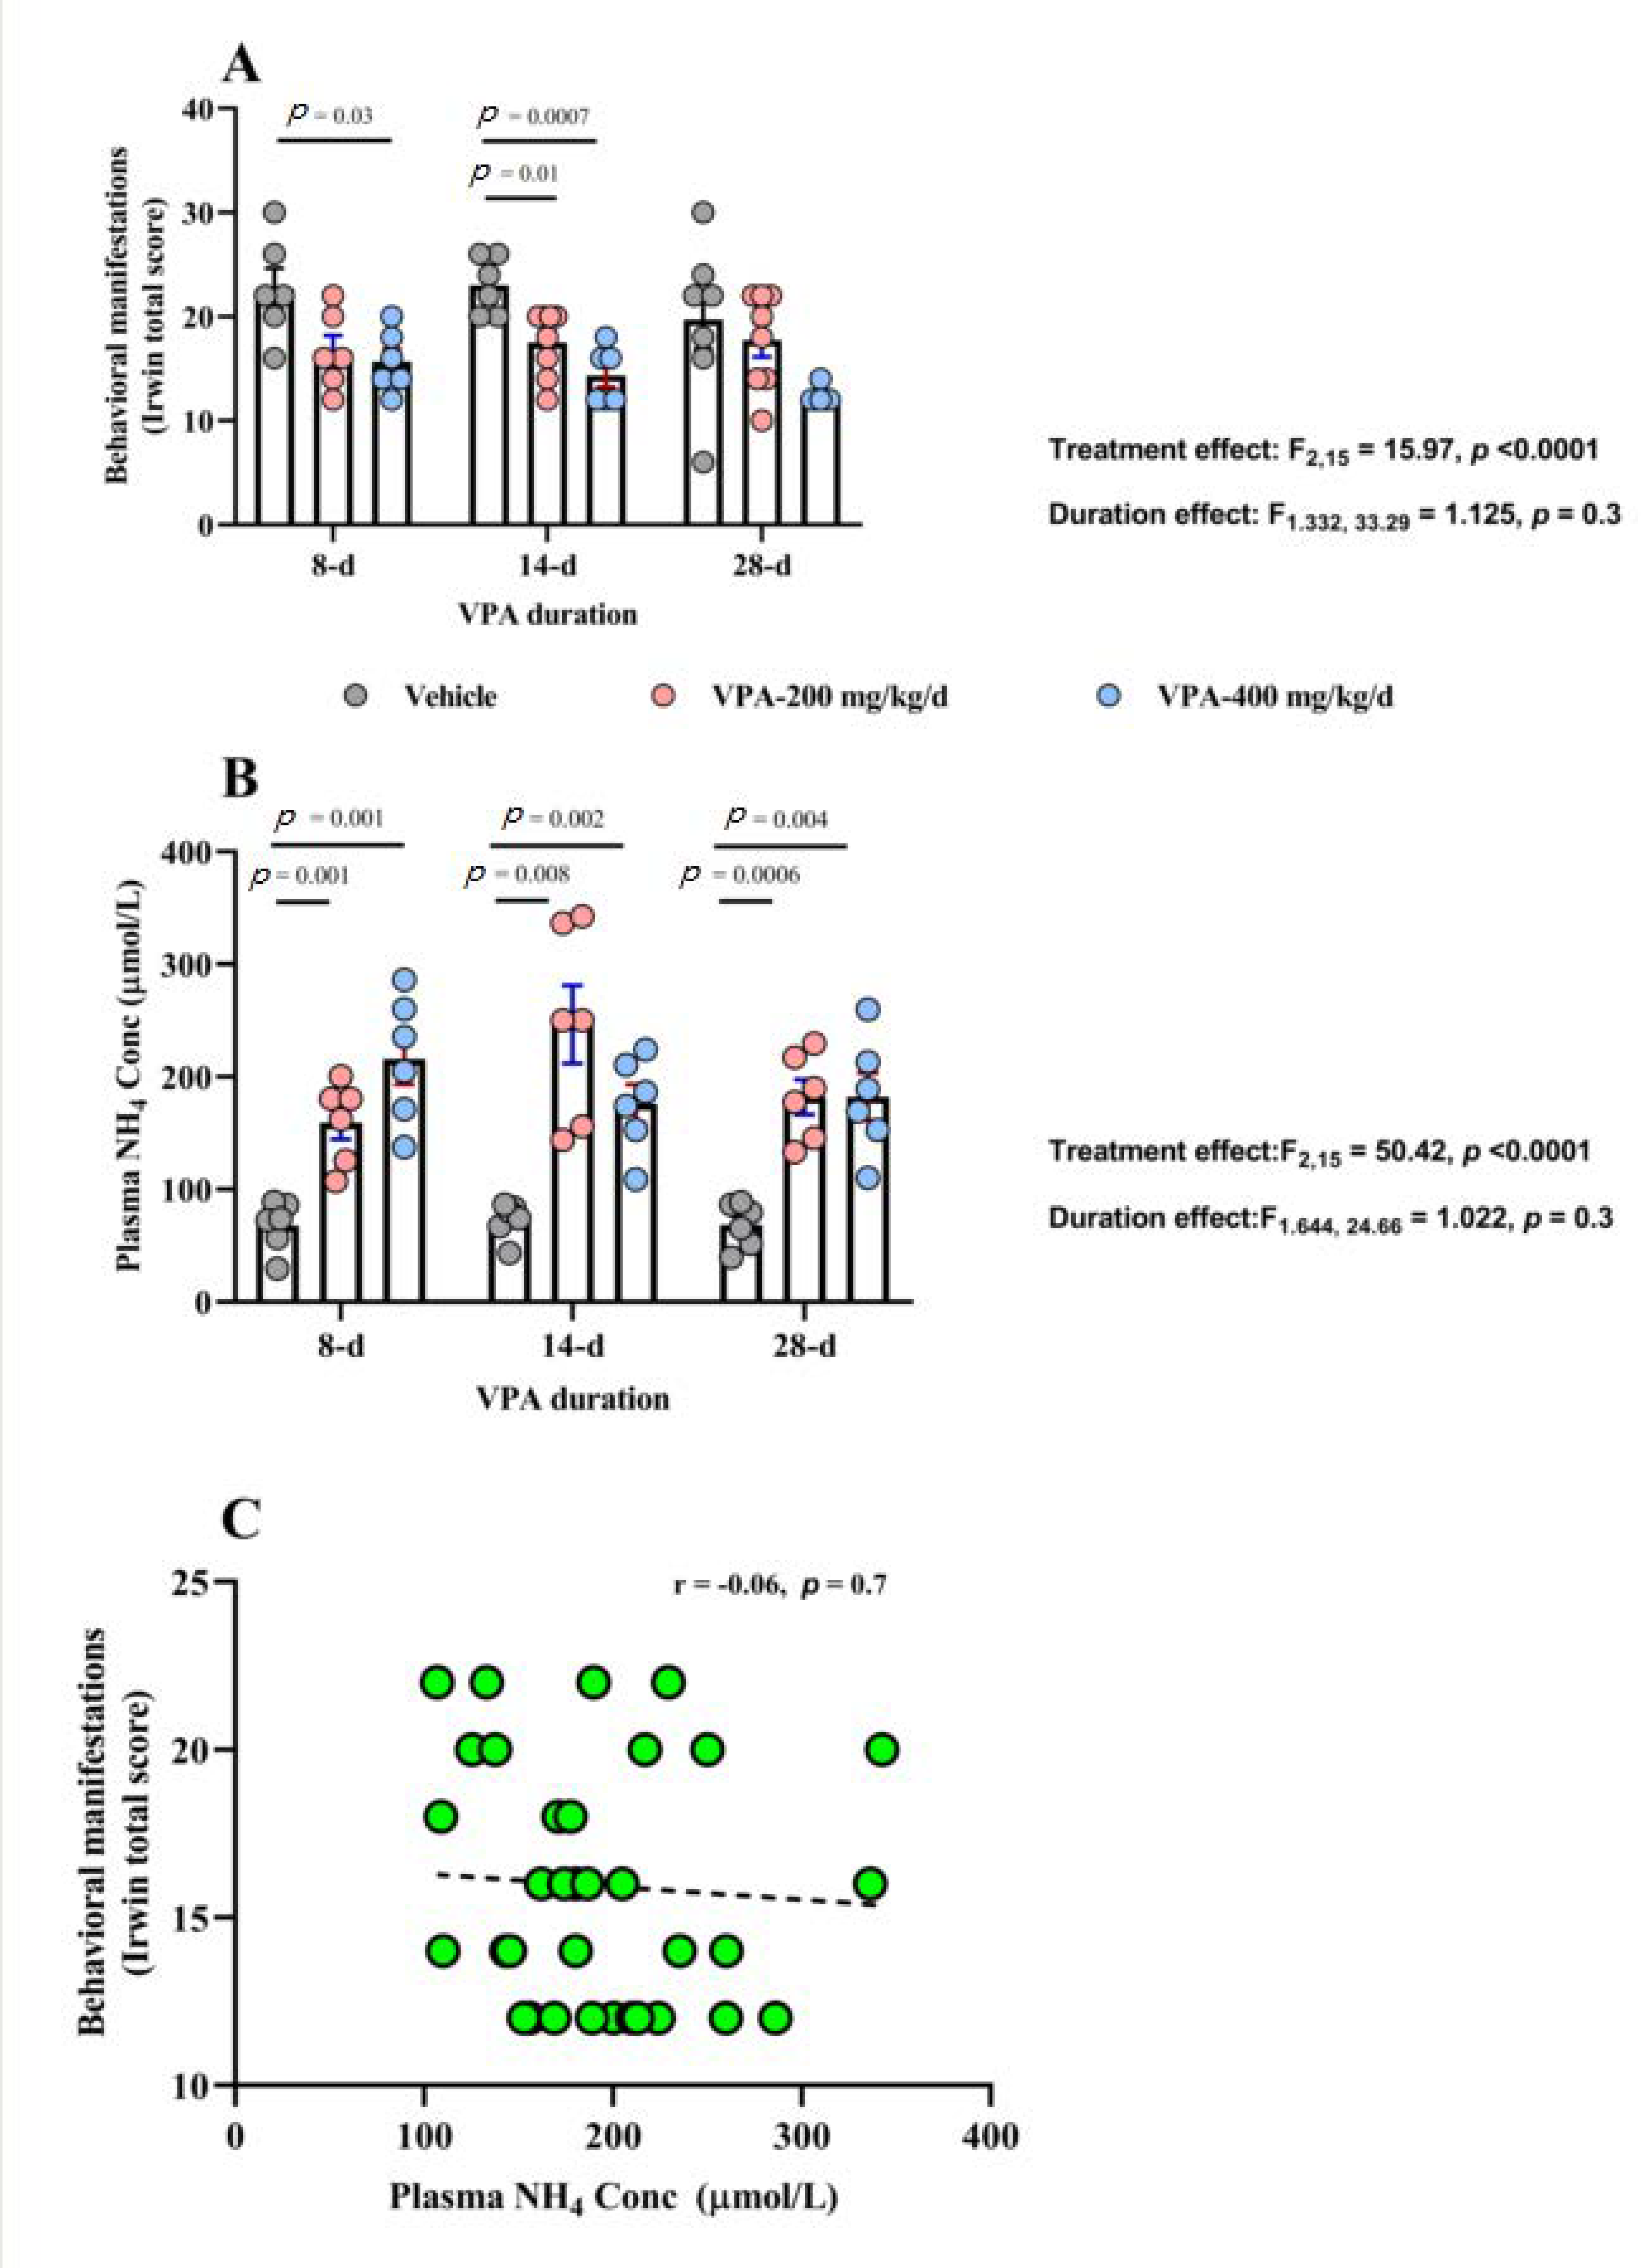
3.1. Behavioral Effects of Chronic VPA Treatment

VPA treatment was associated with significant attenuation in Irwin’s total score, (p < 0.0001). No effect for duration (p = 0.3) and no treatment × duration interaction (p = 0.6) was found. (Table 1 and Figure 1A). Tukey’s multiple comparisons test showed significant differences between vehicle and VPA 200 mg/kg/d at 14 d (p = 0.012) and between vehicle vs. VPA 400 mg/kg/d at 8 d (p = 0.037) and at 14 d (p = 0.0007) but not at 28 d (p = 0.09).

3.2. VPA Plasma Concentration

Peak and trough VPA concentrations were measured in a subgroup of animals (n = 4) at (peak at 20 min post 400 mg/kg dose = 250 ± 28.87 µg/mL and trough at 12 h post dose: 6.21 ± 1.63 µg/mL.

3.3. Effect of Chronic VPA Treatment on Plasma NH4 Concentration

A robust VPA treatment effect was evident on plasma NH4 concentration (p < 0.0001), with significant interaction between VPA treatment and duration (p = 0.03). However, we did not see effect for duration alone (p = 0.3, Figure 1B and Table 2). Tukey’s multiple comparisons test showed both VPA dose groups separated from vehicle group at all three time points: vehicle vs. VPA 200 mg /kg/d at 8 d (p = 0.0016), at 14 d (p = 0.008), and at 28 d (p = 0.0006) and similarly, vehicle vs. VPA 400 mg/kg/d at 8 d (p = 0.0017), at 14 d (p = 0.002), and at 28 d (p = 0.004).
In addition, we did not observe significant correlation between plasma NH4 concentration and Irwin’s behavioral scores within hyperammonemia animals only (r = −0.06, p = 0.7, Figure 1C).
To explore the source for the elevation in plasma NH4, we next examined liver and brain NH4 concentrations and GS activities.

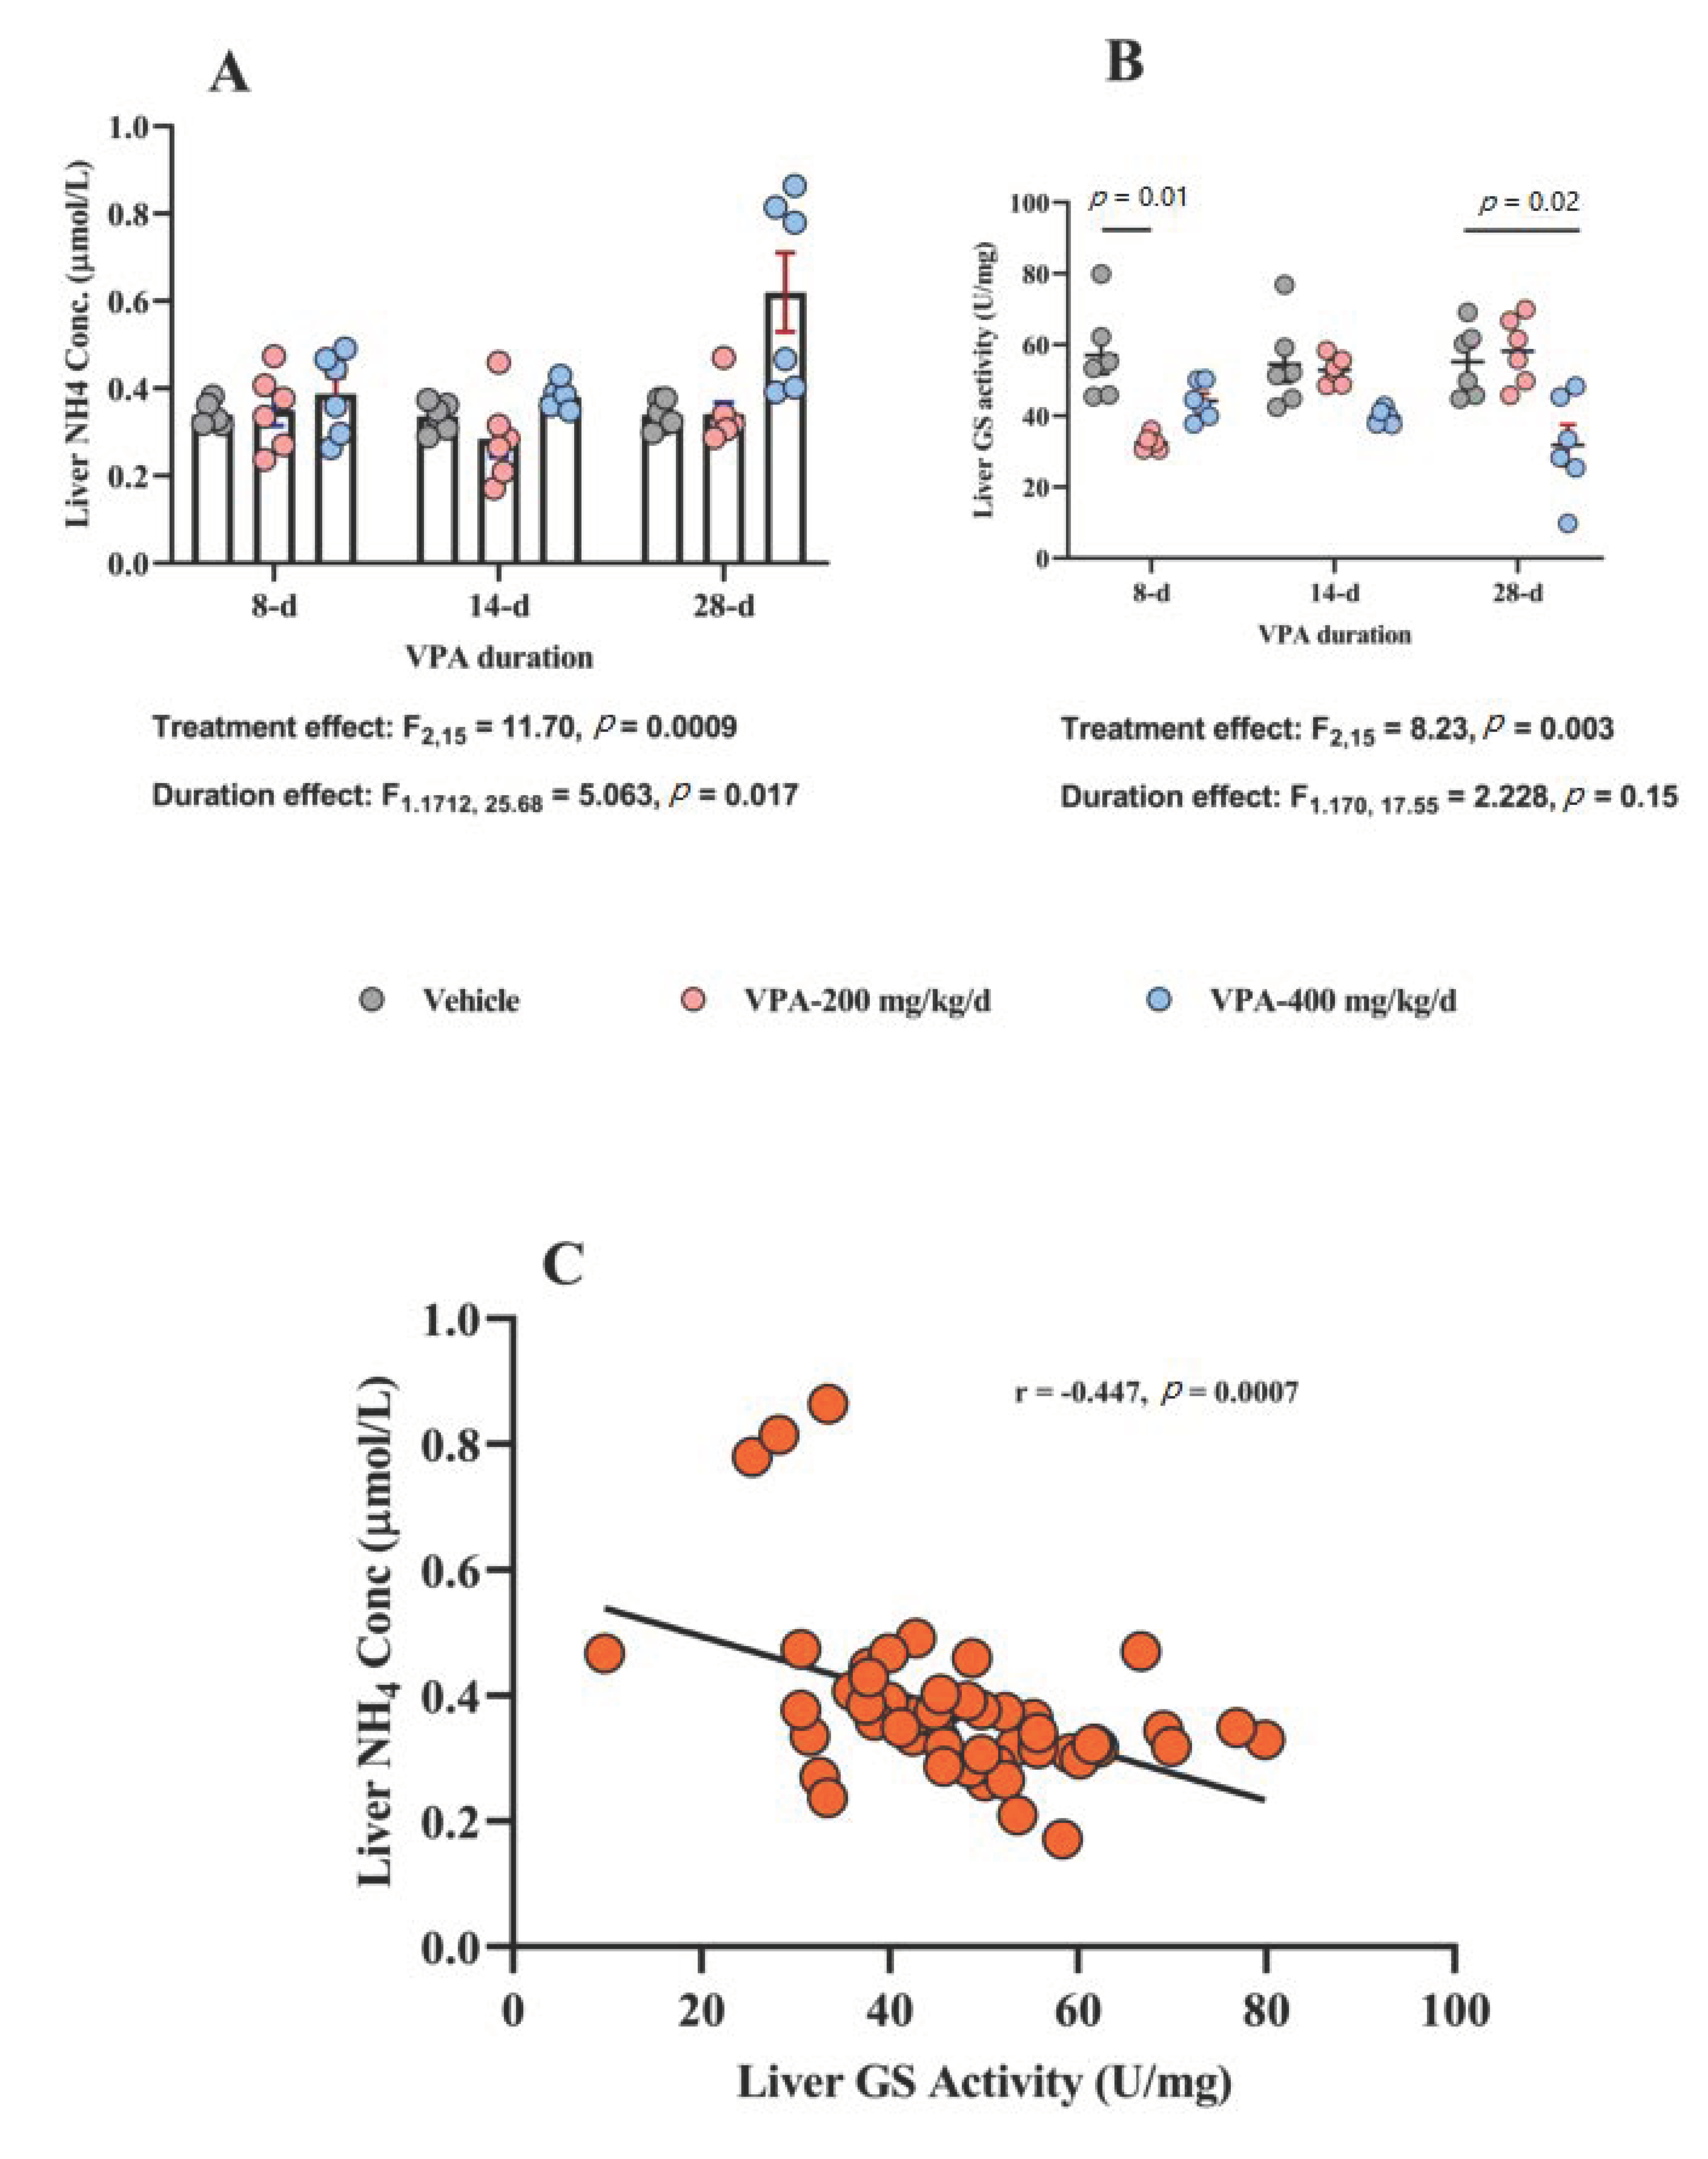
3.4. Effect of Chronic VPA Treatment on Liver NH4 Concentration and GS Activity

VPA treatment was associated with overall significant treatment (p = 0.009) and duration (p = 0.01) effects on liver NH4 concentration and treatment × duration interaction (p = 0.01). However, Tukey’s multiple comparisons test did not show significant differences between individual groups at the three tested time points (Table 2 and Figure 2A). On the other hand, GS activity was reduced by VPA treatment (p = 0.003) independent of treatment duration (p = 0.1) with a significant treatment × duration interaction (p < 0.001). Here, we observed that the lower VPA dose (200 mg/kg/d) was associated with less GS activity compared to vehicle at the short (8 d) treatment duration (p = 0.01) and the higher VPA dose (400 mg/kg/d) at the long (28 d) treatment duration (p = 0.02) by Tukey’s multiple comparisons test (Figure 2B).
Next, we examined the correlation between the increase in liver NH4 concentration and the reduction in GS activity and found a significant negative correlation (r = −0.447, p = 0.0007, Figure 2C).
Here, we thought that VPA-induced hyperammonemia could have hepatic origins through inhibition of hepatic GS activity. However, this does not fully explain the associated behavioral effects we observed earlier, so we examined whether brain NH4 concentration is also elevated through a similar mechanism (i.e., suppression of brain GS activity).

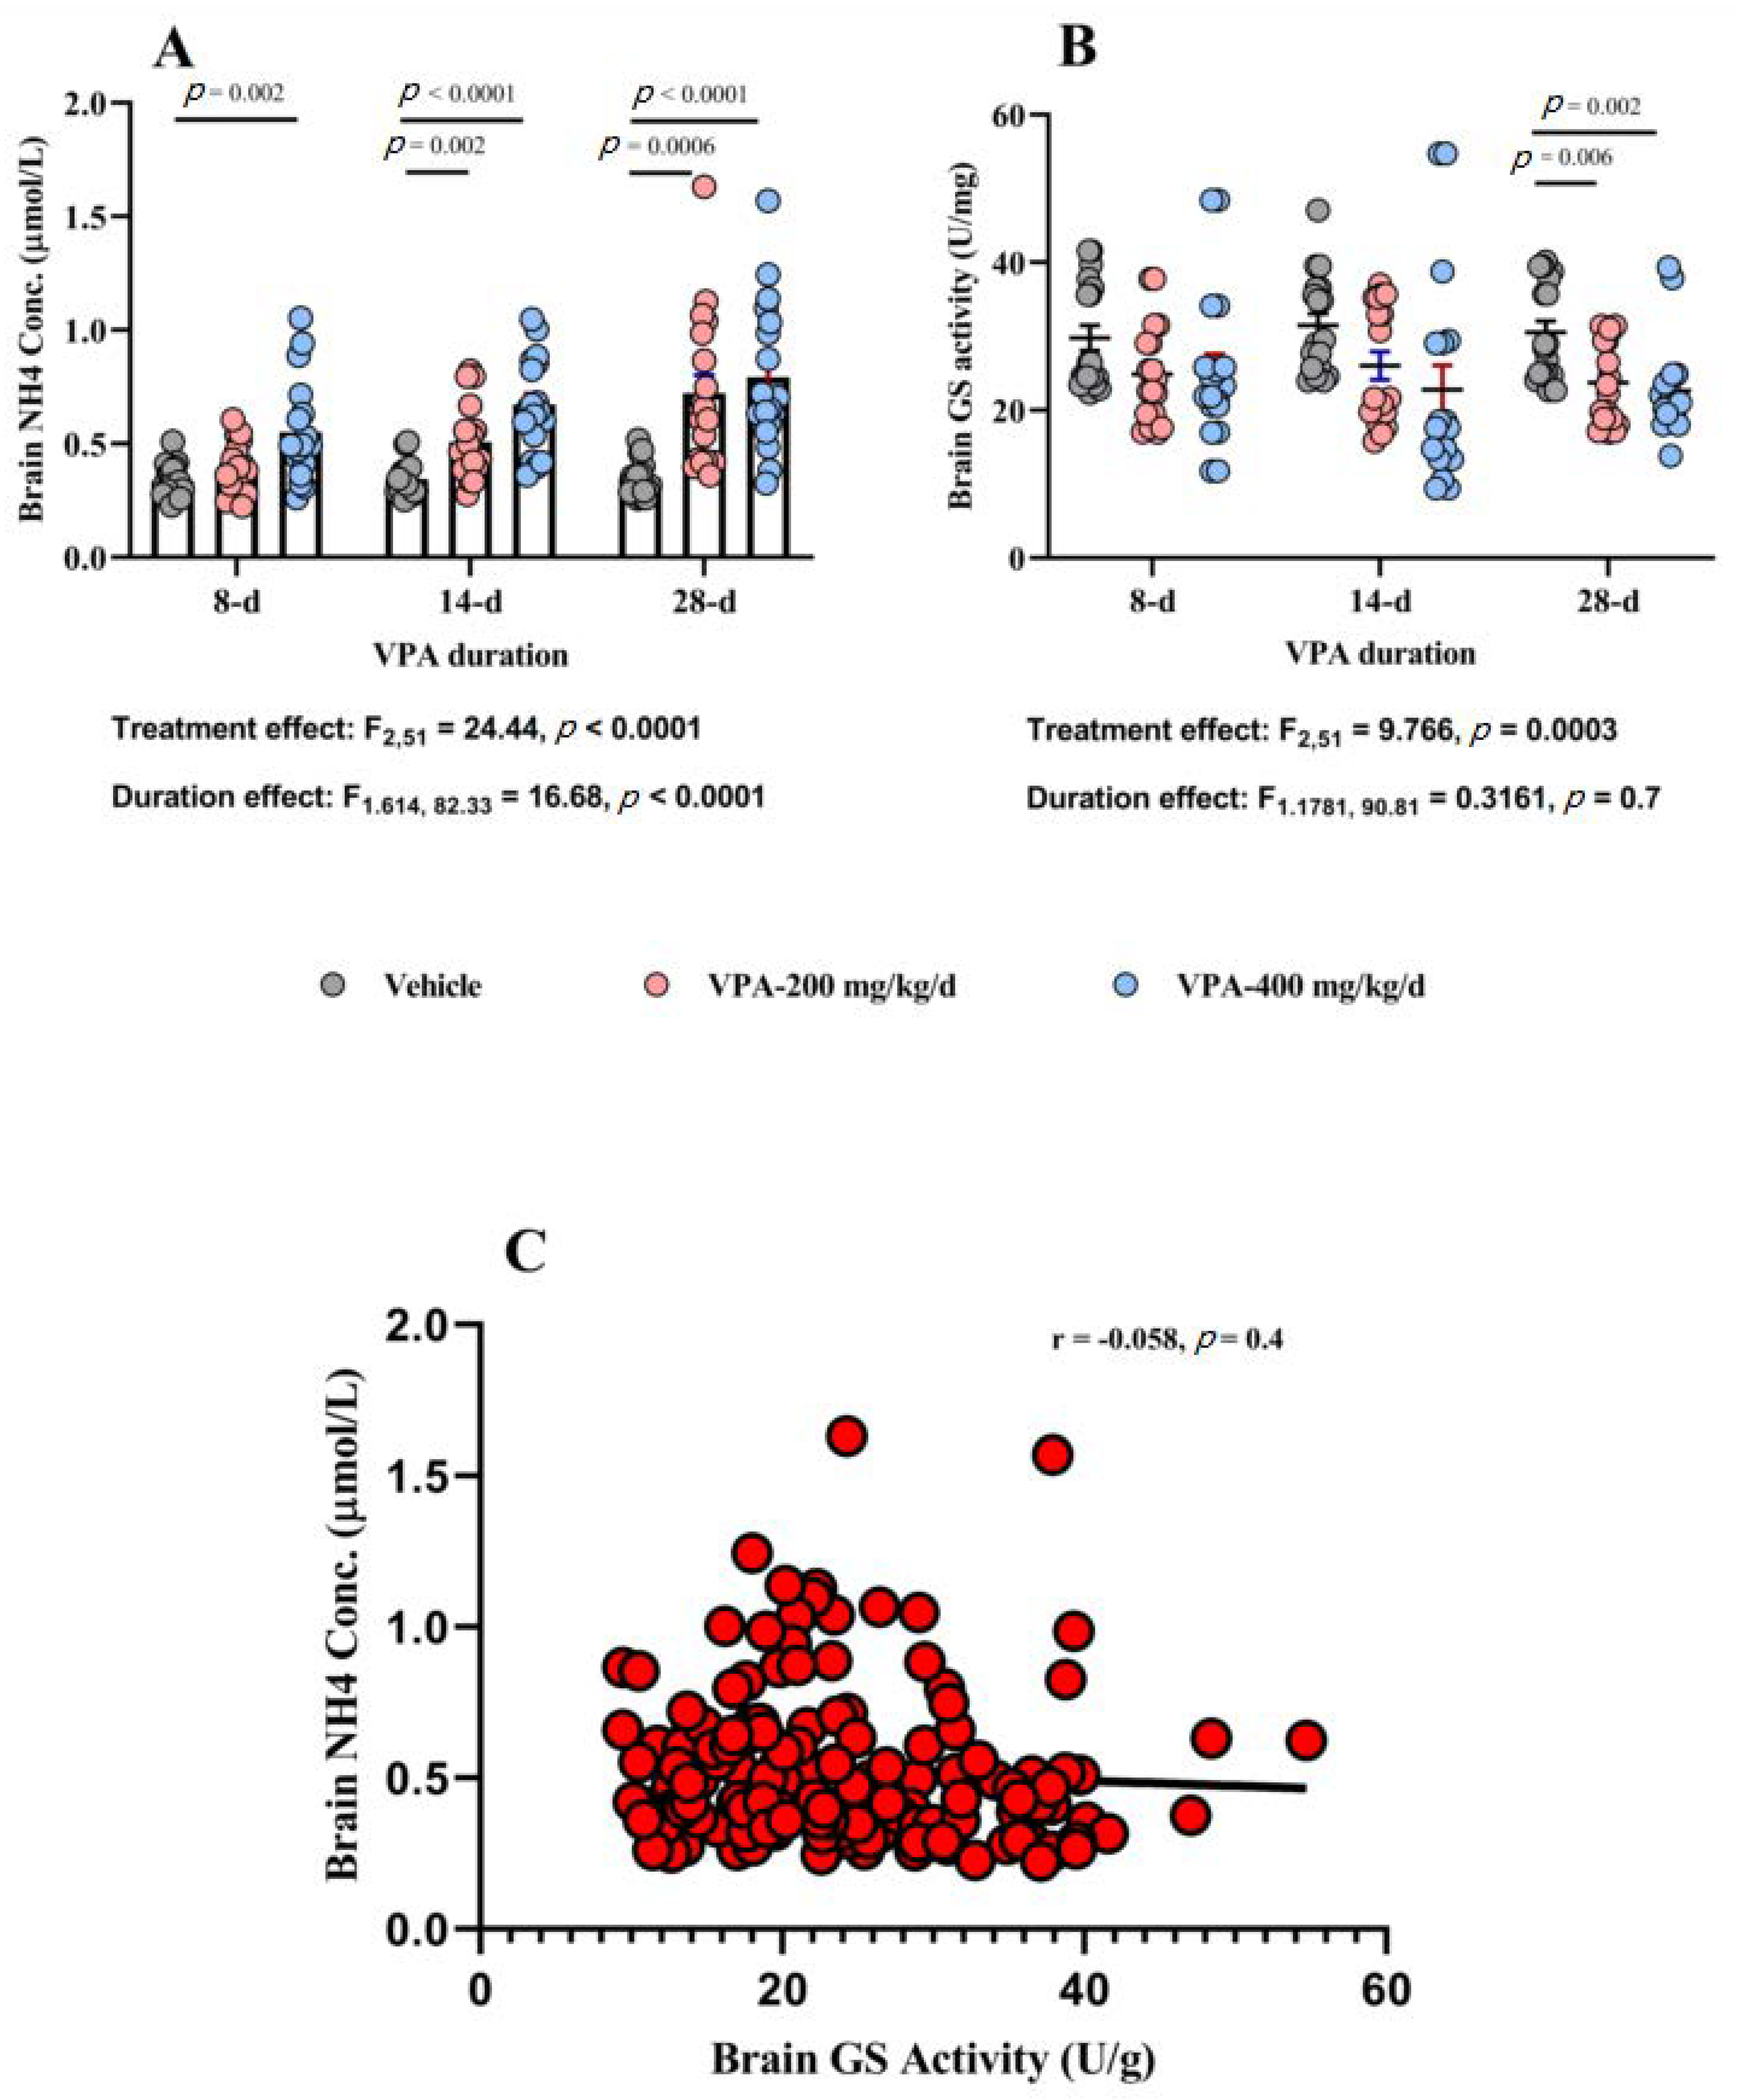
3.5. Effect of Chronic VPA Treatment on Brain NH4 Concentration and GS Activity

VPA treatment caused significant treatment and duration effects (p < 0.0001 each) on brain NH4 concentration and an interaction between the two factors (p = 0.004, Table 2 and Figure 3A). VPA at 200 mg/kg/d doses caused significant elevation in brain NH4 concentration at 14 d (p = 0.002) and at 28 d (p = 0.0006) but not in the 8-d group (p = 0.1) compared to the vehicle group. Similarly, VPA 400 mg/kg/d was associated with significant increase in brain NH4 concentration compared to the vehicle group at 8 d (p = 0.002) and at 14 d and 28 d (p < 0.0001 each). Individual brain region analysis showed that the elevation in brain NH4 concentration is clearly observed in all three areas: PFC, Str, and Cere (p < 0.001 each, Supplementary Figures S1A–S3A).
With this elevation in brain NH4 concentration, we proceeded by measuring brain GS activity, and, as we expected, brain GS activity was significantly reduced by VPA treatment in a treatment (p = 0.0003) but not by duration (p = 0.7) effects, and there was no interaction between both factors (p = 0.8). Further analysis showed that both VPA 200 and 400 mg/kg/d were associated with robust inhibition of GS activity compared to vehicle group at 28 d of treatment (p = 0.006 and p = 0.002, respectively, Table 2 and Figure 3B). Neither VPA dose had significant effect on GS activity at 8 or 14 d of treatment. Further analysis of the three brain regions we examined showed that only the PFC showed a significant effect for VPA on GS activity (p = 0.0006, Figure S1B) but not Str (p = 0.3, Figure S2B) or Cere (p = 0.3, Figure S3B).
The elevation in brain NH4 concentration and the suppression of brain GS activity were not significantly correlated at the level of the whole brain (r = −0.058, p = 0.4, Figure 3C) or in specific regions such as the PFC (r = −0.09, p = 0.4, Figure S1C) or Str (r = −0.26, p = 0.056, Figure S2C). Only the Cere showed a slight but significant negative correlation between NH4 concentration and GS activity (r = −0.286, p = 0.03, Figure S3C).

4. Discussion

The results of this study showed that chronic VPA treatment was associated with elevation in plasma NH4 concentration and behavioral manifestations reminiscent of mild-to-moderate hyperammonemia in animal models of hepatic encephalopathy [31]. This increase in plasma NH4 was also accompanied by a concomitant elevation in liver and brain NH4 concentration and a suppression of GS enzyme activity.
These findings are in agreement with clinical reports of increased plasma ammonia in the course of VPA treatment as detailed in the introduction. However, despite that over 50% of patients with VPA-hyperammonemia remain asymptomatic [8,10,32,33]. Here, we observed subtle behavioral effects for the increase in plasma NH4 levels typical of preclinical reports of dose-dependent reduction in spontaneous locomotor activity in different models of hyperammonemia [34,35]. This apparent contradiction could be related to the ability of animal behavioral assessment scales to capture subtle alterations that would not be easily noticed in routine clinical assessment. A better way to examine the behavioral effects of VPA-associated hyperammonemia could be through testing for specific cognitive domains. Along the same lines, we did not find correlation between the degree of hyperammonemia and Irwin’s total score within hyperammonemia rats only. Our results are in agreement with clinical data where the relationship between behavioral symptoms and NH4 concentration has not been established in human cases [6,14].
Next, we examined whether the increase in plasma NH4 stems from reduced sequestration into glutamine in liver hepatocytes or brain astrocytes. Our results showed significant negative correlation between the degree of GS inhibition and the elevation in NH4 concentration in the liver but not in the brain.
Physiologically, NH4 synthesized by gut bacteria, diffuses through the intestinal wall to the capillaries of the portal venules that drain into haptic sinusoids, which end in central venules. These venules group together to form hepatic veins, which drain into the inferior vena cave and systemic circulation [36]. Hepatocytes, alongside haptic sinusoids, are arranged into hexagonal hepatic lobules centered around central venules. Peripherally located hepatocytes are rich in urea cycle enzymes and phosphate-activated glutaminase (PAG) enzyme, while central cells have higher GS enzyme concentrations [37]. Peripheral periportal cells receive NH4 first and metabolize it into urea. The urea cycle system has a high capacity for NH4 detoxification. However, it also has low affinity, and certain amount of NH4 reaches the pericentral hepatocyte GS system. There, NH4 is sequestered into glutamine, which is exported to other organs for cellular energy and metabolism [37]. Both the urea cycle and the GS systems ensure low plasma NH4 concentration under normal physiological conditions.
Brain NH4, on the other hand, is an integral part of glutamatergic and GABAergic neurotransmission. The brain possesses at least 16 enzymatic pathways for the production of NH4, of which three enzymes (PAG, glutamate dehydrogenase, and purine nucleotide cycle) predominate [23]. NH4 is generated within glutamatergic and GABAergic neurons through the activity of the PAG enzyme [Gln→Glu + NH4]. In GABAergic neurons, PAG-generated glutamate is further converted into GABA by the enzyme glutamic acid decarboxylase. During neuronal firing, equimolar amounts of NH4 are generated with glutamate or GABA neurotransmission. The fate of this brain-synthesized NH4 is variable. Majority will shuttle back from neurons to astrocytes and form glutamine by GS enzyme [38,39,40,41]. The other portion could diffuse back to the plasma [25], especially if GS capacity is exceeded, since the brain does not have all urea cycle enzymes [42].
As such, the origin of plasma NH4 could be traced back to the liver or the brain or to a lesser extent to other organs such as kidney, muscle, or erythrocytes (reviewed in [43]). However, the behavioral aspects of high NH4 concentration suggest brain involvement either directly through NH4 synthesis or reduced clearance or indirectly through NH4 diffusion from plasma to the brain. Since VPA has been shown to increase PAG activity [27], we decided to measure brain GS activity and examine whether it correlates with brain NH4 concentration. Here, found that the elevation in brain tissue NH4 and suppression of GS activity do not significantly correlate, which suggests that the contribution of GS suppression in the observed increase in brain NH4 concentration is modest, and other factors should be examined. Recent data shows GS gene polymorphism (GLUL rs10797771) had significant associations with plasma NH4 level elevation during VPA-based therapy in a cohort of Japanese pediatric patients with epilepsy [28].
At the regional brain level, we detected a high NH4 concentration in all three regions examined. However, concomitant suppression of GS was only evident in the PFC. GS activity in astrocyte culture was reduced by 30% after VPA application [27], and, in agreement with our results, one in-vivo study showed that the effect of VPA on GS activity was region- and time-specific with a robust increase in the hippocampus depending on the duration from prenatal exposure to activity assay [29]. Another study showed no change in hippocampal GS activity after VPA treatment with 200 or 400 mg/kg twice/day for 90 days [44]. Such a simplistic working model entails that VPA directly suppresses GS activity and this causes an increase in brain NH4 concentration. Two observations argue against this schema. First, we did not find significant reduction in GS activities in the Str or Cere despite elevation in NH4 concentration in both regions. Second, no significant correlation was found between the degree of GS suppression and the elevation in NH4 in the PFC, which was the one region that showed GS suppression along with NH4 elevation. Taken together, it is likely that other factors besides GS suppression contribute to brain NH4 levels. For instance, VPA has been reported to increase the activity of the PAG enzyme [27], which could generate NH4 from the breakdown of glutamine. Along the same lines, high plasma NH4 could influx across the blood–brain barrier and increase brain NH4 concentration. Further studies employing N15 spectroscopy [45] to track the source of VPA-induced high brain NH4 and to the estimate glutamate–glutamine shuttle enzyme activities are urgently needed.
Regardless of its cause, high brain NH4 concentration suppresses the astrocytic glutamate transporter leading to reduced glutamate uptake and increased synaptic glutamate concentration [46,47,48], which seems contradictory to the anticonvulsant effect of VPA. Similarly, the relationship between the behavioral effects of VPA and changes in brain GABA remains unclear [49,50,51]. However, suppression of GS means less glutamine is synthesized by astrocytes and, hence, less glutamine is supplied back to neurons [52]. Given that glutamine is the precursor for glutamate, this reduction in neuronal glutamine could lead eventually to a corresponding reduction in glutamate, and, theoretically, a reduction in overall glutamatergic neuronal excitability, which is a core feature of seizure control. Indeed, VPA treatment in hospitalized bipolar patients was associated with normalization of high brain glutamate (glutamate + glutamine GLX) as measured by MR spectroscopy [53]. Moreover, the effect of VPA on the glutamate transporter is also region specific. One study found no effect of chronic VPA treatment on glutamate transport protein expression in the frontal or parietal cortices or in the cerebellum but found a significant increase in the hippocampus [44]. Whether VPA suppression of brain GS activity plays a role in its anticonvulsant mechanism of action remains to be investigated.
The results of this study should be viewed in light of its limitations. First, we used two different VPA doses to ensure adequate VPA blood levels close to those reported in clinical practice. We measured peak and trough VPA concentrations in a subgroup of animals. VPA levels in our report (peak at 20 min post dose: 250 ± 28.87 µg/mL and trough at 12 h post dose: 6.21 ± 1.63 µg/mL) are consistent with pharmacokinetic studies showing that the time required for the maximum concentration of VPA 150 mg/kg was 41 min followed by a rapid decline [54]. One previous study reported that the VPA level at 120 min after a single administration of 360 mg/kg to female Wistar rats was 78.7 ± 29.4 µg/mL [55]. Therapeutic VPA concentrations in human studies show wide variability and range between 50 and 100 µg/mL [56]. However, the correlation between VPA dose and plasma level is poor [57,58]. The level of VPA at 60 min post last dose was 133 ± 36 µM/mL in male Wistar rats that were administered VPA 200 mg/kg twice/d for 90 days [44]. Second, we measured the VPA concentration in a subgroup of animals, hence, we could not examine correlation between plasma VPA and NH4 concentration. However, most [11,12,14], but not all [8,9,32,59], clinical studies reported that VPA and NH4 concentrations are not necessarily corelated. Third, we only quantified GS activity as the primary NH4 metabolizing enzyme in the brain. Including other enzymes such as PAG and alpha ketoglutarate dehydrogenase and measuring cerebrospinal fluid (CSF) NH4 could explain the discrepancy between NH4 elevation and GS suppression. Finally, we only measured NH4 concentration and GS enzyme activity in Str, Cere, and PFC. We selected these specific regions because of their critical involvement in locomotor activity, motor coordination, and cognitive functions. All of which are impaired in symptomatic hyperammonemia [16,34,35]. However, other relevant areas such as the hippocampus and amygdala are also intimately related to seizure and mood disorders and should be investigated in future studies. Despite these limitations, our results bring new insights into the mechanism of VPA-induced hyperammonemia through highlighting the effect of VPA on brain and liver GS and the potential contribution of the brain to the phenomena of VPA-induced high plasma NH4 levels and call for further investigations into the contribution of brain NH4 into the observed elevation in plasma NH4 concentration.

5. Conclusions

The current study highlights two interesting findings. First, hyperammonemia in the course of chronic VPA treatment is not limited to the plasma. Indeed, brain NH4 concentration also increases and may contribute, at least in part, to the clinical picture. Second, the potential mechanistic role of GS suppression in VPA-induced hyperammonemia does not fully explain the elevation of brain NH4. This observation does not come as a surprise, given that brain NH4 regulation is influenced by other enzymes and several other factors such as NH4 transporters, acid-base balance, and exchange of glutamine and branched chain amino acids across blood brain barrier. Future studies should explore all these aspects of brain ammonia economy under VPA treatment.

Supplementary Materials

The following are available online at https://0-www-mdpi-com.brum.beds.ac.uk/2076-3425/10/10/759/s1, Figure S1: Prefrontal Cortex ammonia concentration and glutamine synthetase enzyme activity. Figure S2: Striatal ammonia concentration and glutamine synthetase enzyme activity. Figure S3: Cerebellar ammonia concentration and glutamine synthetase enzyme activity.

Author Contributions

O.A.A., A.M.H., and A.A.B. conceived and designed the study. M.S. and A.S.S. performed all behavioral experiments. R.E. conducted molecular experiments. A.M.H., R.E., M.S., S.A.A., and A.A. collected the data, O.A.A, A.M.H., R.E., M.S., S.A.A., and A.A. performed statistical analysis. O.A.A., A.M.H., and R.E. wrote the manuscript. All authors reviewed and approved the final draft. All authors have read and agreed to the published version of the manuscript.

Funding

No pharmaceutical company or other funding agents has financially supported the study.

Acknowledgments

This research is supported by Deanship of the Scientific Research in Northern Border University with code number (ID) MED-2018-3-9-F-7894 (A.A.B.). We would like to acknowledge Khaled Abbas, Mansoura Faculty of Medicine, Mansoura, Egypt for assisting with behavioral experiments.

Conflicts of Interest

The authors have no conflict of interest to declare.

Data Availability

Data files are available upon request.

References

  1. García-Morales, I.; Mayor, P.D.L.P.; Kanner, A.M. Psychiatric Comorbidities in Epilepsy: Identification and Treatment. Neurologist 2008, 14, S15–S25. [Google Scholar] [CrossRef] [PubMed]
  2. Haddad, P.M.; Das, A.; Ashfaq, M.; Wieck, A. A review of valproate in psychiatric practice. Expert Opin. Drug Metab. Toxicol. 2009, 5, 539–551. [Google Scholar] [CrossRef] [PubMed]
  3. Pope, H.G., Jr.; McElory, S.L.; Keck, P.E., Jr.; Hudson, J.I. Valproate in the treatment of acute mania. A placebo-controlled study. Arch. Gen. Psychiatry 1991, 48, 62–68. [Google Scholar] [CrossRef]
  4. Lovell, B.V.; Marmura, M.J. Valproate semisodium ER for migraine and cluster headache prophylaxis. Expert Opin. Drug Metab. Toxicol. 2010, 6, 495–504. [Google Scholar] [CrossRef] [PubMed] [Green Version]
  5. Asconapé, J.J.; Penry, J.K.; Dreifuss, F.E.; Riela, A.; Mirza, W. Valproate-Associated Pancreatitis. Epilepsia 1993, 34, 177–183. [Google Scholar] [CrossRef]
  6. Chicharro, A.V.; De Marinis, A.J.; Kanner, A.M. The measurement of ammonia blood levels in patients taking valproic acid: Looking for problems where they do not exist? Epilepsy Behav. 2007, 11, 361–366. [Google Scholar] [CrossRef]
  7. Baddour, E.; Tewksbury, A.; Stauner, N. Valproic acid–induced hyperammonemia: Incidence, clinical significance, and treatment management. Ment. Health Clin. 2018, 8, 73–77. [Google Scholar] [CrossRef]
  8. Tseng, Y.-L.; Chuang, Y.-C.; McLaughlin, P.; Lu, Y.-T.; Lu, C.-H.; Chen, N.-C.; Chang, C.-C.; Chang, W.-N. Risk Factors of Hyperammonemia in Patients with Epilepsy Under Valproic Acid Therapy. Medicine 2014, 93, e66. [Google Scholar] [CrossRef]
  9. Adler, L.; Regenold, W.T. Valproate-Related Hyperammonemia in Older Adult Psychiatric Inpatients. Prim. Care Companion CNS Disord. 2015, 17. [Google Scholar] [CrossRef] [Green Version]
  10. Murphy, J.V. Asymptomatic Hyperammonemia in Patients Receiving Valproic Acid. Arch. Neurol. 1982, 39, 591–592. [Google Scholar] [CrossRef]
  11. DeWolfe, J.L.; Knowlton, R.C.; Beasley, T.M.; Cofield, S.; Faught, E.; Limdi, N.A. Hyperammonemia following intravenous valproate loading. Epilepsy Res. 2009, 85, 65–71. [Google Scholar] [CrossRef] [PubMed]
  12. Cheng, M.; Tang, X.; Wen, S.; Yue, J.; Wang, H. Valproate (VPA)-associated hyperammonemic encephalopathy independent of elevated serum VPA levels: 21 cases in China from May 2000 to May 2012. Compr. Psychiatry 2013, 54, 562–567. [Google Scholar] [CrossRef]
  13. Vossler, D.G.; Wilensky, A.J.; Cawthon, D.F.; Kraemer, D.L.A.; Ojemann, L.M.; Caylor, L.M.; Morgan, J.D. Serum and CSF glutamine levels in valproate-related hyperammonemic encephalopathy. Epilepsia 2002, 43, 154–159. [Google Scholar] [CrossRef] [PubMed]
  14. Chopra, A.; Kolla, B.P.; Mansukhani, M.P.; Netzel, P.; Frye, M.A. Valproate-induced hyperammonemic encephalopathy: An update on risk factors, clinical correlates and management. Gen. Hosp. Psychiatry 2012, 34, 290–298. [Google Scholar] [CrossRef] [PubMed]
  15. Segura-Bruna, N.; Rodriguez-Campello, A.; Puente, V.; Roquer, J. Valproate-induced hyperammonemic encephalopathy. Acta Neurol. Scand. 2006, 114, 1–7. [Google Scholar] [CrossRef]
  16. Walker, V. Ammonia Metabolism and Hyperammonemic Disorders. Int. Rev. Cytol. 2014, 67, 73–150. [Google Scholar] [CrossRef]
  17. Häussinger, D.; Sies, H.; Gerok, W. Functional hepatocyte heterogeneity in ammonia metabolism. J. Hepatol. 1985, 1, 3–14. [Google Scholar] [CrossRef]
  18. Warter, J.M.; Marescaux, C.; Chabrier, G.; Rumbach, L.; Micheletti, B.; Imler, M. Renal glutamine metabolism in man during treatment with sodium valproate. Rev. Neurol. 1984, 140, 370–371. [Google Scholar]
  19. Martin, G.; Durozard, D.; Besson, J.; Baverel, G. Effect of the antiepileptic drug sodium valproate on glutamine and glutamate metabolism in isolated human kidney tubules. Biochim. Biophys. Acta Gen. Subj. 1990, 1033, 261–266. [Google Scholar] [CrossRef]
  20. Lemieux, G.; Baverel, G.; Vinay, P.; Wadoux, P. Glutamine synthetase and glutamyltransferase in the kidney of man, dog, and rat. Am. J. Physiol. Content 1976, 231, 1068–1073. [Google Scholar] [CrossRef] [Green Version]
  21. Alonso, E.; Girbés, J.; Garcia-España, A.; Rubio, V. Changes in urea cycle-related metabolites in the mouse after combined administration of valproic acid and an amino acid load. Arch. Biochem. Biophys. 1989, 272, 267–273. [Google Scholar] [CrossRef]
  22. Albrecht, J. Glutamine in the central nervous system: Function and dysfunction. Front. Biosci. 2007, 12, 332–343. [Google Scholar] [CrossRef] [PubMed] [Green Version]
  23. Cooper, A.J.; Plum, F. Biochemistry and physiology of brain ammonia. Physiol. Rev. 1987, 67, 440–519. [Google Scholar] [CrossRef] [PubMed]
  24. Brusilow, S.W.; Koehler, R.C.; Traystman, R.J.; Cooper, A.J.L. Astrocyte glutamine synthetase: Importance in hyperammonemic syndromes and potential target for therapy. Neurotherapeutics 2010, 7, 452–470. [Google Scholar] [CrossRef] [PubMed] [Green Version]
  25. Keiding, S.; Sørensen, M.; Bender, D.; Munk, O.L.; Ott, P.; Vilstrup, H. Brain metabolism of13N-ammonia during acute hepatic encephalopathy in cirrhosis measured by positron emission tomography. Hepatology 2005, 43, 42–50. [Google Scholar] [CrossRef] [PubMed]
  26. Abulseoud, O.A.; Zuccoli, M.L.; Zhang, L.; Barnes, A.; Huestis, M.A.; Lin, D.-T. The acute effect of cannabis on plasma, liver and brain ammonia dynamics, a translational study. Eur. Neuropsychopharmacol. 2017, 27, 679–690. [Google Scholar] [CrossRef]
  27. Collins, R.M.; Zielke, H.R.; Woody, R.C. Valproate increases glutaminase and decreases glutamine synthetase activities in primary cultures of rat brain astrocytes. J. Neurochem. 1994, 62, 1137–1143. [Google Scholar] [CrossRef] [PubMed]
  28. Inoue, K.; Takahashi, T.; Yamamoto, Y.; Suzuki, E.; Takahashi, Y.; Imai, K.; Inoue, Y.; Hirai, K.; Tsuji, D.; Itoh, K. Influence of glutamine synthetase gene polymorphisms on the development of hyperammonemia during valproic acid-based therapy. Seizure 2015, 33, 76–80. [Google Scholar] [CrossRef] [Green Version]
  29. Silvestrin, R.B.; Bambini-Júnior, V.; Galland, F.; Bobermim, L.D.; Santos, A.Q.-; Abib, R.T.; Zanotto, C.; Batassini, C.; Brolese, G.; Gonçalves, C.-A.; et al. Animal model of autism induced by prenatal exposure to valproate: Altered glutamate metabolism in the hippocampus. Brain Res. 2013, 1495, 52–60. [Google Scholar] [CrossRef] [Green Version]
  30. Irwin, S. Comprehensive observational assessment: Ia. A systematic, quantitative procedure for assessing the behavioral and physiologic state of the mouse. Psychopharmacologia 1968, 13, 222–257. [Google Scholar] [CrossRef]
  31. Tamaoki, S.; Suzuki, H.; Okada, M.; Fukui, N.; Isobe, M.; Saito, T. Development of an experimental rat model of hyperammonemic encephalopathy and evaluation of the effects of rifaximin. Eur. J. Pharmacol. 2016, 779, 168–176. [Google Scholar] [CrossRef] [Green Version]
  32. Kugoh, T.; Yamamoto, M.; Hosokawa, K. Blood Ammonia Level during Valproic Acid Therapy. Psychiatry Clin. Neurosci. 1986, 40, 663–668. [Google Scholar] [CrossRef]
  33. Dealberto, M.J.; Sarazin, F.F. Valproate-induced hyperammonemic encephalopathy without cognitive sequelae: A case report in the psychiatric setting. J. Neuropsychiatry Clin. Neurosci. 2008, 20, 369–371. [Google Scholar] [CrossRef] [PubMed]
  34. Hindfelt, B.; Siesjö, B.K. Cerebral Effects of Acute Ammonia Intoxication I. The Influence on Intracellular and Extracellular Acid-Base Parameters. Scand. J. Clin. Lab. Investig. 1971, 28, 353–364. [Google Scholar] [CrossRef] [PubMed]
  35. Giguère, J.F.; Butterworth, R.F. Amino acid changes in regions of the CNS in relation to function in experimental portal-systemic encephalopathy. Neurochem. Res. 1984, 9, 1309–1321. [Google Scholar] [CrossRef]
  36. McCuskey, R.S. The Hepatic Microvascular System in Health and Its Response to Toxicants. Anat. Rec. Adv. Integr. Anat. Evol. Biol. 2008, 291, 661–671. [Google Scholar] [CrossRef] [PubMed]
  37. Häussinger, D. Regulation of hepatic ammonia metabolism: The intercellular glutamine cycle. Adv. Enzym. Regul. 1986, 25, 159–180. [Google Scholar] [CrossRef]
  38. Tsacopoulos, M.; Magistretti, P.J. Metabolic coupling between glia and neurons. J. Neurosci. 1996, 16, 877–885. [Google Scholar] [CrossRef]
  39. Lieth, E.; LaNoue, K.F.; Berkich, D.A.; Xu, B.; Ratz, M.; Taylor, C.; Hutson, S.M. Nitrogen shuttling between neurons and glial cells during glutamate synthesis. J. Neurochem. 2001, 76, 1712–1723. [Google Scholar] [CrossRef]
  40. Sakai, R.; Cohen, D.M.; Henry, J.F.; Burrin, D.; Reeds, P.J. Leucine-nitrogen metabolism in the brain of conscious rats: Its role as a nitrogen carrier in glutamate synthesis in glial and neuronal metabolic compartments. J. Neurochem. 2004, 88, 612–622. [Google Scholar] [CrossRef]
  41. Rothman, D.L.; De Feyter, H.M.; Maciejewski, P.K.; Behar, K.L. Is there In Vivo Evidence for Amino Acid Shuttles Carrying Ammonia from Neurons to Astrocytes? Neurochem. Res. 2012, 37, 2597–2612. [Google Scholar] [CrossRef] [PubMed] [Green Version]
  42. Ratner, S.; Morell, H.; Carvalho, E. Enzymes of arginine metabolism in brain. Arch. Biochem. Biophys. 1960, 91, 280–289. [Google Scholar] [CrossRef]
  43. Lowenstein, J.M. Ammonia production in muscle and other tissues: The purine nucleotide cycle. Physiol. Rev. 1972, 52, 382–414. [Google Scholar] [CrossRef]
  44. Hassel, B.; Iversen, E.G.; Gjerstad, L.; Taubøll, E. Up-regulation of hippocampal glutamate transport during chronic treatment with sodium valproate. J. Neurochem. 2001, 77, 1285–1292. [Google Scholar] [CrossRef] [PubMed]
  45. Cudalbu, C.; Lanz, B.; Duarte, J.M.N.; Morgenthaler, F.D.; Pilloud, Y.; Mlynárik, V.; Gruetter, R. Cerebral Glutamine Metabolism under Hyperammonemia Determined in vivo by Localized 1H and 15N NMR Spectroscopy. Br. J. Pharmacol. 2011, 32, 696–708. [Google Scholar] [CrossRef] [PubMed] [Green Version]
  46. Knecht, K.; Michalak, A.; Rose, C.F.; Rothstein, J.D.; Butterworth, R.F. Decreased glutamate transporter (GLT-1) expression in frontal cortex of rats with acute liver failure. Neurosci. Lett. 1997, 229, 201–203. [Google Scholar] [CrossRef] [Green Version]
  47. Norenberg, M.D.; Huo, Z.; Neary, J.T.; Roig-Cantesano, A. The glial glutamate transporter in hyperammonemia and hepatic encephalopathy: Relation to energy metabolism and glutamatergic neurotransmission. Glia 1997, 21, 124–133. [Google Scholar] [CrossRef]
  48. Chan, H.; Butterworth, R.F. Evidence for an astrocytic glutamate transporter deficit in hepatic encephalopathy. Neurochem. Res. 1999, 24, 1397–1401. [Google Scholar] [CrossRef]
  49. Löscher, W.; Nau, H. Valproic acid: Metabolite concentrations in plasma and brain, anticonvulsant activity, and effects on GABA metabolism during subacute treatment in mice. Arch. Int. Pharmacodyn. Ther. 1982, 257, 20–31. [Google Scholar]
  50. Nau, H.; Löscher, W. Valproic acid: Brain and plasma levels of the drug and its metabolites, anticonvulsant effects and gamma-aminobutyric acid (GABA) metabolism in the mouse. J. Pharmacol. Exp. Ther. 1982, 220, 654–659. [Google Scholar]
  51. Owens, M.J.; Nemeroff, C.B. Pharmacology of valproate. Psychopharmacol. Bull. 2003, 37, 17–24. [Google Scholar] [PubMed]
  52. Hertz, L.; Rothman, D.L. Glutamine-Glutamate Cycle Flux Is Similar in Cultured Astrocytes and Brain and Both Glutamate Production and Oxidation Are Mainly Catalyzed by Aspartate Aminotransferase. Biology 2017, 6, 17. [Google Scholar] [CrossRef] [PubMed] [Green Version]
  53. Friedman, S.D.; Dager, S.R.; Parow, A.; Hirashima, F.; Demopulos, C.; Stoll, A.L.; Lyoo, I.K.; Dunner, D.L.; Renshaw, P.F. Lithium and valproic acid treatment effects on brain chemistry in bipolar disorder. Biol. Psychiatry 2004, 56, 340–348. [Google Scholar] [CrossRef] [PubMed]
  54. Dickinson, R.G.; Harland, R.C.; Ilias, A.M.; Rodgers, R.M.; Kaufman, S.N.; Lynn, R.K.; Gerber, N. Disposition of valproic acid in the rat: Dose-dependent metabolism, distribution, enterohepatic recirculation and choleretic effect. J. Pharmacol. Exp. Ther. 1979, 211, 583–595. [Google Scholar] [PubMed]
  55. Vargas, C.; Tannhauser, M.; Barros, H. Dissimilar Effects of Lithium and Valproic Acid on GABA and Glutamine Concentrations in Rat Cerebrospinal Fluid. Gen. Pharmacol. Vasc. Syst. 1998, 30, 601–604. [Google Scholar] [CrossRef]
  56. Schobben, F.; Van Der Kleijn, E.; Gabreëls, F.J.M. Pharmacokinetics of di-n-propylacetate in epileptic patients. Eur. J. Clin. Pharmacol. 1975, 8, 97–105. [Google Scholar] [CrossRef]
  57. Bruni, J.; Wilder, B.J.; Willmore, L.J.; Perchalski, R.J.; Villarreal, H.J. Steady-state kinetics of valproic acid in epileptic patients. Clin. Pharmacol. Ther. 1978, 24, 324–332. [Google Scholar] [CrossRef]
  58. Henriksen, O.; Johannessen, S.I. Clinical and pharmacokinetic observations on sodium valproate—A 5-year follow-up study in 100 children with epilepsy. Acta Neurol. Scand. 1982, 65, 504–523. [Google Scholar] [CrossRef]
  59. Duman, B.; Can, K.C.; Ağtaş-Ertan, E.; Erdoğan, S.; Ilhan, R.S.; Doğan, Ö.; Kumbasar, H.; Çamsarı, U.M. Risk factors for valproic acid induced hyperammonemia and its association with cognitive functions. Gen. Hosp. Psychiatry 2019, 59, 67–72. [Google Scholar] [CrossRef]
Figure 1. The effect of VPA on behavioral manifestations and plasma ammonia (NH4) concentration. (A) VPA treatment shows significant effect on Irwin’s total score: F2,50 = 15.97, p < 0.0001 by two-way ANOVA (n = 6/group). Significant differences were observed at 8 d of treatment between vehicle and VPA 400 mg/kg/d (mean difference, 95% CI, p value: 7.00, 0.4291 to 13.57, p = 0.037) and at 14 days of treatment between vehicle and VPA 200 mg/kg/d (mean difference, 95% CI, p value: 5.50, 1.250 to 9.750, p = 0.012) and at 28 d of treatment between vehicle and VPA 400 mg/kg/d (mean difference, 95% CI, p value: 5.417, 0.6275 to 10.21, p = 0.029) by Tukey’s multiple comparisons test. (B) VPA treatment has significant effect on plasma NH4 concentration: F2,15 = 50.42, p < 0.0001 by two-way ANOVA (n = 6/group). Significant differences were observed at 8 d of treatment between vehicle and VPA 200 mg/kg/d (mean difference, 95% CI, p value: −91.34, −140.2 to −42.50, p = 0.001) and between vehicle and VPA 400 mg/kg/d (mean difference, 95% CI, p value: −147.9, −221.1 to −74.66, p = 0.001), and at 14 d of treatment between vehicle and VPA 200 mg/kg/d (mean difference, 95% CI, p value: −173.9, −286.1 to −61.71, p = 0.008) and between vehicle and VPA 400 mg/kg/d (mean difference, 95% CI, p value: −103.6, −158.3 to −48.97, p = 0.002), and at 28 d of treatment between vehicle and VPA 200 mg/kg/d (mean difference, 95% CI, p value: −113.6, −164.4 to −62.77, p = 0.0006) and between vehicle and VPA 400 mg/kg/d (mean difference, 95% CI, p value: −113.8, −181.6 to −46.05, p = 0.004) by Tukey’s multiple comparisons test. (C) Significant negative correlation between total Iriwn’s scale scores and plasma ammonia (NH4) concentration: r = −0.4498, p = 0.0006.
Brainsci 10 00759 g001
Figure 2. The effect of VPA on liver ammonia (NH4) concentration and glutamine synthetase (GS) enzyme activity. (A) VPA treatment (F2,15 = 11.70, p = 0.0009) and duration (F1.712,25.68 = 5.063, p = 0.017) have significant effects on liver NH4 by two-way ANOVA (n = 6/group). However, no significant differences were observed at any of the three time points between vehicle and VPA 200 or 400 mg/kg/d. Only a trend toward significance (p = 0.07) was found at 14 days for the 200 mg/kg/d group (vs. vehicle) and at 28 days for both 200 mg/kg/d group (vs. vehicle, p = 0.059) and also the 400 mg/kg/d group (vs. vehicle, p = 0.059) by Tukey’s multiple comparisons test. (B) Only VPA treatment had significant effect on liver GS activity: F2,15 = 8.23, p = 0.003 by two-way ANOVA (n = 6/group). Significant differences were observed at 8 d of treatment between vehicle and VPA 200 mg/kg/d (mean difference, 95% CI, p value: 24.56, 7.610 to 41.51, p = 0.011) and at 14 d of treatment between vehicle and VPA 400 mg/kg/d (mean difference, 95% CI, p value: 13.26, 8.062 to 18.45, p = 0.0003) and at 28 d of treatment between vehicle and VPA 400 mg/kg/d (mean difference, 95% CI, p value: 23.46, 3.780 to 43.14, p = 0.02) by Tukey’s multiple comparisons test. (C) Significant negative correlation was found between liver NH4 concentration and liver GS activity: r = −0.447, p = 0.0007.
Brainsci 10 00759 g002
Figure 3. The effect of VPA on brain ammonia (NH4) concentration and glutamine synthetase (GS) enzyme activity. (A) VPA treatment (F2,51 = 24.44, p < 0.0001) and duration (F1.614,82.33 = 16.68, p < 0.0001) both show significant effects on brain NH4 concentration by two-way ANOVA (n = 6/group). Significant differences in brain NH4 concentrations were observed at tested time points between vehicle and both VPA doses. Vehicle vs. VPA 200 mg/kg/d at 14 d (mean difference, 95% CI, p value: −0.1630, −0.2698 to −0.05617, p = 0.002) and at 28 d (mean difference, 95% CI, p value: −0.3726, −0.5811 to −0.1641, p = 0.0006). Vehicle vs. VPA 400 mg/kg/d at 8 d (mean difference, 95% CI, p value: −0.2159, −0.3543 to −0.07754, p = 0.02) and at 14 d (mean difference, 95% CI, p value: −0.3281, −0.4579 to −0.1983, p < 0.0001) and at 28 d (mean difference, 95% CI, p value: −0.4423, −0.6428 to −0.2419, p < 0.0001) by Tukey’s multiple comparisons test. (B) VPA treatment has significant effect on brain GS activity: F2,51 = 9.766, p = 0.0003 by two-way ANOVA (n = 6/group). Significant differences were observed only at 28 d of treatment between vehicle and VPA 200 mg/kg/d (mean difference, 95% CI, p value: 6.803, 1.772 to 11.83, p = 0.006) and between vehicle and VPA 400 mg/kg/d (mean difference, 95% CI, p value: 7.899, 2.573 to 13.23, p = 0.002) by Tukey’s multiple comparisons test. (C) No significant correlation was found between brain NH4 concentration and brain GS activity: r = −0.058, p = 0.4.
Brainsci 10 00759 g003
Table 1. The effect of valproic acid (VPA) on Irwin’s behavioral measures. Data presented at mean ± SEM (n = 6–7/group).
Behavioral MeasuresTreatment8 d (Mean ± SEM)14 d (Mean ± SEM)28 d (Mean ± SEM)
Total ScoreVehicle 22.6 ± 1.923.0 ± 1.119.7 ± 2.8
VPA 200 mg/kg/day16.6 ± 1.517.5 ± 1.117.7 ± 1.6
VPA 400 mg/kg/day15.6 ± 1.214.3 ± 1.012.3 ± 0.3
Corneal ReflexVehicle 6.286 ± 0.685.66 ± 0.616.0 ± 0.51
VPA 200 mg/kg/day5.0 ± 0.446.25 ± 0.454.75 ± 0.36
VPA 400 mg/kg/day4.66 ± 0.424.0 ± 0.04.0 ± 0.0
Pinna ReflexVehicle 5.0 ± 1.125.66 ± 0.614.33 ± 0.33
VPA 200 mg/kg/day1.33 ± 0.661.5 ± 0.321.5 ± 0.82
VPA 400 mg/kg/day1.0 ± 0.440.33 ± 0.330.0 ± 0.0
Positional PassivityVehicle 4 ± 0.89 4.66 ± 0.84 6.0 ± 0.73
VPA 200 mg/kg/day6.33 ± 0.33 5.5 ± 0.32 7.75 ± 0.25
VPA 400 mg/kg/day8.0 ± 0.0 7.33 ± 0.42 8.0 ± 0.0
Pain ReflexVehicle 7.33 ± 0.667.0 ± 0.446.66 ± 0.42
VPA 200 mg/kg/day4.0 ± 0.734.25 ± 0.793.75 ± 1.09
VPA 400 mg/kg/day2.0 ± 0.512.66 ± 1.220.33 ± 0.33
Table 2. The effect of VPA on plasma, liver and brain ammonia (NH4) concentration, and on liver and brain, prefrontal cortex (PFC), striatal (Str), and cerebellar (Cere) NH4 concentration and glutamine synthetase (GS) enzyme activity. Data presented as mean ± SEM (n = 6/group).
Behavioral MeasuresTreatment8 d (Mean ± SEM)14 d (Mean ± SEM)28 d (Mean ± SEM)
Plasma NH4 Conc (μmol/L)Vehicle67.98 ± 8.972.5 ± 6.468.5 ± 8.1
VPA 200 mg /kg/day159.3 ± 14.6246.4 ± 34.6182.1 ± 15.6
VPA 400 mg/kg/day215.8 ± 22.7176.2 ± 16.9182.3 ± 21.0
Liver NH4 Conc (μmol/mg)Vehicle0.34 ± 0.010.33 ± 0.010.34 ± 0.01
VPA 200 mg /kg/day0.35 ± 0.030.28 ± 0.040.34 ± 0.02
VPA 400 mg/kg/day0.38 ± 0.030.38 ± 0.010.6 ± 0.09
Liver GS activity (U/mg)Vehicle56.9 ± 5.254.4 ± 5.055.2 ± 4.0
VPA 200 mg /kg/day32.4 ± 0.852.8 ± 1.558.2 ± 3.8
VPA 400 mg/kg/day44.2 ± 2.139.6 ± 0.831.7 ± 5.7
Brain NH4 Conc (μmol/mg)Vehicle0.33 ± 0.010.34 ± 0.010.34 ± 0.01
VPA 200 mg /kg/day0.39 ± 0.020.50 ± 0.030.72 ± 0.08
VPA 400 mg/kg/day0.55 ± 0.050.67 ± 0.040.79 ± 0.07
Brain GS activity (U/mg)Vehicle29.7 ± 1.731.4 ± 1.530.5 ± 1.5
VPA 200 mg /kg/day24.8 ± 1.526.0 ± 1.823.71.3
VPA 400 mg/kg/day25.1 ± 2.422.7 ± 2.422.6 ± 1.5
Publisher’s Note: MDPI stays neutral with regard to jurisdictional claims in published maps and institutional affiliations.

