Localised Grey Matter Atrophy in Multiple Sclerosis and Clinically Isolated Syndrome—A Coordinate-Based Meta-Analysis, Meta-Analysis of Networks, and Meta-Regression of Voxel-Based Morphometry Studies


Abstract
:1. Introduction
2. Materials and Methods
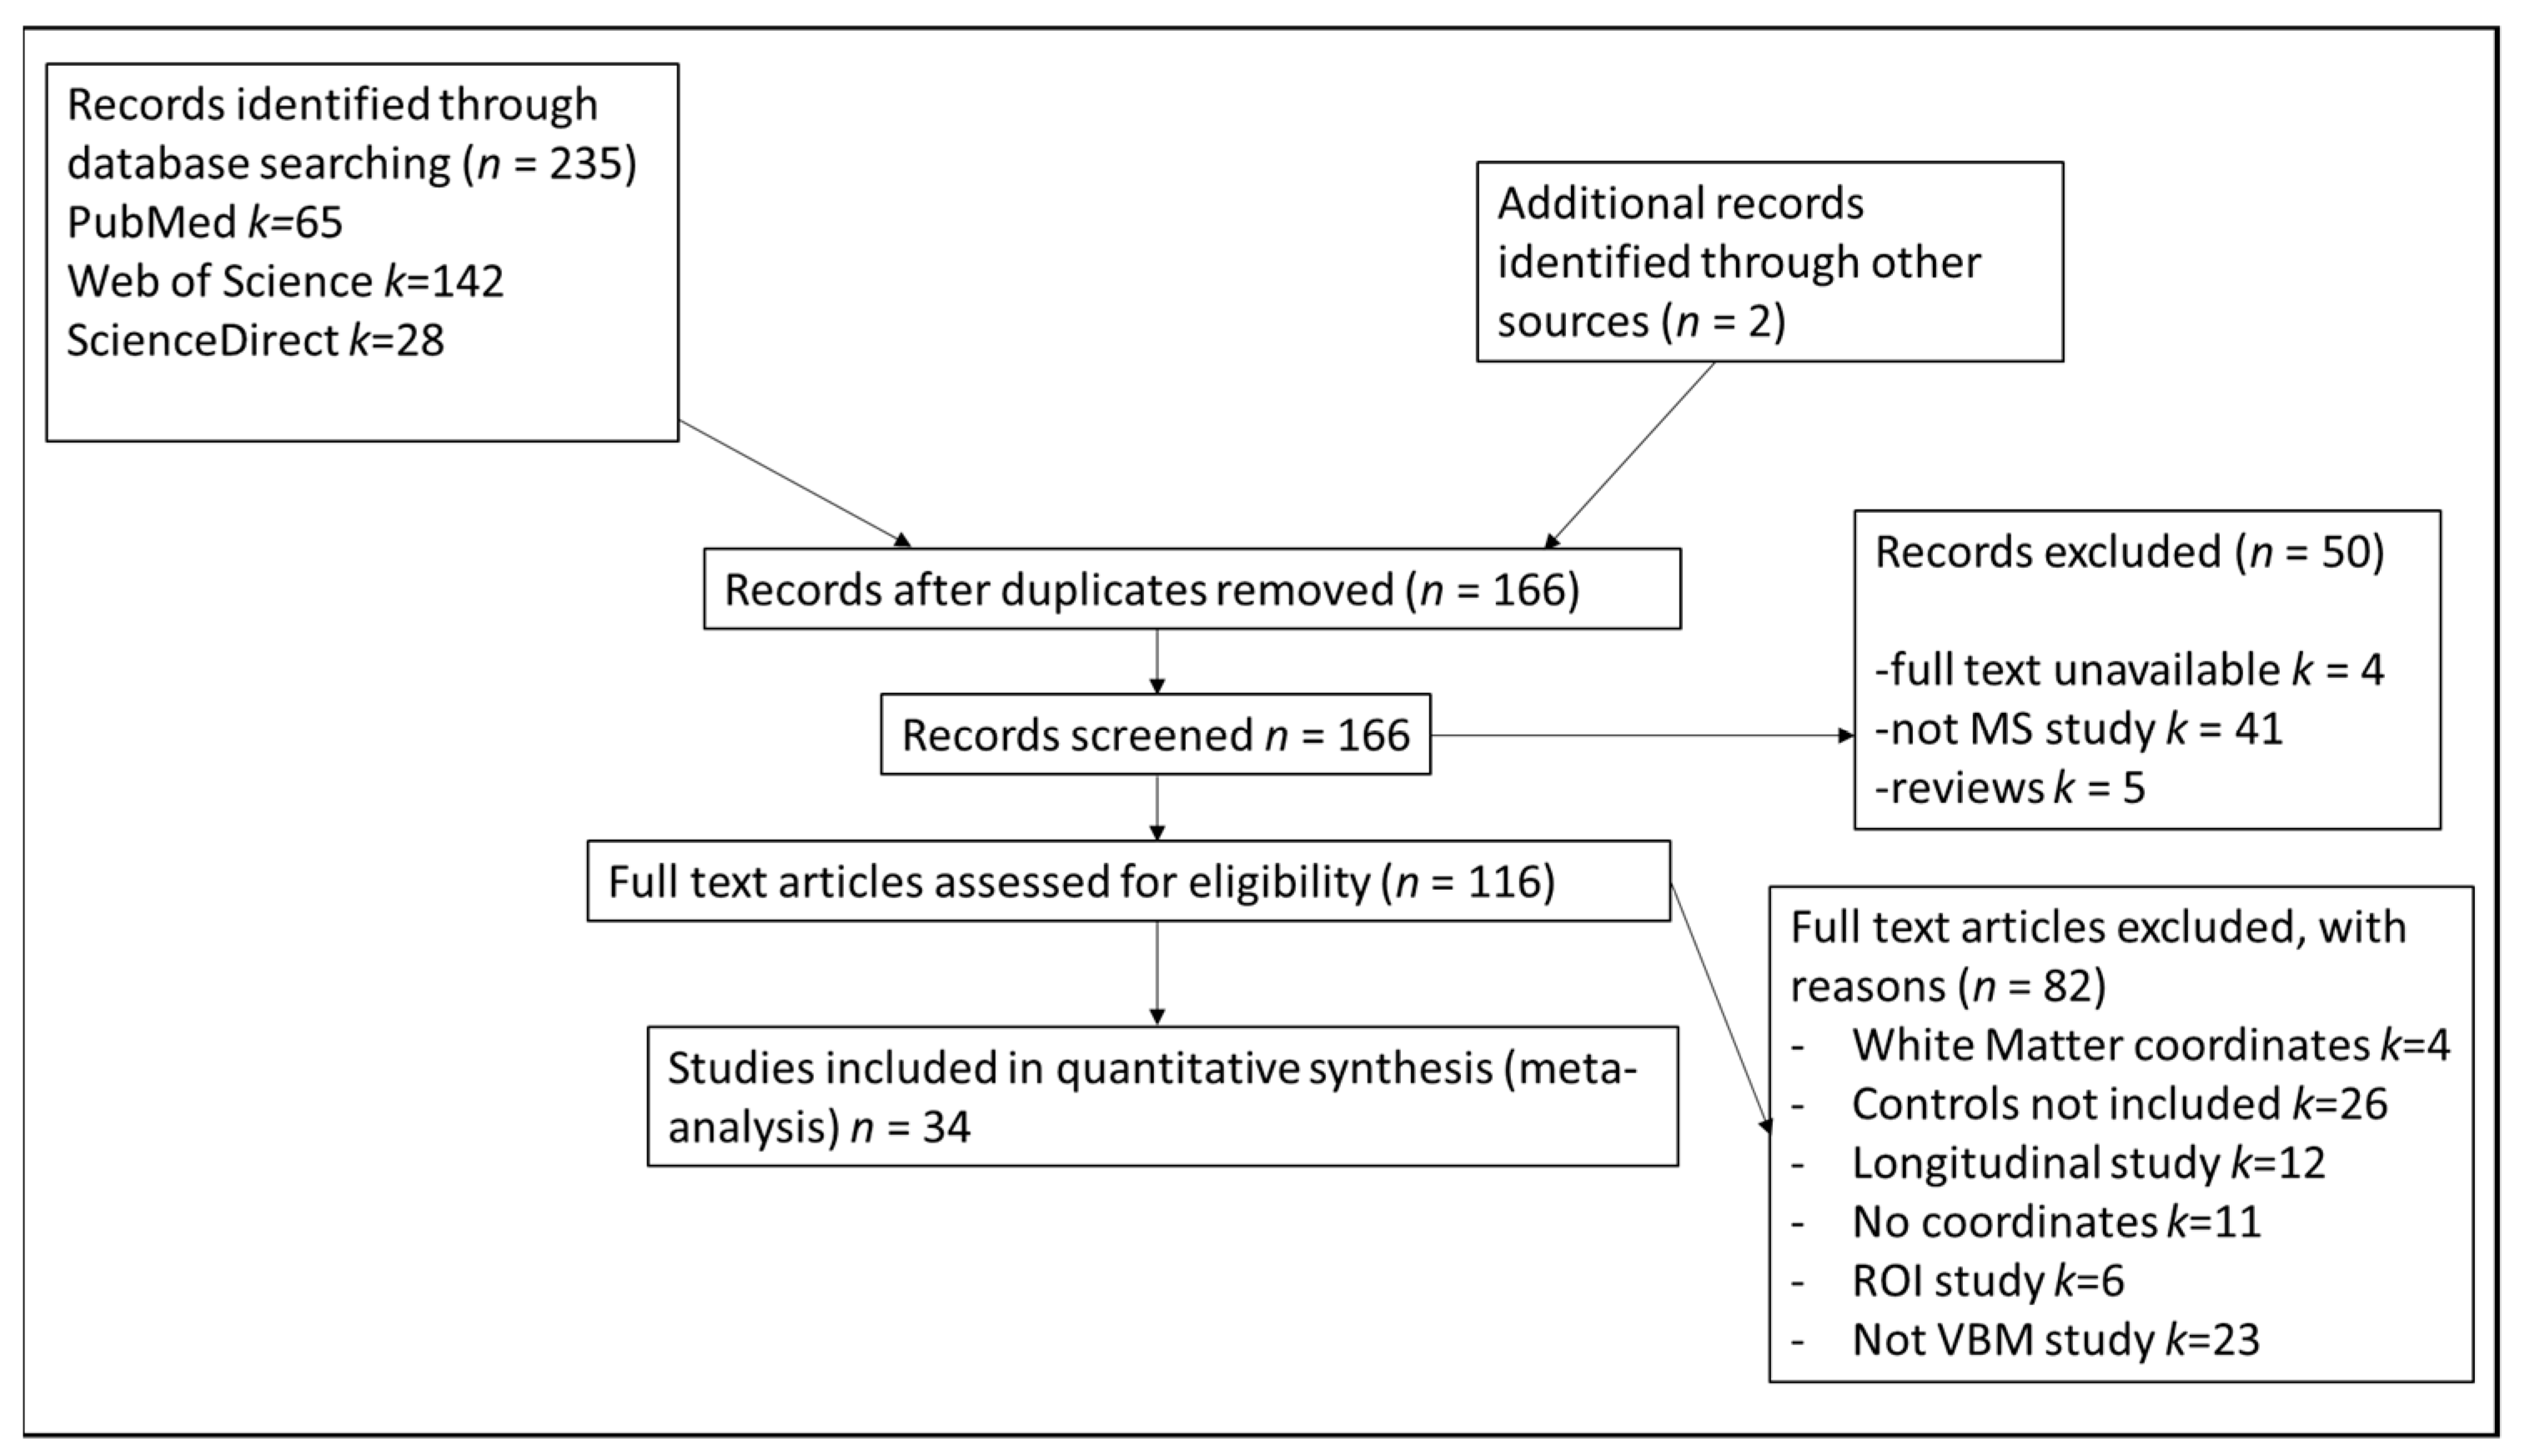
2.1. Search Strategies
2.2. Study Selection
2.3. Study Properties
2.4. Coordinate-Based Meta-Analysis
2.5. Experimental Procedure
2.6. Main Analysis
2.7. Subanalyses
2.8. Meta-Regression
3. Results
3.1. Included Studies and Sample Characteristics
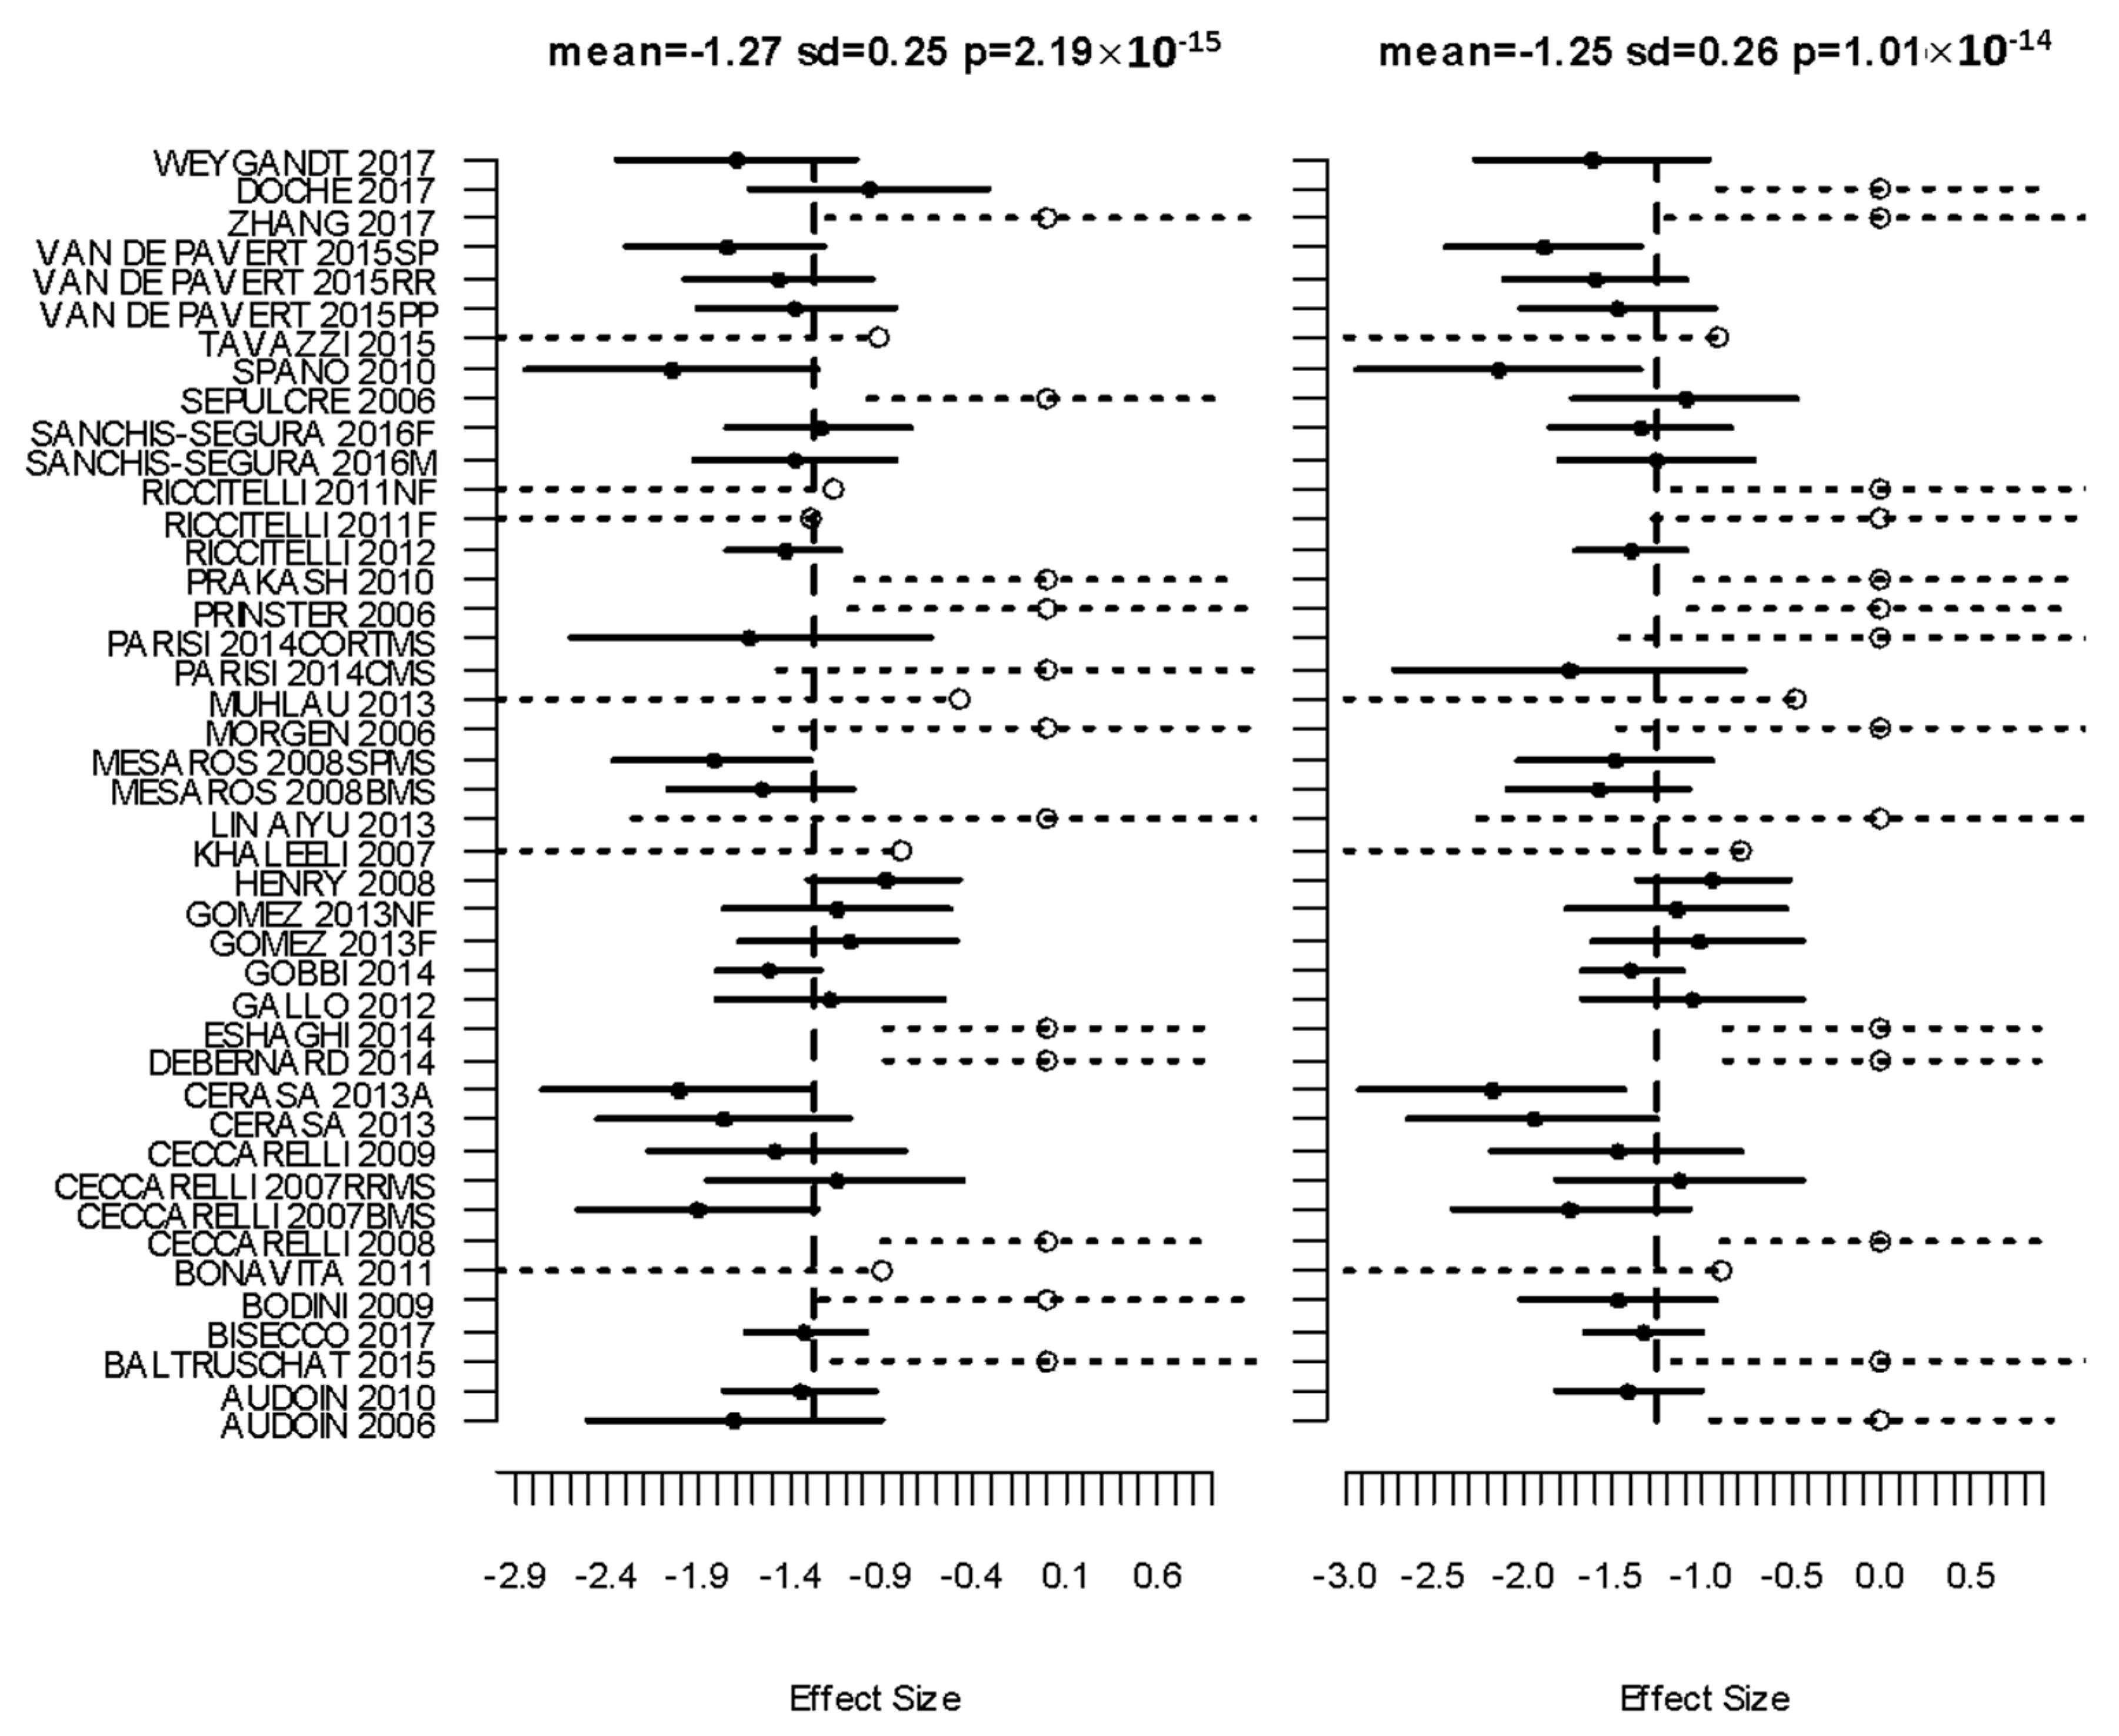
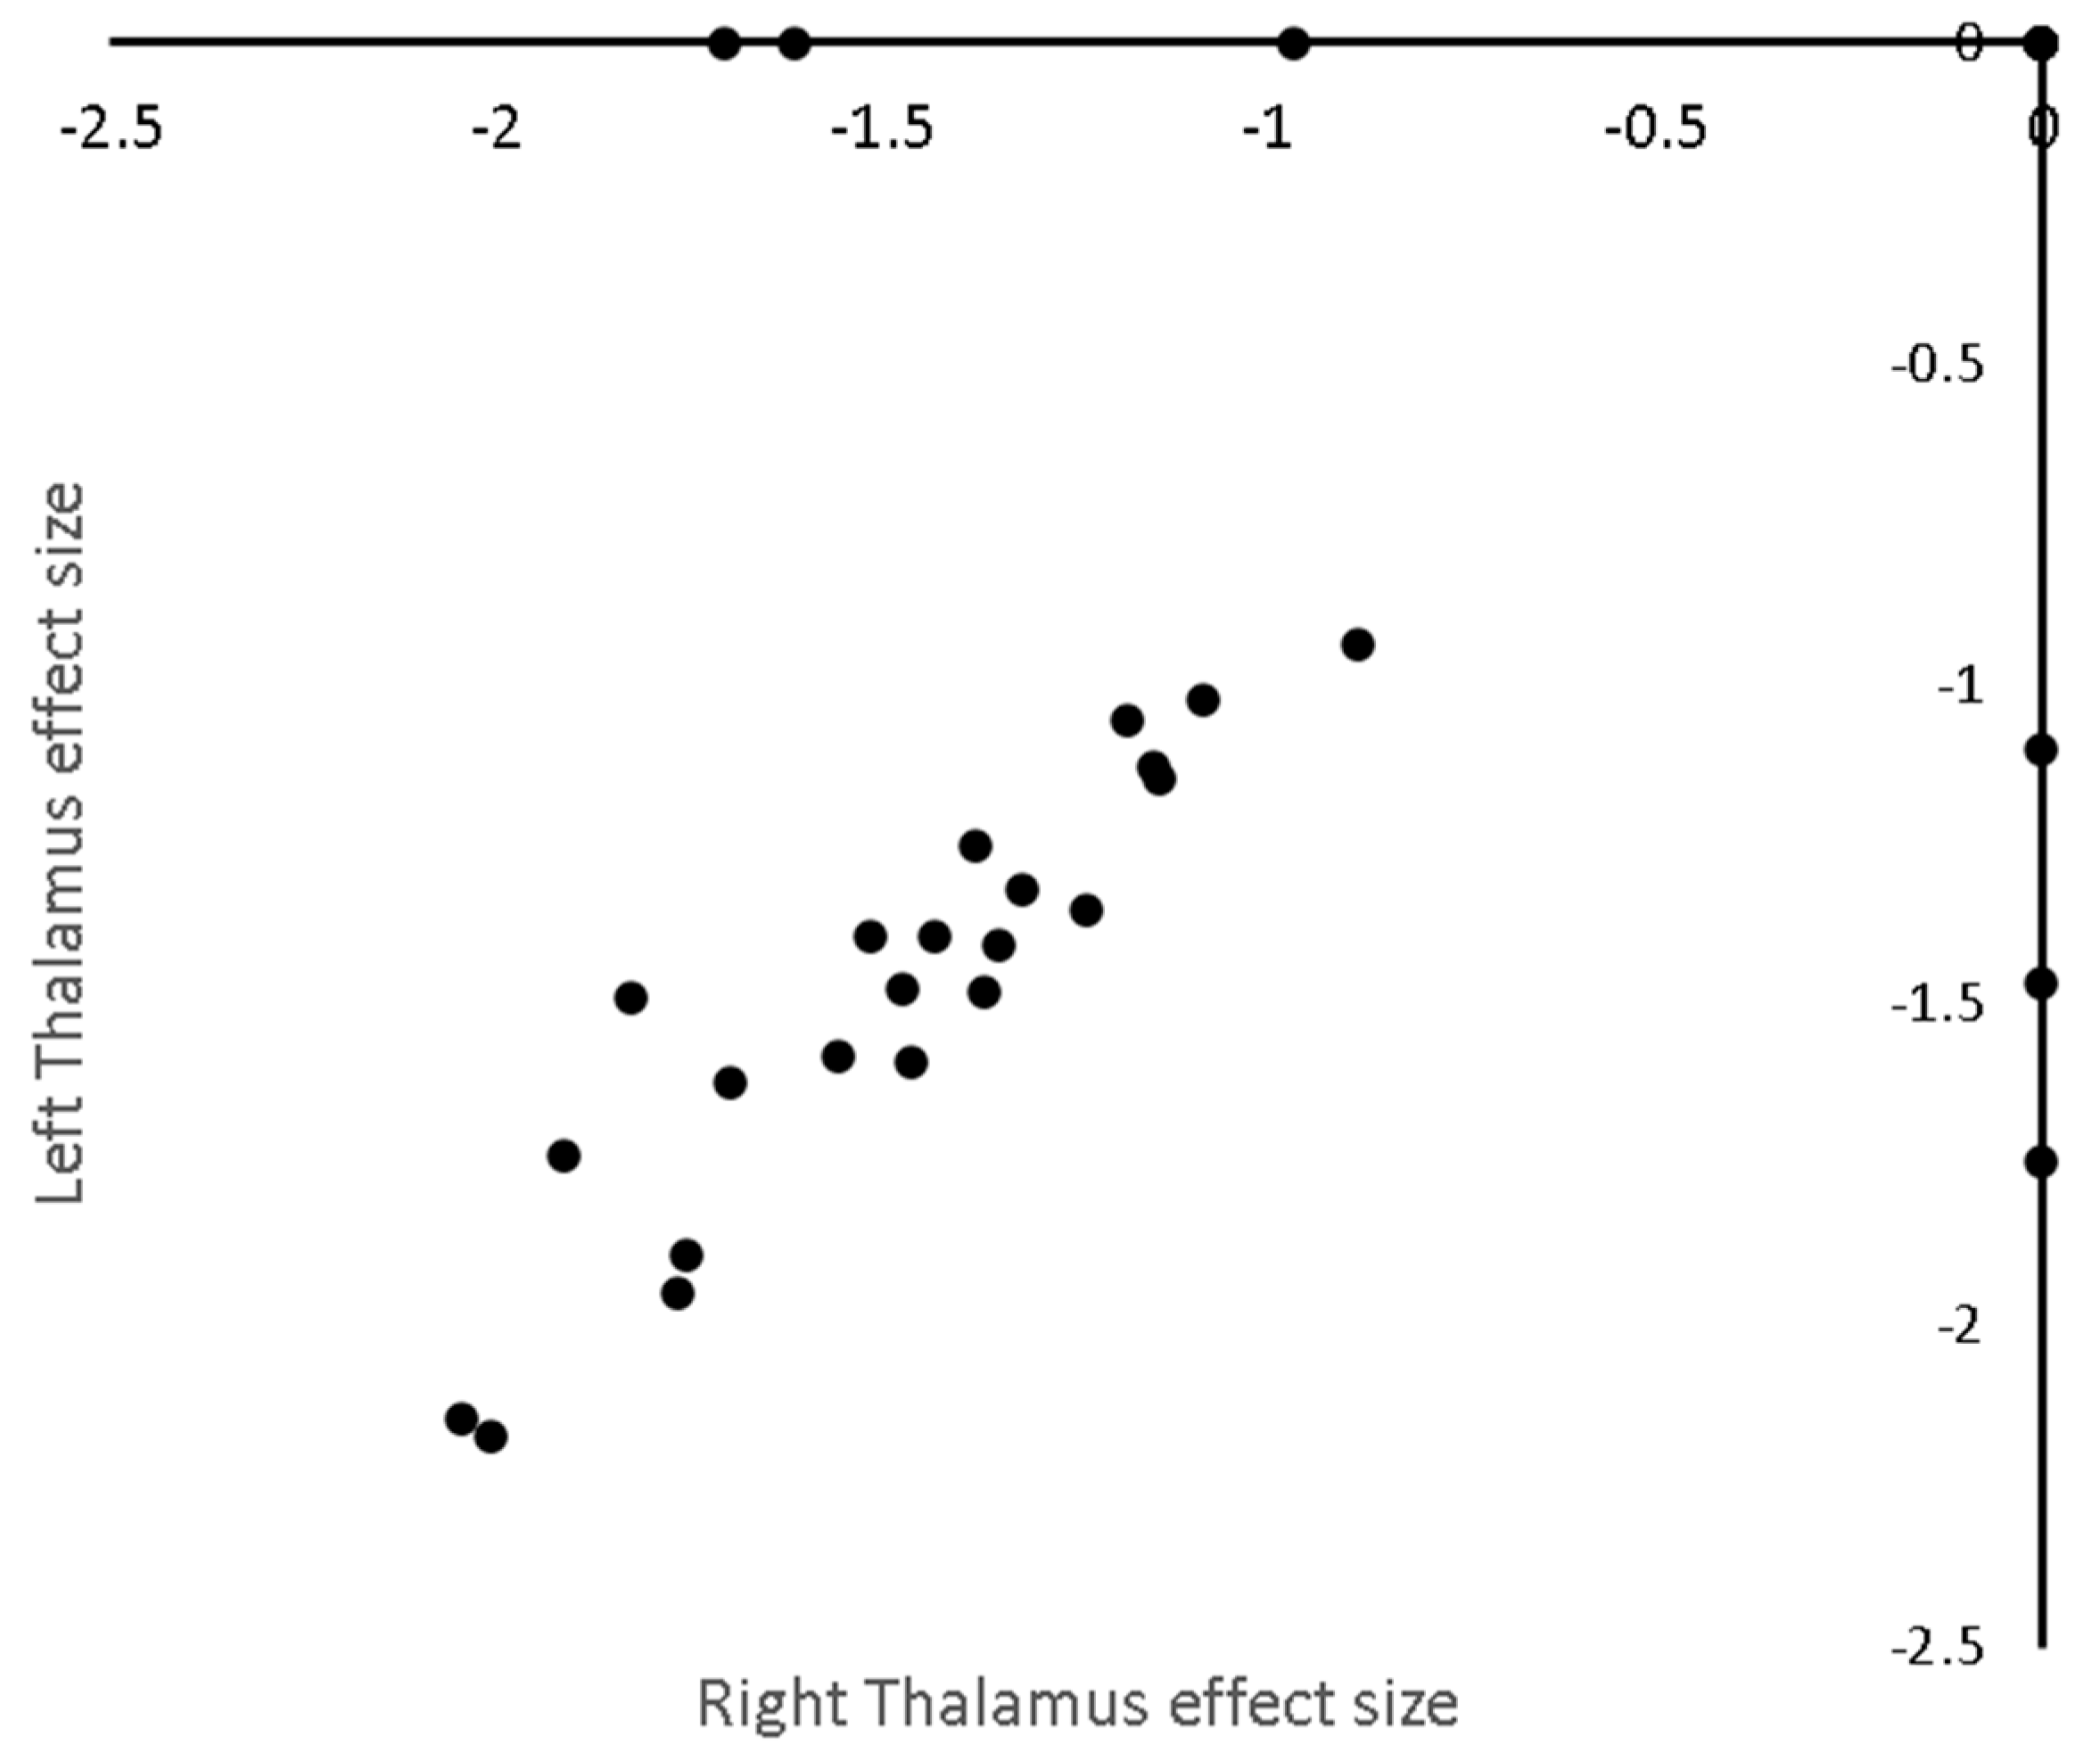
3.2. Primary Meta Analysis
3.3. Subanalyses
3.4. Metaregresion
3.4.1. Age
3.4.2. MS Disease Duration
3.4.3. MSFC
3.4.4. EDSS
4. Discussion
5. Conclusions
Author Contributions
Funding
Conflicts of Interest
Appendix A

| Study | Controls | Patients | |||||||
|---|---|---|---|---|---|---|---|---|---|
| n | Mean Age | SD/Range | Females | Subtype | n | Mean Age | SD/Range | Females | |
| AUDOIN 2006 | 10 | 37 | 31–52 | 4 | EARLY RRMS | 21 | 36 | 27–55 | 16 |
| AUDOIN 2010 | 37 | 28 | 8 | - | CIS | 62 | 29 | 20–46 | - |
| BALTRUSCHAT 2015 | 15 | 30.47 | 5.91 | 7 | RRMS | 17 | 32.82 | 6.41 | 11 |
| BISECCO 2017 | 52 | 37.3 | 13.1 | 33 | RRMS | 125 | 36.8 | 10.7 | 82 |
| BODINI 2009 | 23 | 35.1 | 7.9 | 12 | EARLY PPMS | 36 | 44.8 | 11.13 | 15 |
| BONAVITA 2011 | 18 | 39 | 10 | 10 | RRMS | 36 | CI-40.9 | 8.7 | 11 |
| - | - | - | - | CP-40.5 | 6.9 | 10 | |||
| CECCARELLI 2008 | 21 | 40.9 | 24–62 | 14 | CIS | 28 | 30.7 | 21–43 | 15 |
| CECCARELLI 2007BMS | 20 | 36.8 | 6.8 | 13 | BMS | 19 | 41.5 | 5.6 | 15 |
| CECCARELLI 2007RRMS | - | - | - | - | RRMS | 15 | 33.3 | 7.8 | 12 |
| CECCARELLI 2009 | 17 | 51.3 | 26–68 | 11 | 18 | 49.6 | 38–73 | 10 | |
| CERASA 2013 | 20 | 36.9 | 5.8 | 14 | RRMSnc | 14 | 38.6 | 8.5 | 11 |
| CERASA 2013A | - | - | - | - | RRMSc | 12 | 38.9 | 8.7 | 10 |
| DEBERNARD 2014 | 25 | 35.2 | 10.3 | 17 | EARLY RRMS | 25 | 37.2 | 8.6 | 22 |
| ESHAGHI 2014 | 19 | 37.6 | 34.4, 41.9 | 9 | PPMS | 36 | 42.8 | 39.4, 46.6 | 12 |
| GALLO 2012 | 15 | 36.3 | 20–53 | 10 | RRMS | 30 | 35.9 | 19–51 | 20 |
| GOBBI 2014 | 90 | 39.7 | 13.7 | 51 | MIXED_MS | 123 | 41.7 | 10.3 | 71 |
| GOMEZ 2013F | 18 | 31.06 | 5.67 | 8 | RRMS_fatigue | 32 | 37.72 | 5.9 | 21 |
| GOMEZ 2013NF | 18 | - | - | - | RRMS_nonfatigue | 28 | 34.96 | 5.87 | 18 |
| HENRY 2008 | 49 | 38 | 11 | 34 | CIS | 41 | 37 | 10 | 29 |
| KHALEELI 2007 | 23 | 35.1 | 23–56 | 12 | EARLY PPMS | 46 | 43.5 | 19–65 | 19 |
| LIN AIYU 2013 | 11 | 39.5 | 13.2 | 7 | RRMS | 11 | 38.5 | 12.2 | 7 |
| MESAROS 2008BMS | 21 | 45.7 | 25–66 | 11 | BMS | 60 | 46.2 | 35–63 | 37 |
| MESAROS 2008SPMS | 21 | 45.7 | 25–66 | - | SPMS | 35 | 46.5 | 30–63 | 25 |
| MORGEN 2006 | 19 | 31.7 | 7.5 | - | RRMS | 19 | 33.05 | 8.26 | - |
| MUHLAU 2013 | 49 | 36.4 | 13 | 33 | CIS or RRMS | 249 | 36.8 | 10.7 | 62 |
| MORGE low PASAT | 19 | 31.7 | 7.5 | - | RRMS | 10 | 36.7 | 8.05 | - |
| PARISI 2014CMS | 9 | 54.4 | 12.1 | 6 | CMS | 9 | 50.2 | 11 | 7 |
| PARISI 2014CORTMS | 9 | - | - | CORT-MS | 9 | 48.9 | 9.9 | 7 | |
| PRINSTER 2006 | 34 | 43.2 | 13.2 | 15 | RRMS | 51 | 38.6 | 7.5 | 36 |
| PRAKASH 2010 | 15 | 45.8 | 1.8 | 15 | RRMS | 21 | 44.2 | 1.9 | 21 |
| RICCITELLI 2012 | 88 | 39.7 | 18–65 | 51 | RRMS | 78 | 40.2 | 20–63 | 55 |
| RICCITELLI 2011F | 14 | 38.7 | 8.4 | 8 | RRMS Fatigue | 10 | 38 | 7.7 | 6 |
| RICCITELLI 2011NF | 14 | - | - | - | RRMS nonfatigue | 14 | 38.6 | 8.5 | 8 |
| SANCHIS-SEGURA 2016M | 35 | 25.54 | 5.35 | - | RRMS male | 22 | 38.68 | 8.72 | - |
| SANCHIS-SEGURA 2016F | 28 | 27.96 | 7.85 | - | RRMS female | 34 | 40.85 | 10.18 | - |
| SEPULCRE 2006 | 15 | 43.2 | 10.9 | 6 | PPMS | 31 | 43.7 | 9.87 | 13 |
| SPANO 2010 | 20 | 40.5 | 11.07 | 12 | BMS | 10 | 44.5 | 6.5 | 8 |
| TAVAZZI 2015 | 31 | 47.9 | 14.5 | 20 | PPMS | 18 | 46.9 | 8.1 | 6 |
| VAN DE PAVERT 2015PP | 30 | 37.8 | 11.8 | 18 | PPMS | 25 | 52.5 | 9.8 | 14 |
| VAN DE PAVERT 2015RR | 30 | - | - | - | RRMS | 30 | 42.5 | 9.6 | 20 |
| VAN DE PAVERT 2015SP | 30 | - | - | - | SPMS | 25 | 52.8 | 7.6 | 14 |
| ZHANG 2017 | 29 | 37.79 | 10.29 | 17 | RRMS | 39 | 38.26 | 9.05 | 23 |
| DOCHE 2017 | 16 | 37.1 | 10.2 | 12 | RRMS | 23 | 34.2 | 9.3 | 19 |
| WEYGANDT 2017 | 21 | 49.1 | 11.7 | 13 | HI-LB MS | 18 | 49.8 | 7.7 | 10 |
| Disease Duration (y) | SD/Range | MSFC | EDSS | SD/Range | PASAT 3′ | SD/Range | Education | SD/Range | BPF (mm3) | SD/Range | |
|---|---|---|---|---|---|---|---|---|---|---|---|
| AUDOIN 2006 | 2.15 | 1.2–3.8 | −0.348 | 1 | 0–3 | - | - | - | - | - | - |
| AUDOIN 2010 | 0.33 | 0–0.5 | 1 | 0–3.5 | 40 | 10 | 13 | 3 | 0.831 | 0.043 | |
| BALTRUSCHAT 2015 | 4.53 | 3.5 | - | 2.24 | 1.09 | 48.12 | 6.94 | 12 | 2.72 | 0.84 | 0.023 |
| BISECCO 2017 | 9.6 | 8.7 | - | 2 | 0–6 | - | - | 12.9 | 3.7 | - | - |
| BODINI 2009 | 3.3 | 0.9 | - | 4.5 | 1.5–7 | 47.65 | 11.24 | - | - | - | - |
| BONAVITA 2011 | 11.86 | 7.08 | - | 2.8 | 1.1 | - | - | 12.5 | 3.9 | 0.82 | 0.03 |
| 10.91 | 4.67 | - | 2.6 | 1.7 | - | - | 12.3 | 3.6 | 0.83 | 0.03 | |
| CECCARELLI 2008 | 0 | 0 | - | 0 | 0–1 | - | - | - | - | - | - |
| CECCARELLI 2007BMS | 20 | 15–30 | - | 2 | 1.0–3.0 | - | - | - | - | - | - |
| CECCARELLI 2007RRMS | 6 | 2.0–10.0 | - | 1.5 | 1.0–3.5 | - | - | - | - | - | - |
| CECCARELLI 2009 | 10.7 | 4.0–21.0 | - | 5.5 | 3.0–7.0 | - | - | - | - | - | - |
| CERASA 2013 | 8.8 | 4.4 | - | 2 | 1.5–4.5 | - | - | 13 | 5.0–17.0 | - | - |
| CERASA 2013A | 12.1 | 8.7 | - | 2.5 | 1.0–4.0 | - | - | 13 | 5.0–17.0 | - | - |
| DEBERNARD 2014 | 2.4 | 1.5 | 0.4 (0.6) | 1.5 | 0–4.5 | 0.16 | 0.99 | 13.5 | 2.7 | - | - |
| ESHAGHI 2014 | 3.3 | 2.9,3.6 | −1.2 (−0.7, −1.6) | 4 | 1.5, 7 | - | - | - | - | - | - |
| GALLO 2012 | 9.2 | 3.0–22 | - | 2.1 | 1.0–5.5 | - | - | - | - | - | - |
| GOBBI 2014 | 12.6 | 1.0–44 | - | 2 | 0–7.0 | 36.6 | 1.0–59 | - | - | - | - |
| GOMEZ 2013F | 7.44 | 5.15 | - | 3.2 | 1.68 | - | - | - | - | - | - |
| GOMEZ 2013NF | 5.14 | 3.69 | - | 1.96 | 1.2 | - | - | - | - | - | - |
| HENRY 2008 | 0.3 | 0.25 | 1.9 (1.7) | 1.1 | 0.8 | −2.1 | 2.3 | - | - | n GMV = 940(52) | - |
| KHALEELI 2007 | 3.3 | 2.0–5.0 | - | 4.5 | 1.5–7 | - | - | - | - | - | - |
| LIN AIYU 2013 | 30.5 | 11.1 | - | 3.4 | 2.3 | - | - | 12.3 | 4.7 | - | - |
| MESAROS 2008BMS | 22.7 | 15–40 | - | 1.5 | 0–3.0 | - | - | - | - | - | - |
| MESAROS 2008SPMS | 16.2 | 7.0–27 | - | 6 | 4.0–7.0 | - | - | - | - | - | - |
| MORGEN 2006 | 1.66 | 1.43 | - | 1 | 0–3.5 | 31 | 22–56 | 15 (college level) | - | - | |
| MUHLAU 2013 | - | - | |||||||||
| MORGE low PASAT | 2.02 | 1.78 | - | 2 | 0–3.5 | 27 | 22–31 | 15 (college level) | - | - | |
| PARISI 2014CMS | 14 | 4–20 | - | 3 | 1.5–6 | - | - | 10.6 2.9 | 765 ml | 31 ml | |
| PARISI 2014CORTMS | 8 | 2–31 | - | 4 | 1.0–6.0 | - | - | 8.4 3.2 | 655 ml | 110 ml | |
| PRINSTER 2006 | 13.1 | 6.4 | - | 2.6 | 1.5–4.5 | - | - | - | - | - | |
| PRAKASH 2010 | 7.3 | 0.1 | - | 2.2 | 0–6 | 43 | 2.3 | 15.6 0.4 | - | - | |
| RICCITELLI 2012 | 10 | 1–28 | - | 1.5 | 1–4.5 | - | - | - | - | - | |
| RICCITELLI 2011F | 8.2 | 6.2 | 1.5 | 1.5–2.0 | - | - | - | - | - | ||
| RICCITELLI 2011NF | 10.6 | 6.6 | - | 1.5 | 0–1.5 | - | - | - | - | - | |
| SANCHIS-SEGURA 2016M | 6.45 | 5.53 | 2.5 | 0–6.5 | 35.23 | 20.01 | 5 1–6 | 0.83 | 0.33 | ||
| SANCHIS-SEGURA 2016F | 8.82 | 7.47 | 2.38 | 0−6.5 | 33.35 | 23.04 | 4 1–6 | 0.83 | 0.27 | ||
| SEPULCRE 2006 | 3 | 2–5 | −0.26(−6. 16–0.79) | 4.5 | 3.5–7 | −0.002 | −3.73–1.24 | - | - | - | |
| SPANO 2010 | 17.1 | 4.5 | not for all pts | 1.75 | 1–3 | - | - | - | - | - | |
| TAVAZZI 2015 | 12.4 | 7.73 | - | 6 | 3.0–8.0 | - | - | - | - | - | |
| VAN DE PAVERT 2015PP | 12 | 7.4 | −0.62 (0.81) | 6 | 0–6.5 | −0.7 | 1.38 | - | - | - | |
| VAN DE PAVERT 2015RR | 11.5 | 10.5 | −0.41 (0.76) | 1.75 | 1.0–6.5 | −0.69 | 1.32 | - | - | - | |
| VAN DE PAVERT 2015SP | 24 | 8.2 | −0.77 (0.66) | 6.5 | 4.5–8.5 | −0.94 | 1.12 | - | - | - | |
| ZHANG 2017 | 7.69 | 5.96 | - | 2.24 | 1.58 | CI n CP separate values | 11.9 3.68 | - | - | ||
| DOCHE 2017 | 4.5 | 4.6 | −0.70 (1.04) | 1.5 | 1.2 | - | - | - | - | - | |
| WEYGANDT 2017 | 11.7 | 7.2 | - | 4 | 2.5–6.0 | - | - | 11 | GM fraction = 0.41 | 0.04 | |
Appendix B

References
- Confavreux, C.; Vukusic, S.; Moreau, T.; Adeleine, P. Relapses and Progression of Disability in Multiple Sclerosis. N. Engl. J. Med. 2000, 343, 1430–1438. [Google Scholar] [CrossRef] [PubMed]
- Miller, D.H.; Barkhof, F.; Frank, J.A.; Parker, G.J.; Thompson, A.J. Measurement of Atrophy in Multiple Sclerosis: Pathological Basis, Methodological Aspects and Clinical Relevance. Brain 2002, 125, 1676–1695. [Google Scholar] [CrossRef] [Green Version]
- Losseff, N.A.; Wang, L.; Lai, H.M.; Yoo, D.S.; Gawne-Cain, M.L.; McDonald, W.I.; Miller, D.H.; Thompson, A.J. Progressive Cerebral Atrophy in Multiple Sclerosis A Serial MRI Study. Brain 1996, 119, 2009–2019. [Google Scholar] [CrossRef] [Green Version]
- Dalton, C.M.; Chard, D.T.; Davies, G.R.; Miszkiel, K.A.; Altmann, D.; Fernando, K.; Plant, G.T.; Thompson, A.J.; Miller, D.H. Early Development of Multiple Sclerosis Is Associated With Progressive Grey Matter Atrophy in Patients Presenting With Clinically Isolated Syndromes. Brain 2004, 127, 1101–1107. [Google Scholar] [CrossRef] [Green Version]
- Calabrese, M.; Atzori, M.; Bernardi, V.; Morra, A.; Romualdi, C.; Rinaldi, L.; McAuliffe, M.J.M.; Barachino, L.; Perini, P.; Fischl, B.; et al. Cortical Atrophy Is Relevant in Multiple Sclerosis at Clinical Onset. J. Neurol. 2007, 254, 1212–1220. [Google Scholar] [CrossRef]
- Messina, S.; Patti, F. Gray Matters in Multiple Sclerosis: Cognitive Impairment and Structural MRI. Mult. Scler. Int. 2014, 2014, 1–9. [Google Scholar] [CrossRef]
- Geurts, J.J.G.; Barkhof, F. Grey Matter Pathology in Multiple Sclerosis. Lancet Neurol. 2008, 7, 841–851. [Google Scholar] [CrossRef]
- De Stefano, N.; Matthews, P.M.; Filippi, M.; Agosta, F.; De Luca, M.; Bartolozzi, M.L.; Guidi, L.; Ghezzi, A.; Montanari, E.; Cifelli, A.; et al. Evidence of Early Cortical Atrophy in MS: Relevance to White Matter Changes and Disability. Neurology 2003, 60, 1157–1162. [Google Scholar] [CrossRef]
- Fisniku, L.K.; Chard, D.T.; Jackson, J.S.; Anderson, V.M.; Altmann, D.R.; Miszkiel, K.A.; Thompson, A.J.; Miller, D.H. Gray Matter Atrophy Is Related to Long-Term Disability in Multiple Sclerosis. Ann. Neurol. 2008, 64, 247–254. [Google Scholar] [CrossRef]
- Sailer, M.; Fischl, B.; Salat, D.; Tempelmann, C.; Schönfeld, M.A.; Busa, E.; Bodammer, N.; Heinze, H.-J.; Dale, A. Focal Thinning of the Cerebral Cortex in Multiple Sclerosis. Brain 2003, 126, 1734–1744. [Google Scholar] [CrossRef]
- Tedeschi, G.; Lavorgna, L.; Russo, P.; Prinster, A.; Dinacci, D.; Savettieri, G.; Quattrone, A.; Livrea, P.; Messina, C.; Reggio, A.; et al. Brain Atrophy and Lesion Load in a Large Population of Patients With Multiple Sclerosis. Neurology 2005, 65, 280–285. [Google Scholar] [CrossRef]
- Scarpazza, C.; Tognin, S.; Frisciata, S.; Sartori, G.; Mechelli, A. False Positive Rates in Voxel-Based Morphometry Studies of the Human Brain: Should We Be Worried? Neurosci. Biobehav. Rev. 2015, 52, 49–55. [Google Scholar] [CrossRef]
- Button, K.S.; Ioannidis, J.P.A.; Mokrysz, C.; Nosek, B.A.; Flint, J.; Robinson, E.S.J.; Munafò, M.R. Power Failure: Why Small Sample Size Undermines the Reliability of Neuroscience. Nat. Rev. Neurosci. 2013, 14, 365–376. [Google Scholar] [CrossRef] [Green Version]
- Bennett, C.M.; Wolford, G.L.; Miller, M.B. The Principled Control of False Positives in Neuroimaging. Soc. Cogn. Affect. Neurosci. 2009, 4, 417–422. [Google Scholar] [CrossRef]
- Popescu, V.; Schoonheim, M.M.; Versteeg, A.; Chaturvedi, N.; Jonker, M.; De Menezes, R.X.; Garre, F.G.; Uitdehaag, B.M.J.; Barkhof, F.; Vrenken, H. Grey Matter Atrophy in Multiple Sclerosis: Clinical Interpretation Depends on Choice of Analysis Method. PLoS ONE 2016, 11, e0143942. [Google Scholar] [CrossRef] [Green Version]
- Smith, S.M.; Zhanga, Y.; Jenkinsona, M.; Chenab, J.; Matthews, P.; Federicoc, A.; De Stefano, N. Accurate, Robust, and Automated Longitudinal and Cross-Sectional Brain Change Analysis. NeuroImage 2002, 17, 479–489. [Google Scholar] [CrossRef] [Green Version]
- Dale, A.M.; Fischla, B.; Sereno, M.I. Cortical Surface-Based Analysis. NeuroImage 1999, 9, 179–194. [Google Scholar] [CrossRef]
- Fischl, B.; Sereno, M.I.; Dale, A.M. Cortical Surface-Based Analysis. NeuroImage 1999, 9, 195–207. [Google Scholar] [CrossRef] [Green Version]
- Tench, C.; Tanasescu, R.; Constantinescu, C.; Auer, D.T.; Cottam, W. Coordinate Based Random Effect Size Meta-Analysis of Neuroimaging Studies. NeuroImage 2017, 153, 293–306. [Google Scholar] [CrossRef]
- Tench, C.; Tanasescu, R.; Constantinescu, C.; Cottam, W.; Auer, D.T. Coordinate Based Meta-Analysis of Networks in Neuroimaging Studies. NeuroImage 2020, 205, 116259. [Google Scholar] [CrossRef]
- Tench, C.; Singh, S. MS Meta Analysis Files; University of Nottingham: Nottingham, UK, 2020; Available online: https://rdmc.nottingham.ac.uk/handle/internal/8309 (accessed on 31 May 2020).
- Talairach, J.; Tournoux, P. Co-Planar Stereotaxic Atlas of the Human Brain; Thieme: New York, NY, USA, 1988. [Google Scholar]
- Tench, C.R. Coordinate based meta-analysis: New clustering algorithm, and inclusion of region of interest studies. bioRxiv 2020, 026575. [Google Scholar] [CrossRef]
- Benjamini, Y.; Hochberg, Y. Controlling the False Discovery Rate: A Practical and Powerful Approach to Multiple Testing. J. R. Stat. Soc. Ser. B 1995, 57, 289–300. [Google Scholar] [CrossRef]
- Turkeltaub, P.E.; Eickhoff, S.B.; Laird, A.R.; Fox, M.; Wiener, M.; Fox, P. Minimizing Within-Experiment and Within-Group Effects in Activation Likelihood Estimation Meta-Analyses. Hum. Brain Mapp. 2012, 33, 1–13. [Google Scholar] [CrossRef] [Green Version]
- Moher, D.; Liberati, A.; Tetzlaff, J.; Altman, D.G. The PRISMA Group. Preferred Reporting Items for Systematic Reviews and Meta-Analyses: The PRISMA Statement. PLoS Med. 2009, 6, e1000097. [Google Scholar] [CrossRef] [Green Version]
- Fisher, E.; Lee, J.-C.; Nakamura, K.; Rudick, R.A. Gray Matter Atrophy in Multiple Sclerosis: A Longitudinal Study. Ann. Neurol. 2008, 64, 255–265. [Google Scholar] [CrossRef]
- Steenwijk, M.; Geurts, J.J.G.; Daams, M.; Tijms, B.M.; Wink, A.M.; Balk, L.J.; Tewarie, P.; Uitdehaag, B.M.J.; Barkhof, F.; Vrenken, H.; et al. Cortical Atrophy Patterns in Multiple Sclerosis Are Non-Random and Clinically Relevant. Brain 2015, 139, 115–126. [Google Scholar] [CrossRef] [PubMed]
- Steenwijk, M.D.; Daams, M.; Pouwels, P.J.; Balk, L.J.; Tewarie, P.; Killestein, J.; Uitdehaag, B.M.; Geurts, J.J.G.; Barkhof, F.; Vrenken, H. What Explains Gray Matter Atrophy in Long-Standing Multiple Sclerosis? Radiology 2014, 272, 832–842. [Google Scholar] [CrossRef]
- Koskimäki, F.; Bernard, J.; Yong, J.; Arndt, N.; Carroll, T.; Lee, S.-K.; Reder, A.T.; Javed, A. Gray Matter Atrophy in Multiple Sclerosis Despite Clinical and Lesion Stability During Natalizumab Treatment. PLoS ONE 2018, 13, e0209326. [Google Scholar] [CrossRef]
- Trapp, B.D.; Peterson, J.; Ransohoff, R.M.; Rudick, R.; Mörk, S.; Bö, L. Axonal Transection in the Lesions of Multiple Sclerosis. N. Engl. J. Med. 1998, 338, 278–285. [Google Scholar] [CrossRef] [PubMed]
- Štecková, T.; Hluštík, P.; Sládková, V.; Odstrčil, F.; Mares, J.; Kaňovský, P. Thalamic Atrophy and Cognitive Impairment in Clinically Isolated Syndrome and Multiple Sclerosis. J. Neurol. Sci. 2014, 342, 62–68. [Google Scholar] [CrossRef]
- Haider, L.; Simeonidou, C.; Steinberger, G.; Hametner, S.; Grigoriadis, N.; Deretzi, G.; Kovacs, G.G.; Kutzelnigg, A.; Lassmann, H.; Frischer, J.M. Multiple Sclerosis Deep Grey Matter: The Relation Between Demyelination, Neurodegeneration, Inflammation and Iron. J. Neurol. Neurosurg. Psychiatry 2014, 85, 1386–1395. [Google Scholar] [CrossRef] [Green Version]
- Cifelli, A.; Arridge, M.; Jezzard, P.; Esiri, M.M.; Palace, J.; Matthews, P.M. Thalamic Neurodegeneration in Multiple Sclerosis. Ann. Neurol. 2002, 52, 650–653. [Google Scholar] [CrossRef]
- Azevedo, C.J.; Overton, E.; Khadka, S.; Buckley, J.; Liu, S.; Sampat, M.; Kantarci, O.; Frenay, C.L.; Siva, A.; Okuda, D.T.; et al. Early CNS Neurodegeneration in Radiologically Isolated Syndrome. Neurol. Neuroimmunol. Neuroinflamm. 2015, 2, e102. [Google Scholar] [CrossRef] [PubMed] [Green Version]
- Lassmann, H. Multiple Sclerosis: Lessons from Molecular Neuropathology. Exp. Neurol. 2014, 262, 2–7. [Google Scholar] [CrossRef]
- Henry, R.G.; Shieh, M.; Okuda, D.T.; Evangelista, A.; Gorno-Tempini, M.L.; Pelletier, D. Regional Grey Matter Atrophy in Clinically Isolated Syndromes at Presentation. J. Neurol. Neurosurg. Psychiatry 2008, 79, 1236–1244. [Google Scholar] [CrossRef] [Green Version]
- Batista, S.; Zivadinov, R.; Hoogs, M.; Bergsland, N.; Heininen-Brown, M.; Dwyer, M.G.; Weinstock-Guttman, B.; Benedict, R.H.B. Basal Ganglia, Thalamus and Neocortical Atrophy Predicting Slowed Cognitive Processing in Multiple Sclerosis. J. Neurol. 2011, 259, 139–146. [Google Scholar] [CrossRef] [PubMed]
- Modica, C.M.; Zivadinov, R.; Dwyer, M.G.; Bergsland, N.; Weeks, A.R.; Benedict, R.H.B. Iron and Volume in the Deep Gray Matter: Association With Cognitive Impairment in Multiple Sclerosis. Am. J. Neuroradiol. 2014, 36, 57–62. [Google Scholar] [CrossRef] [PubMed] [Green Version]
- Starr, C.J.; Sawaki, L.; Wittenberg, G.F.; Burdette, J.H.; Oshiro, Y.; Quevedo, A.S.; McHaffie, J.G.; Coghill, R.C. The Contribution of the Putamen to Sensory Aspects of Pain: Insights from Structural Connectivity and Brain Lesions. Brain 2011, 134, 1987–2004. [Google Scholar] [CrossRef] [Green Version]
- Koikkalainen, J.; Hirvonen, J.; Nyman, M.; Lötjönen, J.; Hietala, J.; Ruotsalainen, U. Shape Variability of the Human striatum—Effects of Age and Gender. NeuroImage 2007, 34, 85–93. [Google Scholar] [CrossRef]
- Uono, S.; Sato, W.; Kochiyama, T.; Kubota, Y.; Sawada, R.; Yoshimura, S.; Toichi, M. Putamen Volume Is Negatively Correlated With the Ability to Recognize Fearful Facial Expressions. Brain Topogr. 2017, 30, 774–784. [Google Scholar] [CrossRef]
- Bergsland, N.; Horakova, D.; Dwyer, M.; Dolezal, O.; Seidl, Z.K.; Vaněčková, M.; Krasensky, J.; Havrdova, E.; Zivadinov, R. Subcortical and Cortical Gray Matter Atrophy in a Large Sample of Patients with Clinically Isolated Syndrome and Early Relapsing-Remitting Multiple Sclerosis. Am. J. Neuroradiol. 2012, 33, 1573–1578. [Google Scholar] [CrossRef] [PubMed] [Green Version]
- Krämer, J.; Meuth, S.G.; Tenberge, J.-G.; Schiffler, P.; Wiendl, H.; Deppe, M. Early and Degressive Putamen Atrophy in Multiple Sclerosis. Int. J. Mol. Sci. 2015, 16, 23195–23209. [Google Scholar] [CrossRef] [PubMed] [Green Version]
- Li, Y.; Jewells, V.; Kim, M.; Chen, Y.; Moon, A.; Armao, D.; Troiani, L.; Markovic-Plese, S.; Lin, W.; Shen, D. Diffusion Tensor Imaging Based Network Analysis Detects Alterations of Neuroconnectivity in Patients With Clinically Early Relapsing-Remitting Multiple Sclerosis. Hum. Brain Mapp. 2012, 34, 3376–3391. [Google Scholar] [CrossRef] [PubMed] [Green Version]
- Leff, A.P.; Schofield, T.M.; Crinion, J.T.; Seghier, M.L.; Grogan, A.; Green, D.W.; Price, C.J. The Left Superior Temporal Gyrus Is a Shared Substrate for Auditory Short-Term Memory and Speech Comprehension: Evidence from 210 Patients with Stroke. Brain 2009, 132, 3401–3410. [Google Scholar] [CrossRef] [Green Version]
- Friederici, A.D. The Cortical Language Circuit: From Auditory Perception to Sentence Comprehension. Trends Cogn. Sci. 2012, 16, 262–268. [Google Scholar] [CrossRef]
- Bigler, E.D.; Mortensen, S.; Neeley, E.S.; Ozonoff, S.; Krasny, L.; Johnson, M.; Lu, J.; Provencal, S.L.; McMahon, W.; Lainhart, J.E. Superior Temporal Gyrus, Language Function, and Autism. Dev. Neuropsychol. 2007, 31, 217–238. [Google Scholar] [CrossRef]
- Radua, J.; Phillips, M.L.; Russell, T.; Lawrence, N.; Marshall, N.; Kalidindi, S.; El-Hage, W.; McDonald, C.; Giampietro, V.; Brammer, M.J.; et al. Neural Response to Specific Components of Fearful Faces in Healthy and Schizophrenic Adults. NeuroImage 2010, 49, 939–946. [Google Scholar] [CrossRef] [Green Version]
- Michl, P.; Meindl, T.; Meister, F.; Born, C.; Engel, R.R.; Reiser, M.; Hennig-Fast, K. Neurobiological Underpinnings of Shame and Guilt: A Pilot FMRI Study. Soc. Cogn. Affect. Neurosci. 2012, 9, 150–157. [Google Scholar] [CrossRef]
- Achiron, A.; Chapman, J.; Tal, S.; Bercovich, E.; Gil, H.; Achiron, A. Superior Temporal Gyrus Thickness Correlates With Cognitive Performance in Multiple Sclerosis. Brain Struct. Funct. 2012, 218, 943–950. [Google Scholar] [CrossRef] [PubMed]
- Uddin, L.Q.; Nomi, J.S.; Hébert-Seropian, B.; Ghaziri, J.; Boucher, O. Structure and Function of the Human Insula. J. Clin. Neurophysiol. 2017, 34, 300–306. [Google Scholar] [CrossRef]
- Finke, C.; Schlichting, J.; Papazoglou, S.; Scheel, M.; Freing, A.; Soemmer, C.; Pech, L.; Pajkert, A.; Pfüller, C.; Wuerfel, J.; et al. Altered Basal Ganglia Functional Connectivity in Multiple Sclerosis Patients With Fatigue. Mult. Scler. J. 2014, 21, 925–934. [Google Scholar] [CrossRef] [PubMed]
- Jaeger, S.; Paul, F.; Scheel, M.; Brandt, A.; Heine, J.; Pach, D.; Witt, C.M.; Bellmann-Strobl, J.; Finke, C. Multiple sclerosis–related Fatigue: Altered Resting-State Functional Connectivity of the Ventral Striatum and Dorsolateral Prefrontal Cortex. Mult. Scler. J. 2018, 25, 554–564. [Google Scholar] [CrossRef] [Green Version]
- Lin, F.; Zivadinov, R.; Hagemeier, J.; Weinstock-Guttman, B.; Vaughn, C.; Gandhi, S.; Jakimovski, D.; Hulst, E.H.; Benedict, R.H.; Bergsland, N.; et al. Altered Nuclei-Specific Thalamic Functional Connectivity Patterns in Multiple Sclerosis and Their Associations with Fatigue and Cognition. Mult. Scler. J. 2018, 25, 1243–1254. [Google Scholar] [CrossRef] [PubMed]
- Chiang, F.L.; Wang, Q.; Yu, F.F.; Romero, R.S.; Huang, S.Y.; Fox, P.M.; Tantiwongkosi, B. Localised Grey Matter Atrophy in Multiple Sclerosis Is Network-Based: A Coordinate-Based Meta-Analysis. Clin. Radiol. 2019, 74, 816.e19–816.e28. [Google Scholar] [CrossRef] [PubMed]
- Robinson, J.L.; Laird, A.R.; Glahn, D.C.; Lovallo, W.R.; Fox, P.T. Metaanalytic Connectivity Modeling: Delineating the Functional Connectivity of the Human Amygdala. Hum. Brain Mapp. 2009, 31, 173–184. [Google Scholar] [CrossRef] [Green Version]


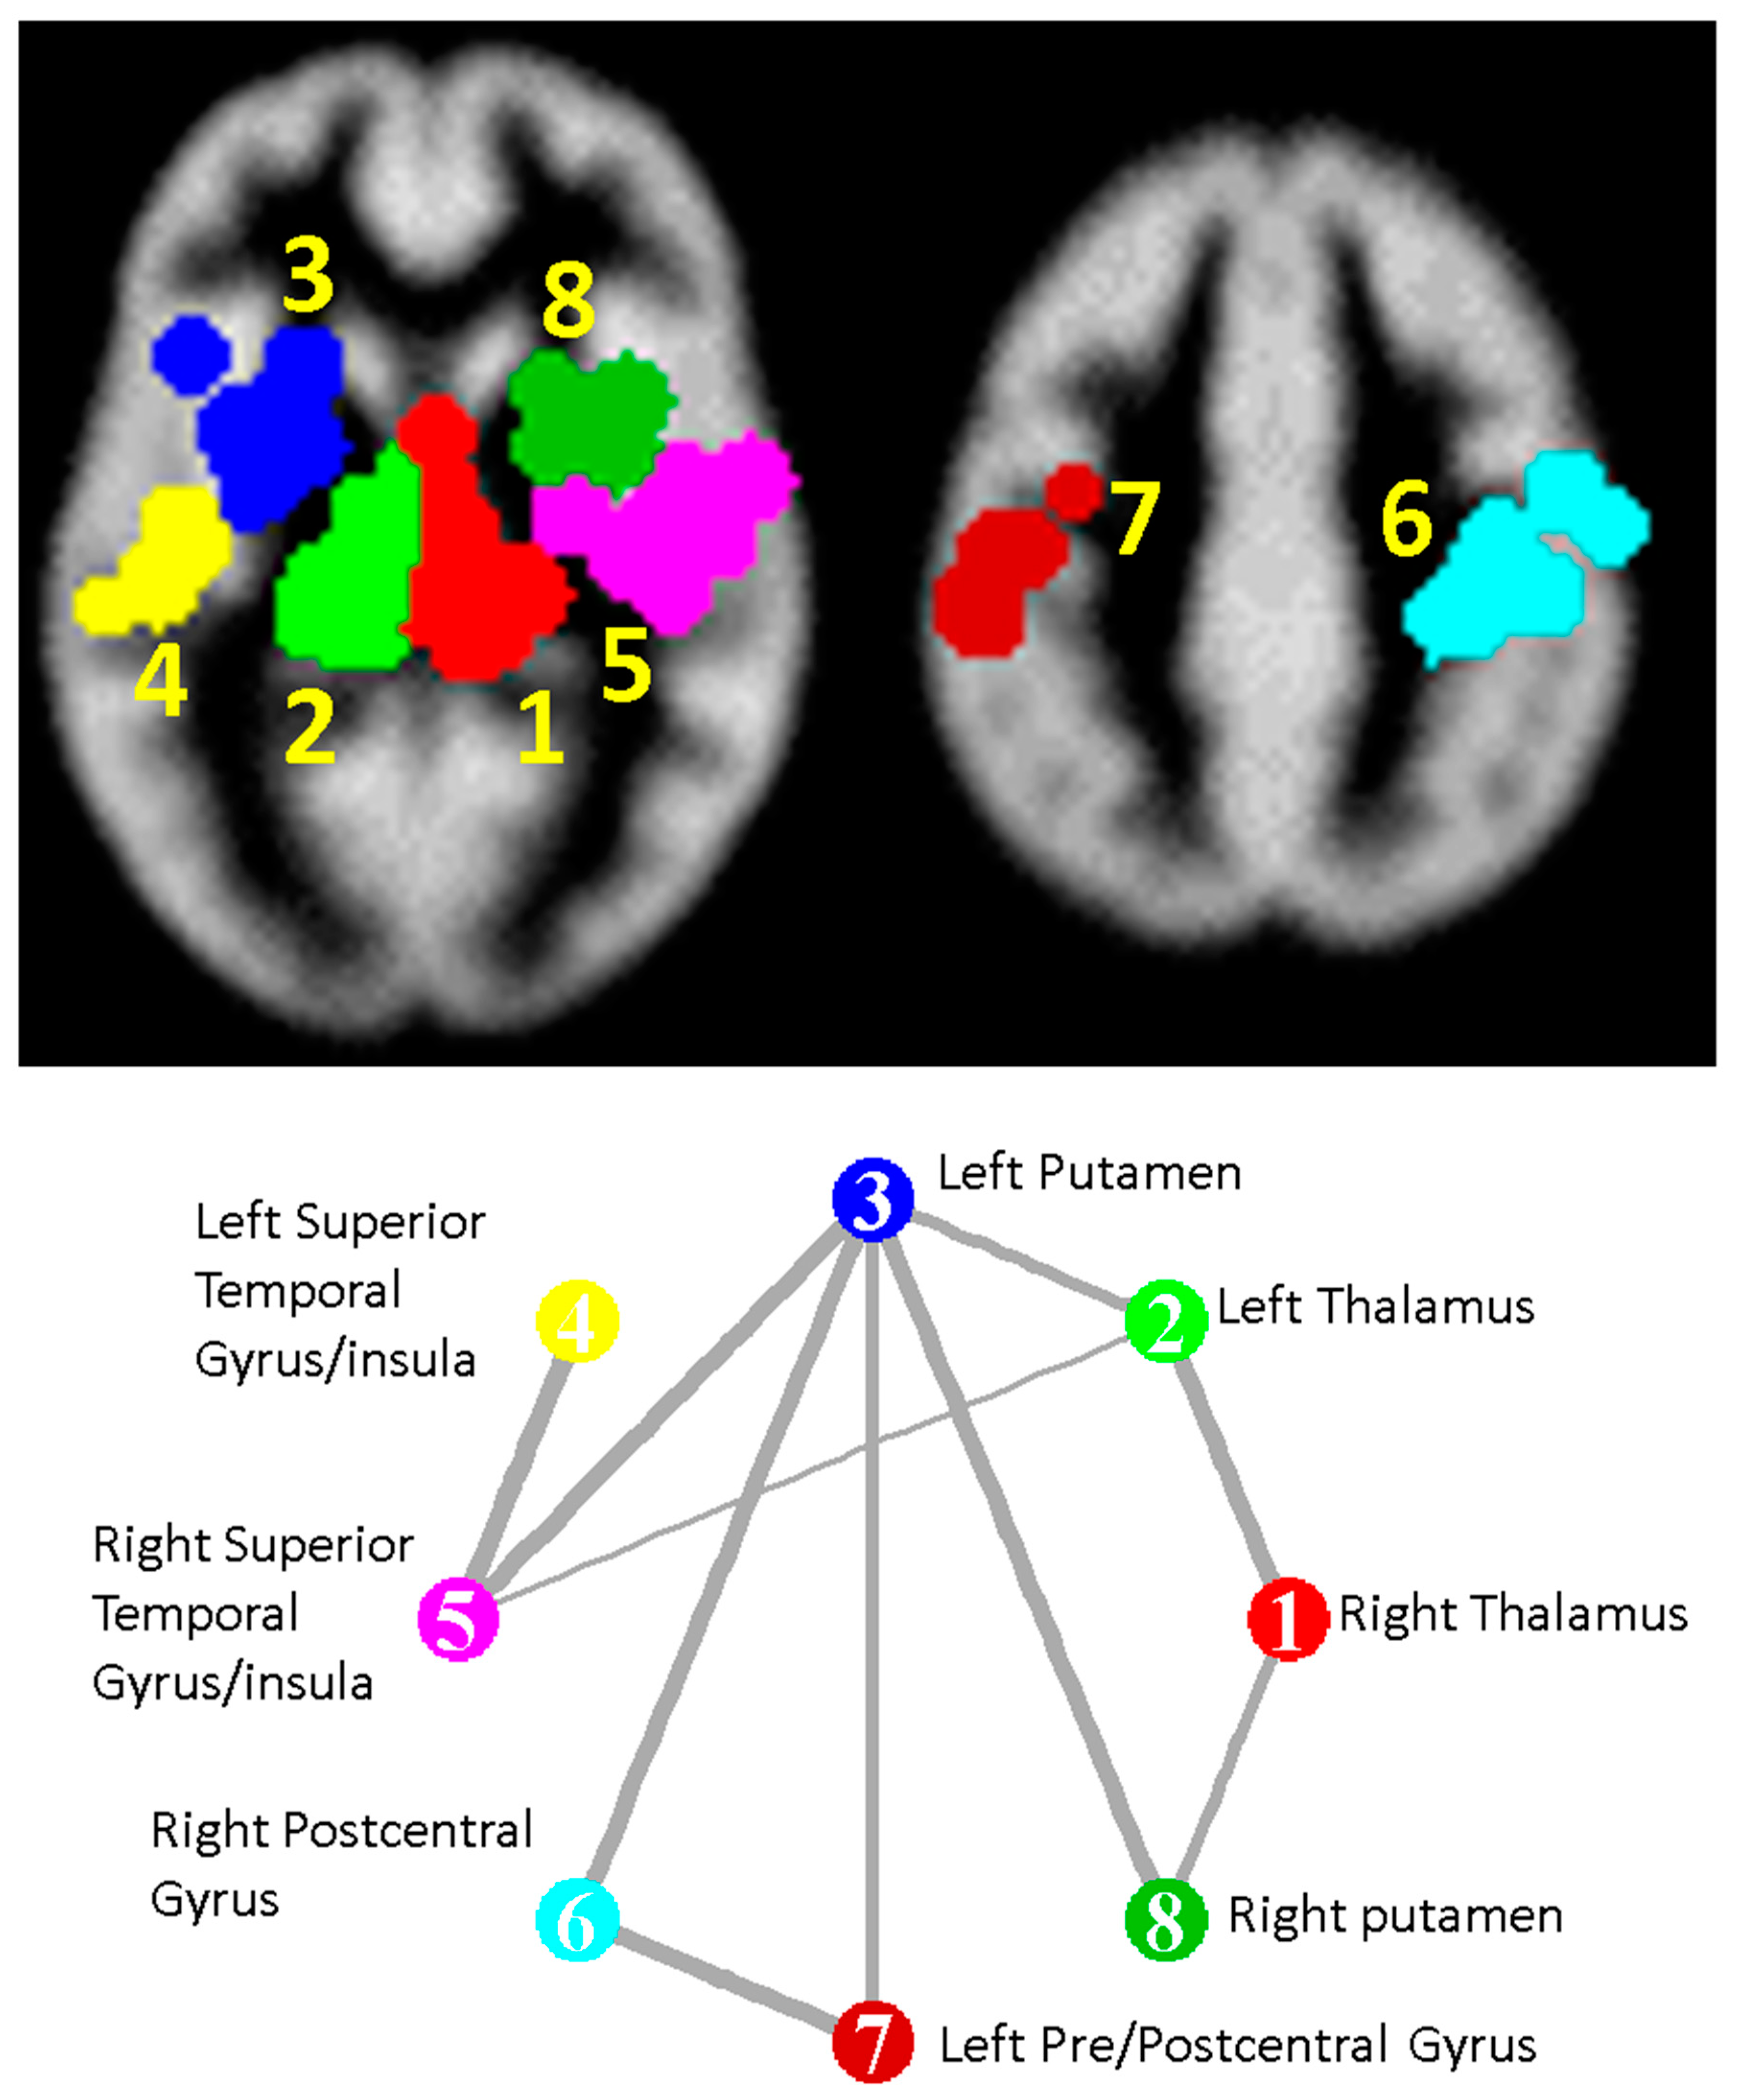
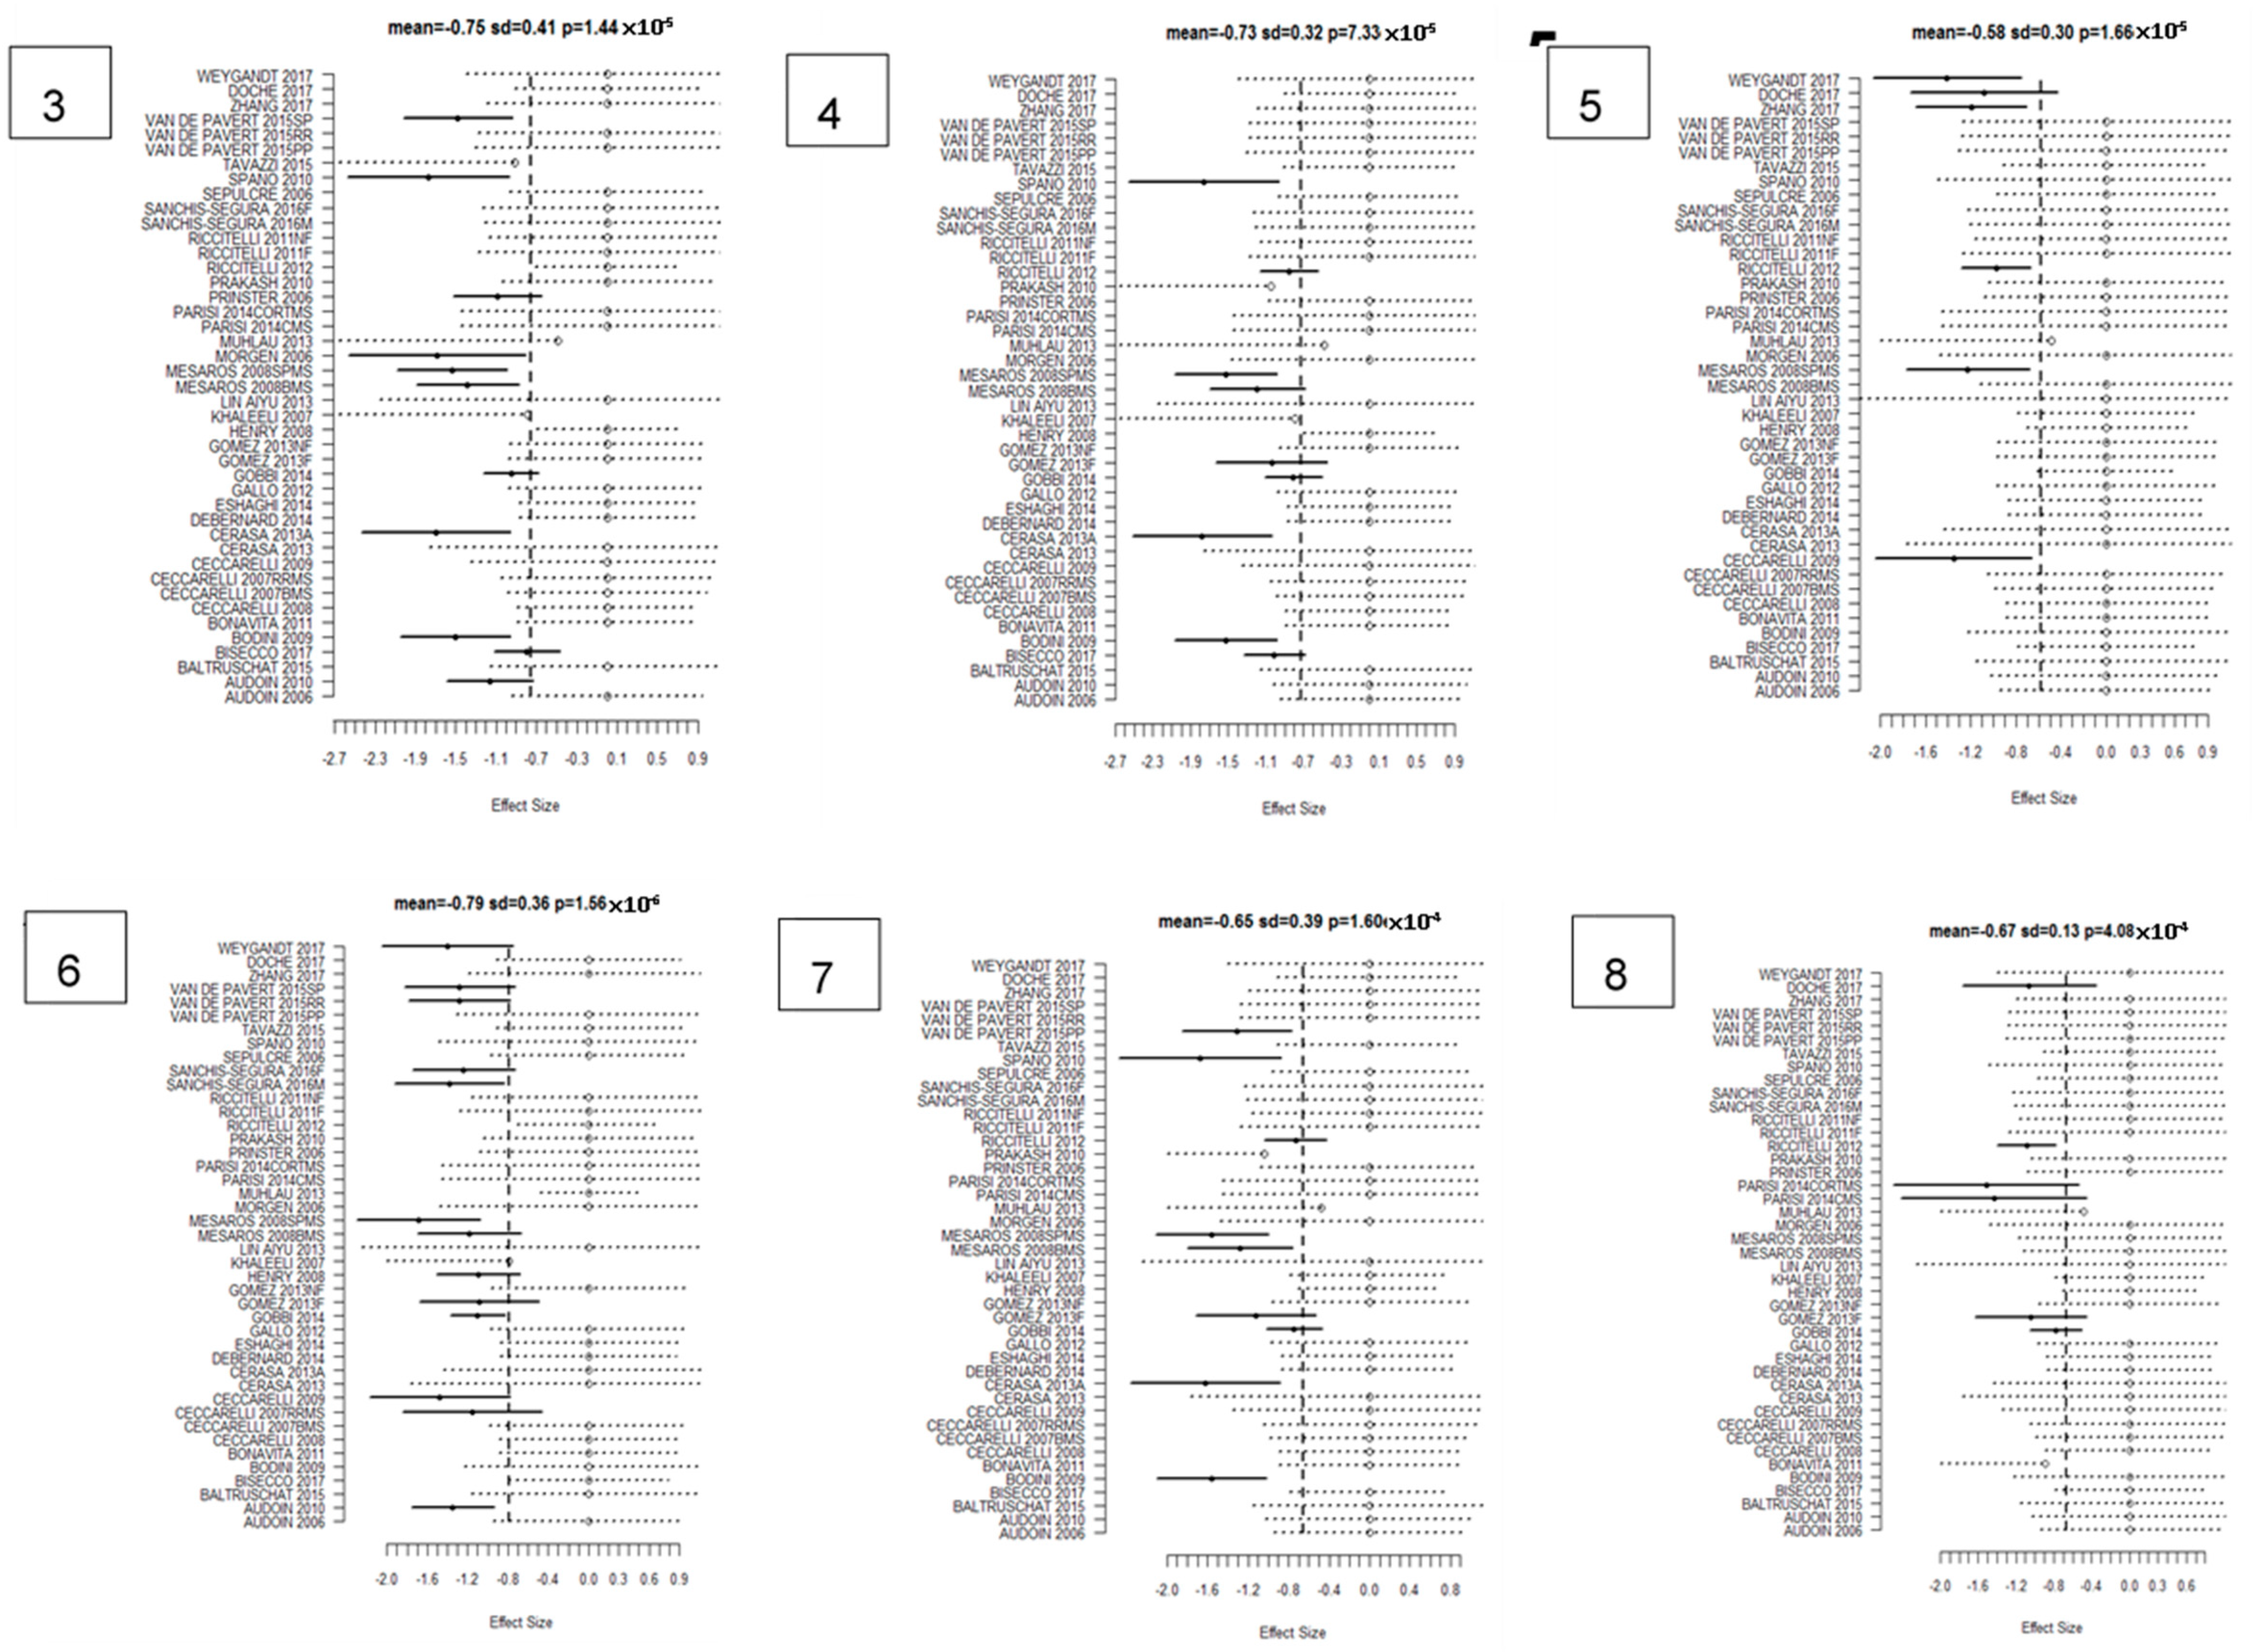
| Cluster Number | Talairach Labels | Talairach Coordinate of Density Peak (x,y,z)mm | Main Analysis Mean (SD); FCDR | CIS Subanalysis Mean | BMS Subanalysis Mean | RRMS Subanalysis Mean | PPMS Subanalysis Mean | SPMS Subanalysis Mean |
|---|---|---|---|---|---|---|---|---|
| 1 | Right Thalamus | (12.0 −28.0 8.0) | −1.27 (0.25); 0.00025 | −1.01 | −1.76 | −1.23 | −0.94 | −1.80 |
| 2 | Left Thalamus | (−14.0 −28.0 8.0) | −1.25 (0.26); 0.00025 | −1.04 | −1.74 | −1.11 | −1.25 | −1.70 |
| 3 | Left Putamen | (−28.0 2.0 6.0) | −0.96 (0.24); 0.00033 | −0.96 | −1.28 | −0.81 | −0.96 | −1.52 |
| 4 | Left Superior Temporal Gyrus/Insula | (−48.0 −18.0 2.0) | −0.85 (0.19); 0.007 | −0.66 | - | −0.85 | −0.77 | −1.09 |
| 5 | Right Superior Temporal Gyrus/Insula | (38.0 −18.0 12.0) | −0.84 (0.2); 0.009 | - | - | −0.83 | −0.55 | −1.22 |
| 6 | Right Postcentral Gyrus | (36.0 −26.0 48.0) | −0.87 (0); 0.0014 | −0.67 | −1.18 | −0.90 | −0.78 | −1.20 |
| 7 | Left Pre- and Postcentral Gyrus * | (−46.0 −18.0 38.0) | −0.69 (0.3); 0.18 | −0.69 | −1.03 | −0.82 | −0.79 | −1.57 |
| 8 | Right Putamen | (26.0 4.0 8.0) | −0.8 (0.31); 0.03 | - | −1.25 | −0.69 | −0.48 | −1.27 |
| Location | Talairach Coordinates (x,y,z) mm | Change in Standardised Effect per Year (% of Mean Effect) |
|---|---|---|
| Age | ||
| Left Thalamus | (−14.3 −28.3 10.4) | −0.025 (2%) |
| Disease Duration | ||
| Right Thalamus | (10.0 −30.0 7.0) | −0.049 (3.7%) |
| Left Thalamus | (−14.3 −25.2 6.1) | −0.046 (3.8%) |
| Left Claustrum, Putamen, and Insula | (−31.0 0.3 8.8) | −0.032 (3.4%) |
Publisher’s Note: MDPI stays neutral with regard to jurisdictional claims in published maps and institutional affiliations. |
© 2020 by the authors. Licensee MDPI, Basel, Switzerland. This article is an open access article distributed under the terms and conditions of the Creative Commons Attribution (CC BY) license (http://creativecommons.org/licenses/by/4.0/).
Share and Cite
Singh, S.; Tench, C.R.; Tanasescu, R.; Constantinescu, C.S. Localised Grey Matter Atrophy in Multiple Sclerosis and Clinically Isolated Syndrome—A Coordinate-Based Meta-Analysis, Meta-Analysis of Networks, and Meta-Regression of Voxel-Based Morphometry Studies. Brain Sci. 2020, 10, 798. https://0-doi-org.brum.beds.ac.uk/10.3390/brainsci10110798
Singh S, Tench CR, Tanasescu R, Constantinescu CS. Localised Grey Matter Atrophy in Multiple Sclerosis and Clinically Isolated Syndrome—A Coordinate-Based Meta-Analysis, Meta-Analysis of Networks, and Meta-Regression of Voxel-Based Morphometry Studies. Brain Sciences. 2020; 10(11):798. https://0-doi-org.brum.beds.ac.uk/10.3390/brainsci10110798
Chicago/Turabian StyleSingh, Sonika, Christopher R. Tench, Radu Tanasescu, and Cris S. Constantinescu. 2020. "Localised Grey Matter Atrophy in Multiple Sclerosis and Clinically Isolated Syndrome—A Coordinate-Based Meta-Analysis, Meta-Analysis of Networks, and Meta-Regression of Voxel-Based Morphometry Studies" Brain Sciences 10, no. 11: 798. https://0-doi-org.brum.beds.ac.uk/10.3390/brainsci10110798