Brain Connectivity Changes after Osteopathic Manipulative Treatment: A Randomized Manual Placebo-Controlled Trial

 , ,
, ,
Abstract
:
1. Introduction
2. Methods
2.1. Ethical Issues
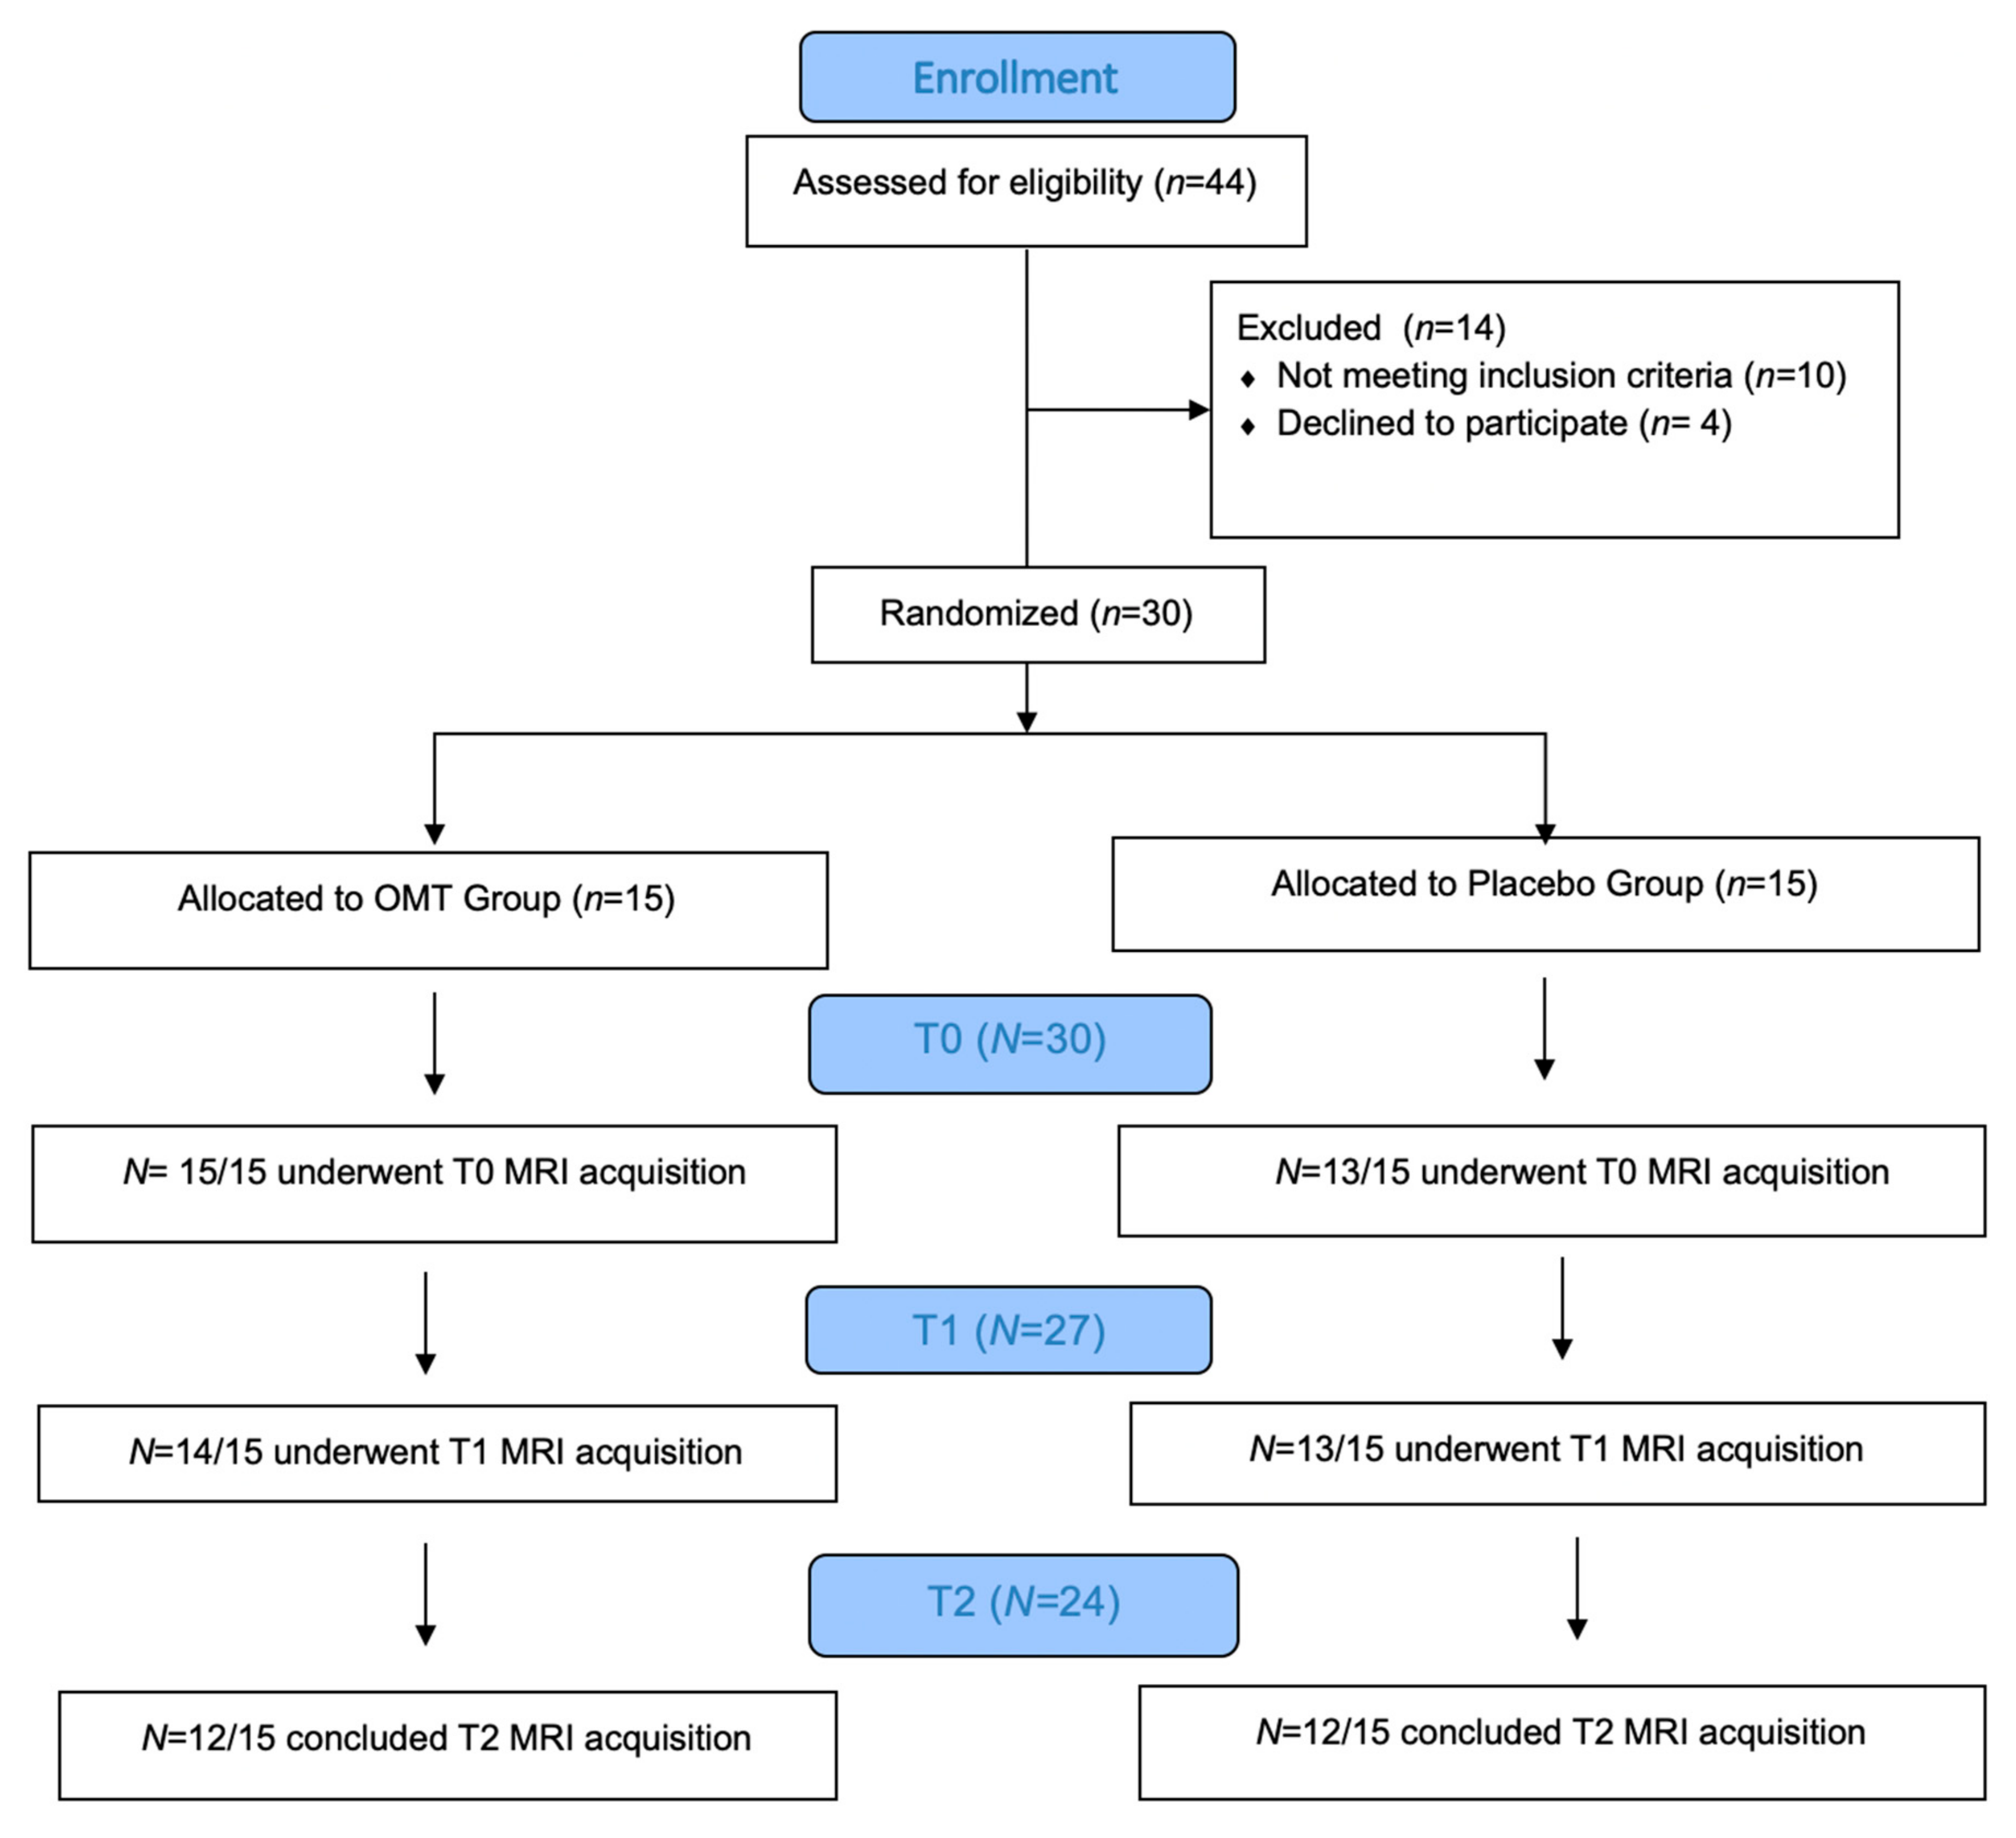
2.2. Subjects
2.3. Experimental Design
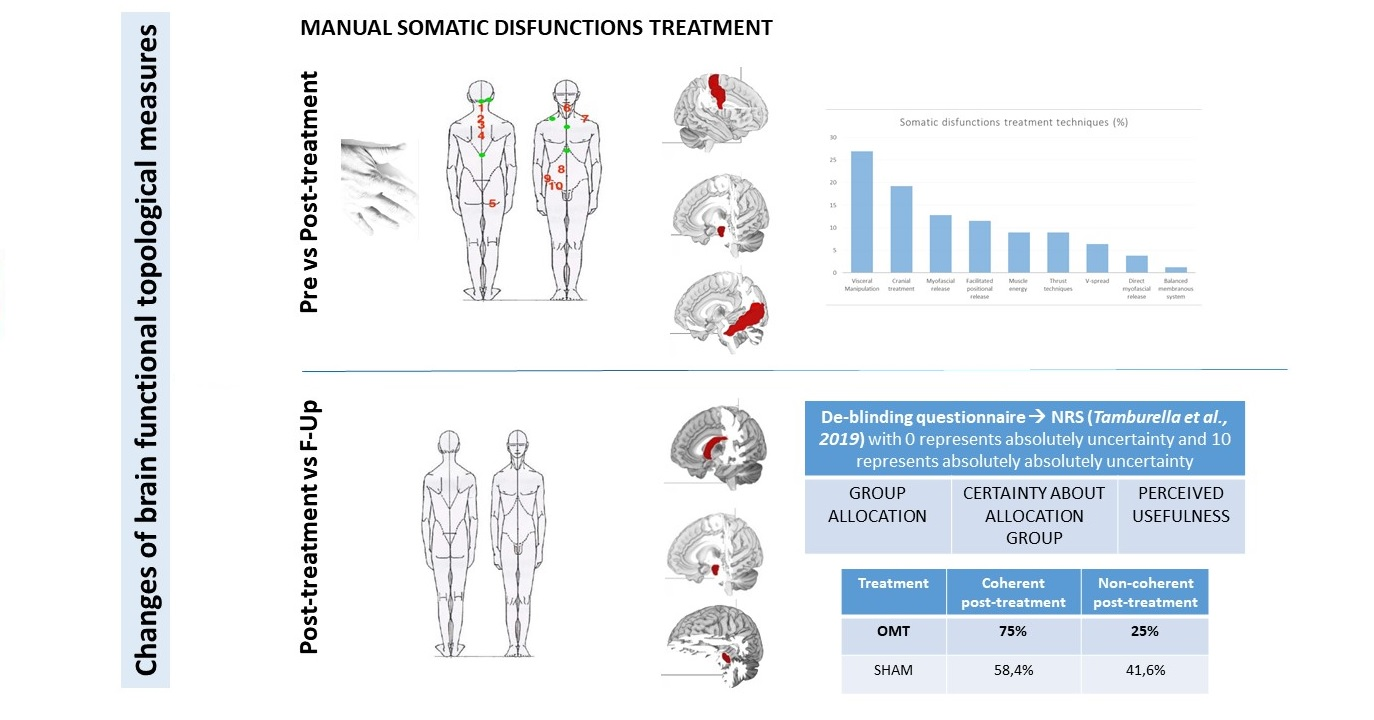
2.4. De-Blinding Questionnaire
2.5. fMRI Data Acquisition
2.6. fMRI Preprocessing
2.7. Network Analysis
2.8. Power Analysis
3. Results
3.1. Description of the Sample at Baseline
3.2. fMRI Results
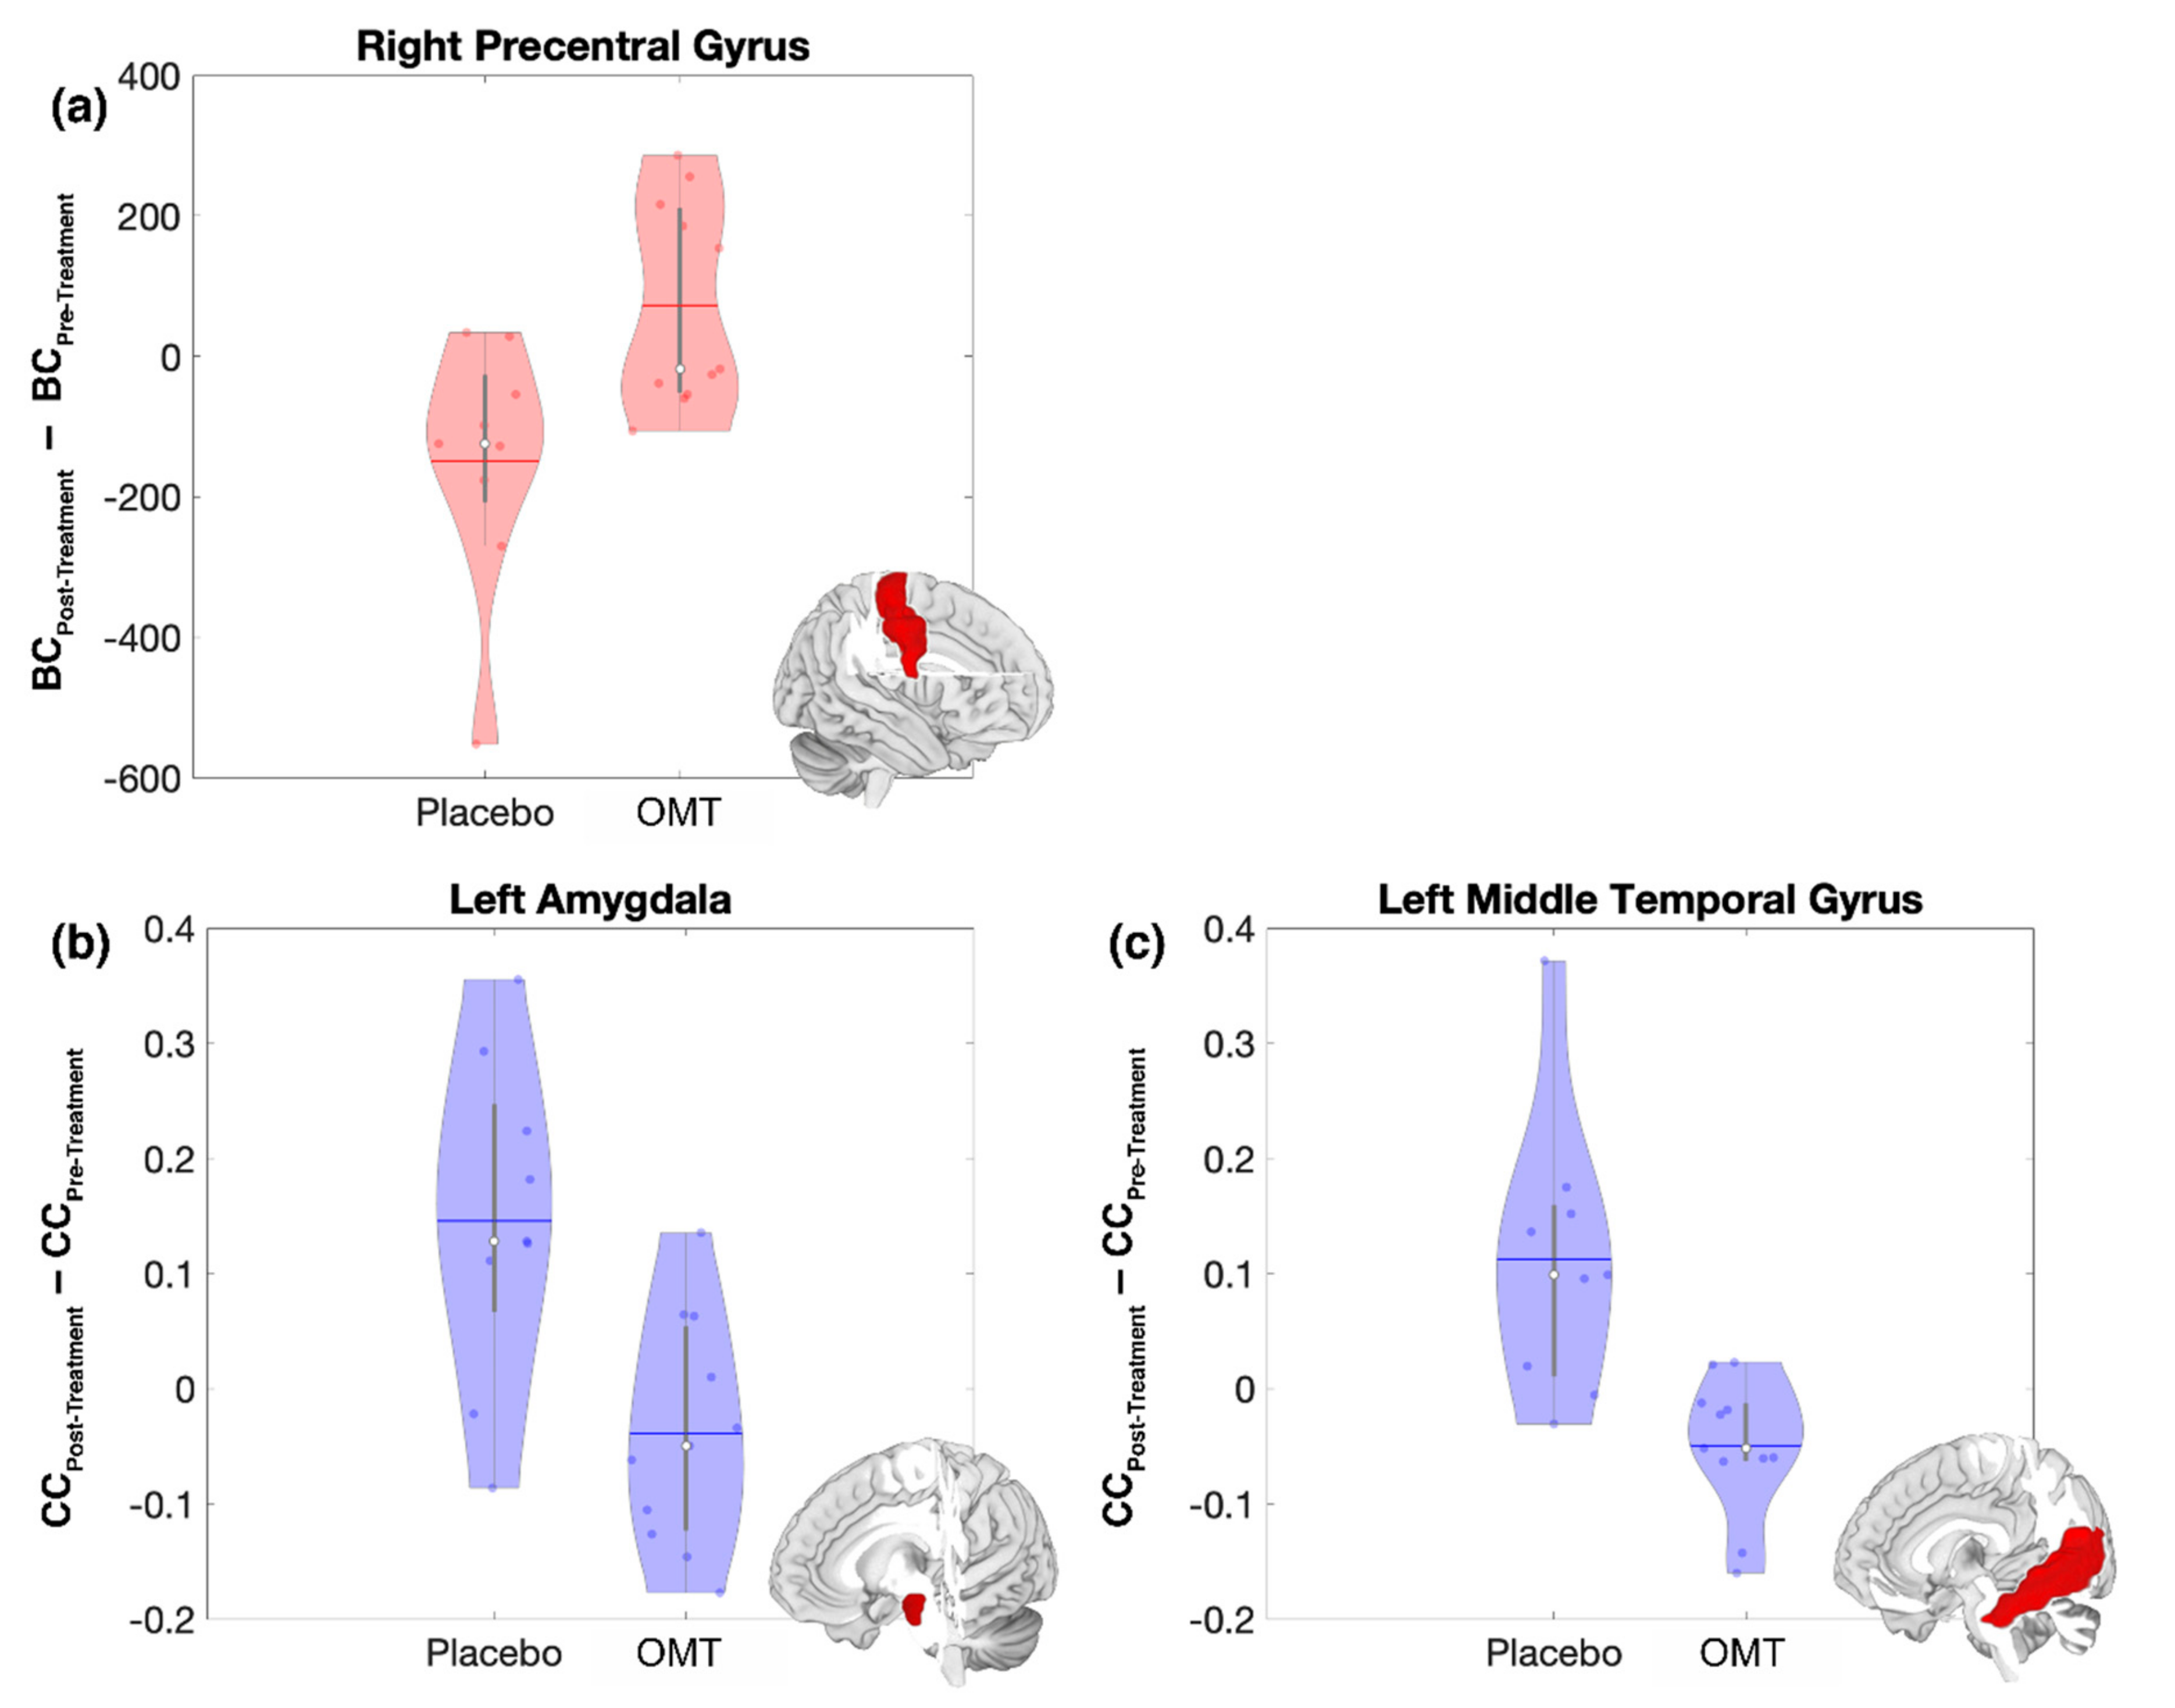
3.2.1. Pre-Treatment to Post-Treatment Changes (T0 vs. T1 fMRI Data)
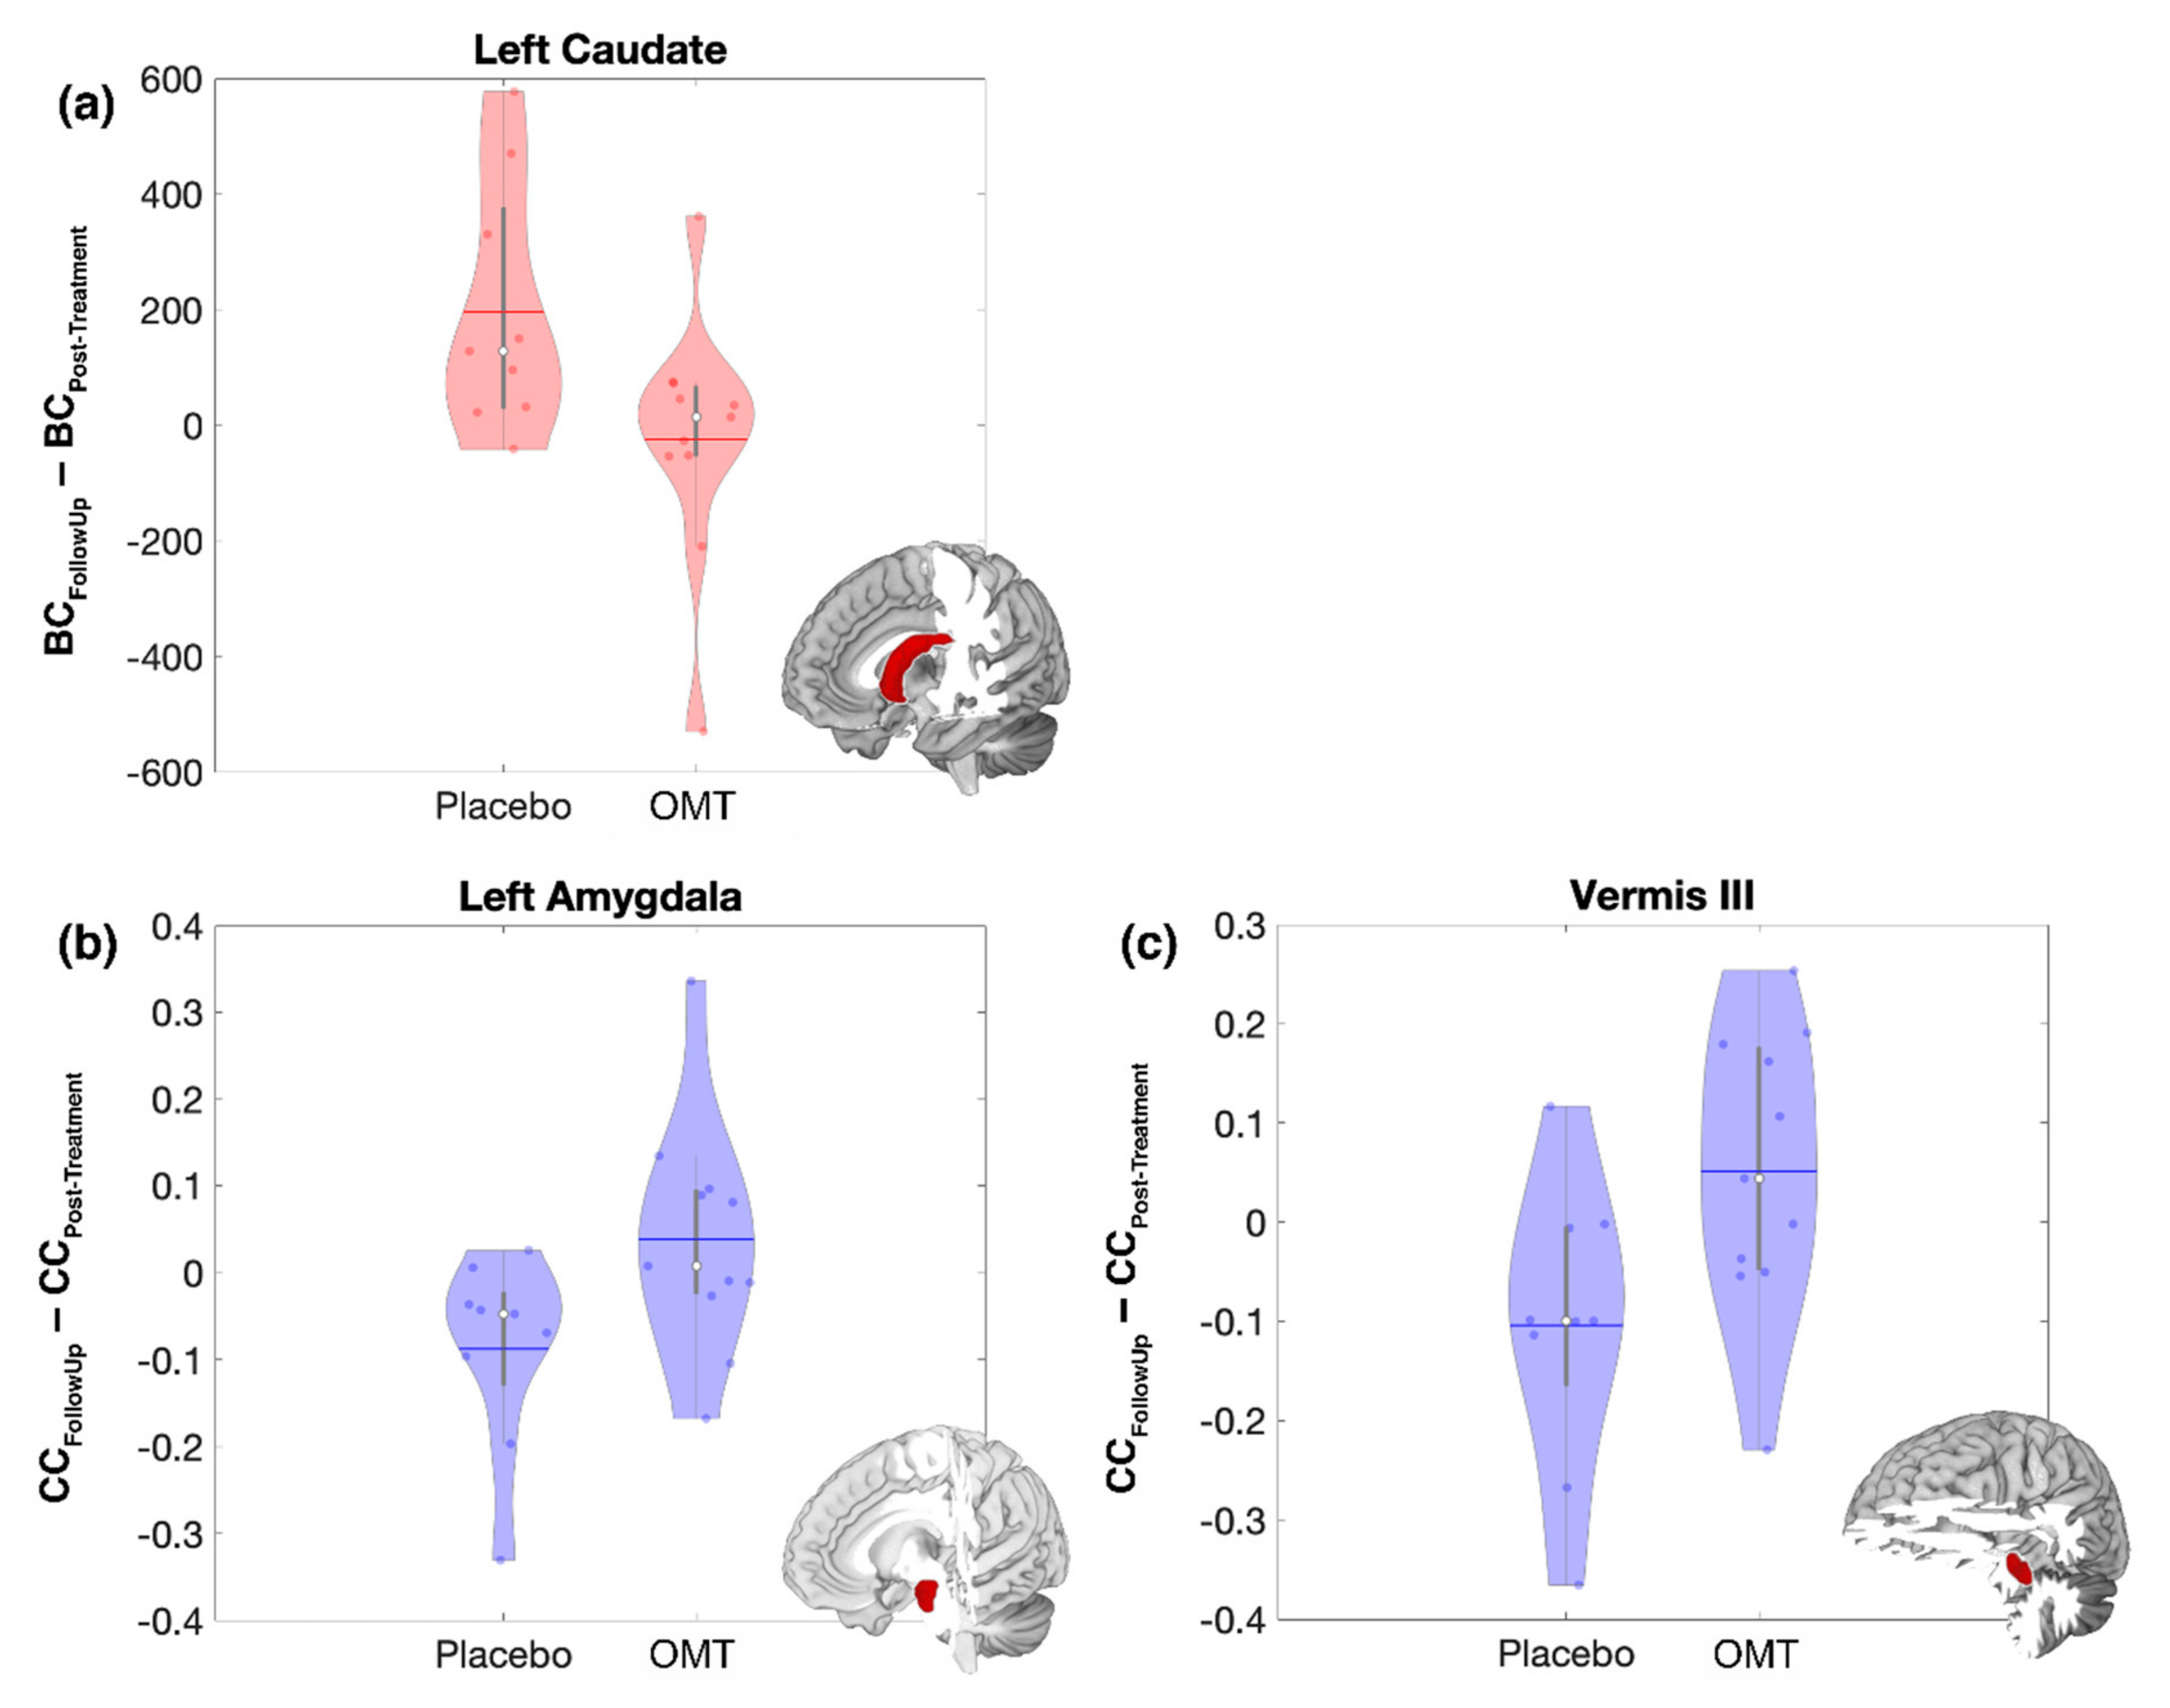
3.2.2. Post-Treatment to Follow-Up Changes (T1 vs. T2 fMRI Data)
3.3. De-Blinding Questionnaire Results
4. Discussion
5. Conclusions
Author Contributions
Funding
Acknowledgments
Conflicts of Interest
References
- Tramontano, M.; Pagnotta, S.; Lunghi, C.; Manzo, C.; Manzo, F.; Consolo, S.; Manzo, V. Assessment and Management of Somatic Dysfunctions in Patients With Patellofemoral Pain Syndrome. J. Am. Osteopath. Assoc. 2020, 120, 165–173. [Google Scholar] [CrossRef]
- Lunghi, C.; Tozzi, P.; Fusco, G. The biomechanical model in manual therapy: Is there an ongoing crisis or just the need to revise the underlying concept and application? J. Bodyw. Mov. Ther. 2016, 20, 784–799. [Google Scholar] [CrossRef] [PubMed]
- ICD-10 CM. International Classification of Disease, 10th Revision ICD-10 CM. ICD-10 Version: 2019. Available online: https://icd.who.int/browse10/2019/en (accessed on 8 December 2020).
- Franke, H.; Franke, J.-D.; Fryer, G. Osteopathic manipulative treatment for nonspecific low back pain: A systematic review and meta-analysis. BMC Musculoskelet. Disord. 2014, 15, 286. [Google Scholar] [CrossRef] [PubMed] [Green Version]
- Tramontano, M.; Cinnera, A.M.; Petracca, M.; Gaeta, A.; Tamburella, F.; Audouard, M.; Caltagirone, C. Outpatient Satisfaction with Osteopathic Manipulative Treatment in a Hospital Center: A Survey. Altern. Ther. Health Med. 2018, 24, 18–24. [Google Scholar]
- Cerritelli, F.; Lacorte, E.; Ruffini, N.; Vanacore, N. Osteopathy for primary headache patients: A systematic review. J. Pain Res. 2017, 10, 601–611. [Google Scholar] [CrossRef] [PubMed] [Green Version]
- Tassorelli, C.; Tramontano, M.; Berlangieri, M.; Schweiger, V.; D’Ippolito, M.; Palmerini, V.; Bonazza, S.; Rosa, R.; Cerbo, R.; Buzzi, M.G. Assessing and treating primary headaches and cranio-facial pain in patients undergoing rehabilitation for neurological diseases. J. Headache Pain 2017, 18, 99. [Google Scholar] [CrossRef] [PubMed]
- D’Ippolito, M.; Tramontano, M.; Buzzi, M.G. Effects of Osteopathic Manipulative Therapy on Pain and Mood Disorders in Patients with High-Frequency Migraine. J. Am. Osteopath. Assoc. 2017, 117, 365–369. [Google Scholar] [CrossRef] [PubMed] [Green Version]
- Licciardone, J.; Gatchel, R.J.; Aryal, S. Recovery from Chronic Low Back Pain after Osteopathic Manipulative Treatment: A Randomized Controlled Trial. J. Am. Osteopath. Assoc. 2016, 116, 144–155. [Google Scholar] [CrossRef] [Green Version]
- Task Force on the Low Back Pain Clinical Practice Guidelines. American Osteopathic Association Guidelines for Osteopathic Manipulative Treatment (OMT) for Patients with Low Back Pain. J. Am. Osteopath. Assoc. 2016, 116, 536–549. [Google Scholar] [CrossRef] [Green Version]
- Ruffini, N.; D’Alessandro, G.; Cardinali, L.; Frondaroli, F.; Cerritelli, F. Osteopathic manipulative treatment in gynecology and obstetrics: A systematic review. Complement. Ther. Med. 2016, 26, 72–78. [Google Scholar] [CrossRef]
- Cerritelli, F.; Ruffini, N.; Lacorte, E.; Vanacore, N. Osteopathic manipulative treatment in neurological diseases: Systematic review of the literature. J. Neurol. Sci. 2016, 369, 333–341. [Google Scholar] [CrossRef] [PubMed]
- Lanaro, D.; Ruffini, N.; Manzotti, A.; Lista, G. Osteopathic manipulative treatment showed reduction of length of stay and costs in preterm infants: A systematic review and meta-analysis. Medicine 2017, 96, e6408. [Google Scholar] [CrossRef] [PubMed]
- Cerritelli, F.; Cicchitti, L.; Martelli, M.; Barlafante, G.; Renzetti, C.; Pizzolorusso, G.; Lupacchini, M.; D’Orazio, M.; Marinelli, B.; Cozzolino, V.; et al. Osteopathic manipulative treatment and pain in preterms: Study protocol for a randomised controlled trial. Trials 2015, 16, 84. [Google Scholar] [CrossRef] [PubMed] [Green Version]
- Porcari, B.; Russo, M.; Naro, A.; La Via, C.; Pullia, M.; Accorinti, M.; De Luca, R.; Calabrò, R.S. Effects of osteopathic manipulative treatment on patients with multiple sclerosis: A pilot study. Complement. Ther. Med. 2019, 43, 154–156. [Google Scholar] [CrossRef]
- Fornari, M.; Carnevali, L.; Sgoifo, A. Single Osteopathic Manipulative Therapy Session Dampens Acute Autonomic and Neuroendocrine Responses to Mental Stress in Healthy Male Participants. J. Am. Osteopath. Assoc. 2017, 117, 559–567. [Google Scholar] [CrossRef] [Green Version]
- Tamburella, F.; Piras, F.; Piras, F.; Spanò, B.; Tramontano, M.; Gili, T. Cerebral Perfusion Changes after Osteopathic Manipulative Treatment: A Randomized Manual Placebo-Controlled Trial. Front. Physiol. 2019, 10, 403. [Google Scholar] [CrossRef] [Green Version]
- Cerritelli, F.; Chiacchiaretta, P.; Gambi, F.; Perrucci, M.G.; Barassi, G.; Visciano, C.; Bellomo, R.G.; Saggini, R.; Ferretti, A. Effect of manual approaches with osteopathic modality on brain correlates of interoception: An fMRI study. Sci. Rep. 2020, 10, 3214. [Google Scholar] [CrossRef] [Green Version]
- Gay, C.W.; Robinson, M.E.; George, S.Z.; Perlstein, W.M.; Bishop, M.D. Immediate changes after manual therapy in resting-state functional connectivity as measured by functional magnetic resonance imaging in participants with induced low back pain. J. Manip. Physiol. Ther. 2014, 37, 614–627. [Google Scholar] [CrossRef] [Green Version]
- Cerritelli, F.; Chiacchiaretta, P.; Gambi, F.; Ferretti, A. Effect of Continuous Touch on Brain Functional Connectivity is Modified by the Operator’s Tactile Attention. Front. Hum. Neurosci. 2017, 11, 368. [Google Scholar] [CrossRef] [Green Version]
- Fox, M.D.; Snyder, A.Z.; Vincent, J.L.; Raichle, M.E. Intrinsic fluctuations within cortical systems account for intertrial variability in human behavior. Neuron 2007, 56, 171–184. [Google Scholar] [CrossRef] [Green Version]
- Hampson, M.; Driesen, N.R.; Skudlarski, P.; Gore, J.C.; Constable, R.T. Brain connectivity related to working memory performance. J. Neurosci. 2006, 26, 13338–13343. [Google Scholar] [CrossRef] [PubMed]
- Fox, M.D.; Snyder, A.Z.; Zacks, J.M.; Raichle, M.E. Coherent spontaneous activity accounts for trial-to-trial variability in human evoked brain responses. Nat. Neurosci. 2006, 9, 23–25. [Google Scholar] [CrossRef] [PubMed]
- Tommasin, S.; Mascali, D.; Moraschi, M.; Gili, T.; Hassan, I.E.; Fratini, M.; DiNuzzo, M.; Wise, R.G.; Mangia, S.; Macaluso, E.; et al. Scale-invariant rearrangement of resting state networks in the human brain under sustained stimulation. Neuroimage 2018, 179, 570–581. [Google Scholar] [CrossRef] [PubMed]
- Damoiseaux, J.; Rombouts, S.A.R.B.; Barkhof, F.; Scheltens, P.; Stam, C.J.; Smith, S.M.; Beckmann, C.F. Consistent resting-state networks across healthy subjects. Proc. Natl. Acad. Sci. USA 2006, 103, 13848–13853. [Google Scholar] [CrossRef] [PubMed] [Green Version]
- Yeo, B.T.; Krienen, F.M.; Sepulcre, J.; Sabuncu, M.R.; Lashkari, D.; Hollinshead, M.; Roffman, J.L.; Smoller, J.W.; Zöllei, L.; Polimeni, J.R. The organization of the human cerebral cortex estimated by intrinsic functional connectivity. J. Neurophysiol. 2011, 106, 1125–1165. [Google Scholar] [PubMed]
- Sporns, O. Network attributes for segregation and integration in the human brain. Curr. Opin. Neurobiol. 2013, 23, 162–171. [Google Scholar] [CrossRef] [PubMed]
- Network Science 2016. Available online: https://barabasi.com/NetworkScienceBook (accessed on 8 December 2020).
- Rubinov, M.; Sporns, O. Complex network measures of brain connectivity: Uses and interpretations. Neuroimage 2010, 52, 1059–1069. [Google Scholar] [CrossRef]
- Bassett, D.S.; Wymbs, N.F.; Porter, M.A.; Mucha, P.J.; Carlson, J.M.; Grafton, S.T. Dynamic reconfiguration of human brain networks during learning. Proc. Natl. Acad. Sci. USA 2011, 108, 7641–7646. [Google Scholar] [CrossRef] [Green Version]
- Folstein, M.F.; Folstein, S.E.; McHugh, P.R. “Mini-mental state”. A practical method for grading the cognitive state of patients for the clinician. J. Psychiatr. Res. 1975, 12, 189–198. [Google Scholar] [CrossRef]
- Measso, G.; Cavarzeran, F.; Zappalà, G.; Lebowitz, B.D.; Crook, T.H.; Pirozzolo, F.J.; Amaducci, L.A.; Massari, D.C.; Grigoletto, F. The Mini-Mental State Examination: Normative Study of an Italian Random Sample. Dev. Neuropsychol. 1993, 9, 77–85. [Google Scholar] [CrossRef]
- Carlesimo, G.; Caltagirone, C.; Gainotti, G.; Fadda, L.; Gallassi, R.; Lorusso, S.; Marfia, G.; Marra, C.; Nocentini, U.; Parnetti, L. The Mental Deterioration Battery: Normative data, diagnostic reliability and qualitative analyses of cognitive impairment. The Group for the Standardization of the Mental Deterioration Battery. Eur. Neurol. 1996, 36, 378–384. [Google Scholar] [CrossRef] [PubMed]
- McKhann, G.M.; Knopman, D.S.; Chertkow, H.; Hyman, B.T.; Jack, C.R., Jr.; Kawas, C.H.; Klunk, W.E.; Koroshetz, W.J.; Manly, J.J.; Mayeux, R. The diagnosis of dementia due to Alzheimer’s disease: Recommendations from the National Institute on Aging-Alzheimer’s Association workgroups on diagnostic guidelines for Alzheimer’s disease. Alzheimer’s Dement. 2011, 7, 263–269. [Google Scholar] [CrossRef] [PubMed] [Green Version]
- First, M.B.; Gibbon, M.; Spitzer, R.L.; Williams, J.B. Structured Clinical Interview for DSM-IV Axis II Personality Disorders (SCID-II); American Psychiatric Press: Washington, DC, USA, 1997. [Google Scholar]
- Sciomachen, P.; Arienti, C.; Bergna, A.; Castagna, C.; Consorti, G.; Lotti, A.; Lunghi, C.; Tramontano, M.; Longobardi, M. Core competencies in osteopathy: Italian register of osteopaths proposal. Int. J. Osteopath. Med. 2018, 27, 1–5. [Google Scholar] [CrossRef] [Green Version]
- Educational Council on Osteopathic Principles (ECOP). Glossary of Osteopathic Terminology, 3rd ed.; American Association of Colleges of Osteopathic Medicine: Bethesda, MD, USA, 2017; Available online: https://www.aacom.org/docs/default-source/default-document-library/glossary2017.pdf?sfvrsn=a41c3b97_0 (accessed on 6 December 2020).
- Hi, M. Osteopathy in the Cranial Field, 3rd ed.; The Journal Printing Company: Kirksville, MO, USA, 1976. [Google Scholar]
- Johnson, S.M.; Kurtz, M.E. Osteopathic manipulative treatment techniques preferred by contemporary osteopathic physicians. J. Am. Osteopath. Assoc. 2003, 103, 219–224. [Google Scholar] [PubMed]
- Lay, E.M.; King, H.H. Osteopathy in the Cranial Field; Lippincott Williams & Wilkins: Philadelphia, PA, USA, 1997; pp. 901–913. [Google Scholar]
- Noll, D.R.; Degenhardt, B.F.; Stuart, M.; McGovern, R.; Matteson, M. Effectiveness of a sham protocol and adverse effects in a clinical trial of osteopathic manipulative treatment in nursing home patients. J. Am. Osteopath. Assoc. 2004, 104, 107–113. [Google Scholar]
- Hrobjartsson, A. What are the main methodological problems in the estimation of placebo effects? J. Clin. Epidemiol. 2002, 55, 430–435. [Google Scholar] [CrossRef]
- Chaibi, A.; Saltyte Benth, J.; Bjorn Russell, M. Validation of Placebo in a Manual Therapy Randomized Controlled Trial. Sci. Rep. 2015, 5, 11774. [Google Scholar] [CrossRef] [Green Version]
- Glover, G.H.; Li, T.Q.; Ress, D. Image-based method for retrospective correction of physiological motion effects in fMRI: RETROICOR. Magn. Reson. Med. 2000, 44, 162–167. [Google Scholar] [CrossRef]
- Birn, R.M.; Diamond, J.B.; Smith, M.A.; Bandettini, P.A. Separating respiratory-variation-related fluctuations from neuronal-activity-related fluctuations in fMRI. Neuroimage 2006, 31, 1536–1548. [Google Scholar] [CrossRef]
- Chang, C.; Glover, G.H. Effects of model-based physiological noise correction on default mode network anti-correlations and correlations. Neuroimage 2009, 47, 1448–1459. [Google Scholar] [CrossRef] [Green Version]
- Shmueli, K.; Van Gelderen, P.; De Zwart, J.A.; Horovitz, S.G.; Fukunaga, M.; Jansma, J.M.; Duyn, J.H. Low-frequency fluctuations in the cardiac rate as a source of variance in the resting-state fMRI BOLD signal. Neuroimage 2007, 38, 306–320. [Google Scholar] [CrossRef] [PubMed] [Green Version]
- Mazoyera, N.; Landeau, B.; Papathanassiou, D.; Crivello, F.; Etard, O.; Delcroix, N.; Mazoyer, B.; Joliot, M. Automated anatomical labeling of activations in SPM using a macroscopic anatomical parcellation of the MNI MRI single-subject brain. Neuroimage 2002, 15, 273–289. [Google Scholar] [CrossRef] [PubMed]
- Caldarelli, G. Scale-Free Networks: Complex Webs in Nature and Technology; Oxford University Press: Oxford, UK, 2010. [Google Scholar]
- Goelman, G.; Gordon, N.; Bonne, O. Maximizing negative correlations in resting-state functional connectivity MRI by time-lag. PLoS ONE 2014, 9, e111554. [Google Scholar] [CrossRef] [PubMed] [Green Version]
- De Pasquale, F.; Della Penna, S.; Sporns, O.; Romani, G.L.; Corbetta, M. A Dynamic Core Network and Global Efficiency in the Resting Human Brain. Cereb. Cortex 2016, 26, 4015–4033. [Google Scholar] [CrossRef] [PubMed] [Green Version]
- Newman, M.E. Analysis of weighted networks. Phys. Rev. E 2004, 70 Pt 2, 056131. [Google Scholar] [CrossRef] [Green Version]
- Newman, M.E.J. Networks. An Introduction, 2nd ed.; Oxford University Press: Oxford, UK, 2018. [Google Scholar]
- Watts, D.J.; Strogatz, S.H. Collective dynamics of ‘small-world’ networks. Nature 1998, 393, 440–442. [Google Scholar] [CrossRef]
- LeDoux, J. The amygdala. Curr. Biol. 2007, 17, R868–R874. [Google Scholar] [CrossRef] [Green Version]
- Benarroch, E.E. The central autonomic network: Functional organization, dysfunction, and perspective. Mayo Clin. Proc. 1993, 68, 988–1001. [Google Scholar] [CrossRef]
- Beissner, F.; Meissner, K.; Bär, K.-J.; Napadow, V. The autonomic brain: An activation likelihood estimation meta-analysis for central processing of autonomic function. J. Neurosci. 2013, 33, 10503–10511. [Google Scholar] [CrossRef] [Green Version]
- Kumral, D.; Schaare, H.; Beyer, F.; Reinelt, J.; Uhlig, M.; Liem, F.; Lampe, L.; Babayan, A.; Reiter, A.; Erbey, M.; et al. The age-dependent relationship between resting heart rate variability and functional brain connectivity. Neuroimage 2018, 185, 521–533. [Google Scholar] [CrossRef]
- Ruffini, N.; D’Alessandro, G.; Mariani, N.; Pollastrelli, A.; Cardinali, L.; Cerritelli, F. Variations of high frequency parameter of heart rate variability following osteopathic manipulative treatment in healthy subjects compared to control group and sham therapy: Randomized controlled trial. Front. Neurosci. 2015, 9, 272. [Google Scholar] [CrossRef] [PubMed] [Green Version]
- D’Alessandro, G.; Cerritelli, F.; Cortelli, P. Sensitization and Interoception as Key Neurological Concepts in Osteopathy and Other Manual Medicines. Front. Neurosci. 2016, 10, 100. [Google Scholar] [CrossRef] [PubMed] [Green Version]
- Aggleton, J.P.; Wright, N.F.; Rosene, D.L.; Saunders, R.C. Complementary Patterns of Direct Amygdala and Hippocampal Projections to the Macaque Prefrontal Cortex. Cereb. Cortex 2015, 25, 4351–4373. [Google Scholar] [CrossRef] [PubMed] [Green Version]
- Eponzo, V.; Cinnera, A.M.; Mommo, F.; Caltagirone, C.; Koch, G.; Tramontano, M. Osteopathic Manipulative Therapy Potentiates Motor Cortical Plasticity. J. Am. Osteopath. Assoc. 2018, 118, 396–402. [Google Scholar]
- Fatt, C.R.C.; Jha, M.K.; Cooper, C.M.; Fonzo, G.; South, C.; Grannemann, B.; Carmody, T.; Greer, T.L.; Kurian, B.; Fava, M.; et al. Effect of Intrinsic Patterns of Functional Brain Connectivity in Moderating Antidepressant Treatment Response in Major Depression. Am. J. Psychiatr. 2020, 177, 143–154. [Google Scholar] [CrossRef] [PubMed]
- Zhang, Y.; Wu, W.; Toll, R.T.; Naparstek, S.; Maron-Katz, A.; Watts, M.; Gordon, J.; Jeong, J.; Astolfi, L.; Shpigel, E.; et al. Identification of psychiatric disorder subtypes from functional connectivity patterns in resting-state electroencephalography. Nat. Biomed. Eng. 2020, 1–15. [Google Scholar] [CrossRef]
- Wu, W.; Zhang, Y.; Jiang, J.; Lucas, M.V.; Fonzo, G.A.; Rolle, C.E.; Cooper, C.; Chin-Fatt, C.; Krepel, N.; Cornelssen, C.A.; et al. An electroencephalographic signature predicts antidepressant response in major depression. Nat. Biotechnol. 2020, 38, 439–447. [Google Scholar] [CrossRef]
- Alexander, G.E.; Crutcher, M.D. Functional architecture of basal ganglia circuits: Neural substrates of parallel processing. Trends Neurosci. 1990, 13, 266–271. [Google Scholar] [CrossRef]
- Fryer, G. Somatic dysfunction: An osteopathic conundrum. Int. J. Osteopath. Med. 2016, 22, 52–63. [Google Scholar] [CrossRef]
- Taylor, H.H.; Murphy, B. The effects of spinal manipulation on central integration of dual somatosensory input observed after motor training: A crossover study. J. Manip. Physiol. Ther. 2010, 33, 261–272. [Google Scholar] [CrossRef]
- Taylor, H.H.; Murphy, B.A. Altered cortical integration of dual somatosensory input following the cessation of a 20 min period of repetitive muscle activity. Exp. Brain Res. 2007, 178, 488–498. [Google Scholar] [CrossRef] [PubMed]
- Alexander, G.E.; Crutcher, M.D.; DeLong, M.R. Basal ganglia-thalamocortical circuits: Parallel substrates for motor, oculomotor, “prefrontal” and “limbic” functions. Prog. Brain Res. 1990, 85, 119–146. [Google Scholar] [PubMed]
- Sinha, R.; Lacadie, C.; Skudlarski, P.; Fulbright, R.K.; Rounsaville, B.J.; Kosten, T.R.; Wexler, B.E. Neural activity associated with stress-induced cocaine craving: A functional magnetic resonance imaging study. Psychopharmacology 2005, 183, 171–180. [Google Scholar] [CrossRef] [PubMed]


| Osteopathic Manipulative Treatment Group (OMTg) (n = 15) | Placebo Group (Pg) (n = 15) | t, χ2 | |
|---|---|---|---|
| Age (years) a | 28.0 ± 5.5 | 25.4 ± 3.2 | ct(28) = −1.6, p = 0.1 95% CI = −6.0, 0.8 |
| Gender (M/F) b | 8/7 | 4/11 | d χ(1) = 2.2, p = 0.3 |
| Education (years) a | 16.0 ± 1.5 | 16.1 ± 0.4 | ct(28) = 0.2, p = 0.9 95% CI = −0.8, 0.9 |
| Body Mass Index a | 20.9 ± 6.1 | 21.0 ± 6.6 | ct(28) −0.8, p = 0.9 95% CI = −4.6, 4.9 |
| Dysfunctions Localization | % |
|---|---|
| M99.01 Cervical | 28.1 |
| M99.0 Head | 26.9 |
| M99.09 Abdomen and other regions | 22.4 |
| M99.05 Pelvic | 6.4 |
| M99.02 Thoracic | 6.2 |
| M99.03 Lumbar | 3.6 |
| M99.08 Rib cage | 2.5 |
| M99.04 Sacral | 1.3 |
| M99.06 Lower extremity | 1.3 |
| M99.07 Upper extremity | 1.3 |
Publisher’s Note: MDPI stays neutral with regard to jurisdictional claims in published maps and institutional affiliations. |
© 2020 by the authors. Licensee MDPI, Basel, Switzerland. This article is an open access article distributed under the terms and conditions of the Creative Commons Attribution (CC BY) license (http://creativecommons.org/licenses/by/4.0/).
Share and Cite
Tramontano, M.; Cerritelli, F.; Piras, F.; Spanò, B.; Tamburella, F.; Piras, F.; Caltagirone, C.; Gili, T. Brain Connectivity Changes after Osteopathic Manipulative Treatment: A Randomized Manual Placebo-Controlled Trial. Brain Sci. 2020, 10, 969. https://0-doi-org.brum.beds.ac.uk/10.3390/brainsci10120969
Tramontano M, Cerritelli F, Piras F, Spanò B, Tamburella F, Piras F, Caltagirone C, Gili T. Brain Connectivity Changes after Osteopathic Manipulative Treatment: A Randomized Manual Placebo-Controlled Trial. Brain Sciences. 2020; 10(12):969. https://0-doi-org.brum.beds.ac.uk/10.3390/brainsci10120969
Chicago/Turabian StyleTramontano, Marco, Francesco Cerritelli, Federica Piras, Barbara Spanò, Federica Tamburella, Fabrizio Piras, Carlo Caltagirone, and Tommaso Gili. 2020. "Brain Connectivity Changes after Osteopathic Manipulative Treatment: A Randomized Manual Placebo-Controlled Trial" Brain Sciences 10, no. 12: 969. https://0-doi-org.brum.beds.ac.uk/10.3390/brainsci10120969