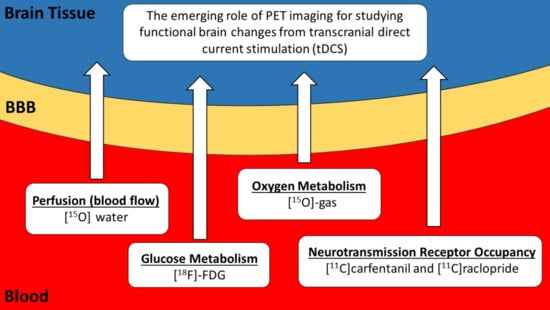
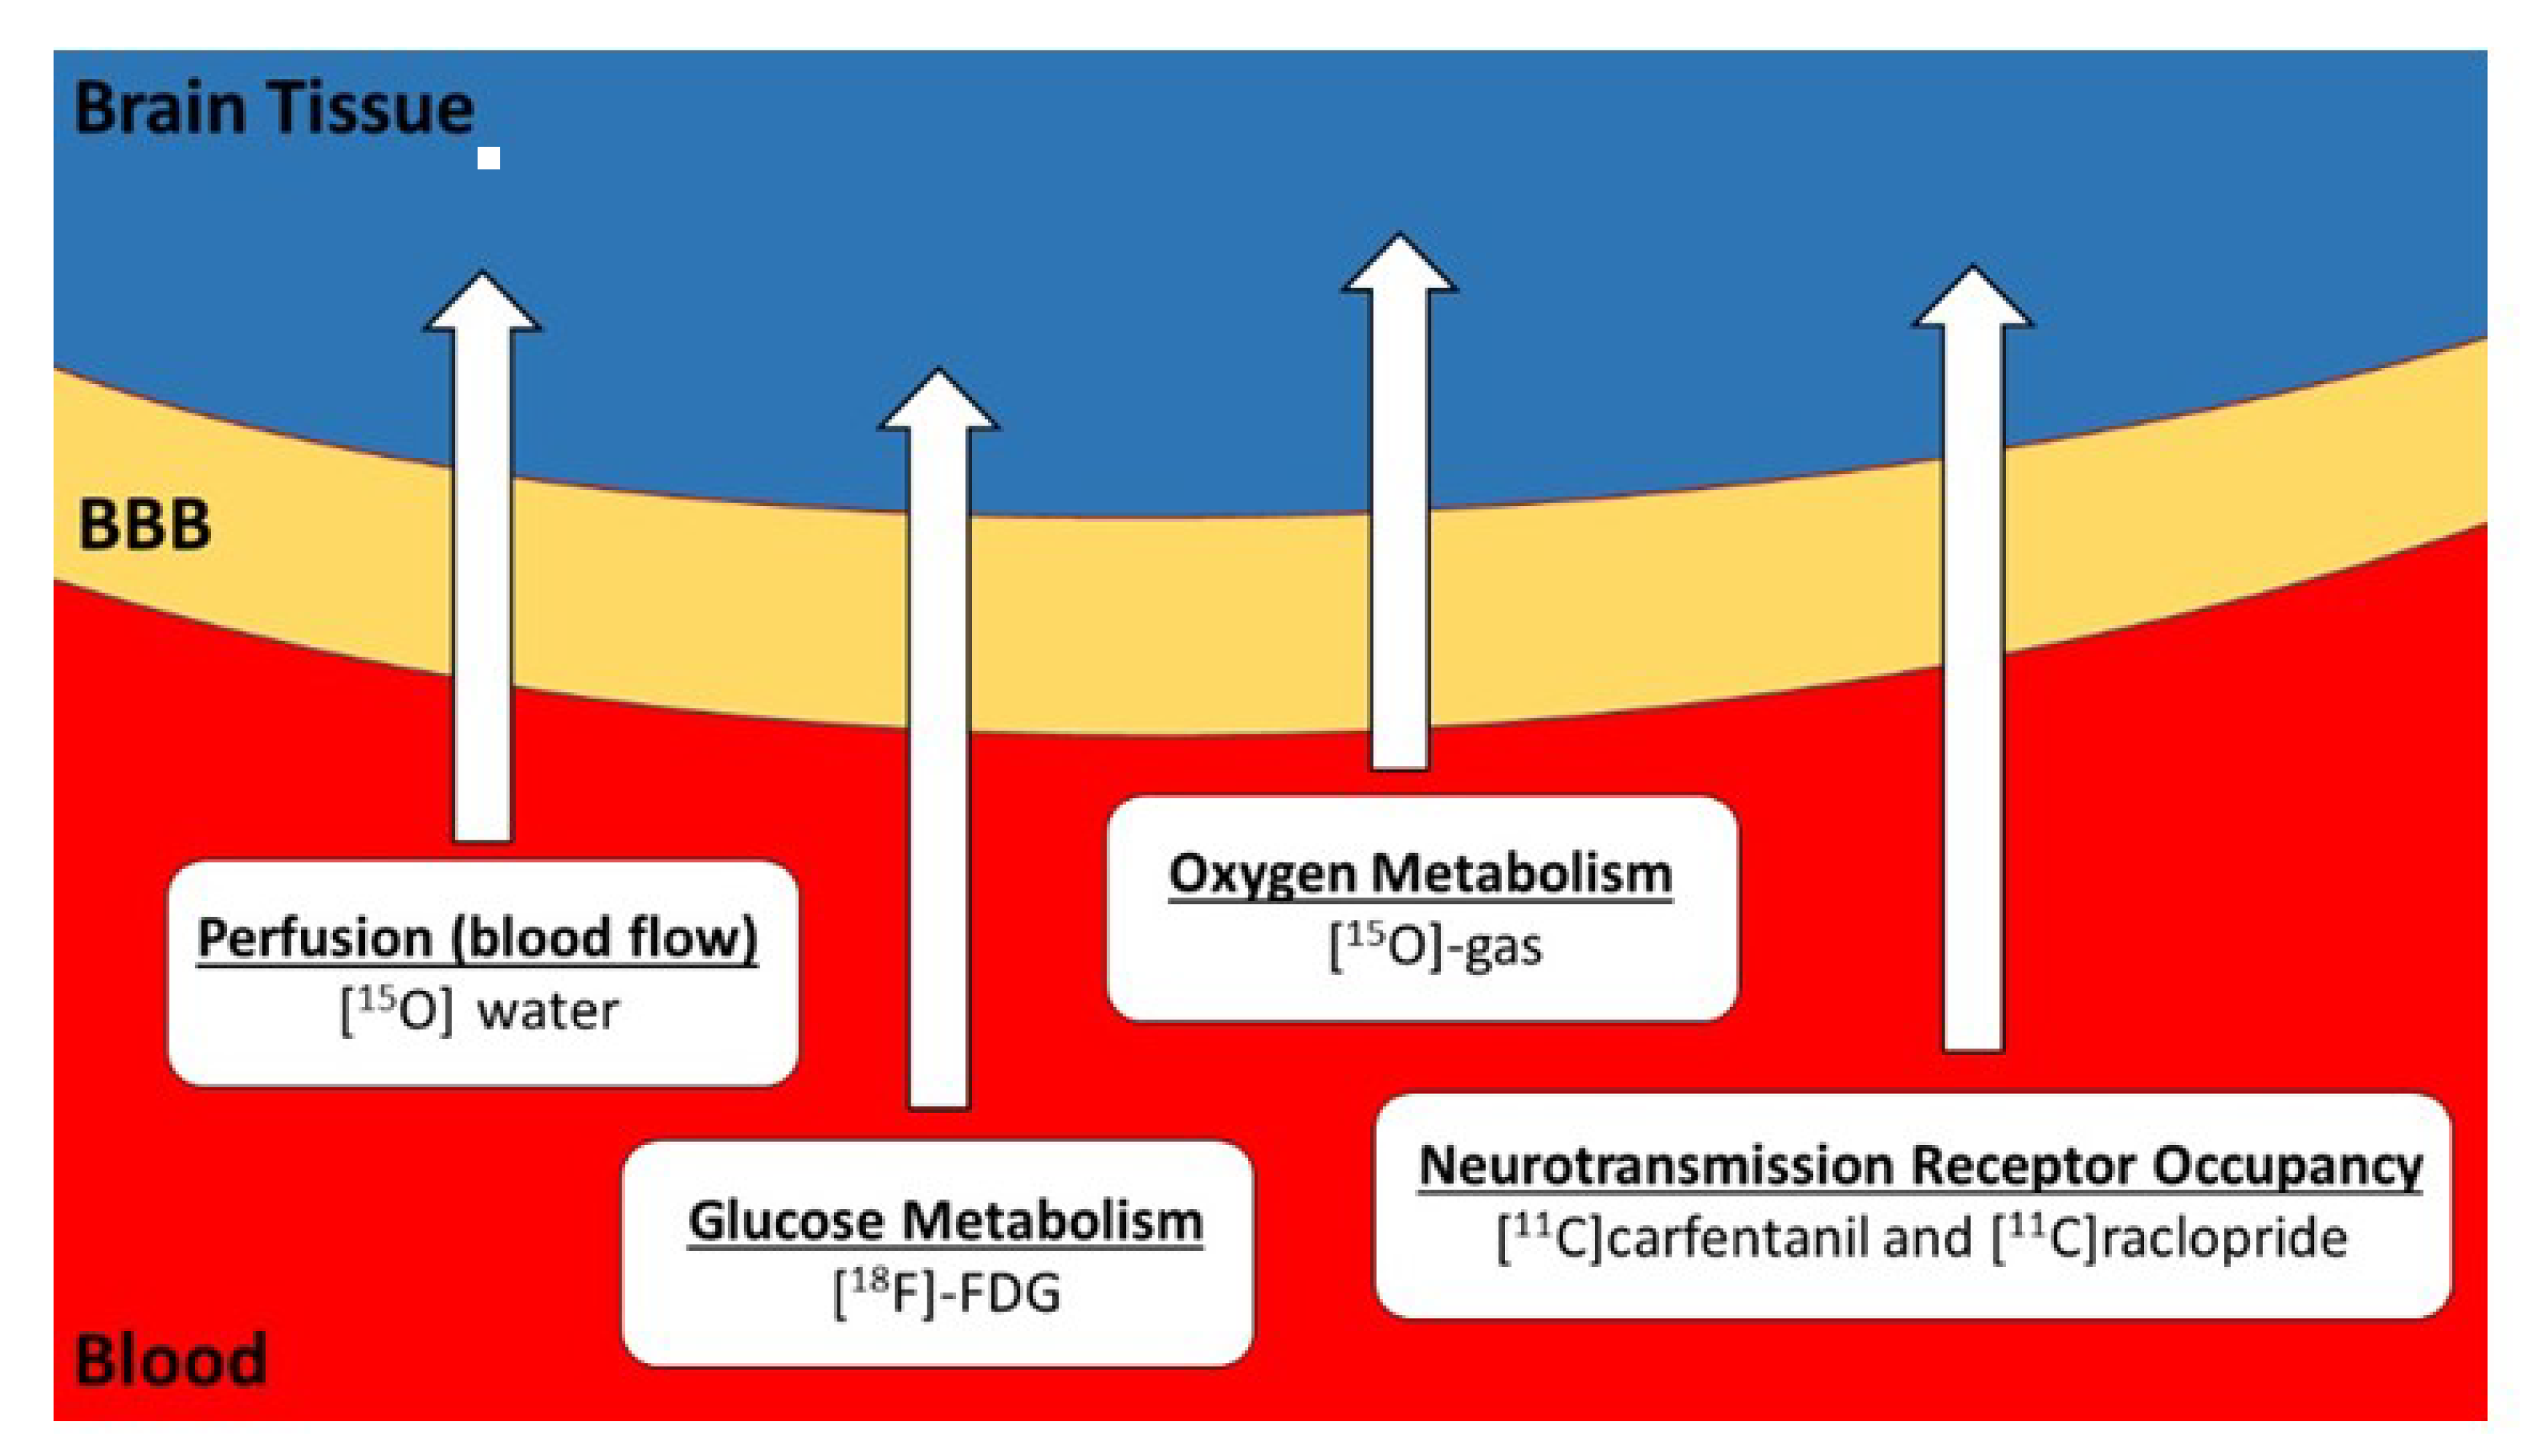
Imaging Transcranial Direct Current Stimulation (tDCS) with Positron Emission Tomography (PET)


Abstract
:
1. Introduction
tDCS Models and Simulations
2. Measurements of Glucose Metabolism in tDCS Applications
How tDCS Studies can Benefit from FDG-PET
3. Measurements of Cerebral Blood Flow in tDCS Applications
How tDCS Studies can Benefit from [15O]Water PET
4. [11C]Carfentanil and [11C]Raclopride PET
How tDCS Studies can Benefit from [11C]Carfentanil and [11C]Raclopride PET
5. Discussion and Conclusions
Funding
Conflicts of Interest
References
- Sanchez-Kuhn, A.; Perez-Fernandez, C.; Canovas, R.; Flores, P.; Sanchez-Santed, F. Transcranial direct current stimulation as a motor neurorehabilitation tool: An empirical review. Biomed. Eng. Online 2017, 16, 76. [Google Scholar] [CrossRef] [Green Version]
- Stagg, C.J.; Antal, A.; Nitsche, M.A. Physiology of transcranial direct current stimulation. J. ECT 2018, 34, 144–152. [Google Scholar] [CrossRef]
- Buch, E.R.; Santamecchi, E.; Antal, A.; Born, J.; Celnik, P.A.; Classen, J.; Gerloffi, C.; Hallett, M.; Hummeli, F.C.; Nitschek, M.A.; et al. Effects of tDCS on motor learning and memory formation: A consensus and critical position paper. Clin. Neurophysiol. 2017, 128, 589–603. [Google Scholar] [CrossRef] [Green Version]
- Shin, Y.I.; Foerster, M.A.; Nitsche, M.A. Transcranial direct current stimulation—Application in neuropsychology. Neuropsychologia 2015, 69, 154–175. [Google Scholar] [CrossRef]
- Nitsche, M.A.; Paulus, W. Excitability changes induced in the human motor cortex by weak transcranial direct current stimulation. J. Physiol. 2000, 527, 633–639. [Google Scholar] [CrossRef]
- Filmer, H.L.; Mattingley, J.B.; Dux, P.E. Modulating brain activity and behaviour with tDCS: Rumours of its death have been greatly exaggerated. Cortex 2020, 123, 141–151. [Google Scholar] [CrossRef]
- Hallett, M. Transcranial magnetic stimulation and the human brain. Nature 2000, 406, 147–150. [Google Scholar] [CrossRef] [PubMed]
- Horvath, J.C.; Forte, J.D.; Carter, O. Evidence that transcranial direct current stimulation (tDCS) generates little to no reliable neurophysiologic effect beyond MEP amplitude modulation in healthy human subjects: A systematic review. Neuropsychologia 2015, 66, 213–236. [Google Scholar] [CrossRef] [PubMed]
- Antal, A.; Keeser, D.; Priori, A.; Padberg, F.; Nitsche, M. Conceptual and procedural shortcomings of the systematic review “Evidence that transcranial direct current stimulation (tDCS) generates little-to-no reliable neurophysiologic effect beyond MEP amplitude modulation in healthy human subjects: A systematic review” by Horvath and Co-workers. Brain Stimul. 2015, 8, 846–849. [Google Scholar] [PubMed]
- Vöröslakos, M.; Takeuchi, Y.; Brinyiczki, K.; Zombori, T.; Oliva, A.; Fernández-Ruiz, A.; Kozák, G.; Kincses, Z.T.; Iványi, B.; Buzsáki, G.; et al. Direct effects of transcranial electric stimulation on brain circuits in rats and humans. Nat. Commun. 2018, 9, 483. [Google Scholar] [CrossRef] [PubMed] [Green Version]
- Chhatbar, P.Y.; Kautz, S.A.; Takacs, I.; Rowland, N.C.; Revuelta, G.J.; George, M.S.; Bikson, M.; Feng, W. Evidence of transcranial direct current stimulation-generated electric fields at subthalamic level in human brain in vivo. Brain Stimul. 2018, 11, 727–733. [Google Scholar] [CrossRef] [PubMed]
- Schmidt, C.; Wagner, S.; Burger, M.; Rienen, U.V.; Wolters, C.H. Impact of uncertain head tissue conductivity in the optimization of transcranial direct current stimulation for an auditory target. J. Neural Eng. 2015, 12, 046028. [Google Scholar] [CrossRef] [PubMed]
- Laakso, I.; Tanaka, S.; Koyama, S.; De Santis, V.; Hirata, A. Inter-subject variability in electric fields of motor cortical tDCS. Brain Stimul. 2015, 8, 906–913. [Google Scholar] [CrossRef] [PubMed]
- Saturnino, G.B.; Antunes, A.; Thielscher, A. On the importance of electrode parameters for shaping electric field patterns generated by tDCS. Neuroimage 2015, 120, 25–35. [Google Scholar] [CrossRef]
- Laakso, I.; Tanaka, S.; Mikkonen, M.; Koyama, S.; Sadato, N.; Hirata, A. Electric fields of motor and frontal tDCS in a standard brain space: A computer simulation study. Neuroimage 2016, 137, 140–151. [Google Scholar] [CrossRef]
- Pilitsis, J.G.; Chu, Y.; Kordower, J.; Bergen, D.C.; Cochran, E.J.; Bakay, R.A.E. Postmortem study of deep brain stimulation of the anterior thalamus: Case report. Neurosurgery 2008, 62, 530–532. [Google Scholar] [CrossRef]
- Reddy, G.D.; Lozano, A.M. Postmortem studies of deep brain stimulation for Parkinson’s disease: A systematic review of the literature. Cell Tissue Res. 2018, 373, 287–295. [Google Scholar] [CrossRef]
- Boecker, H.; Drzezga, A. A perspective on the future role of brain pet imaging in exercise science. Neuroimage 2015, 131, 73–80. [Google Scholar] [CrossRef]
- Ginsberg, M.D.; Chang, J.Y.; Kelly, R.E.; Yoshii, F.; Barker, W.W.; Ingenito, G.; Botthe, T.E. Increases in both cerebral glucose utilization and blood flow during execution of a somatosensory task. Ann. Neurol. 1988, 23, 9. [Google Scholar] [CrossRef]
- Niccolini, F.; Su, P.; Politis, M. PET in multiple sclerosis. Clin. Nucl. Med. 2015, 40, 46–52. [Google Scholar] [CrossRef]
- Kennedy, C.; Des Rosiers, M.H.; Jehle, J.W.; Reivich, M.; Sharpe, F.; Sokoloff, L. Mapping of functional neural pathways by autoradiographic survey of local metabolic rate with (14C) deoxyglucose. Science 1975, 187, 850–853. [Google Scholar] [CrossRef] [PubMed] [Green Version]
- Tashiro, M.; Itoh, M.; Fujimoto, T.; Fujiwara, T.; Ota, H.; Kubota, K.; Okamura, N.; Ishii, K.; Bereczki, D.; Sasaki, H. 18F-FDG PET mapping of regional brain activity in runners. J. Sports Med. Phys. Fitness 2001, 41, 7. [Google Scholar]
- Jeong, M.; Tashiro, M.; Singh, L.N.; Yamaguchi, K.; Horikawa, E.; Miyake, M.; Watanuki, S.; Iwata, R.; Fukuda, H.; Takahashi, Y.; et al. Functional brain mapping of actual car-driving using [18F] FDG-PET. Ann. Nucl. Med. 2006, 20, 6. [Google Scholar] [CrossRef] [PubMed]
- La Fougere, C.; Zwergal, A.; Rominger, A.; Forster, S.; Fesl, G.; Dieterich, M.; Brandt, T.; Strupp, M.; Bartenstein, P.; Jahn, K. Real versus imagined locomotion: A [18F]-FDGPET-fMRI comparison. Neuroimage 2010, 50, 1589–1598. [Google Scholar] [CrossRef]
- Rudroff, T.; Proessl, F.; Kamholz, J.; Ponto, L.L. Increased thalamic activity and less neuropathic pain after tDCS observed with PET in a patient with multiple sclerosis: A case report. Brain Stimul. 2019, 12, 1981–1999. [Google Scholar] [CrossRef]
- Yoon, E.J.; Kim, Y.K.; Kim, H.R.; Kim, S.E.; Lee, Y.; Shin, K.I. Transcranial direct current stimulation to lessen neuropathic pain after spinal cord injury: A mechanistic PET study. Neurorehabil. Neural Repair 2014, 28, 250–259. [Google Scholar] [CrossRef]
- Im, I.I.; Jeong, H.; Bikson, M.; Woods, A.J.; Unal, G.; Oh, J.K.; Na, S.; Park, J.-S.; Knotkova, H.; Song, I.-U.; et al. Effects of 6-month at-home transcranial direct current stimulation on cognition and cerebral glucose metabolism in Alzheimer’s disease. Brain Stimul. 2019, 12, 1222–1228. [Google Scholar] [CrossRef]
- Kraus, C.; Hahn, A.; Sigurdardottir, H.; Spurny, B.; Wadsak, W.; Mitterhauser, M.; Hacker, M.; Kasper, S.; Lanzenberger, R. Brain glucose uptake during transcranial direct current stimulation measured with functional [18F]FDG-PET. Brain Imaging Behav. 2019, 645, 1–8. [Google Scholar] [CrossRef] [Green Version]
- Lee, S.H.; Im, J.J.; Oh, J.K.; Choi, E.K.; Yoon, S.; Bikson, M.; Song, I.-H.; Jeong, H.; Chung, Y.-A. Transcranial direct current stimulation for Online gamers. JoVe 2019, 153, e60007. [Google Scholar] [CrossRef]
- Leroy, A.; Beigne, M.; Petyt, G.; Derambure, P.; Vaiva, G.; Amad, A. Psychogenic non-epileptic seizures treated with guided transcranial direct current stimulation: A case report. Brain Stimul. 2019, 12, 794–796. [Google Scholar] [CrossRef]
- Thibaut, A.; Di Perri, C.; Chatelle, C.; Bruno, M.A.; Bahri, M.A.; Wanneza, S.; Piarulli, A.; Bernard, C.; Martial, C.; Heine, L.; et al. Clinical response to tDCS depends on residual brain metabolism and grey matter integrity in patients with minimally conscious state. Brain Stimul. 2015, 8, 1116–1123. [Google Scholar] [CrossRef] [PubMed]
- Zhang, Y.; Lu, J.; Du, J.; Huo, S.; Li, R.; Song, W. Neural correlates of different behavioral response to transcranial direct current stimulation between patients in the unresponsive wakefulness syndrome and minimally conscious state. Neurol. Sci. 2020, 41, 75–82. [Google Scholar] [CrossRef] [PubMed]
- Kindred, J.H.; Koo, P.J.; Rudroff, T. Glucose uptake of the spinal cord in patients with multiple sclerosis detected by ¹⁸F-fluorodeoxyglucose PET/CT after walking. Spinal Cord. 2014, 52, 11–13. [Google Scholar] [CrossRef] [PubMed] [Green Version]
- Rudroff, T.; Kindred, J.H.; Kalliokoski, K.K. [18F]-FDG positron emission tomography—An established clinical tool opening a new window into exercise physiology. J. Appl. Physiol. 2015, 118, 181–190. [Google Scholar] [CrossRef] [PubMed]
- Rudroff, T.; Ketelhut, N.B.; Kindred, J.H. Metabolic imaging in exercise physiology. J. Appl. Physiol. 2018, 124, 497–503. [Google Scholar] [CrossRef] [PubMed] [Green Version]
- Raichle, M.E.; Martin, W.R.W.; Herscovitch, P.; Mintun, M.A.; Markham, J. Brain blood flow measured with intravenous H215O: II. implementation and validation. J. Nucl. Med. 1983, 24, 790–798. [Google Scholar]
- Herscovitch, P.; Markham, J.; Raichle, M. Brain blood flow measured with intravenous H215O. I. theory and error analysis. J. Nucl. Med. 1983, 24, 782–789. [Google Scholar]
- Powers, W.J.; Clarke, W.R.; Grubb, R.L.; Videen, T.O.; Adams, H.P.; Derdeyn, C.P. Extracranial-intracranial bypass surgery for stroke prevention in hemodynamic cerebral ischemia: The carotid occlusion surgery study randomized trial. JAMA 2011, 306, 1983–1992. [Google Scholar] [CrossRef] [Green Version]
- Puig, O.; Henriksen, O.M.; Vestergaard, M.B.; Hansen, A.E.; Andersen, F.L.; Ladefoged, C.N.; Rostrup, E.; Larsson, H.B.W.; Lindberg, U.; Law, I. Comparison of simultaneous arterial spin labeling MRI and H215O PET measurements of regional cerebral blood flow in rest and altered perfusion states. J. Cereb. Blood Flow Metab. 2019. [Google Scholar] [CrossRef] [Green Version]
- Fan, A.P.; Guo, J.; Khalighi, M.M.; Gulaka, P.K.; Shen, B.; Park, J.H.; Gandhi, H.; Holley, D.; Rutledge, O.; Singh, P.; et al. Long-delay arterial spin labeling provides more accurate cerebral blood flow measurements in moyamoya patients. A simultaneous positron emission tomography/MRI study. Stroke 2017, 48, 2441–2449. [Google Scholar] [CrossRef]
- Fan, A.P.; Jahanian, H.; Holdsworth, S.J.; Zaharchuk, G. Comparison of cerebral blood flow measurement with [15O]-water positron emission tomography and arterial spin labeling magnetic resonance imaging: A systematic review. J. Cereb. Blood Flow Metab. 2016, 36, 842–861. [Google Scholar] [CrossRef] [Green Version]
- Fan, A.P.; Khalighi, M.M.; Guo, J.; Ishii, Y.; Rosenberg, J.; Wardak, M.; Park, J.H.; Shen, B.; Holley, D.; Gandhi, H.; et al. Identifying hypoperfusion in moyamoya disease with arterial spin labeling and an 15O water positron emission tomography/magnetic resonance imaging normative database. Stroke 2019, 50, 373–380. [Google Scholar] [CrossRef] [PubMed] [Green Version]
- Andersen, J.B.; Lindberg, U.; Olesen, O.V.; Benoit, D.; Ladefoged, C.N.; Larsson, H.B.W.; Højgaard, L.; Greisen, G.; Law, I. Hybrid PET/MRI imaging in healthy unsedated newborn infants with quantitative rCBF measurements using 15O-water PET. J. Cereb. Blood Flow Metab. 2018, 39, 782–793. [Google Scholar] [CrossRef] [PubMed] [Green Version]
- Guo, J.; Gong, E.; Fan, A.P.; Goubran, M.; Khalighi, M.M.; Zaharchuk, G. Predicting 15O-water PET cerebral blood flow maps from multi-contrast MRI using a deep convolutional neural network with evaluation of training cohort bias. J. Cereb. Blood Flow Metab. 2019. [Google Scholar] [CrossRef] [PubMed]
- Giovannella, M.; Andresen, B.; Andersen, J.B.; El-Mahdaoui, S.; Contini, D.; Spinelli, L.; Torricelli, A.; Greisen, G.; Durduran, T.; Weigel, U.M.; et al. Validation of diffuse correlation spectroscopy against 15O-water PET for regional cerebral blood flow measurement in neonatal piglets. J. Cereb. Blood Flow Metab. 2019. [Google Scholar] [CrossRef]
- Lang, N.; Siebner, H.R.; Ward, N.S.; Lee, L.; Nitsche, M.A.; Paulus, W.; Rothwell, J.C.; Lemon, R.N.; Frackowiak, R.S. How does transcranial DC stimulation of the primary motor cortex alter regional neuronal activity in the human brain? Eur J. Neurosci. 2005, 22, 495–504. [Google Scholar] [CrossRef]
- Pacquette, C.; Sidel, M.; Radinska, B.A.; Soucy, J.P.; Thiel, A. Bilateral transcranial direct current stimulation modulates activation-induced regional blood flow changes during voluntary movement. J. Cereb. Blood Flow Metab. 2011, 31, 2086–2095. [Google Scholar] [CrossRef] [Green Version]
- Workman, C.D.; Ponto, L.L.B.; Kamholz, J.; Rudroff, T. No immediate effects of transcranial direct current stimulation at various intensities on cerebral blood flow in people with multiple sclerosis. Brain Sci. 2020, 10, 82. [Google Scholar] [CrossRef] [Green Version]
- Iadecola, C. Neurovascular regulation in the normal brain and in Alzheimer’s disease. Nat. Rev. Neurosci. 2004, 5, 347–360. [Google Scholar] [CrossRef]
- Wan, X.; Riera, J.; Iwata, K.; Takahashi, M.; Wakabayashi, T.; Kawashima, R. The neural basis of the hemodynamic response nonlinearity in human primary visual cortex: Implications for neurovascular coupling mechanism. NeuroImage 2006, 32, 616–625. [Google Scholar] [CrossRef]
- Antal, A.; Bikson, M.; Datta, A.; Lafon, B.; Dechent, P.; Parra, L.C.; Paulus, W. Imaging artifacts induced by electrical stimulation during conventional fMRI of the brain. Neuroimage 2014, 85, 1040–1047. [Google Scholar] [CrossRef] [PubMed] [Green Version]
- Dos Santos, M.F.; Martikainen, I.K.; Nascimento, T.D.; Love, T.M.; DeBoer, M.D.; Schambra, H.M.; Bikson, M.; Zubieta, J.-K.; DaSilva, A.F. Building up analgesia in humans via the endogenous μ-opioid system by combining placebo and active tDCS: A preliminary report. PLoS ONE 2014, 9, e102350. [Google Scholar]
- Dos Santos, M.F.; Love, T.M.; Martikainen, I.K.; Nascimento, T.D.; Fregini, F.; Cummiford, C.; Deboer, M.D.; Zubieta, J.-K.; DaSilva, A.F.M. Immediate effects of tDCS on the m-opioid system of a chronic pain patient. Front. Psychiatry 2012. [Google Scholar] [CrossRef] [PubMed] [Green Version]
- Lindquist, K.A.; Wager, T.D.; Kober, H.; Bliss-Moreau, E.; Barrett, L.F. The brain basis of emotion: A meta-analytic review. Behav. Brain Sci. 2012, 35, 121–143. [Google Scholar] [CrossRef] [PubMed] [Green Version]
- Bromberg-Martin, E.S.; Matsumoto, M.; Hikosaka, O. Dopamine in motivational control: Rewarding, aversive, and alerting. Neuron 2010, 68, 815–834. [Google Scholar] [CrossRef] [PubMed] [Green Version]
- Cools, R. Dopaminergic control of the striatum for high-level cognition. Curr. Opin. Neurobiol. 2011, 21, 402–407. [Google Scholar] [CrossRef] [PubMed]
- Fonteneau, C.; Redoute, J.; Haesebaert, F.; Le Bars, D.; Costes, N.; Suaud-Chagny, M.-F.; Brunelin, J. Frontal transcranial direct current stimulation induces dopamine release in the ventral striatum in human. Cereb. Cortex 2016, 28, 2636–2646. [Google Scholar] [CrossRef]
- Fukai, M.; Bunai, T.; Hirosawa, T.; Kikuchi, M.; Ito, S.; Minabe, Y.; Oushi, Y. Endogenous dopamine release under transcranial direct-current stimulation governs enhanced attention: A study with positron emission tomography. Transl. Psychiatry 2019, 9, 115. [Google Scholar] [CrossRef]
- Pillon, B.; Czernecki, V.; Dubois, B. Dopamine and cognitive function. Curr. Opin. Neurol. 2003, 16, S17–S22. [Google Scholar] [CrossRef]
- Hakyemez, H.S.; Dagher, A.; Smith, S.D.; Zald, D.H. Striatal dopamine transmission in healthy humans during a passive monetary reward task. NeuroImage 2008, 39, 2058–2065. [Google Scholar] [CrossRef]
- Mukherjee, J.; Yang, Z.Y.; Brown, T.; Lew, R.; Wernick, M.; Ouyang, X.H.; Yasillo, N.; Chen, C.T.; Mintzer, R.; Cooper, M. Preliminary assessment of extrastriatal dopamine D-2 receptor binding in the rodent and nonhuman primate brains using the high affinity radioligand, F-18-fallypride. Nucl. Med. Biol. 1999, 26, 519–527. [Google Scholar] [CrossRef]
- Mukherjee, J.; Yang, Z.Y.; Brown, T.; Roemer, J.; Cooper, M. 18 F-desmethoxyfallypride: A fluorine-18 labeled radiotracer with properties similar to carbon-11 raclopride for PET imaging studies of dopamine D2 receptors. Life Sci. 1996, 59, 669–678. [Google Scholar] [CrossRef]
- Delforge, J.; Bottlaender, M.; Loc’h, C.; Guenther, I.; Fuseau, C.; Bendriem, B.; Syrota, A.; Maziere, B. Quantitation of extrastriatal D2 receptors using a very high affinity ligand (FLB 457) and the multi-injection approach. J. Cereb. Blood Flow Metab. 1999, 19, 533–546. [Google Scholar] [CrossRef] [PubMed] [Green Version]
- Stagg, C.J. Magnetic resonance spectroscopy as a tool to study the role of GABA in motor-cortical plasticity. Neuroimage 2014, 86, 19–27. [Google Scholar] [CrossRef]
- Fujiyama, H.; Hyde, J.; Hinder, M.R.; Kim, S.-J.; McCormack, G.H.; Vickers, J.C.; Summers, J.J. Delayed plastic responses to anodal tDCS in older adults. Front. Aging Neurosci. 2014, 6, 115. [Google Scholar] [CrossRef]
- Schulte-Geers, C.; Obert, M.; Schilling, R.L.; Harth, S.; Traupe, H.; Gizewski, E.R.; Verhoff, M.A. Age and gender-dependent bone density changes of the human skull disclosed by high-resolution flat-panel computed tomography. Int J. Legal. Med. 2011, 125, 417–425. [Google Scholar] [CrossRef]
- Russell, M.J.; Goodman, T.A.; Visse, J.M.; Beckett, L.; Saito, N.; Lyeth, B.G.; Recanzone, G.H. Sex and electrode configuration in transcranial electrical stimulation. Front. Psychiatry 2017, 8, 147. [Google Scholar] [CrossRef] [Green Version]
- Kuo, M.F.; Paulus, W.; Nitsche, M.A. Sex Differences in cortical neuroplasticity in humans. Neuroreport 2006, 17, 1703–1707. [Google Scholar] [CrossRef]
- De Tommaso, M.; Invitto, S.; Ricci, K.; Lucchese, V.; Delussia, M.; Quattromini, P.; Bettocchi, P.; Pinto, V.; Lancionia, G.; Livrea, P.; et al. Effects of anodal TDCS stimulation of left parietal cortex on visual spatial attention tasks in men and women across menstrual cycle. Neurosci. Lett. 2014, 574, 21–25. [Google Scholar] [CrossRef]
- Inghilleri, M.; Conte, A.; Curra, A.; Frasca, V.; Lorenzano, C.; Berardelli, A. Ovarian hormones and cortical excitability. An rTMS study in humans. Clin. Neurophysiol. 2004, 115, 1063–1068. [Google Scholar] [CrossRef]
- Schade, S.; Moliadze, V.; Paulus, W.; Antal, A. Modulating neuronal excitability in the motor cortex with tDCS shows moderate hemispheric asymmetry due to subjects’ handedness: A pilot study. Restor. Neurol. Neurosci. 2012, 30, 191–198. [Google Scholar] [CrossRef] [PubMed]
- Furuya, S.; Klaus, M.; Nitsche, M.A.; Paulus, W.; Altenmüller, E. Ceiling effects prevent further improvement of transcranial stimulation in skilled musicians. J. Neurosci. 2014, 34, 13834–13839. [Google Scholar] [CrossRef] [PubMed]
- Brunoni, A.R.; Ferrucci, R.; Bortolomasi, M.; Scelzo, E.; Boggio, P.S.; Fregni, F.; Dell’Osso, B.; Giacopuzzi, M.; Altamura, A.C.; Priori, A. Interactions between transcranial direct current stimulation (tDCS) and pharmacological interventions in the major depressive episode: Findings from a naturalistic study. Eur. Psychiatry 2013, 28, 356–361. [Google Scholar] [CrossRef] [PubMed]
- Boggio, P.S.; Zaghi, S.; Villani, A.B.; Fecteau, S.; Pascual-Leone, A.; Fregni, F. Modulation of risk-taking in marijuana users by transcranial direct current stimulation (tDCS) of the dorsolateral prefrontal cortex (DLPFC). Drug Alcohol Depend. 2010, 112, 220–225. [Google Scholar] [CrossRef] [PubMed]
- Nitsche, M.A.; Kuo, M.F.; Karrasch, R.; Wächter, B.; Liebetanz, D.; Paulus, W. Serotonin affects transcranial direct current-induced neuroplasticity in humans. Biol. Psychiatry 2009, 66, 503–508. [Google Scholar] [CrossRef] [PubMed]
- Alonzo, A.; Brassil, J.; Taylor, J.L.; Martin, D.; Loo, C.K. Daily transcranial direct current stimulation (tDCS) leads to greater increases in cortical excitability than second daily transcranial direct current stimulation. Brain Stimul. 2012, 5, 208–213. [Google Scholar] [CrossRef]
- Russell, M.; Goodman, T.; Wang, Q.; Groshong, B.; Lyeth, B.G. Gender differences in current received during transcranial electrical stimulation. Front. Psychiatry 2014, 5, 104. [Google Scholar] [CrossRef] [Green Version]


| Study | Design | Subjects | Intervention | Main Findings |
|---|---|---|---|---|
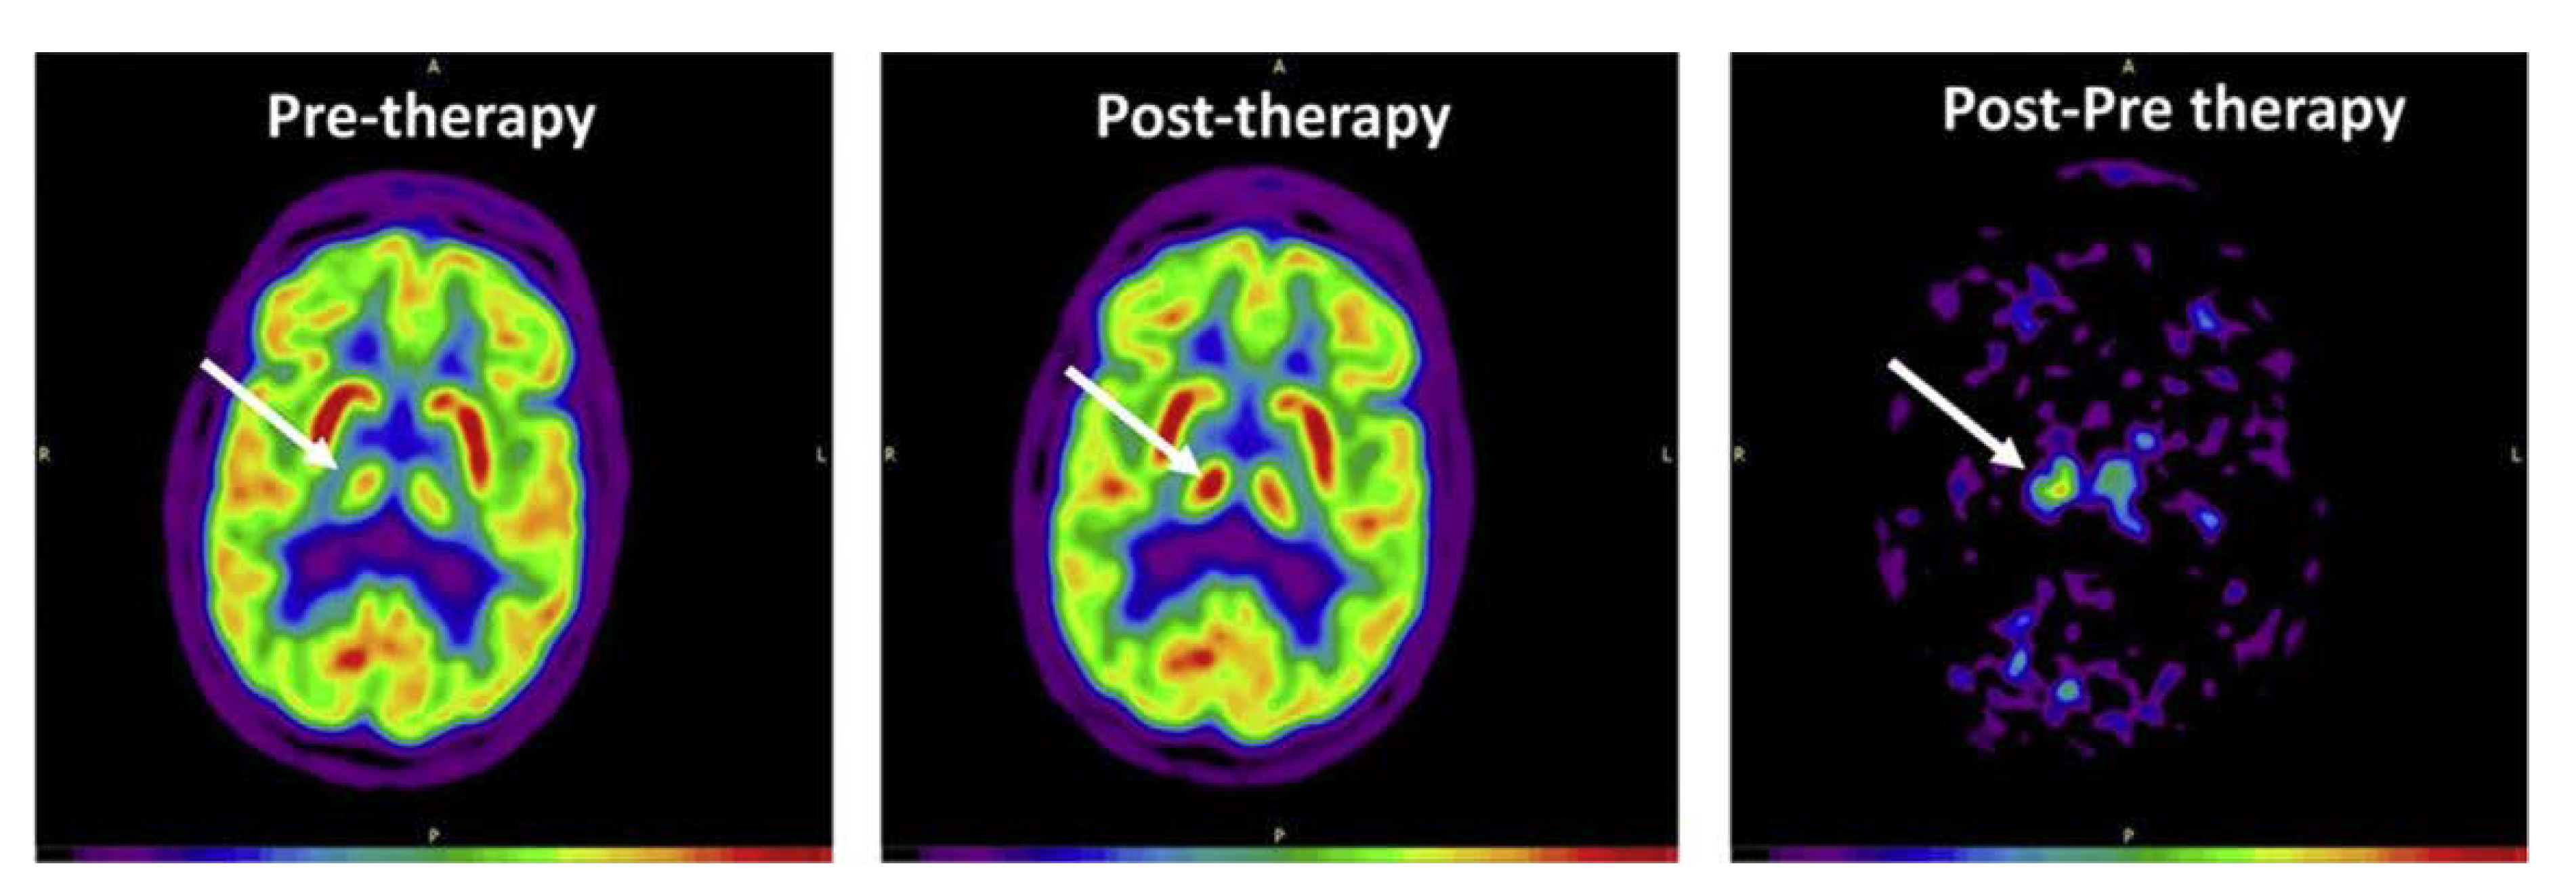
| Rudroff et al. 2019 [25] | 5-day intervention, case study | 52-year-old man with multiple sclerosis-related neuropathic pain | Anode: left M1, Cathode: right supraorbital area 2 mA, 20 min | Pain scores improved after 5 sessions of tDCS. tDCS may induce functional changes in interconnected brain structures such as the thalamus. |
| Yoon et al. 2014 [26] | 2 times/day for 10 days, double-blind | Patients with neuropathic pain, N = 16 | Anode: left M1, Cathode: right supraorbital area, 2 mA or sham, 20 min | Significant decrease in the numeric rating scale scores for pain after tDCS. Increased metabolism in the medulla and decreased metabolism in the left DLPFC after active tDCS treatment. |
| Im et al. 2019 [27] | 1 time/day for 6 months | Patients with early Alzheimer’s disease N = 18, sham = 7, tDCS = 11 | Anode: left, DLPFC, Cathode: right DLPFC, 2 mA, 30 min | tDCS improved global cognition. rCMRglc in the left middle/inferior temporal gyrus was preserved in the active group, but was decreased in the sham group. |
| Kraus et al. 2019 [28] | Acute effects, sham-controlled, randomized, single-blind, crossover trail | Healthy subjects N = 15 | Anode: left DLPFC, Cathode: right DLPFC, 0.5 mA, 1 mA, 2 mA, 10 min at each intensity | tDCS did not yield significant changes in glucose consumption at any tested stimulation intensity in this paradigm. |
| Lee et al. 2019 [29] | 3 times/week for 4 weeks | Healthy subjects Online gamers, N = 15 Non-gamers, N = 10 | Anode: left DLPFC, Cathode: right DLPFC, 2 mA, 30 min | tDCS sessions lowered the IAT score and weekly hours spent playing games, and improved BSCS scores. The abnormal asymmetry of rCMRglu in the DLPFC, where the right side was greater than the left side, was improved after the tDCS sessions in the gamer group. |
| Leroy et al. 2019 [30] | 5 days/week, 2 times/day, for 3 weeks, case study | 39-year-old woman with PNES | Anode: left DLPFC, Cathode: right DLPFC, 2 mA, 30 min | Hypometabolism of the anterior associative cortical areas, involving the bilateral dorsolateral prefrontal cortex and to a lesser extent the bilateral orbitofrontal cortex. Improvement in PTSD symptoms, dissociative symptoms, depression, and alexithymia. |
| Thibaut et al. 2015 [31] | Acute affects, sham-controlled, randomized, double-blind, crossover trial | Patients with sub-acute or chronic MCS N = 21 | Anode: left DLPFC, Cathode: right supraorbital area 2 mA, 20 min | Hypometabolism in non-responders as compared with responders in the left DLPFC, the medial-prefrontal cortex, the precuneus, and the thalamus. EEG did not show any difference between the two groups. |
| Zhang et al. 2020 [32] | 20 anodal tDCS sessions over 10 consecutive days (2 daily sessions), sham-controlled, randomized, double-blind | Patients with UWS (N = 13) or MCS (N = 5), and healthy controls (N = 6) | Anode: left DLPFC, Cathode: right DLPFC, 2 mA, 20 min | The residual brain metabolism in the left DLPFC in MCS patients supported that residual brain activity in the stimulated area was necessary for a behavioral response to tDCS. |
| Study | Design | Subjects | Intervention | Main Findings |
|---|---|---|---|---|
| Lang et al. 2005 [46] | Acute effects, sham-controlled, single-blind, crossover design | Healthy subjects N = 16 | Anode: M1, Cathode: right frontopolar cortex, 1 mA, 10 min | Anodal and cathodal tDCS induced widespread increases and decreases in rCBF in cortical and subcortical areas. These changes in rCBF were of the same magnitude as task-related rCBF changes during finger movements and remained stable throughout the 50-min period of PET scanning. |
| Paquette et al. 2011 [47] | Acute effects, sham-controlled, single-blind | Healthy subjects N = 9 | Anode: dominant M1, Cathode: non-dominant M1, 2 mA, 4 min | ΔrCBF of the M1 on the cathodal side was significantly lower than the anodal side M1 from active tDCS compared to sham. The cathodal side decrease in ΔrCBF was also accompanied by depressed MEP amplitudes. |
| Workman et al. 2020 [48] | Acute effects (single session), sham-controlled, single-blind, crossover design | Patients with multiple sclerosis N = 3 | Anode: left DLPFC, Cathode: right supraorbital area, 1 mA, 2 mA, 3 mA, and 4 mA, 5 min each | No immediate changes in rCBF from 5 min of tDCS at 1 mA, 2 mA, 3 mA, and 4 mA. |
| Study | Design | Subjects | Intervention | Main Findings |
|---|---|---|---|---|
| Dos Santos et al. 2012 [53] | Acute effects (single session), sham-controlled, single-blind, case study | 62-year-old woman with trigeminal neuropathic pain from post-herpetic neuralgia | Anode: primary M1, Cathode: supraorbital region, 2 mA, 20 min [11C]carfentanil PET | No changes in clinical pain improvements. Significantly decreased MOR BPND levels in key pain-matrix structures, including the nucleus accumbens, anterior cingulate cortex, insula, and posterior thalamus. |
| Dos Santos et al. 2014 [52] | Acute effects (single session), sham-controlled, single-blind | Healthy subjects N = 9 | Anode: right M1, Cathode: left supraorbital region, 2 mA, 20 min [11C]carfentanil PET | Sham tDCS resulted in a decrease in MOR BPND in the periaqueductal gray matter (PAG), precuneus, and thalamus, which indicates activation of the endogenous µ-opioid system. Active tDCS (2 mA for 20 min) also prompted MOR activation in the PAG and precuneus, but additionally increased MOR activation in the left prefrontal cortex. |
| Fonteneau et al. 2018 [57] | Acute effects (single session), sham-controlled, double-blind | Healthy subjects N = 32, Sham = 18, tDCS = 14 | Anode: left DLPFC, Cathode: right DLFPC, 2 mA, 20 min [11C]raclopride PET | A single session of bilateral DLFPC tDCS induced dopamine release in cognitive and affective striatal areas. |
| Fukai et al. 2019 [58] | Acute effects, sham-controlled, double-blind, crossover design | Healthy subjects N = 20 | Anode: left DLPFC, Cathode: right DLPFC, 2 mA, 13 min × 2 [11C]raclopride PET | tDCS over the DLPFC resulted in increased accuracy on a neuropsychological attentiveness test, which was significantly correlated with dopamine release in the right ventral striatum. |
© 2020 by the authors. Licensee MDPI, Basel, Switzerland. This article is an open access article distributed under the terms and conditions of the Creative Commons Attribution (CC BY) license (http://creativecommons.org/licenses/by/4.0/).
Share and Cite
Rudroff, T.; Workman, C.D.; Fietsam, A.C.; Ponto, L.L.B. Imaging Transcranial Direct Current Stimulation (tDCS) with Positron Emission Tomography (PET). Brain Sci. 2020, 10, 236. https://0-doi-org.brum.beds.ac.uk/10.3390/brainsci10040236
Rudroff T, Workman CD, Fietsam AC, Ponto LLB. Imaging Transcranial Direct Current Stimulation (tDCS) with Positron Emission Tomography (PET). Brain Sciences. 2020; 10(4):236. https://0-doi-org.brum.beds.ac.uk/10.3390/brainsci10040236
Chicago/Turabian StyleRudroff, Thorsten, Craig D. Workman, Alexandra C. Fietsam, and Laura L. Boles Ponto. 2020. "Imaging Transcranial Direct Current Stimulation (tDCS) with Positron Emission Tomography (PET)" Brain Sciences 10, no. 4: 236. https://0-doi-org.brum.beds.ac.uk/10.3390/brainsci10040236