Article

Gene–Toxicant Interactions in Gulf War Illness: Differential Effects of the PON1 Genotype

1
Cooperative Studies Program Epidemiology Center-Durham, Durham VA Medical Center, Durham VA Health Care System, Durham, NC 27705, USA
2
Computational Biology and Bioinformatics Program, Duke University School of Medicine, Durham, NC 27705, USA
3
Center for Child and Family Policy, Duke Margolis Center for Health Policy, Duke University Sanford School of Public Policy, Durham, NC 27708, USA
4
Pharmacogenomics Analysis Laboratory, Research Service, Central Arkansas Veterans Healthcare System, Little Rock, AR 72205, USA
5
Massachusetts Veterans Epidemiology Research and Information Center (MAVERIC), VA Boston Healthcare System, Boston, MA 02130, USA
6
Duke Molecular Physiology Institute, Department of Biostatistics and Bioinformatics, Duke University Medical Center Durham, NC 27701, USA
*
Author to whom correspondence should be addressed.
Submission received: 29 September 2021 / Revised: 10 November 2021 / Accepted: 20 November 2021 / Published: 25 November 2021

Abstract

:
About 25–35% of United States veterans who fought in the 1990–1991 Gulf War report several moderate or severe chronic systemic symptoms, defined as Gulf War illness (GWI). Thirty years later, there is little consensus on the causes or biological underpinnings of GWI. The Gulf War Era Cohort and Biorepository (GWECB) was designed to investigate genetic and environmental associations with GWI and consists of 1343 veterans. We investigate candidate gene–toxicant interactions that may be associated with GWI based on prior associations found in human and animal model studies, focusing on SNPs in or near ACHE, BCHE, and PON1 genes to replicate results from prior studies. SOD1 was also considered as a candidate gene. CDC Severe GWI, the primary outcome, was observed in 26% of the 810 deployed veterans included in this study. The interaction between the candidate SNP rs662 and pyridostigmine bromide (PB) pills was found to be associated with CDC Severe GWI. Interactions between PB pill exposure and rs3917545, rs3917550, and rs2299255, all in high linkage disequilibrium in PON1, were also associated with respiratory symptoms. These SNPs could point toward biological pathways through which GWI may develop, which could lead to biomarkers to detect GWI or to better treatment options for veterans with GWI.

1. Introduction

Gulf War veterans began reporting chronic systemic symptoms almost immediately after returning from deployment to the Gulf in support of the 1990–1991 Gulf War [1,2,3,4]. These symptoms have only increased, in both severity and frequency, over the past 30 years, and have been defined as Gulf War illness (GWI) [1,5,6,7,8,9,10]. The 2016 Institute of Medicine (IOM) report on GWI indicated great heterogeneity in the expression of GWI across the veteran population, suggesting heterogeneity in genetic susceptibility, environmental exposures, and/or their interactions [11]. There are still important gaps in our understanding of genetic or environmental risk factors for GWI, especially in how these risk factors may interact to increase susceptibility to GWI. Biological understanding of GWI is necessary to discover and design better treatment options for veterans with GWI.
Summarizing several decades of research on GW exposures, the VA Gulf War Research Advisory Council identified pyridostigmine bromide (PB) pills and the use of pesticides as being consistently associated with chronic multisymptom illness in multivariable adjusted models [12]. These consistently observed associations with PB and pesticide exposures suggest biological pathways, enzymes and genes for consideration in genetic analysis. Possible genetic risk loci have been identified over the past 25 years of GWI research, although replication of these results has been difficult. Butyrylcholinesterase was identified by Steele et al., 2015, where functional variants with decreased efficiency were associated with higher risk of Kansas-definition GWI [13]. Haley et al., 1999, identified an association between low arylesterase activity in paraoxonase-1 and higher risk of Haley Symptom Complex 2, Confusion-ataxia [14]. Association between case status and PON1-amino acid 192 R variant was also reported [14]. Inhibition of acetylcholinesterase function is often cited as an explanation for why the pesticides, PB, and nerve agents are suspected to be in the causal pathway of GWI [7,12,15,16,17,18,19,20,21,22]. Rodent models for GWI have been developed using combinations of pesticides, PB, sarin surrogate diisopropyl fluorophosphate (DFP), and chronic stress or corticosterone [15,16,17,19,23,24,25,26,27,28,29].
The enzymes acetylcholinesterase, butyrylcholinesterase, and paraoxonase are encoded by the genes ACHE, BCHE, and PON1, respectively, which have been studied as candidate genes underlying variation in response to GW exposures. In addition, SOD1 is a gene associated with amyotrophic lateral sclerosis (ALS), which has been associated with GW service [30,31,32,33] and is also postulated to be involved in gene-by-environment interactions [34,35]. The genetic analysis of these candidate genes in GWI has been limited to association studies of a small number of functional polymorphisms in each gene. Common functional polymorphisms in both BCHE and PON1 genes have been associated with GWI in prior studies [13,14]. The atypical butyrylcholinesterase variant, caused by the genetic variant rs1799807, is known to cause slower metabolism of succinylcholine, a common neuromuscular blockade used in surgery [36]. In a small sample of US GW veterans, Steele et al., 2015 show association of butyrylcholinesterase variants with GWI with exposure to PB pills [13]. Steele et al., 2015 considered the wild type (U), atypical (A; rs1799807), Kalow (K), atypical-Kalow (AK), and fluoride (F) variants, comparing veterans with K/K, U/AK, U/A, A/F, and AK/F genotypes to veterans with U/K genotypes and to veterans with U/U genotypes. The functional variant in PON1 discussed by Haley et al., rs662, has two substrate-dependent, differentially active phenotypes: one, the 192Q variant, has higher catalytic efficiency for sarin, soman, and diazoxon (the A allele at this locus leads to the Q version of the protein), while the other, the 192R variant, has higher catalytic efficiency for paraoxon (G allele at this locus leads to the R version of the protein) [37]. The common SNP rs662 has also been associated with increased risk for ALS and Pon1 activity has been associated with cardiovascular disease [38,39,40,41]. The relationships between genotype, catalytic activity, and disease outcomes are complex and likely involve additional variants in the PON1 gene [42]. Rare functional variants in human acetylcholinesterase (ACHE) have been implicated in anti-acetylcholinesterase sensitivity [43]. However, common variants have not been associated with acetylcholinesterase activity. One common variant, rs1799805, is responsible for the YT blood type, which may be in linkage disequilibrium with rare variants. Our goal in this gene-by-environment interaction study is to evaluate these specific candidate variants as well as assess common variation across the genes SOD1, ACHE, BCHE, and PON1 for association with GWI. Our hypothesis is that GWI case status and features of GWI and, specifically, the CDC Severe GWI case definition will be associated with the interaction between these genes and PB pill or pesticide exposures among deployed GW veterans.

2. Materials and Methods

2.1. Introduction to GWECB

The Gulf War Era Cohort and Biorepository (GWECB) consists of DNA, electronic medical records, and survey data from individuals who served in the United States Armed Forces during the 1990–1991 Gulf War [44]. Data collected includes self-reported exposures, exposure lengths, symptoms, symptom severity ratings, clinical conditions, and deployment locations. Women, veterans of color, and deployed veterans were oversampled, and veterans did not have to use the Veterans Affairs system for healthcare to be eligible for inclusion.

2.2. GWI Phenotypes

Veterans from the GWECB cohort have been classified as meeting or not meeting the case definition using the CDC, CDC Severe, Kansas full case definition, and Kansas symptom criteria [6]. Case status was coded using a deterministic SAS algorithm and basic survey data cleaning was also performed in SAS 9.4, as described in Vahey et al. and Gifford et al. [6,45].
Eleven outcomes were used for the regression analysis: the CDC Severe GWI Case Definition, the three CDC Severe symptom domains (CDC Severe: Musculoskeletal, CDC Severe: Mood/Cognition, and CDC Severe: Fatigue), Kansas Symptom Criteria, and the six Kansas symptom domains (Kansas: Pain, Kansas: Fatigue, Kansas: Respiratory, Kansas: Skin, Kansas: Mood/Neurological/Cognitive, and Kansas: Gastrointestinal). An additional variable derived from the GWI case algorithm is the Kansas exclusionary conditions indicator. This variable identifies veterans with at least one of 21 exclusionary health conditions, such as diabetes, heart disease, and cancer. Fulfilling the exclusionary criterion precludes an individual from being considered a GWI case. The CDC Severe and Kansas GWI case definitions are known to be heterogeneous; it is possible that multiple traits with different underlying etiologies make up GWI, complicating analysis. Thus, studying the symptom domains separately may isolate more homogeneous subphenotypes. Each symptom domain in the CDC Severe and Kansas case definitions were considered as individual outcomes, as in prior studies [13,14]. Previous analyses of deployment in GWECB demonstrated a strong and consistent association of deployment with the CDC Severe Case Definition and thus CDC Severe will serve as the primary outcome for this analysis [6].

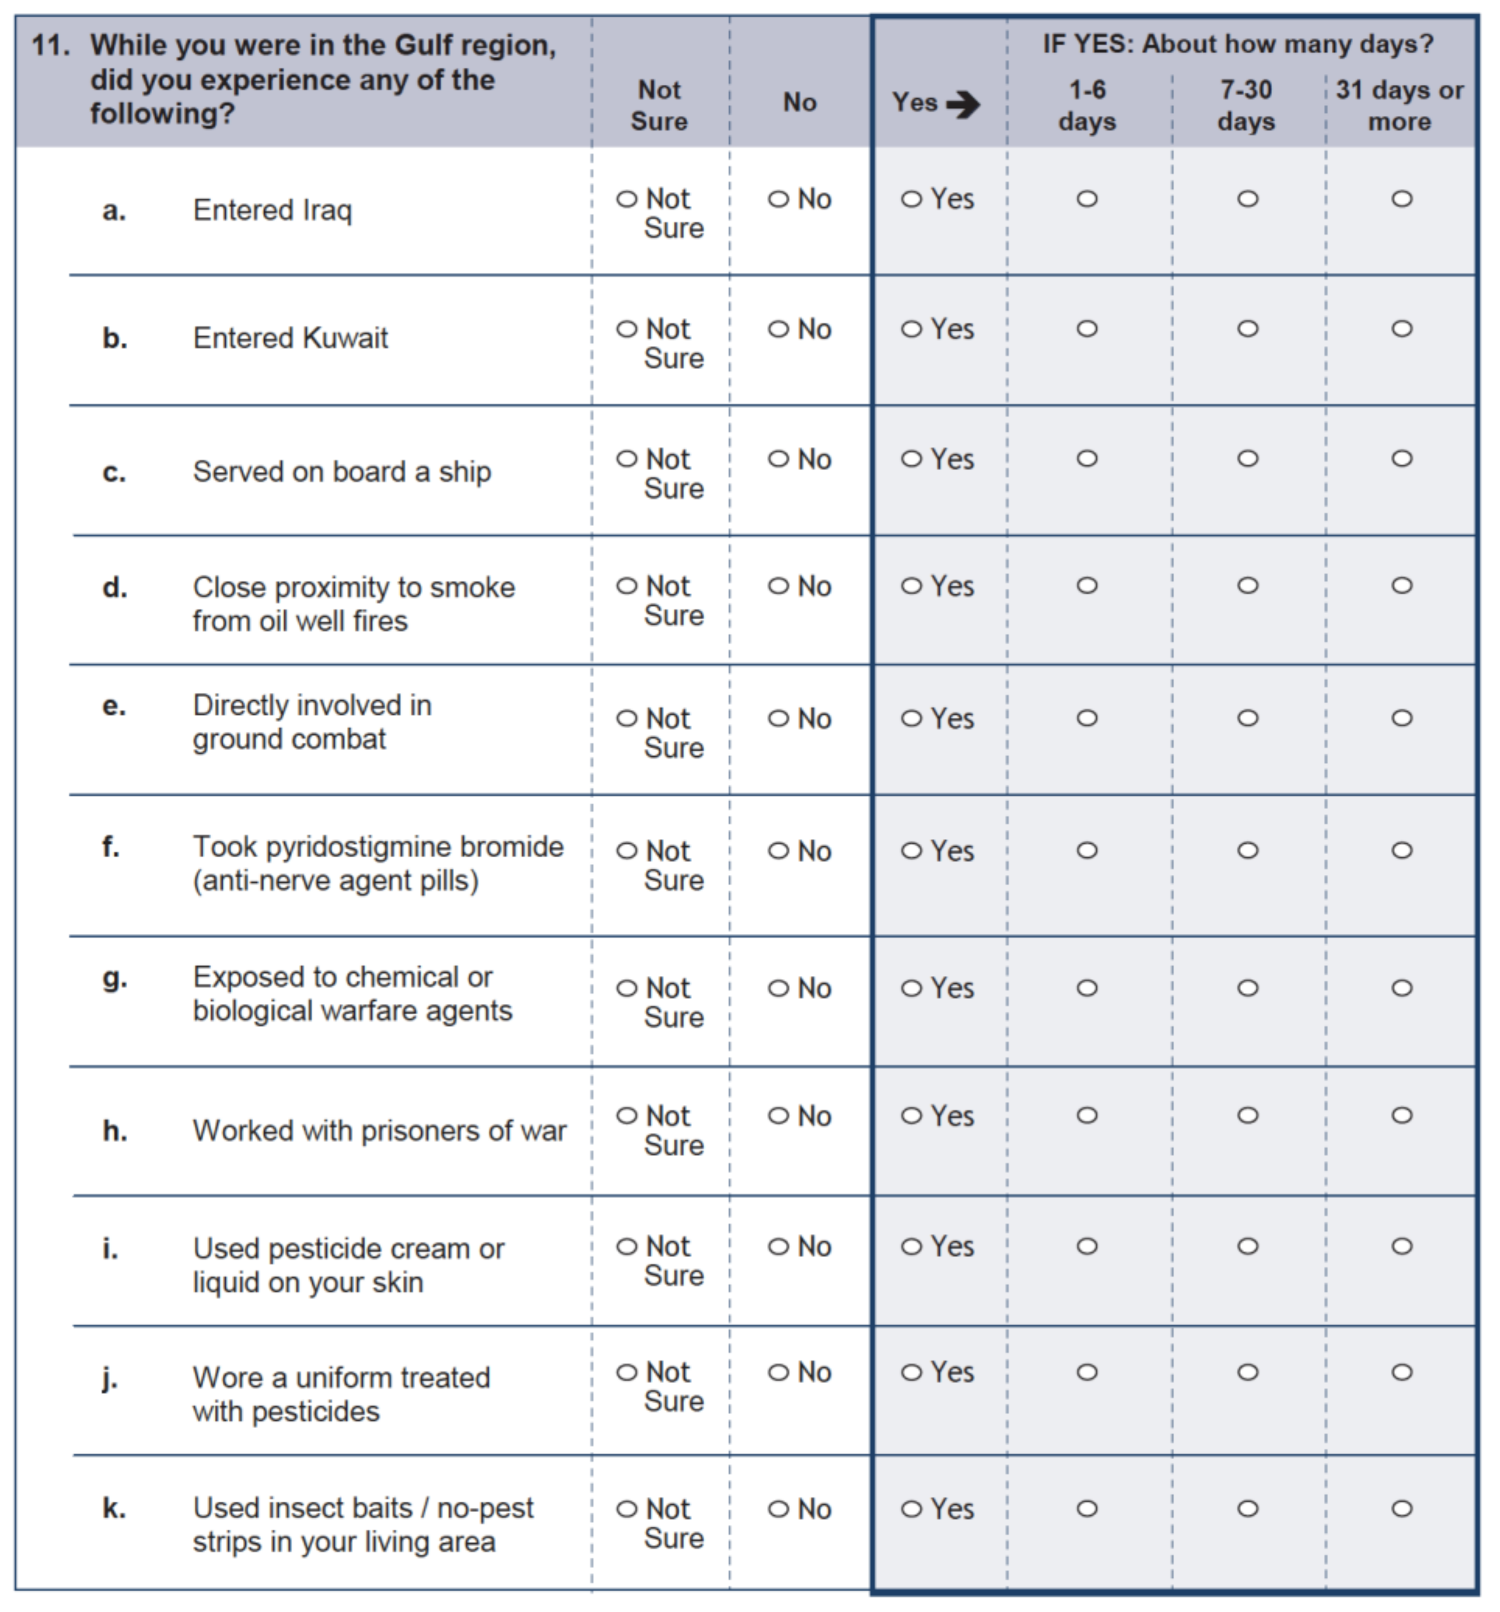
2.3. Gulf War Exposures

Veterans deployed to the Gulf during the 1990–1991 Gulf War were asked to report on their exposures. The survey asks for both a yes/no response and a “number of days exposed” response for 11 exposure questions. Appendix A Figure A1 is a scan of the survey page for these exposure responses. Ambiguous values were coded based on previous work [6]: number of days exposed was set to zero for individuals who said they did not experience an exposure, regardless of their secondary answer. Exposures used were “Took pyridostigmine bromide (anti-nerve agent pills)”, “Used pesticide cream or liquid on your skin”, “Wore a uniform treated with pesticides”, and “Used insect baits/no-pest strips in your living area”. The PB exposure variable used was the number of days each individual reported being exposed to PB pills; the options were “No, none”, “Yes, 1–6 days”, “Yes, 7–10 days”, and “Yes, 31 days or more”. The pesticide exposure variable combined the number of days reported for all three pesticide variables listed above, based on the minimum number of days per option (i.e., “Yes, 1–6 days” was counted as 1 day). Less than 31 days combined exposure was a short exposure, 31–60 days combined exposure was a medium exposure, and more than 60 days combined exposure was a long exposure. Pesticide use and PB pill exposure were chosen as candidate exposures over “exposed to biological or chemical warfare agents”, following conclusions of the 2014 Research Advisory Committee report [12].

2.4. Genotypes and Genetic Data Cleaning

Blood samples were collected for DNA extraction, as described by Khalil et al. [44]. DNA samples were whole-genome amplified, hybridized to microarrays, single-base extended and stained using the Automated Protocol for the Illumina Infinium HTS Assay in batches of two 96-sample plates per run. Genotyping was done on an Illumina Omni2.5-8v1.4 microarray at the Pharmacogenomics Analysis Laboratory (PAL) in the Central Arkansas Veterans Healthcare System. Analysis of agreement in genotypes between sample duplicates indicated excellent genotyping quality. Plink 1.9 was used for genetic data cleaning and analysis [46]. A total of 2,372,461 SNPs were genotyped; 82,369 SNPs were removed due to missingness greater than 1% and 512,116 SNPs with minor allele frequency (MAF) less than 1% were removed, including the two SNPs included by Steele et al. [13], leaving 1,777,976 SNPs. From those 1,777,976 SNPs, 3 SNPs were chosen for Tier 1 candidate SNP testing (i.e., BCHE, PON1, ACHE) and 371 SNPs were chosen for Tier 2 candidate SNP testing, representing all SNPs +/− 50 kb from the annotated gene. Individuals who returned surveys but who did not provide a specimen for genetic testing were excluded from analysis. Beginning with 1343 samples, replicates were removed, keeping the most informative sample for each individual. Two individuals were removed because of missing genotypes and 13 individuals were removed because of perceived genetic relatedness, leaving 1260 veterans for genetic analysis. As only veterans deployed to the Gulf were asked to report on their exposures, those who were deployed elsewhere and those who were not deployed were removed from the analysis. A total of 810 GW-deployed veterans were in the final analytic dataset after genotype and phenotype data cleaning, as seen in Figure 1.

2.5. Statistical Analysis

We fit a gene/environment interaction model to estimate the effect and statistical significance of specific candidate gene/toxicant interactions. We used logistic regression as implemented in PLINK 1.9 to test the effect of genetic variants and gene-by-exposure interaction [47]. As discussed above, the primary outcome was the CDC Severe phenotype. Analyses of other GWI case phenotypes and the individual symptom domain phenotypes were considered to be secondary. Given the complexity of the GWI phenotypes and the correlation among individual symptom domains, as well as their relationship to GWI outcomes, we did not adjust for multiple comparisons across the phenotypes but rather reported the p-values and effect sizes for each analysis.
Ten genetic principal components, representing population structure, along with age and sex were used as covariates for the basic model. The fully adjusted model included age, sex, education, income, and a binary indicator of the Kansas exclusionary criterion as an indicator of presence or absence of medical conditions. Because the Kansas exclusionary criterion is part of the full Kansas GWI case definition, the Kansas symptom criteria indicator was used as an outcome rather than the full Kansas GWI case definition in the fully adjusted model. Equation (1) outlines the basic model and Equation (2) outlines the fully adjusted model. We tested β3 using the standard allele test in an additive genetic model as implemented in PLINK.
Y = β 0 + β 1 S N P + β 2   E   + β 3 S N P E + β 4   age   + β 5   sex
Y = β 0 + β 1 S N P + β 2   E   + β 3 S N P E + β 4   age   + β 5   sex   + β 6   education +   β 6   income + β 7   Kansas _ Exclusion
Interaction trends were tested for significance using the Cochran–Armitage test for trend, according to the prop_trend_test() function in the rstatix package in R version 3.61. LocusZoom plots were generated using legacy LocusZoom.org [48]. Tier 1 SNPs were tested at p = 0.05, while Tier 2 SNPs were tested at p = 0.00013 using a Bonferroni correction for the 371 SNPs in Tier 2. SNPs were prioritized based on p-value and representation across phenotypes.

2.6. SNP Selection

Both models were performed for each of the 11 outcomes, and both exposures. For inclusion in these models, we identified two kinds of a priori SNPs based on published evidence for gene–toxicant interactions in GWI. Tier 1 SNPs in Table 1 have been previously identified in genetic analysis of GWI. Tier 2 SNPs, enumerated in Table 1, were chosen to cover all common variation in the genes of interest.

3. Results

3.1. Demographics and Outcomes

Veterans who fulfill the CDC Severe GWI criteria and those who do not are similarly distributed by sex, age group, and OEF/OIF deployment. Those who were Black or Hispanic, in the Army, have a lower household income, or were deployed active duty were more highly represented among those who fulfill the CDC Severe GWI criteria than those who do not fulfill the CDC Severe GWI criteria (Table 2). Those who earned advanced degrees or who were in the reserves were underrepresented among those who fulfill the CDC Severe GWI criteria.
Across the 810 deployed veterans, 26% were categorized as fulfilling the CDC Severe GWI criteria. CDC Severe case status was associated with PB and pesticide exposure (Table 3). Table 3 shows that 36% of those who report long PB exposure (n = 149) and 33% of those who report long pesticide exposure (n = 156) reported symptoms consistent with CDC Severe GWI compared to 18% and 19% of those who reported no PB or no pesticide exposure, respectively. Across all outcomes, a larger proportion of those who were exposed to either pesticides or PB pills fulfilled the symptom criteria compared to those in the overall deployed group (Appendix A Table A1 and Table A2).

3.2. Association of Tier 1 SNP/Exposure Interactions with Primary and Secondary Outcomes

The results for association for interactions of PB and pesticide exposure with the Tier 1 candidate SNPs with the primary outcome (CDC Severe GWI) and the secondary outcomes are shown for the covariate adjusted model (Table 4). Only one SNP, rs662, showed a statistically significant interaction with PB exposure for the CDC Severe GWI outcome (p = 0.049). Among the secondary outcomes, the interaction between rs662 (PON1) and pesticides had a p-value of 0.029 in the fully adjusted model of the Kansas Gastrointestinal symptom domain. The other Tier 1 interaction below p = 0.05 was rs1799805 (ACHE) with PB pill exposure for the Kansas skin symptom domain. Rs1799807 (BCHE) and rs1799805 (ACHE) had low minor allele frequencies: 0.022 and 0.039, respectively, likely resulting in lower power to detect differences across groups for these two variants. LocusZoom plots for these results can be found in Appendix A Figure A2, Figure A3, Figure A4 and Figure A5.
Figure 2 illustrates the unadjusted CDC Severe GWI frequencies across rs662 genotype (AA—homozygote 192Q phenotype, AG—heterozygote and GG—homozygote 192R phenotype) by PB pill length of exposure group. Significant trends were observed for longer lengths of exposure with higher rates of GWI were seen in the PON1 rs662 GA and GG genotypes, with p-values for the simple test for trend of 0.0004 and 0.0084, respectively. This trend was not observed in the AA group (p = 0.179).

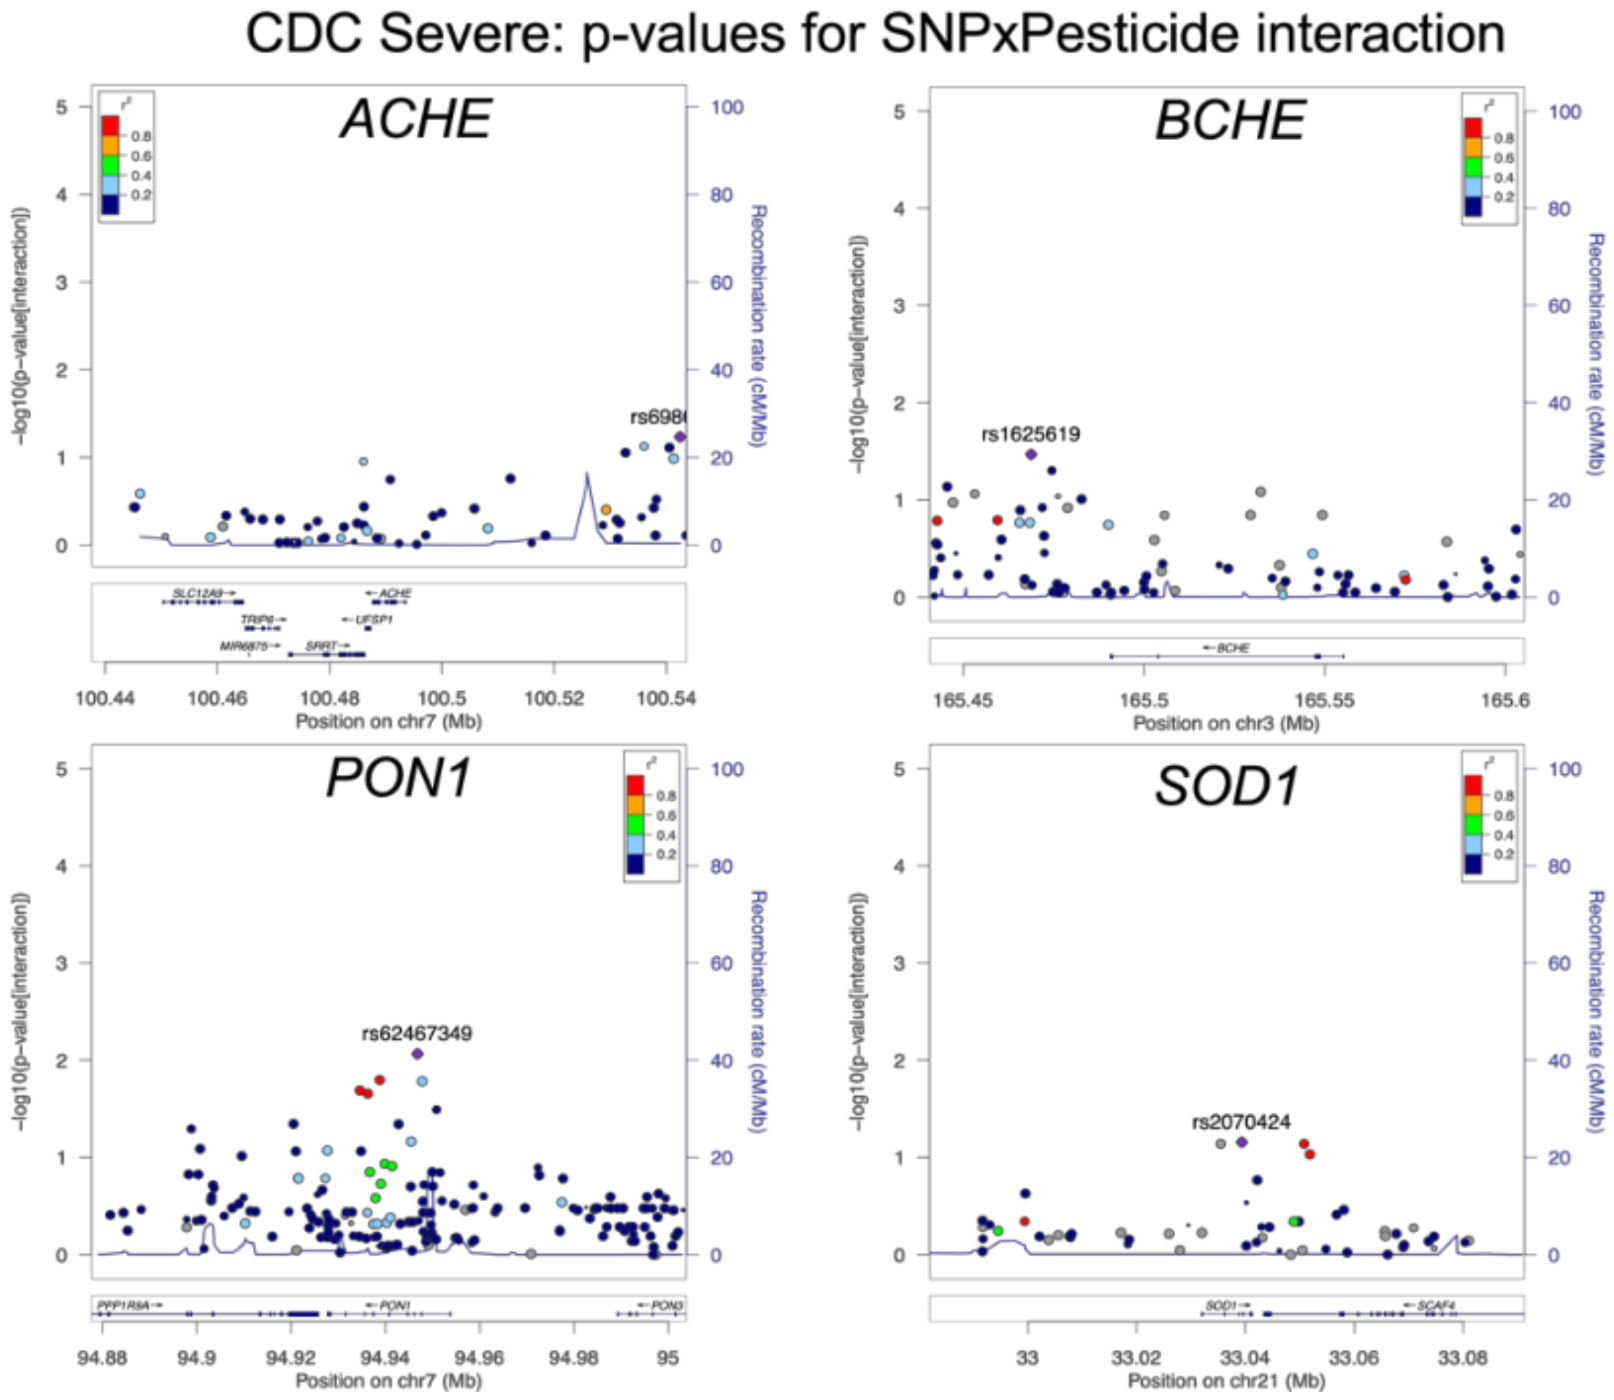
3.3. Association of Tier 2 SNP/Exposure interactions with CDC Severe GWI

Common SNPs in the four candidate genes were plotted by genomic location using LocusZoom, highlighting the SNP with the lowest exposure/SNP interaction p-value for each gene. The LocusZoom plots for association of the interaction between PB and variants in ACHE, BCHE, PON1, and SOD1 for the primary outcome, CDC Severe GWI, are shown in Figure 3. Similar plots for the interaction between pesticide exposure and variants in ACHE, BCHE, PON1, and SOD1 are included in Appendix A Figure A6. No results achieved Bonferroni-corrected statistical significance. The lowest p-value among the PB exposure/SNP interaction terms is in PON1 for the SNP rs2299260 (p = 0.005) (Table 5). Likewise, the lowest p-value for the interaction term with pesticides is in PON1 for rs62467349 (p = 0.0086) for CDC Severe GWI (Table 5).

3.4. Association of Tier 2 SNP/Exposure Interactions with Secondary Outcomes

Across the secondary outcomes, three SNPs showed statistically significant interactions with PB exposure for the Kansas Respiratory Symptom Domain (rs3917545, rs3917550, and rs2299255). These three SNPs were in high linkage disequilibrium with one another (r2 = 1), across all ancestry groups and are in the PON1 gene. Other gene/environment interaction associations with individual symptom domains were nominally significant (p < 0.05), although given the small sample size and lack of power, many are likely to be false positive signals or a result of correlation among the symptoms themselves. The linkage disequilibrium between the SNPs identified in PON1 is variable with moderate LD between rs662 and rs3917545, rs3917550, and rs2299255 in European ancestry and low LD between the same SNPs in African ancestry (r2 = 0.036 and r2 = 0.39 for YRI and CEU, respectively, Appendix A Figure A7 and Figure A8 [52]).
The group of interactions that was significant in the Kansas Respiratory domain model remained significant according to both the basic and fully adjusted models, but only in the PB interaction model. Figure 4 shows the interaction p-values for the region plotted on the −log10 scale. The PON1 candidate SNP rs662 is not in high LD (r2 < 0.4) with rs3917545.

4. Discussion

We identified a statistically significant association between CDC Severe GWI and the rs662/PB pill interaction, as seen in Figure 2, representing a pattern consistent with a gene–environment interaction model. While this was not the lowest p-value interaction in the study, it is the only signal that appears for our primary outcome (i.e., CDC Severe GWI) out of the Tier 1 SNPs. Significantly higher rates of CDC Severe GWI with increasing exposure to PB pills were detected for GG and GA genotypes. This increase in risk does not appear in the AA genotype, indicating that exposure alone is not responsible for this effect and separating the risk genotypes from the non-risk genotype. A significant trend among those who reported over 31 days exposure to PB pills suggests an additive risk according to the count of G alleles. This is consistent with previous reports in the literature, that the R version of the paraoxonase enzyme is less effective in detoxifying most substrates, and therefore results in higher risk with more exposure [51,53]. Rs662 is a functional variant; the rs662 G alternative allele causes a change from a glutamine to an arginine at amino acid 192. As early as 1999, Haley et al. demonstrated a genotype-specific difference in paraoxonase (arylesterase) activity which was strongly associated with GWI [14]. The Q version of the protein was previously found to have higher catalytic activity across most substrates, including sarin, while the R version of the enzyme was found to more efficiently detoxify paraoxon. In genome-wide association analyses, two variants in PON1 were associated at genome-wide significance level with paraoxonase enzyme activity, rs854572 and rs2057681, with rs2057681 in complete linkage disequilibrium (r2 = 1) with rs662 in European Americans [52,54]. Where prior studies have measured catalytic activity, we measured genotype using a genome-wide array. The multiple associated variants that we observed in PON1 were not in high LD with one another, reflecting the conclusions of Jarvik et al. that multiple independent variants are associated with arylesterase activity of PON1 [42]. Follow-up analysis to assess enzymatic activity has not been completed in GWECB and would be required to fully replicate this finding. This variant has also been implicated in several other diseases, including as a modifier of sporadic ALS [39], which affects Gulf War veterans at higher rates than other comparable military groups [32].
Analysis of common variants within the candidate genes also identified PON1 variants as interacting with GW exposures. Rs3917545 was statistically significant after Bonferroni correction interacting with PB exposure for association with the Kansas Respiratory symptom domain outcome. Two additional SNPs were also significant, are all in linkage disequilibrium with one another, and thus are likely a single signal. These SNPs are all non-coding variants that have not been identified by other GWI studies, although one of the SNPs, rs3917545 has been identified as associated with blood protein levels of erythroid membrane associated protein in a plasma proteome screen [55,56]. Additional PON1 SNP-exposure pairs had suggestive p-values (p < 0.05) but did not meet the threshold for statistical significance. Whether these represent independent signals or are merely correlated with other SNPs, exposures and/or outcomes will require a larger dataset to untangle. The other three candidate genes BCHE, ACHE, and SOD1 did not yield any statistically significant interactions for this candidate gene–environment interaction study. Larger datasets will be required for additional discovery of gene–environment interactions related to GWI.
There are several limitations to our study. While our sample size is large relative to other studies of GWI with genetic information, we had limited power to detect rare variants, particularly those in the BCHE gene. We were also unable to replicate the BCHE/PB interaction identified by Steele et al. [13]. This is partially due to the lower allele frequency of the BCHE variants; Steele et al. combined several BCHE variants together for analysis, but we did not test variants that appeared in our data at less than 1% minor allele frequency. We prioritized candidate SNPs into two tiers, which allowed us to identify several significant signals, one of which has biological meaning. Given our sample size, we cannot dismiss type I error as a possible explanation for our findings. Future work could examine data from the MVP study, including over 100,000 Gulf War Era veterans with genotypes [57], which would allow for greater statistical power to detect gene-by-environment interactions. Future work could also analyze catalytic activity of our candidate genes, specifically Pon1, which could increase confidence in these findings. An additional limitation is around the generalizability of our findings. The GWECB survey had a very low return rate and may not be representative of the general Gulf War veteran population [44]. An important assumption in our model is the independence of genotype and exposure. While we did not observe an association between genotype and exposures, we are unable to fully rule out a possible dependency. Genotype proportions by exposure time remained consistent across all exposure categories, indicating that there is not an association between genotype and exposure length, visualized in Appendix A Figure A9. One benefit of GWECB is that both women and racial minorities were oversampled, allowing some examination of racial differences despite our modest sample size. The rs662 risk genotype is more common in those who identify as Hispanic or Black, non-Hispanic than in those who identify as White, non-Hispanic. Among White veterans, risk was higher with increased exposure in the GG and AG groups, but not in the AA group (Appendix A, Figure A10). The same is true among the Black and Hispanic veterans in the dataset (Appendix A, Figure A11), despite the smaller sample size. Additionally, we were unable to replicate a statistically significant interaction involving pesticides in our analysis, although prior work indicates that pesticide exposure may also interact with PON1 rs662 genotypes [24,25,58,59,60,61]. Qualitatively the pesticide results show similar relationships with the SNPs in PON1. This is potentially attributable to the heterogeneity in the composition of pesticides experienced. The metabolism of carbamates (some pesticides and PB pills) is notably different than the metabolism of organophosphates (other pesticides and sarin gas) contributing to additional heterogeneity in the effect of the exposures. We used a variable that combined exposures from different pesticide sources into a variable indicating total exposure. Different pesticides may affect different biological pathways, and this further biologic heterogeneity may be reducing power to detect gene–environment interactions with pesticides. In addition, the GWECB measure of PB pills is based on self-report of exposure and did not query reaction to pesticide or PB exposure [62]. Finally, due to data and sample size limitations, we did not consider all potentially important exposures, such as chemical weapon exposure or oil-well fire smoke, or alternative timing of exposure effects, such as acute or chronic effects of exposures. A larger dataset or meta-analysis across similar analyses is required to address these limitations.
In summary, two significant signals were identified, associating GWI with the interaction between PON1 and PB pill exposure. The primary result of the association between CDC Severe GWI and the rs662/PB pill exposure interaction corresponds with prior findings, as the rs662 locus is a functional variant that has been previously identified in smaller studies [14,30,38,40]. The secondary result of the association between respiratory symptoms and the interaction of PB with a trio of SNPs in high linkage disequilibrium (LD) with one another is a new finding and requires replication in additional, larger studies. The SNPs in these two signals do not appear to be in high LD with one another, although both are in PON1 and both interactions are with PB pill exposure. We did not observe statistically significant interactions or marginal effects for any SNPs in ACHE, BCHE or SOD1.

5. Conclusions

Aligning with prior work in the area, this study identified an interaction between PB pill exposure and the G allele of rs662. Because this G allele codes for a functional variant, this interaction replicated prior work implicating genetic susceptibility to PB and pesticide exposure in GW veterans and identifies a potential biomarker for GWI risk.

Author Contributions

Conceptualization, J.V., E.J.G. and E.R.H.; methodology, J.V., E.R.H. and J.T.E.; formal analysis, J.V.; resources, C.D.W., A.S. and S.P.; data curation, B.C.; writing—original draft preparation, J.V.; writing—review and editing, E.J.G., K.J.S., B.C., S.H.B., C.S., J.U., A.S., S.P., J.T.E., C.D.W. and E.R.H.; visualization, J.V.; supervision, E.J.G., C.D.W. and E.R.H.; project administration, C.S. and J.U.; funding acquisition, C.D.W. and E.R.H. All authors have read and agreed to the published version of the manuscript.

Funding

This research was funded by the Department of Veteran Affairs, Cooperative Studies Program CSP585. J.V. received support from the Duke University Department of Biostatistics and Bioinformatics and through the T32 training grant (5T32-GM071340).

Institutional Review Board Statement

The study was conducted according to the guidelines of the Declaration of Helsinki and was approved by the VA Central Institutional Review Board (protocol code 11-09, most recent continuing review approval on 17 July 2021).

Informed Consent Statement

Informed consent was obtained from all subjects involved in the study.

Data Availability Statement

GWECB data may be requested by following instructions on the GWECB repository website: https://www.research.va.gov/programs/csp/585/repository.cfm (accessed on 4 May 2021).

Acknowledgments

We acknowledge the lifelong work, leadership, and mentorship of Dawn Provenzale, who planned and led the GWECB and related Gulf War studies until her passing in 2021. We also thank the veterans who participated in the GWECB, as this work would be impossible without them. The views expressed in this article are those of the authors and do not necessarily reflect the position or policy of the Department of Veterans Affairs, the Department of Defense, or the US government.

Conflicts of Interest

The authors declare no conflict of interest. The funders had no role in the design of the study; in the collection, analyses, or interpretation of data; in the writing of the manuscript, or in the decision to publish the results.

Appendix A

Table A1. Frequency of fulfilling symptom domains and case definitions by exposure to pesticides.
OverallPesticide Exposure
NoneMissingShortMediumLong
Count81034610678124156
CDC Severe: Fatigue Domain16%12%18%19%19%21%
CDC Severe: Mood Domain33%25%40%32%37%45%
CDC Severe: Musculoskeletal Domain33%24%46%37%36%41%
CDC Severe GWI26%19%35%24%30%33%
Kansas: Fatigue Domain80%70%86%81%86%92%
Kansas: Respiratory Domain36%25%43%47%40%45%
Kansas: Gastrointestinal Domain39%30%41%47%36%55%
Kansas: Pain Domain73%62%84%80%76%83%
Kansas: Skin Domain33%22%35%42%40%42%
Kansas: Mood Domain87%80%90%87%95%93%
Kansas Symptom Criteria72%59%81%78%77%89%
Kansas: Exclusionary Criterion40%40%44%46%39%38%
Table A2. Frequency of fulfilling symptom domains and case definitions by exposure to PB pills.
OverallPB Pill Exposure
NoneMissingShortMediumLong
Count81031113898114149
CDC Severe: Fatigue Domain16%9%20%22%17%24%
CDC Severe: Mood Domain33%24%37%34%41%44%
CDC Severe: Musculoskeletal Domain33%24%36%38%34%48%
CDC Severe GWI26%18%30%28%31%36%
Kansas: Fatigue Domain80%71%80%84%89%89%
Kansas: Respiratory Domain36%27%40%43%40%43%
Kansas: Gastrointestinal Domain39%28%38%40%52%51%
Kansas: Pain Domain73%61%80%77%77%87%
Kansas: Skin Domain33%24%33%40%38%41%
Kansas: Mood Domain87%79%87%90%93%94%
Kansas Symptom Criteria72%59%75%74%83%87%
Kansas: Exclusionary Criterion40%38%46%42%39%41%
Figure A1. Exposure questions from the CSP585 questionnaire.
Brainsci 11 01558 g0a1
Figure A2. SNP/pesticide interaction p-values for association with the Kansas Gastrointestinal Symptom Domain (PON1).
Brainsci 11 01558 g0a2
Figure A3. SNP/pesticide interaction p-values for the association with the Kansas Skin Symptom Domain (ACHE).
Brainsci 11 01558 g0a3
Figure A4. SNP/PB pill interaction p-values for the association with the Kansas Skin Symptom Domain (ACHE).
Brainsci 11 01558 g0a4
Figure A5. SNP/pesticide interaction p-values for the association with the CDC Musculoskeletal Symptom Domain (ACHE).
Brainsci 11 01558 g0a5
Figure A6. LocusZoom plots for the four candidate genes. Plotted are the p-value for the SNP/Pesticide interaction association with CDC Severe.
Brainsci 11 01558 g0a6
Figure A7. R2 and D’ for the significant SNP/PB interaction association with GWI outcomes results in the CEU population. Made using LD-matrix [52].
Brainsci 11 01558 g0a7
Figure A8. R2 and D’ for the significant SNP/PB interaction association with GWI outcomes results in the YRI population. Made using LD-matrix [52].
Brainsci 11 01558 g0a8
Figure A9. Genotype proportions by exposure time (PB), with homozygous GG in blue (dotted, top), heterozygous GA in purple (striped, middle), and homozygous AA in red (solid, bottom).
Brainsci 11 01558 g0a9
Figure A10. CDC Severe GWI frequency, stratified by rs662 genotype and PB exposure time, among self-reported white, non-Hispanic individuals only.
Brainsci 11 01558 g0a10
Figure A11. CDC Severe GWI frequency, stratified by rs662 genotype and PB exposure time, among self-reported Hispanic or Black, non-Hispanic individuals only.
Brainsci 11 01558 g0a11

References

  1. Institute of Medicine. Chronic Multisymptom Illness in Gulf War Veterans: Case Definitions Reexamined; The National Academies Press: Washington, DC, USA, 2014. [Google Scholar]
  2. Kipen, H.M.; Hallman, W.; Kang, H.; Fiedler, N.; Natelson, B.H. Prevalence of Chronic Fatigue and Chemical Sensitivities in Gulf Registry Veterans. Arch. Environ. Health Int. J. 1999, 54, 313–318. [Google Scholar] [CrossRef] [PubMed]
  3. Fukuda, K.; Strauss, S.; Hickie, I.; Sharpe, M.; Dobbins, J.; Komaroff, A. The Chronic Fatigue Syndrome: A Comprehensive Approach to Its Definition and Study. J. Chronic Fatigue Syndr. 1995, 1, 67–84. [Google Scholar] [CrossRef]
  4. Fukuda, K.; Nisenbaum, R.; Stewart, G.; Thompson, W.W.; Robin, L.; Washko, R.M.; Noah, D.L.; Barrett, D.H.; Randall, B.; Herwaldt, B.L.; et al. Chronic Multisymptom Illness Affecting Air Force Veterans of the Gulf War. JAMA 1998, 280, 981–988. [Google Scholar] [CrossRef] [PubMed]
  5. Steele, L. Prevalence and Patterns of Gulf War Illness in Kansas Veterans: Association of Symptoms with Characteristics of Person, Place, and Time of Military Service. Am. J. Epidemiol. 2000, 152, 992–1002. [Google Scholar] [CrossRef]
  6. Gifford, E.J.; Vahey, J.; Hauser, E.R.; Sims, K.J.; Efird, J.T.; Dursa, E.K.; Steele, L.; Helmer, D.A.; Provenzale, D. Gulf War illness in the Gulf War Era Cohort and Biorepository: The Kansas and Centers for Disease Control definitions. Life Sci. 2021, 278, 119454. [Google Scholar] [CrossRef]
  7. White, R.F.; Steele, L.; O’Callaghan, J.P.; Sullivan, K.; Binns, J.H.; Golomb, B.A.; Bloom, F.E.; Bunker, J.A.; Crawford, F.; Graves, J.C.; et al. Recent research on Gulf War illness and other health problems in veterans of the 1991 Gulf War: Effects of toxicant exposures during deployment. Cortex 2016, 74, 449–475. [Google Scholar] [CrossRef] [Green Version]
  8. Eisen, S.A.; Kang, H.K.; Murphy, F.M.; Blanchard, M.S.; Reda, D.J.; Henderson, W.G.; Toomey, R.; Jackson, L.W.; Alpern, R.; Parks, B.J.; et al. Gulf War Veterans’ Health: Medical Evaluation of a U.S. Cohort. Ann. Intern. Med. 2005, 142, 881–890. [Google Scholar] [CrossRef] [Green Version]
  9. Blanchard, M.S.; Eisen, S.A.; Alpern, R.; Karlinsky, J.; Toomey, R.; Reda, D.J.; Murphy, F.M.; Jackson, L.W.; Kang, H.K. Chronic Multisymptom Illness Complex in Gulf War I Veterans 10 Years Later. Am. J. Epidemiol. 2005, 163, 66–75. [Google Scholar] [CrossRef] [Green Version]
  10. Smith, B.N.; Wang, J.M.; Vogt, D.; Vickers, K.; King, D.W.; King, L.A. Gulf War Illness. J. Occup. Environ. Med. 2013, 55, 104–110. [Google Scholar] [CrossRef]
  11. Cory-Slechta, D.A.; Wedge, R. Gulf War and Health. Gulf War Health 2016, 10, 1–292. [Google Scholar] [CrossRef]
  12. Updated Scientific Findings and Recommendations Research Advisory Committee on Gulf War Veterans’ Illnesses; Research Advisory Committee: Washington, DC, USA, 2014.
  13. Steele, L.; Lockridge, O.; Gerkovich, M.M.; Cook, M.R.; Sastre, A. Butyrylcholinesterase genotype and enzyme activity in relation to Gulf War illness: Preliminary evidence of gene-exposure interaction from a case–control study of 1991 Gulf War veterans. Environ. Health 2015, 14, 4. [Google Scholar] [CrossRef] [Green Version]
  14. Haley, R.W.; Billecke, S.; La Du, B.N. Association of Low PON1 Type Q (Type A) Arylesterase Activity with Neurologic Symptom Complexes in Gulf War Veterans. Toxicol. Appl. Pharmacol. 1999, 157, 227–233. [Google Scholar] [CrossRef]
  15. Abdullah, L.; Evans, J.E.; Montague, H.; Reed, J.M.; Moser, A.; Crynen, G.; Gonzalez, A.; Zakirova, Z.; Ross, I.; Mullan, C.; et al. Chronic elevation of phosphocholine containing lipids in mice exposed to Gulf War agents pyridostigmine bromide and permethrin. Neurotoxicol. Teratol. 2013, 40, 74–84. [Google Scholar] [CrossRef]
  16. Abdel-Rahman, A.; Abou-Donia, S.M.; El-Masry, E.M.; Shetty, A.; Abou-Donia, M.B. Stress and Combined Exposure to Low Doses of Pyridostigmine Bromide, DEET, and Permethrin Produce Neurochemical and Neuropathological Alterations in Cerebral Cortex, Hippocampus, and Cerebellum. J. Toxicol. Environ. Health Part A 2004, 67, 163–192. [Google Scholar] [CrossRef]
  17. Ashbrook, D.G.; Hing, B.; Michalovicz, L.T.; Kelly, K.A.; Miller, J.V.; De Vega, W.C.; Miller, D.B.; Broderick, G.; O’Callaghan, J.P.; McGowan, P.O. Epigenetic impacts of stress priming of the neuroinflammatory response to sarin surrogate in mice: A model of Gulf War illness. J. Neuroinflamm. 2018, 15, 86. [Google Scholar] [CrossRef] [Green Version]
  18. Nettleman, M. Gulf War Illness: Challenges Persist. Trans. Am. Clin. Climatol. Assoc. 2015, 126, 237–247. [Google Scholar]
  19. Emmerich, T.; Zakirova, Z.; Klimas, N.; Sullivan, K.; Shetty, A.K.; Evans, J.E.; Ait-Ghezala, G.; Laco, G.S.; Hattiangady, B.; Shetty, G.A.; et al. Phospholipid profiling of plasma from GW veterans and rodent models to identify potential biomarkers of Gulf War Illness. PLoS ONE 2017, 12, e0176634. [Google Scholar] [CrossRef]
  20. Chao, L.; Abadjian, L.R.; Esparza, I.L.; Reeb, R. Insomnia Severity, Subjective Sleep Quality, and Risk for Obstructive Sleep Apnea in Veterans With Gulf War Illness. Mil. Med. 2016, 181, 1127–1134. [Google Scholar] [CrossRef] [Green Version]
  21. Belgrad, J.; Dutta, D.J.; Bromley-Coolidge, S.; Kelly, K.A.; Michalovicz, L.T.; Sullivan, K.A.; O’Callaghan, J.P.; Fields, R.D. Oligodendrocyte involvement in Gulf War Illness. Glia 2019, 67, 2107–2124. [Google Scholar] [CrossRef] [Green Version]
  22. Gulf War Illness and the Health of Gulf War Veterans; Research Advisory Committee: Washington, DC, USA, 2008.
  23. Ojo, J.O.; Abdullah, L.; Evans, J.; Reed, J.M.; Montague, H.; Mullan, M.J.; Crawford, F.C. Exposure to an organophosphate pesticide, individually or in combination with other Gulf War agents, impairs synaptic integrity and neuronal differentiation, and is accompanied by subtle microvascular injury in a mouse model of Gulf War agent exposure. Neuropathology 2014, 34, 109–127. [Google Scholar] [CrossRef]
  24. Miller, J.V.; LeBouf, R.; A Kelly, K.; Michalovicz, L.T.; Ranpara, A.; Locker, A.R.; Miller, D.B.; O’Callaghan, J.P. The Neuroinflammatory Phenotype in a Mouse Model of Gulf War Illness is Unrelated to Brain Regional Levels of Acetylcholine as Measured by Quantitative HILIC-UPLC-MS/MS. Toxicol. Sci. 2018, 165, 302–313. [Google Scholar] [CrossRef] [Green Version]
  25. Carpenter, J.; Gordon, H.; Ludwig, H.; Wagner, J.; Harn, D.; Norberg, T.; Filipov, N. Neurochemical and neuroinflammatory perturbations in two Gulf War Illness models: Modulation by the immunotherapeutic LNFPIII. NeuroToxicology 2020, 77, 40–50. [Google Scholar] [CrossRef] [PubMed]
  26. Zakirova, Z.; Tweed, M.; Crynen, G.; Reed, J.; Abdullah, L.; Nissanka, N.; Mullan, M.; Mullan, M.J.; Mathura, V.; Crawford, F.; et al. Gulf War Agent Exposure Causes Impairment of Long-Term Memory Formation and Neuropathological Changes in a Mouse Model of Gulf War Illness. PLoS ONE 2015, 10, e0119579. [Google Scholar] [CrossRef] [PubMed] [Green Version]
  27. Hernandez, S.; Fried, D.E.; Grubišić, V.; McClain, J.L.; Gulbransen, B.D. Gastrointestinal neuroimmune disruption in a mouse model of Gulf War illness. FASEB J. 2019, 33, 6168–6184. [Google Scholar] [CrossRef] [PubMed]
  28. Koo, B.-B.; Michalovicz, L.T.; Calderazzo, S.; Kelly, K.; Sullivan, K.; Killiany, R.J.; O’Callaghan, J.P. Corticosterone potentiates DFP-induced neuroinflammation and affects high-order diffusion imaging in a rat model of Gulf War Illness. Brain Behav. Immun. 2018, 67, 42–46. [Google Scholar] [CrossRef] [PubMed]
  29. Michalovicz, L.T.; Kelly, K.A.; Sullivan, K.; O’Callaghan, J.P. Acetylcholinesterase inhibitor exposures as an initiating factor in the development of Gulf War Illness, a chronic neuroimmune disorder in deployed veterans. Neuropharmacology 2020, 171, 108073. [Google Scholar] [CrossRef]
  30. Mackness, B.; Durrington, P.N.; Mackness, M.I. Low Paraoxonase in Persian Gulf War Veterans Self-Reporting Gulf War Syndrome. Biochem. Biophys. Res. Commun. 2000, 276, 729–733. [Google Scholar] [CrossRef]
  31. Saccon, R.A.; Bunton-Stasyshyn, R.K.A.; Fisher, E.M.; Fratta, P. Is SOD1 loss of function involved in amyotrophic lateral sclerosis? Brain 2013, 136, 2342–2358. [Google Scholar] [CrossRef]
  32. Haley, R.W. Excess incidence of ALS in young Gulf War veterans. Neurology 2003, 61, 750–756. [Google Scholar] [CrossRef]
  33. Horner, R.; Kamins, K.; Feussner, J.; Grambow, S.; Hoff-Lindquist, J.; Harati, Y.; Mitsumoto, H.; Pascuzzi, R.; Spencer, P.; Tim, R.; et al. Occurrence of amyotrophic lateral sclerosis among Gulf War veterans. Neurology 2003, 61, 742–749. [Google Scholar] [CrossRef]
  34. Merwin, S.J.; Obis, T.; Nunez, Y.; Re, D.B. Organophosphate neurotoxicity to the voluntary motor system on the trail of environment-caused amyotrophic lateral sclerosis: The known, the misknown, and the unknown. Arch. Toxicol. 2017, 91, 2939–2952. [Google Scholar] [CrossRef]
  35. A van Es, M.; Dahlberg, C.; Birve, A.; Veldink, J.H.; Berg, L.H.V.D.; Andersen, P.M. Large-scale SOD1 mutation screening provides evidence for genetic heterogeneity in amyotrophic lateral sclerosis. J. Neurol. Neurosurg. Psychiatry 2010, 81, 562–566. [Google Scholar] [CrossRef]
  36. Zhu, G.-D.; Dawson, E.; Huskey, A.; Gordon, R.J.; Del Tredici, A.L. Genetic Testing for BCHE Variants Identifies Patients at Risk of Prolonged Neuromuscular Blockade in Response to Succinylcholine. Pharmacogenomics Pers. Med. 2020, 13, 405–414. [Google Scholar] [CrossRef]
  37. Costa, L.G.; Cole, T.B.; Jarvik, G.P.; Furlong, C.E. Functional Genomics of the Paraoxonase (PON1) Polymorphisms: Effects on Pesticide Sensitivity, Cardiovascular Disease, and Drug Metabolism. Annu. Rev. Med. 2003, 54, 371–392. [Google Scholar] [CrossRef]
  38. Slowik, A.; Tomik, B.; Wolkow, P.P.; Partyka, D.; Turaj, W.; Malecki, M.T.; Pera, J.; Dziedzic, T.; Szczudlik, A.; Figlewicz, D.A. Paraoxonase gene polymorphisms and sporadic ALS. Neurology 2006, 67, 766–770. [Google Scholar] [CrossRef]
  39. Verde, F.; Tiloca, C.; Morelli, C.; Doretti, A.; Poletti, B.; Maderna, L.; Messina, S.; Gentilini, D.; Fogh, I.; Ratti, A.; et al. PON1 is a disease modifier gene in amyotrophic lateral sclerosis: Association of the Q192R polymorphism with bulbar onset and reduced survival. Neurol. Sci. 2019, 40, 1469–1473. [Google Scholar] [CrossRef]
  40. Huo, X.; Guo, Y.; Zhang, Y.; Li, J.; Wen, X.; Liu, J. Paraoxonase 1 gene (Q192R) polymorphism confers susceptibility to coronary artery disease in type 2 diabetes patients: Evidence from case-control studies. Drug Discov. Ther. 2019, 13, 80–88. [Google Scholar] [CrossRef] [Green Version]
  41. Jarvik, G.P.; Hatsukami, T.S.; Carlson, C.; Richter, R.J.; Jampsa, R.; Brophy, V.H.; Margolin, S.; Rieder, M.; Nickerson, D.; Schellenberg, G.D.; et al. Paraoxonase Activity, But Not Haplotype Utilizing the Linkage Disequilibrium Structure, Predicts Vascular Disease. Arter. Thromb. Vasc. Biol. 2003, 23, 1465–1471. [Google Scholar] [CrossRef] [Green Version]
  42. Jarvik, G.P.; Jampsa, R.; Richter, R.J.; Carlson, C.S.; Rieder, M.J.; Nickerson, D.A.; Furlong, C.E. Novel paraoxonase (PON1) nonsense and missense mutations predicted by functional genomic assay of PON1 status. Pharmacogenetics Genom. 2003, 13, 291–295. [Google Scholar] [CrossRef]
  43. Shapira, M.; Tur-Kaspa, I.; Bosgraaf, L.; Livni, N.; Grant, A.D.; Grisaru, D.; Korner, M.; Ebstein, R.P.; Soreq, H. A transcription-activating polymorphism in the ACHE promoter associated with acute sensitivity to anti-acetylcholinesterases. Hum. Mol. Genet. 2000, 9, 1273–1281. [Google Scholar] [CrossRef] [Green Version]
  44. Khalil, L.; McNeil, R.B.; Sims, K.J.; A Felder, K.; Hauser, E.R.; Goldstein, K.M.; I Voils, C.; Klimas, N.G.; Brophy, M.T.; Thomas, C.M.; et al. The Gulf War Era Cohort and Biorepository: A Longitudinal Research Resource of Veterans of the 1990–1991 Gulf War Era. Am. J. Epidemiol. 2018, 187, 2279–2291. [Google Scholar] [CrossRef]
  45. Vahey, J.; Hauser, E.R.; Sims, K.J.; Helmer, D.A.; Provenzale, D.; Gifford, E.J. Research tool for classifying Gulf War illness using survey responses: Lessons for writing replicable algorithms for symptom-based conditions. Life Sci. 2021, 282, 119808. [Google Scholar] [CrossRef]
  46. Chang, C.C.; Chow, C.C.; Tellier, L.C.A.M.; Vattikuti, S.; Purcell, S.M.; Lee, J.J. Second-generation PLINK: Rising to the challenge of larger and richer datasets. GigaScience 2015, 4, 7. [Google Scholar] [CrossRef]
  47. Chen, Y.; Meyer, J.; Hill, H.Z.; Lange, G.; Condon, M.R.; Klein, J.C.; Ndirangu, D.; Falvo, M.J. Role of mitochondrial DNA damage and dysfunction in veterans with Gulf War Illness. PLoS ONE 2017, 12, e0184832. [Google Scholar] [CrossRef] [Green Version]
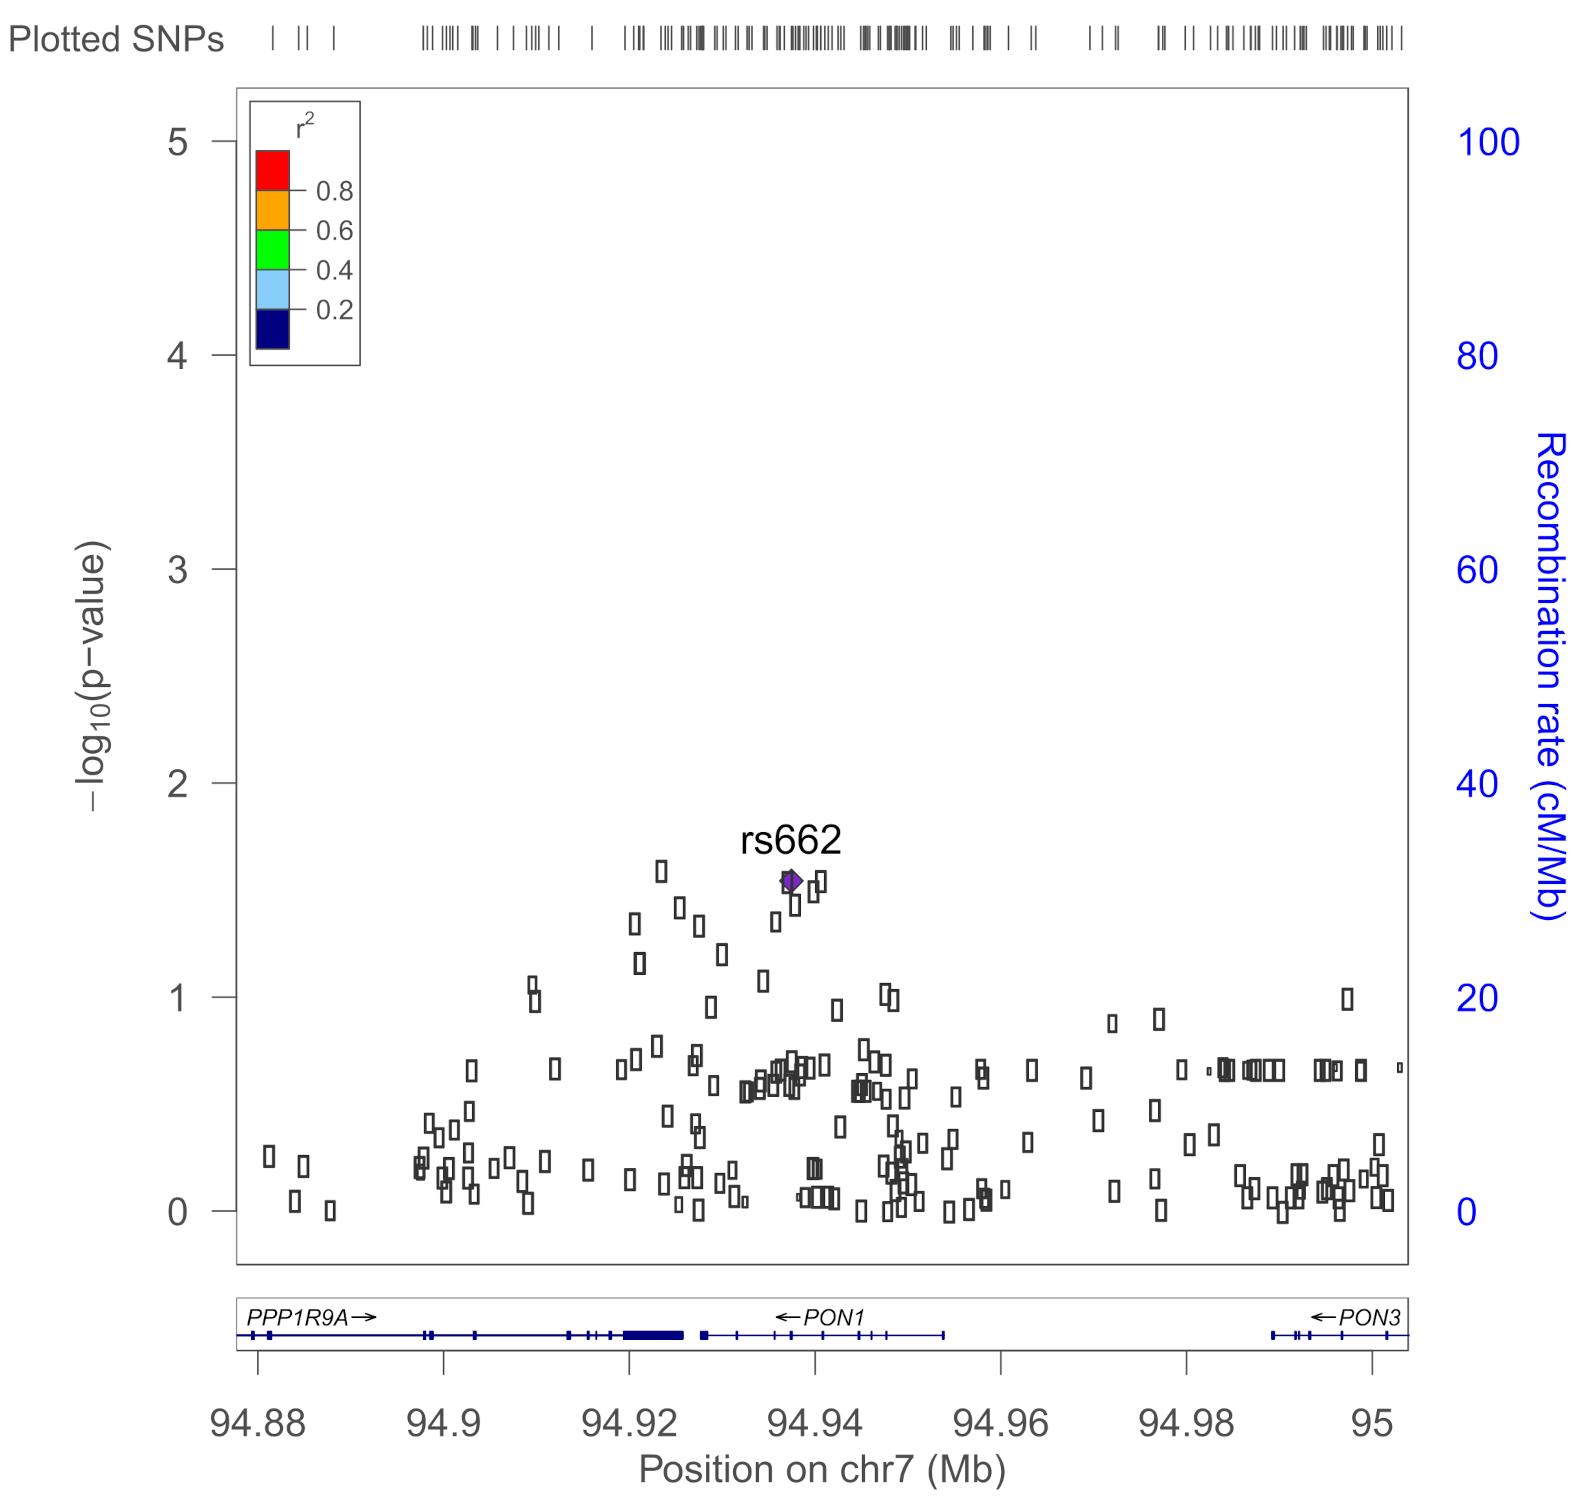
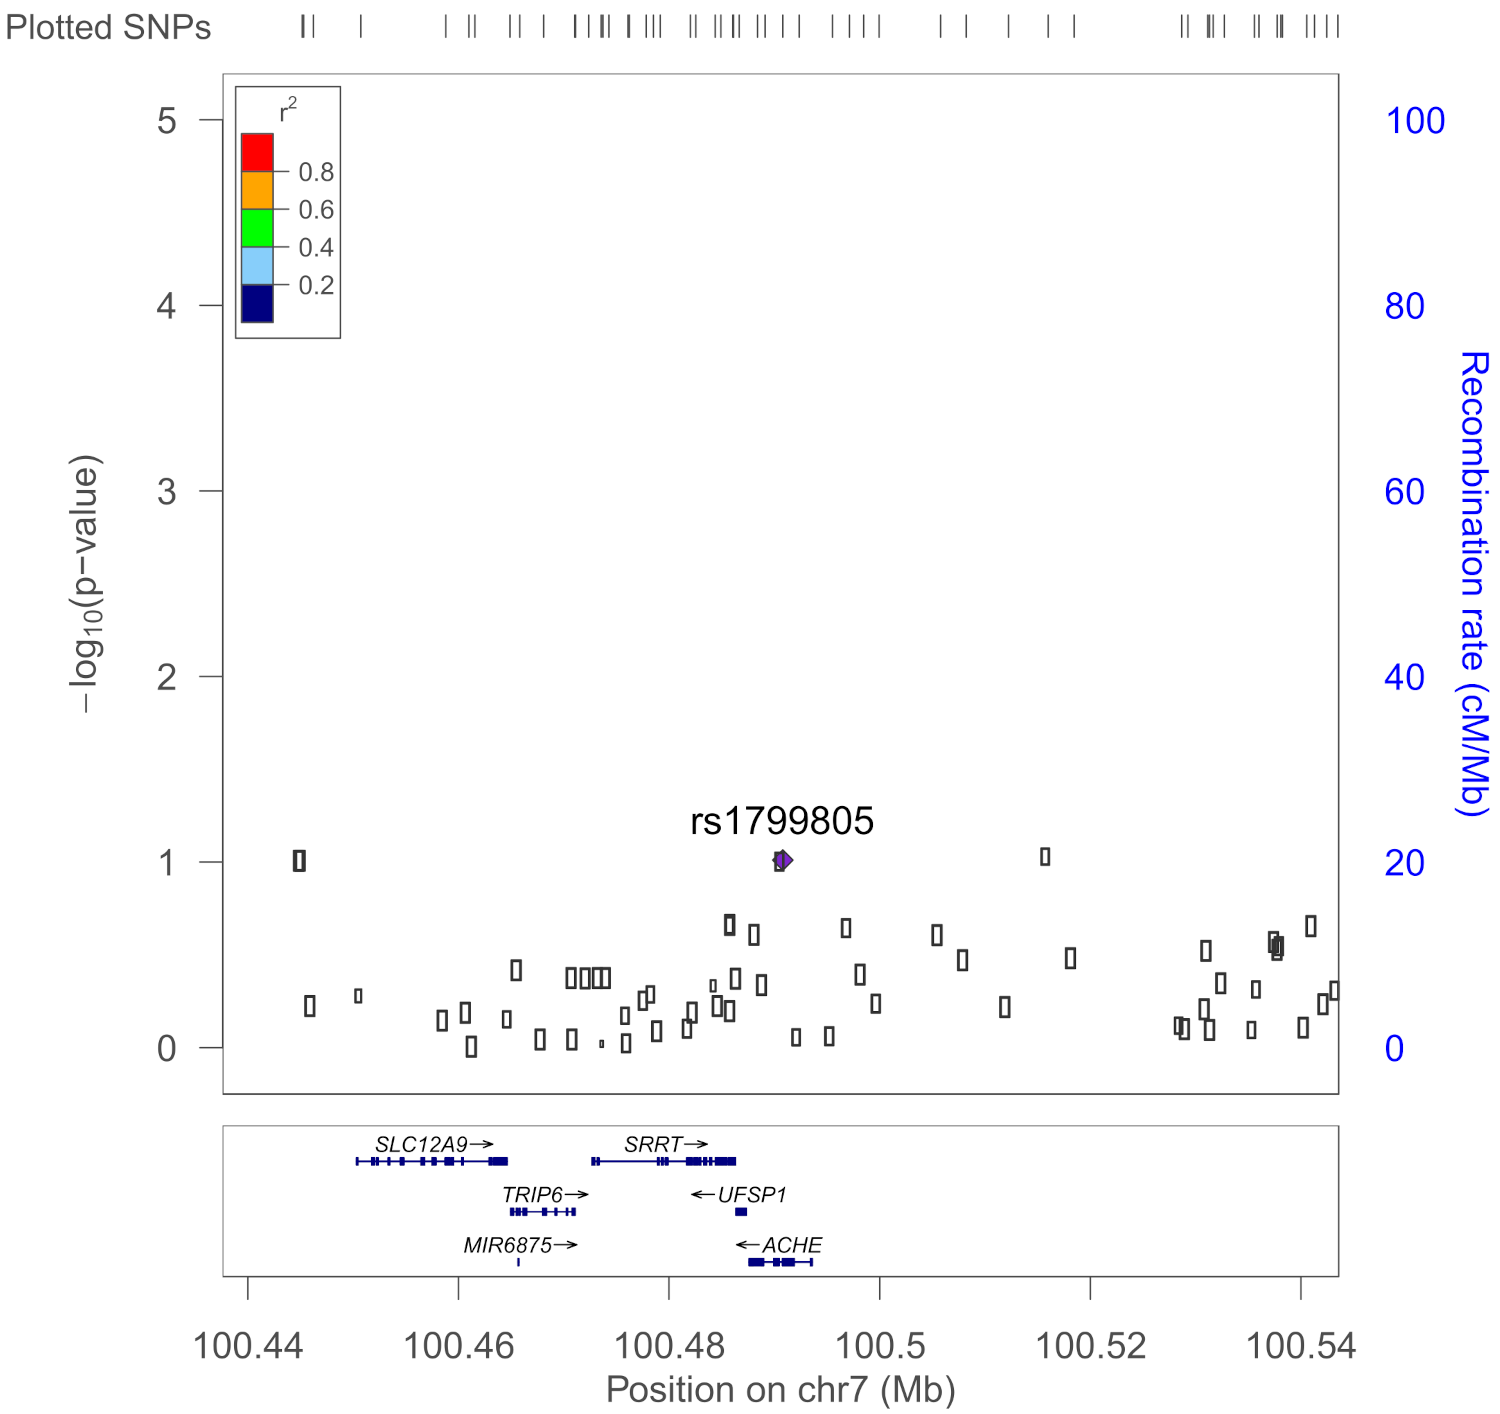
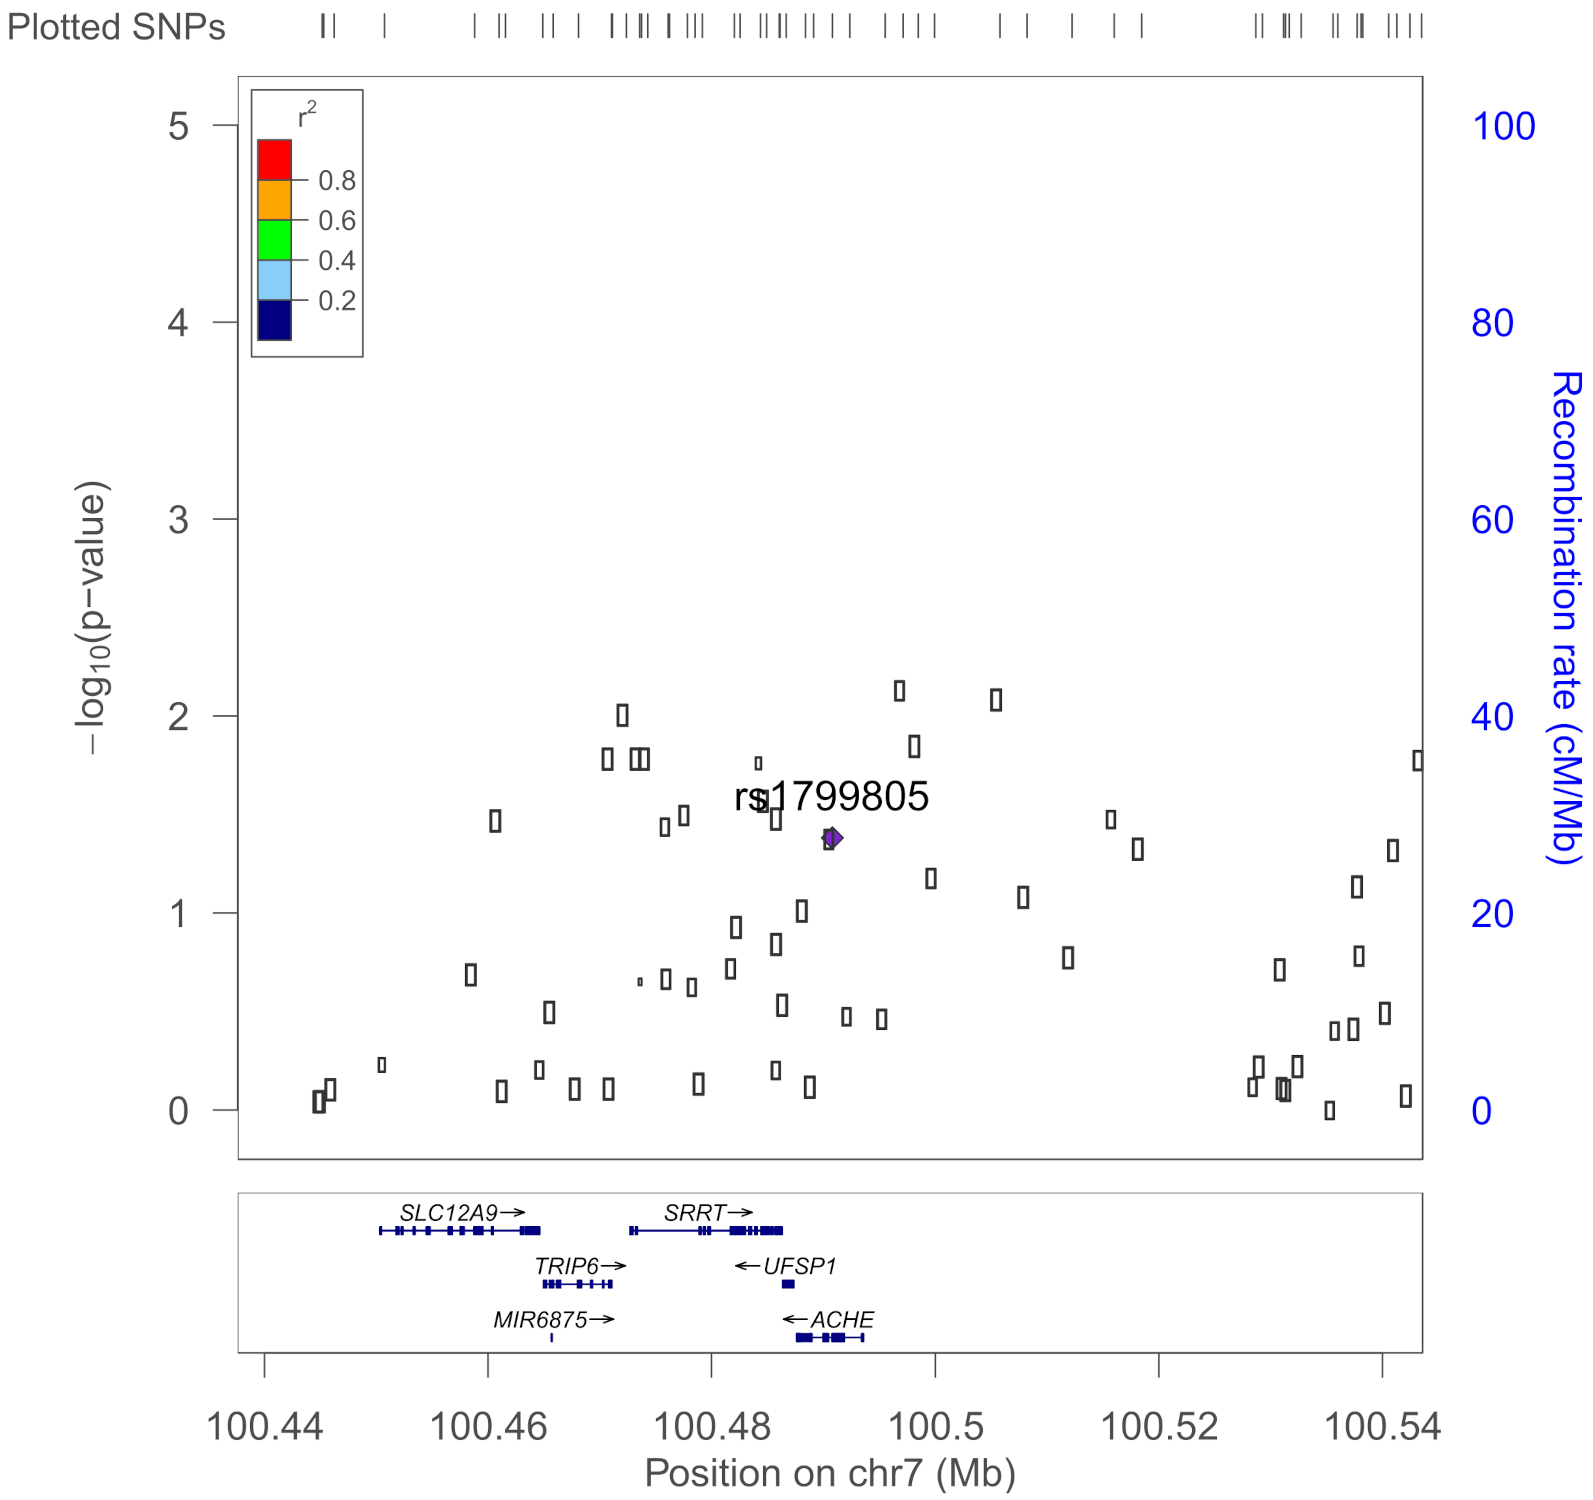
  48. Pruim, R.J.; Welch, R.P.; Sanna, S.; Teslovich, T.M.; Chines, P.S.; Gliedt, T.P.; Boehnke, M.; Abecasis, G.; Willer, C.J. LocusZoom: Regional visualization of genome-wide association scan results. Bioinformatics 2010, 26, 2336–2337. [Google Scholar] [CrossRef] [Green Version]
  49. Goodall, R. Cholinesterase: Phenotyping and genotyping. Ann. Clin. Biochem. Int. J. Lab. Med. 2004, 41, 98–110. [Google Scholar] [CrossRef] [PubMed]
  50. Dardiotis, E.; Aloizou, A.-M.; Siokas, V.; Tsouris, Z.; Rikos, D.; Marogianni, C.; Aschner, M.; Kovatsi, L.; Bogdanos, D.P.; Tsatsakis, A. Paraoxonase-1 genetic polymorphisms in organophosphate metabolism. Toxicology 2019, 411, 24–31. [Google Scholar] [CrossRef]
  51. Davies, H.G.; Richter, R.J.; Keifer, M.; Broomfield, C.A.; Sowal, J.; Furlong, C.E. The Effect of the Human Serum Paraoxonase Polymorphism is Reversed with Diazoxon, Soman and Sarin. Nat. Genet. 1996, 14, 334–336. [Google Scholar] [CrossRef] [PubMed]
  52. Machiela, M.J.; Chanock, S.J. LDlink: A web-based application for exploring population-specific haplotype structure and linking correlated alleles of possible functional variants: Fig. Bioinformatics 2015, 31, 3555–3557. [Google Scholar] [CrossRef] [PubMed]
  53. Furlong, C.E.; Marsillach, J.; Jarvik, G.P.; Costa, L.G. Paraoxonases-1, -2 and -3: What are their functions? Chem. Interact. 2016, 259, 51–62. [Google Scholar] [CrossRef] [Green Version]
  54. Buniello, A.; MacArthur, J.A.L.; Cerezo, M.; Harris, L.W.; Hayhurst, J.; Malangone, C.; McMahon, A.; Morales, J.; Mountjoy, E.; Sollis, E.; et al. The NHGRI-EBI GWAS Catalog of published genome-wide association studies, targeted arrays and summary statistics. Nucleic Acids Res. 2019, 47, D1005–D1012. [Google Scholar] [CrossRef] [Green Version]
  55. Sun, B.B.; Maranville, J.C.; Peters, J.E.; Stacey, D.; Staley, J.R.; Blackshaw, J.; Burgess, S.; Jiang, T.; Paige, E.; Surendran, P.; et al. Genomic atlas of the human plasma proteome. Nature 2018, 558, 73–79. [Google Scholar] [CrossRef]
  56. Marees, A.T.; De Kluiver, H.; Stringer, S.; Vorspan, F.; Curis, E.; Marie-Claire, C.; Derks, E. A tutorial on conducting genome-wide association studies: Quality control and statistical analysis. Int. J. Methods Psychiatr. Res. 2018, 27, e1608. [Google Scholar] [CrossRef]
  57. Radhakrishnan, K.; Hauser, E.; Polimanti, R.; Helmer, D.; Provenzale, D.; McNeil, R.; Maffucci, A.; Quaden, R.; Zhao, H.; Whitbourne, S.; et al. Genomics of Gulf War Illness in U.S. Veterans Who Served during the 1990–1991 Persian Gulf War: Methods and Rationale for Veterans Affairs Cooperative Study #2006. Brain Sci. 2021, 11, 845. [Google Scholar] [CrossRef]
  58. Parihar, V.K.; Hattiangady, B.; Shuai, B.; Shetty, A.K. Mood and Memory Deficits in a Model of Gulf War Illness Are Linked with Reduced Neurogenesis, Partial Neuron Loss, and Mild Inflammation in the Hippocampus. Neuropsychopharmacology 2013, 38, 2348–2362. [Google Scholar] [CrossRef]
  59. Golomb, B.A. Acetylcholinesterase inhibitors and Gulf War illnesses. Proc. Natl. Acad. Sci. USA 2008, 105, 4295–4300. [Google Scholar] [CrossRef] [Green Version]
  60. Janulewicz, P.; Krengel, M.; Quinn, E.; Heeren, T.; Toomey, R.; Killiany, R.; Zundel, C.; Ajama, J.; O’Callaghan, J.; Steele, L.; et al. The Multiple Hit Hypothesis for Gulf War Illness: Self-Reported Chemical/Biological Weapons Exposure and Mild Traumatic Brain Injury. Brain Sci. 2018, 8, 198. [Google Scholar] [CrossRef] [Green Version]
  61. Phillips, K.F.; Deshpande, L.S. Repeated low-dose organophosphate DFP exposure leads to the development of depression and cognitive impairment in a rat model of Gulf War Illness. NeuroToxicology 2016, 52, 127–133. [Google Scholar] [CrossRef]
  62. Haley, R.W. Self-reported Exposure to Neurotoxic Chemical Combinations in the Gulf WarA Cross-sectional Epidemiologic Study. JAMA 1997, 277, 231–237. [Google Scholar] [CrossRef]
Figure 1. Block diagram: individuals in analytic dataset. Note: “Deployed to Gulf” throughout this manuscript indicates deployment to the Persian Gulf during the 1990–1991 Gulf War.
Brainsci 11 01558 g001
Figure 2. Proportion of individuals fulfilling the CDC Severe GWI case definition within each genotype-exposure group. Each block is labeled by genotype (AA, GA, GG), with each bar representing an exposure length.
Brainsci 11 01558 g002
Figure 3. LocusZoom plots for CDC Severe GWI. Top SNP in each region is marked as a purple diamond, with linkage disequilibrium highlighted according to the r2 legend in upper right.
Brainsci 11 01558 g003
Figure 4. Kansas Respiratory Domain: PON1. Bonferroni corrected significance level of p = 0.00013 is 3.89 on the y-axis (−log10 scale). Three SNPs (purple and two red) are above that line. Rs662 is labeled for convenience (light blue dot).
Brainsci 11 01558 g004
Table 1. Tier 1 candidate SNPs and Tier 2 SNPs in candidate genes.
Tier 1 SNPs: BCHE, PON1, and ACHE from Prior Studies
SNPGeneVariantMAFCitations
rs1799807BCHEAtypical (A); lower catalytic rate; succinylcholine
susceptibility
0.020Zhu et al., 2020 [36], Goodall 2004 [49], Steele et al., 2015 [13]
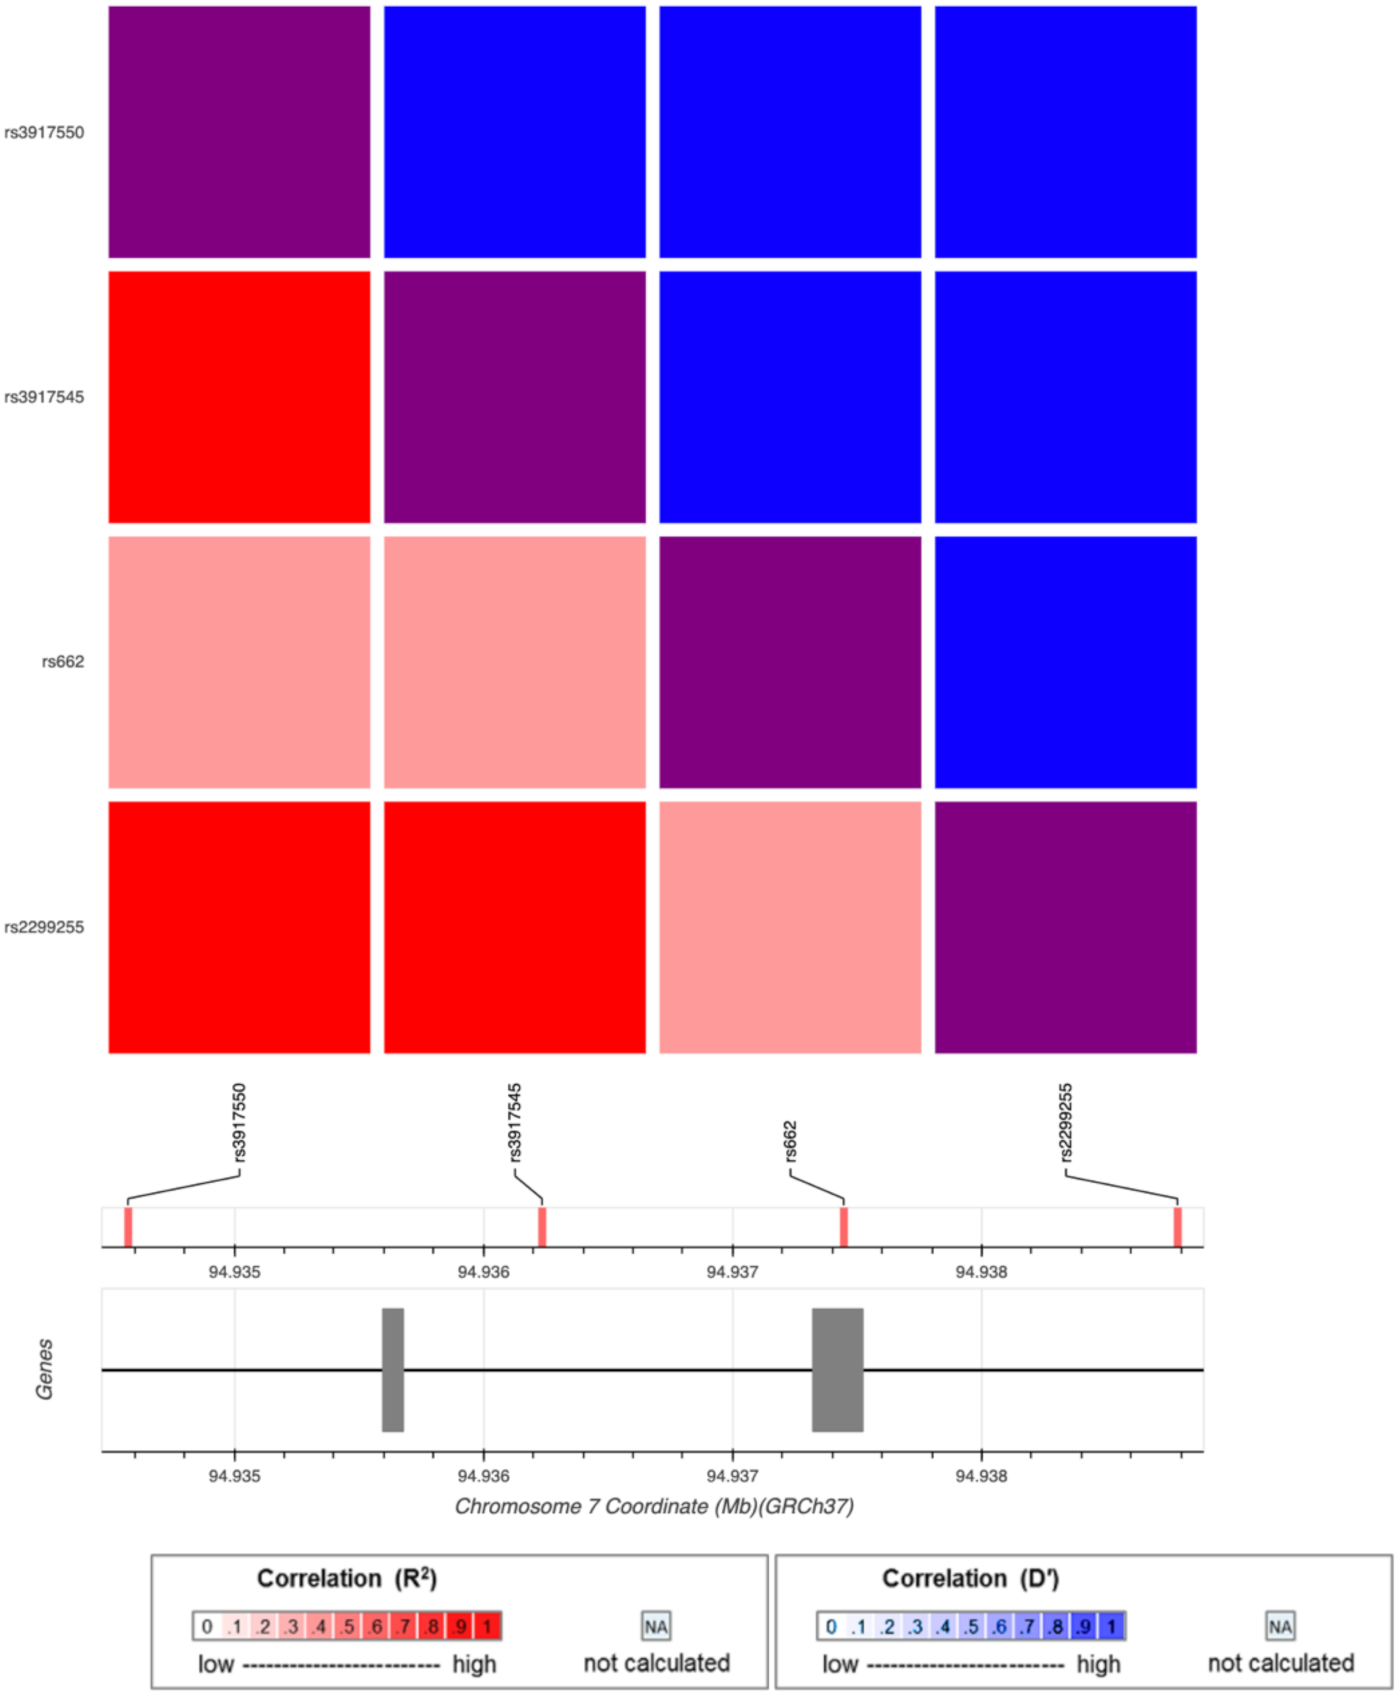
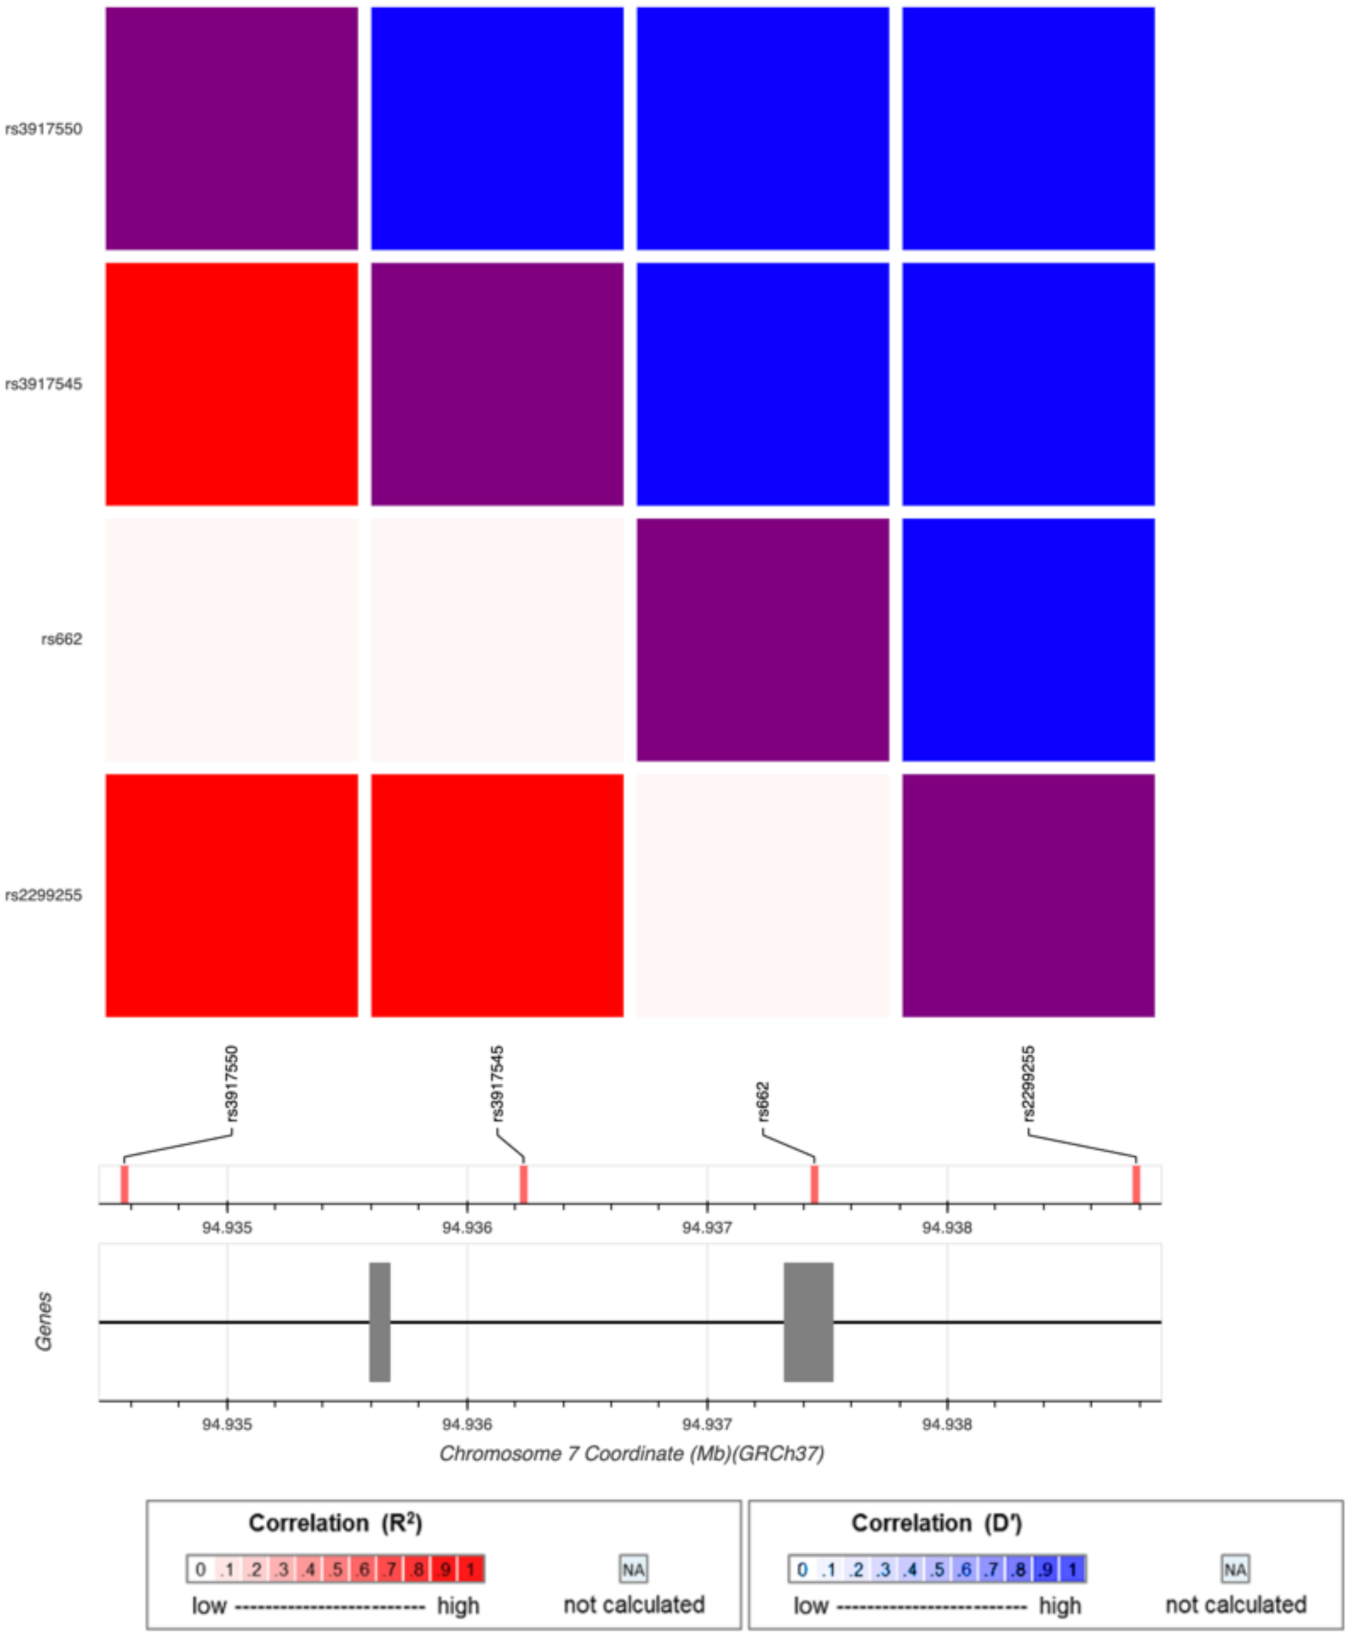
rs662PON1192Q/R; functional variant of Pon1
Modifier for risk of
sporadic ALS
0.396Dardiotis et al., 2018 [50], Davies et al., 1996 [51], Haley et al., 1999 [14];
Verde et al., 2019 [39]
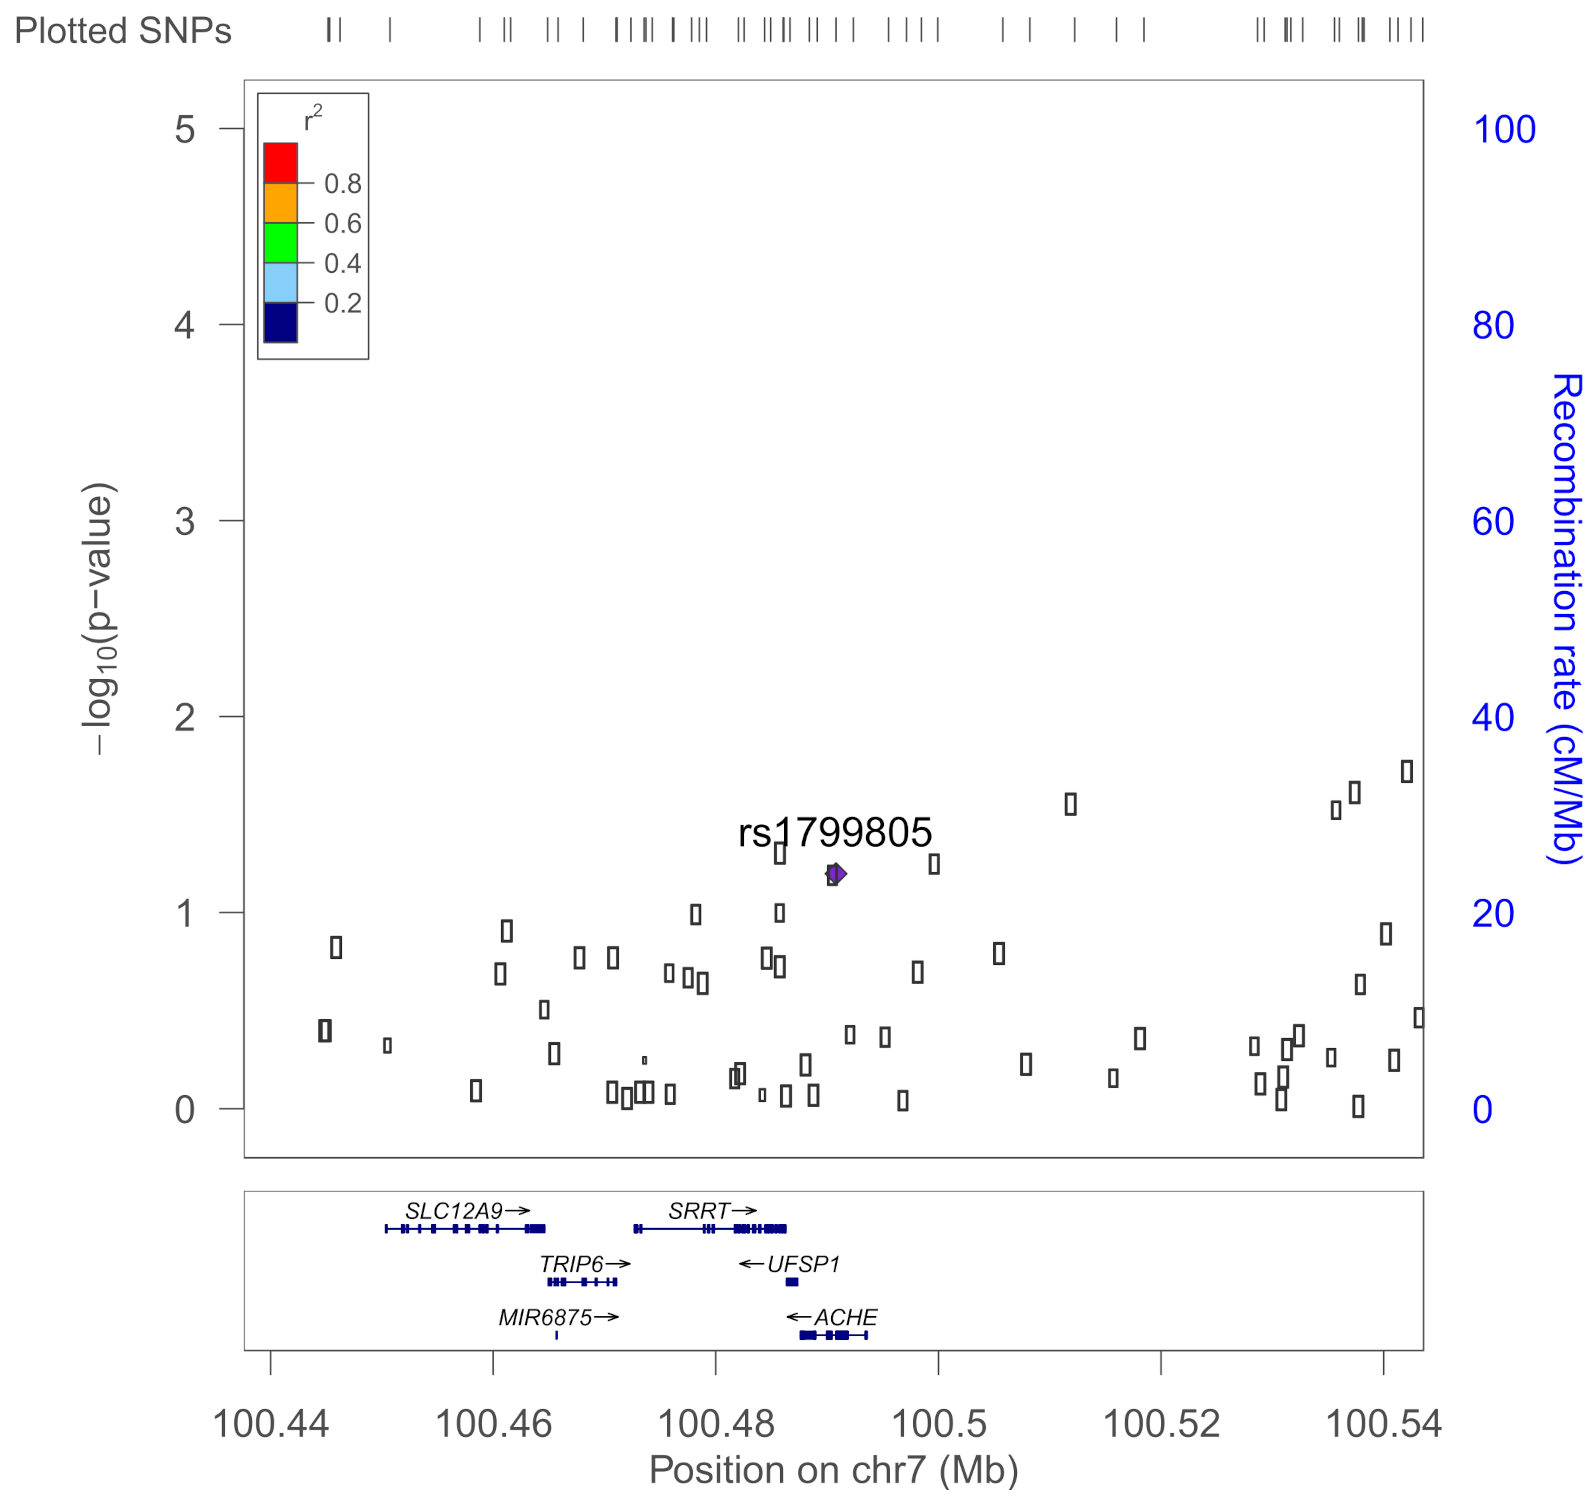
rs1799805ACHEH322N; Yt blood group; 0.037Shapira et al., 2000 [43]
Tier 2 SNPs: Remaining SNPs in BCHE, PON1, ACHE, and SOD1
All SNPs in GWECB that are within 50 kb of the geneGeneLocation (hg19)Number of SNPs
BCHEChr 3. 165490692–165555211 (+/− 50 kb)84
PON1Chr 7. 94926988–94953844 (+/− 50 kb)178
ACHEChr 7. 100487615–100494614 (+/− 50 kb)59
SOD1Chr 21. 33032006–33041244 (+/− 50 kb)53
Table 2. Demographics of deployed veterans by CDC Severe GWI case status, with column percentages.
DemographicsAll (n = 810)CDC Severe GWI
Yes (n = 212)No (n = 598)
SexFemale180 (22%)55 (26%)125 (21%)
Male630 (78%)157 (74%)473 (79%)
Age Group40–49321 (40%)98 (46%)223 (37%)
50–59296 (37%)74 (35%)222 (37%)
60+193 (24%)40 (19%)153 (26%)
Race/EthnicityWhite, non-Hispanic529 (65%)101 (48%)428 (72%)
Black, non-Hispanic137 (17%)43 (20%)94 (16%)
Hispanic76 (9%)37 (17%)39 (7%)
Other or missing68 (8%)31 (15%)37 (6%)
IncomeUnder $30,00084 (10%)33 (16%)51 (9%)
$30,000–59,999179 (22%)60 (28%)119 (20%)
$60,000–99,999239 (30%)65 (31%)174 (29%)
$100,000+246 (30%)35 (17%)211 (35%)
Education ^High school, GED, or less75 (9%)17 (8%)58 (10%)
Some college, or associate’s or bachelor’s degree544 (67%)161 (76%)383 (64%)
Advanced degree166 (20%)24 (11%)142 (24%)
Service
Branch^
Army only366 (45%)114 (54%)252 (42%)
Navy only139 (17%)28 (13%)111 (19%)
Air Force only80 (10%)12 (6%)68 (11%)
Marine Corps only105 (13%)26 (12%)79 (13%)
National Guard, any81 (10%)21 (10%)60 (10%)
Military
Component
Active Duty470 (58%)136 (64%)334 (56%)
Both Active Duty and Reserves208 (26%)59 (28%)149 (25%)
Reserves Only127 (16%)17 (8%)110 (18%)
OEF/OIF
Deployment a
Yes187 (23%)38 (18%)149 (25%)
No614 (76%)168 (79%)446 (75%)
Kansas
Exclusionary Criterion
Yes327 (40%)112 (53%)215 (36%)
No483 (60%)100 (47%)384 (64%)
rs1799807 (BCHE)Homozygous reference (AA)773 (95%)206 (97%)567 (95%)
Heterozygous (AG)36 (4%)6 (3%)30 (5%)
Homozygous Atypical Variant (GG)0 (0%)0 (0%)0 (0%)
rs1799805 (ACHE)Homozygous reference (CC)746 (92%)199 (94%)547 (91%)
Heterozygous (CA)63 (8%)13 (6%)50 (8%)
Homozygous YT variant (AA)0 (0%)0 (0%)0 (0%)
rs662
(PON1)
Homozygous 192Q variant (AA)329 (41%)67 (32%)262 (44%)
Heterozygous (AG)340 (42%)100 (47%)240 (40%)
Homozygous 192R variant (GG)141 (17%)45 (21%)96 (16%)
^ Service Branch and Education do not add to 100%, as ‘missing’ or ‘unknown’ were not presented. a OEF/OIF deployment refers to Operation Enduring Freedom and Operation Iraqi Freedom; veterans who served in these conflicts served after 9/11.
Table 3. Exposure time by CDC Severe GWI case status N (%).
ExposureLength of TimeAllCDC Severe GWI
YesNo
All810212 (26%)598 (74%)
PB pill
exposure
None31155 (18%)256 (82%)
Unclear or missing13841 (30%)97 (70%)
1–6 days9827 (28%)71 (72%)
7–30 days11435 (31%)79 (69%)
31+ days14954 (36%)95 (64%)
Pesticide
exposure
None34667 (19%)279 (81%)
Unclear or missing10637 (35%)69 (65%)
1–30 days7819 (24%)59 (76%)
31–62 days12437 (30%)87 (70%)
63+ days15652 (33%)104 (67%)
Table 4. Tier 1 candidate SNP results for CDC Severe GWI, three CDC Severe subdomains, Kansas GWI case definition and six Kansas subdomains. OR and p-values are from the interaction term of the logistic regression, adjusted for age, sex, Kansas exclusionary criterion, education, and income.
OutcomeExposureACHEBCHEPON1
rs1799805rs1799807rs662
ORpORpORp
CDC Severe GWIPB1.110.7250.930.8481.220.049 *
CDC Severe: FatiguePB1.500.2681.630.2541.210.105
CDC Severe: Mood/CognitivePB1.050.8561.130.7211.130.201
CDC Severe: MusculoskeletalPB0.990.9530.860.6391.130.202
Kansas GWI symptom criteriaPB0.930.8211.280.5990.990.923
Kansas: FatiguePB0.930.8381.010.9791.030.814
Kansas: PainPB1.260.4431.610.3561.160.225
Kansas: GastrointestinalPB0.960.8831.180.6140.960.663
Kansas: RespiratoryPB1.150.5810.950.8681.180.080
Kansas: Mood/Neurological/
Cognitive
PB0.580.2511.090.8551.210.278
Kansas: SkinPB0.590.042 *1.30.4081.010.897
CDC Severe GWIPesticides0.670.1790.780.5481.070.485
CDC Severe: FatiguePesticides0.890.7391.270.5871.140.235
CDC Severe: Mood/CognitivePesticides0.650.1231.170.6761.000.958
CDC Severe: MusculoskeletalPesticides0.610.0630.950.8871.040.684
Kansas GWI symptom criteriaPesticides0.600.1282.110.1891.050.660
Kansas: FatiguePesticides0.760.4840.630.2810.970.815
Kansas: PainPesticides0.670.1511.470.3621.170.185
Kansas: GastrointestinalPesticides0.840.4901.110.7470.820.029 *
Kansas: RespiratoryPesticides0.660.1031.390.3201.000.970
Kansas: Mood/Neurological/
Cognitive
Pesticides1.090.8931.720.3531.110.562
Kansas: SkinPesticides0.650.0981.280.4511.000.96
* Statistically significant with p < 0.05.
Table 5. Top results for the Tier 2 SNP/PB interactions among the 384 tested SNPs across all GWI outcomes (p = 0.00013). From left to right, the top SNPs associated with: respiratory symptoms in interaction with PB pills (rs3917545), CDC Severe GWI in interactions with PB pill exposure (rs2299260), and CDC Severe GWI in interactions with pesticide exposure (rs62567349). Significant interactions are starred. Top interactions in each candidate gene are bolded.
OutcomeExposurePON1PON1PON1
rs3917545rs2299260rs62467349
ORpORpORp
CDC Severe GWIPB1.453.20 × 10−20.685.00 × 10−31.395.50 × 10−2
CDC Severe: FatiguePB1.542.50 × 10−20.647.60 × 10−31.523.10 × 10−2
CDC Severe: Mood/CognitivePB1.251.70 × 10−10.821.20 × 10−11.232.10 × 10−1
CDC Severe: MusculoskeletalPB1.442.80 × 10−20.763.00 × 10−21.385.00 × 10−2
Kansas GWI symptom criteriaPB1.233.20 × 10−10.999.70 × 10−11.233.20 × 10−1
Kansas: PainPB1.282.30 × 10−10.733.50 × 10−21.311.90 × 10−1
Kansas: GastrointestinalPB1.095.90 × 10−10.796.10 × 10−21.038.60 × 10−1
Kansas: Mood/Neurological/CognitivePB2.303.30 × 10−20.895.60 × 10−12.184.40 × 10−2
Kansas: FatiguePB1.145.70 × 10−10.957.90 × 10−11.135.80 × 10−1
Kansas: RespiratoryPB2.004.1 × 10−5 *0.785.50 × 10−21.862.00 × 10−4
Kansas: SkinPB1.115.20 × 10−10.924.80 × 10−11.115.10 × 10−1
CDC Severe GWIPesticides1.452.20 × 10−20.893.70 × 10−11.548.60 × 10−3
CDC Severe: FatiguePesticides1.415.70 × 10−20.978.60 × 10−11.387.50 × 10−2
CDC Severe: Mood/CognitivePesticides1.057.70 × 10−10.945.90 × 10−11.076.50 × 10−1
CDC Severe: MusculoskeletalPesticides1.192.40 × 10−10.862.20 × 10−11.261.40 × 10−1
Kansas GWI symptom criteriaPesticides1.301.80 × 10−10.852.70 × 10−11.371.20 × 10−1
Kansas: PainPesticides0.999.50 × 10−11.057.30 × 10−11.057.80 × 10−1
Kansas: GastrointestinalPesticides0.842.20 × 10−11.075.50 × 10−10.832.00 × 10−1
Kansas: Mood/Neurological/CognitivePesticides1.411.90 × 10−10.864.30 × 10−11.382.20 × 10−1
Kansas: FatiguePesticides0.999.60 × 10−10.791.40 × 10−11.038.80 × 10−1
Kansas: RespiratoryPesticides1.281.00 × 10−10.988.80 × 10−11.271.10 × 10−1
Kansas: SkinPesticides1.047.90 × 10−11.094.90 × 10−10.999.20 × 10−1
Publisher’s Note: MDPI stays neutral with regard to jurisdictional claims in published maps and institutional affiliations.

