
Resting-State Neural-Activity Alterations in Subacute Aphasia after Stroke

 ,
,
Abstract
:
1. Introduction
2. Materials and Methods
2.1. Participants
2.2. Language Assessment
2.3. Neuroimaging Data Acquisition
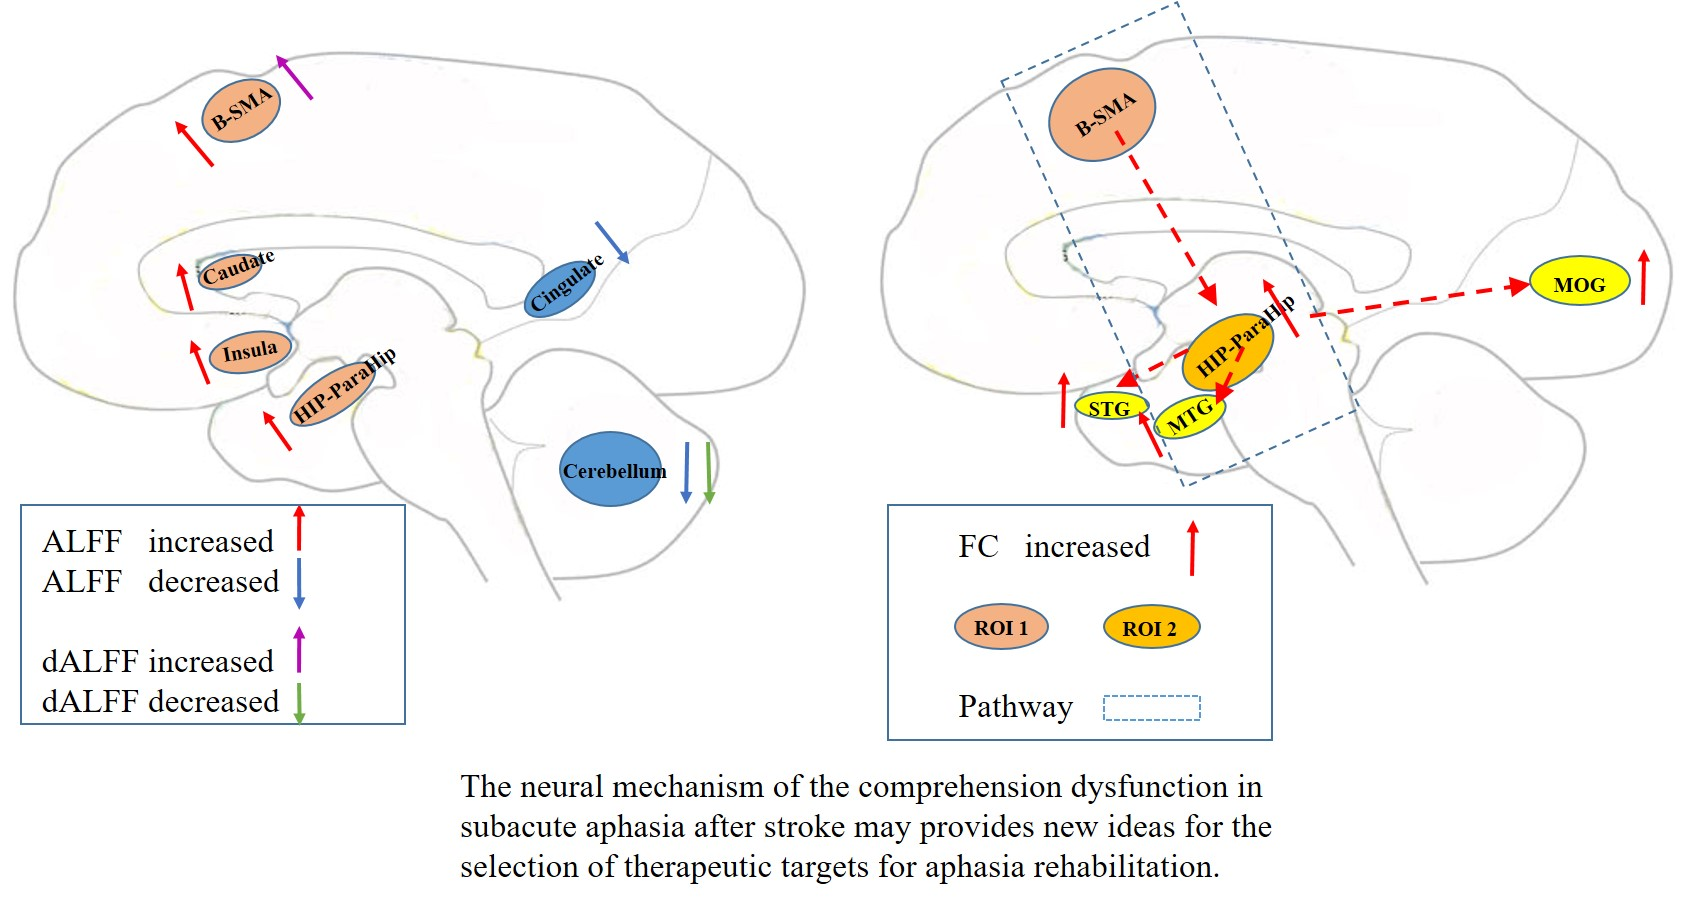
2.4. Lesion Mapping
2.5. Neuroimaging Data Preprocessing
2.6. ALFF and dALFF Analysis
2.7. FC Analysis
2.8. Statistical Analysis
3. Results
3.1. Demographic and Clinical Features
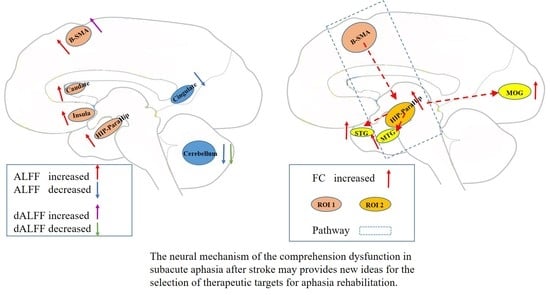
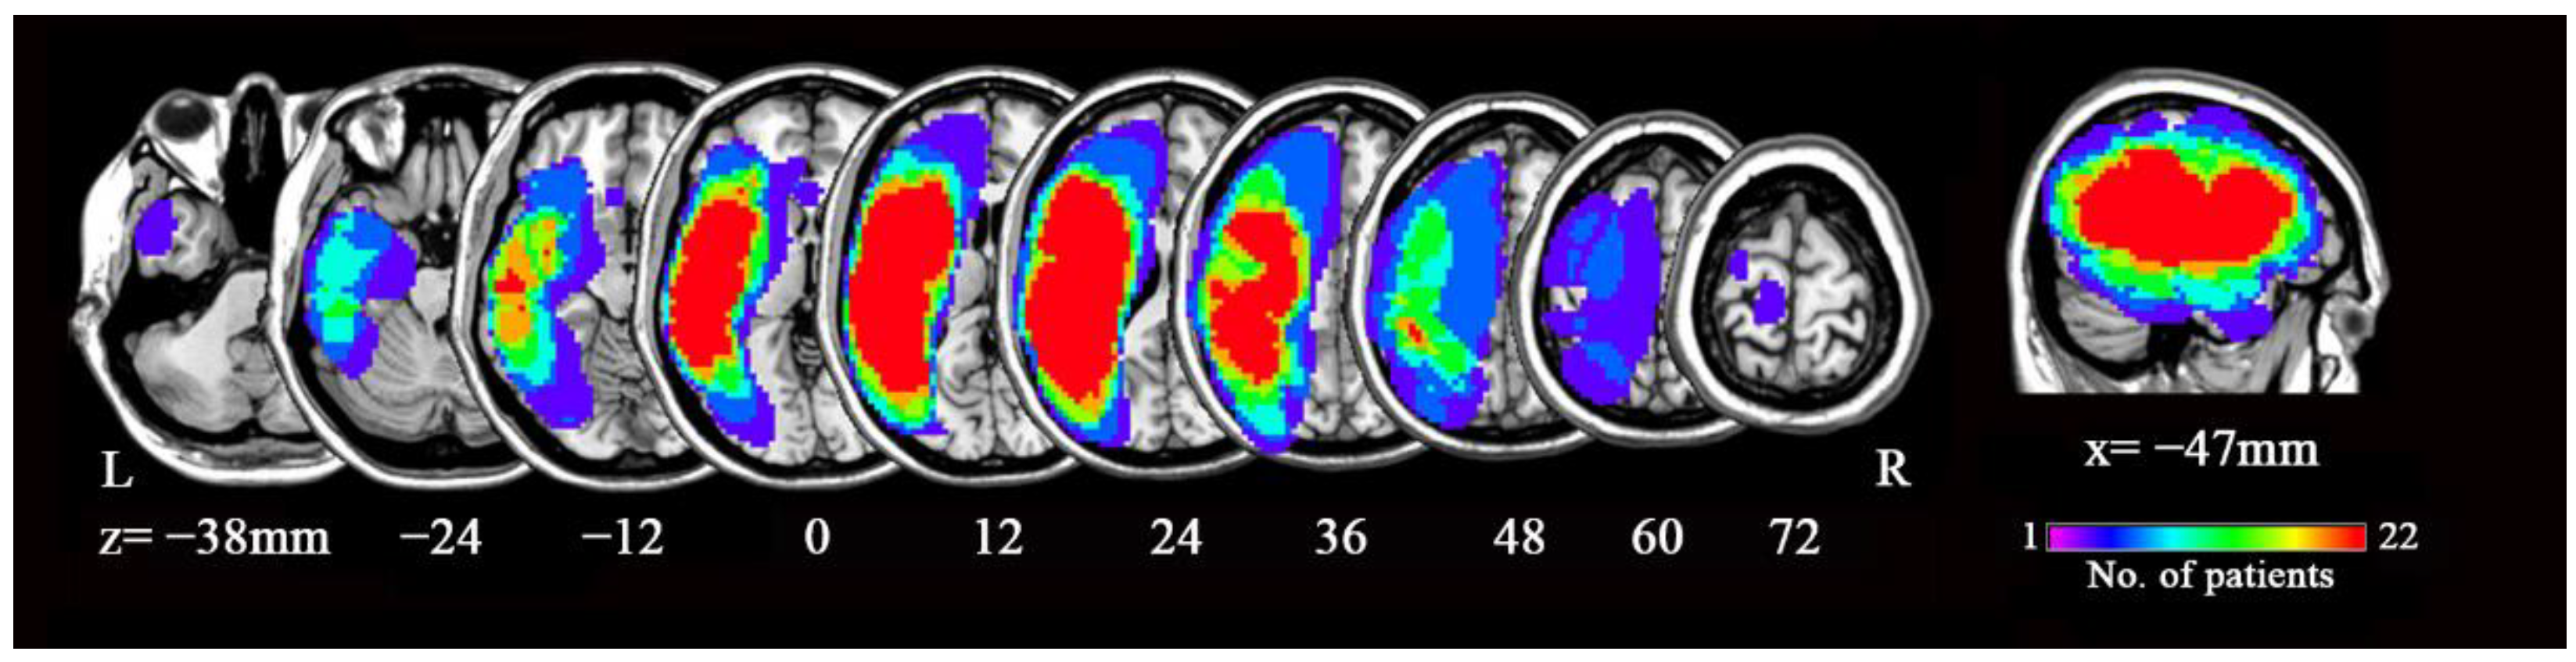
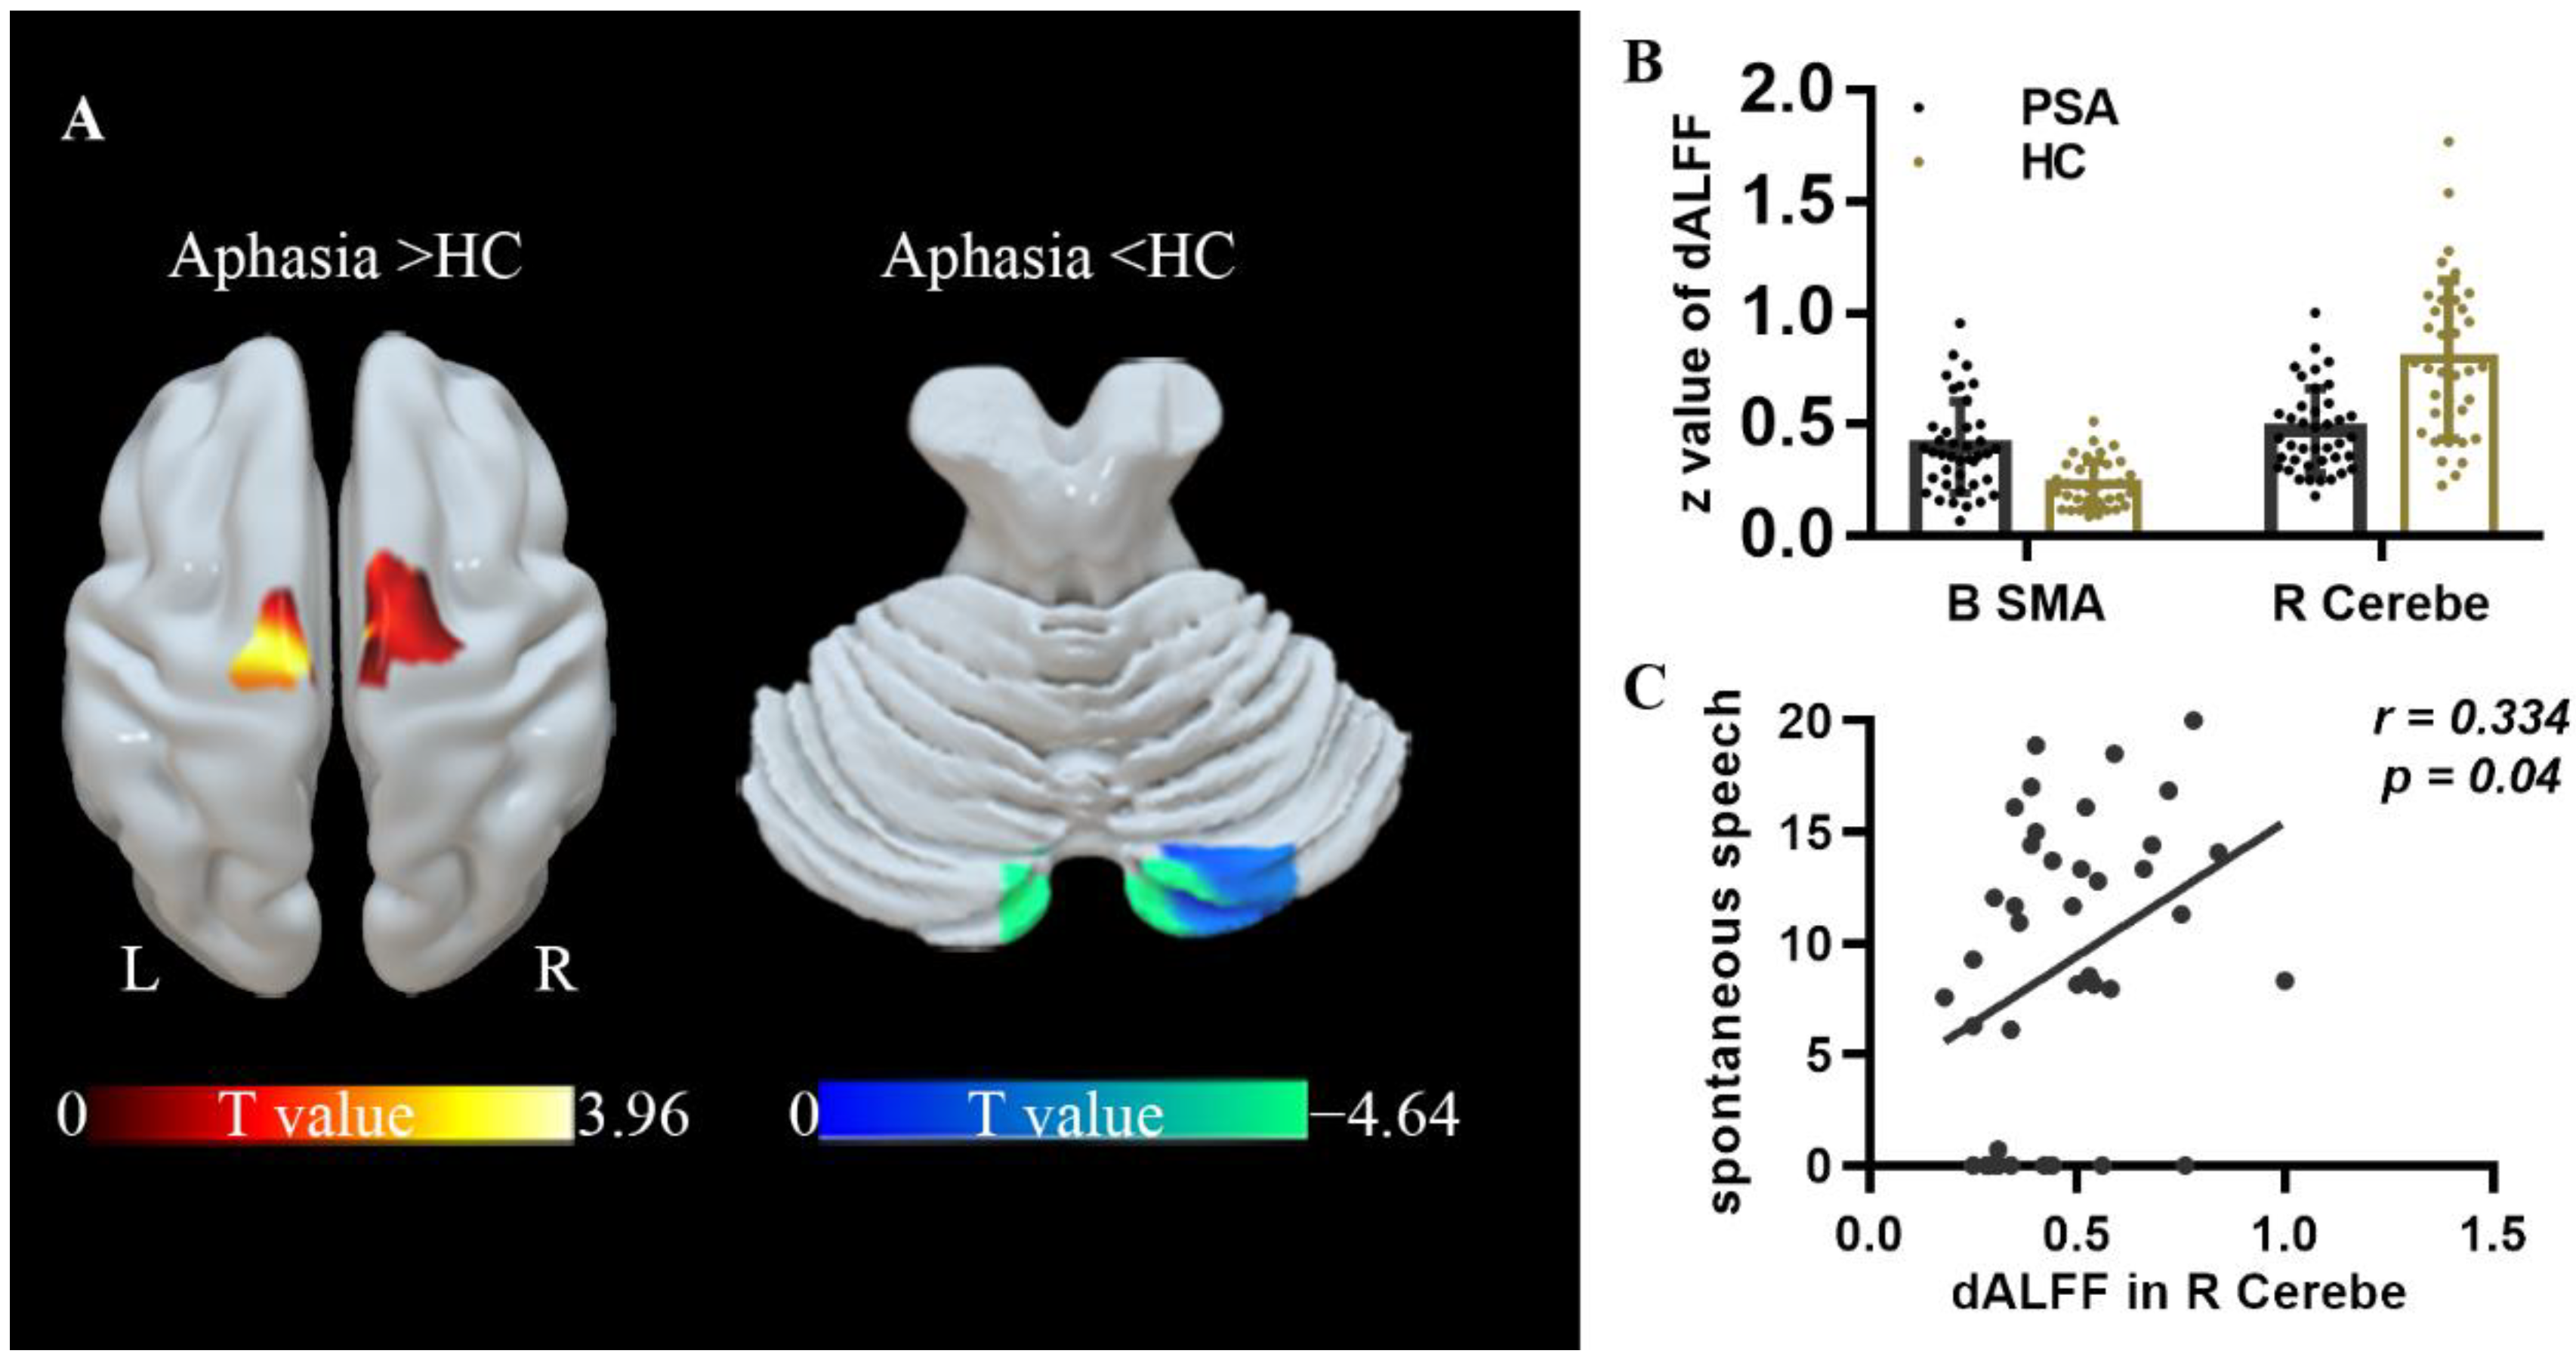
3.2. ALFF Contrast
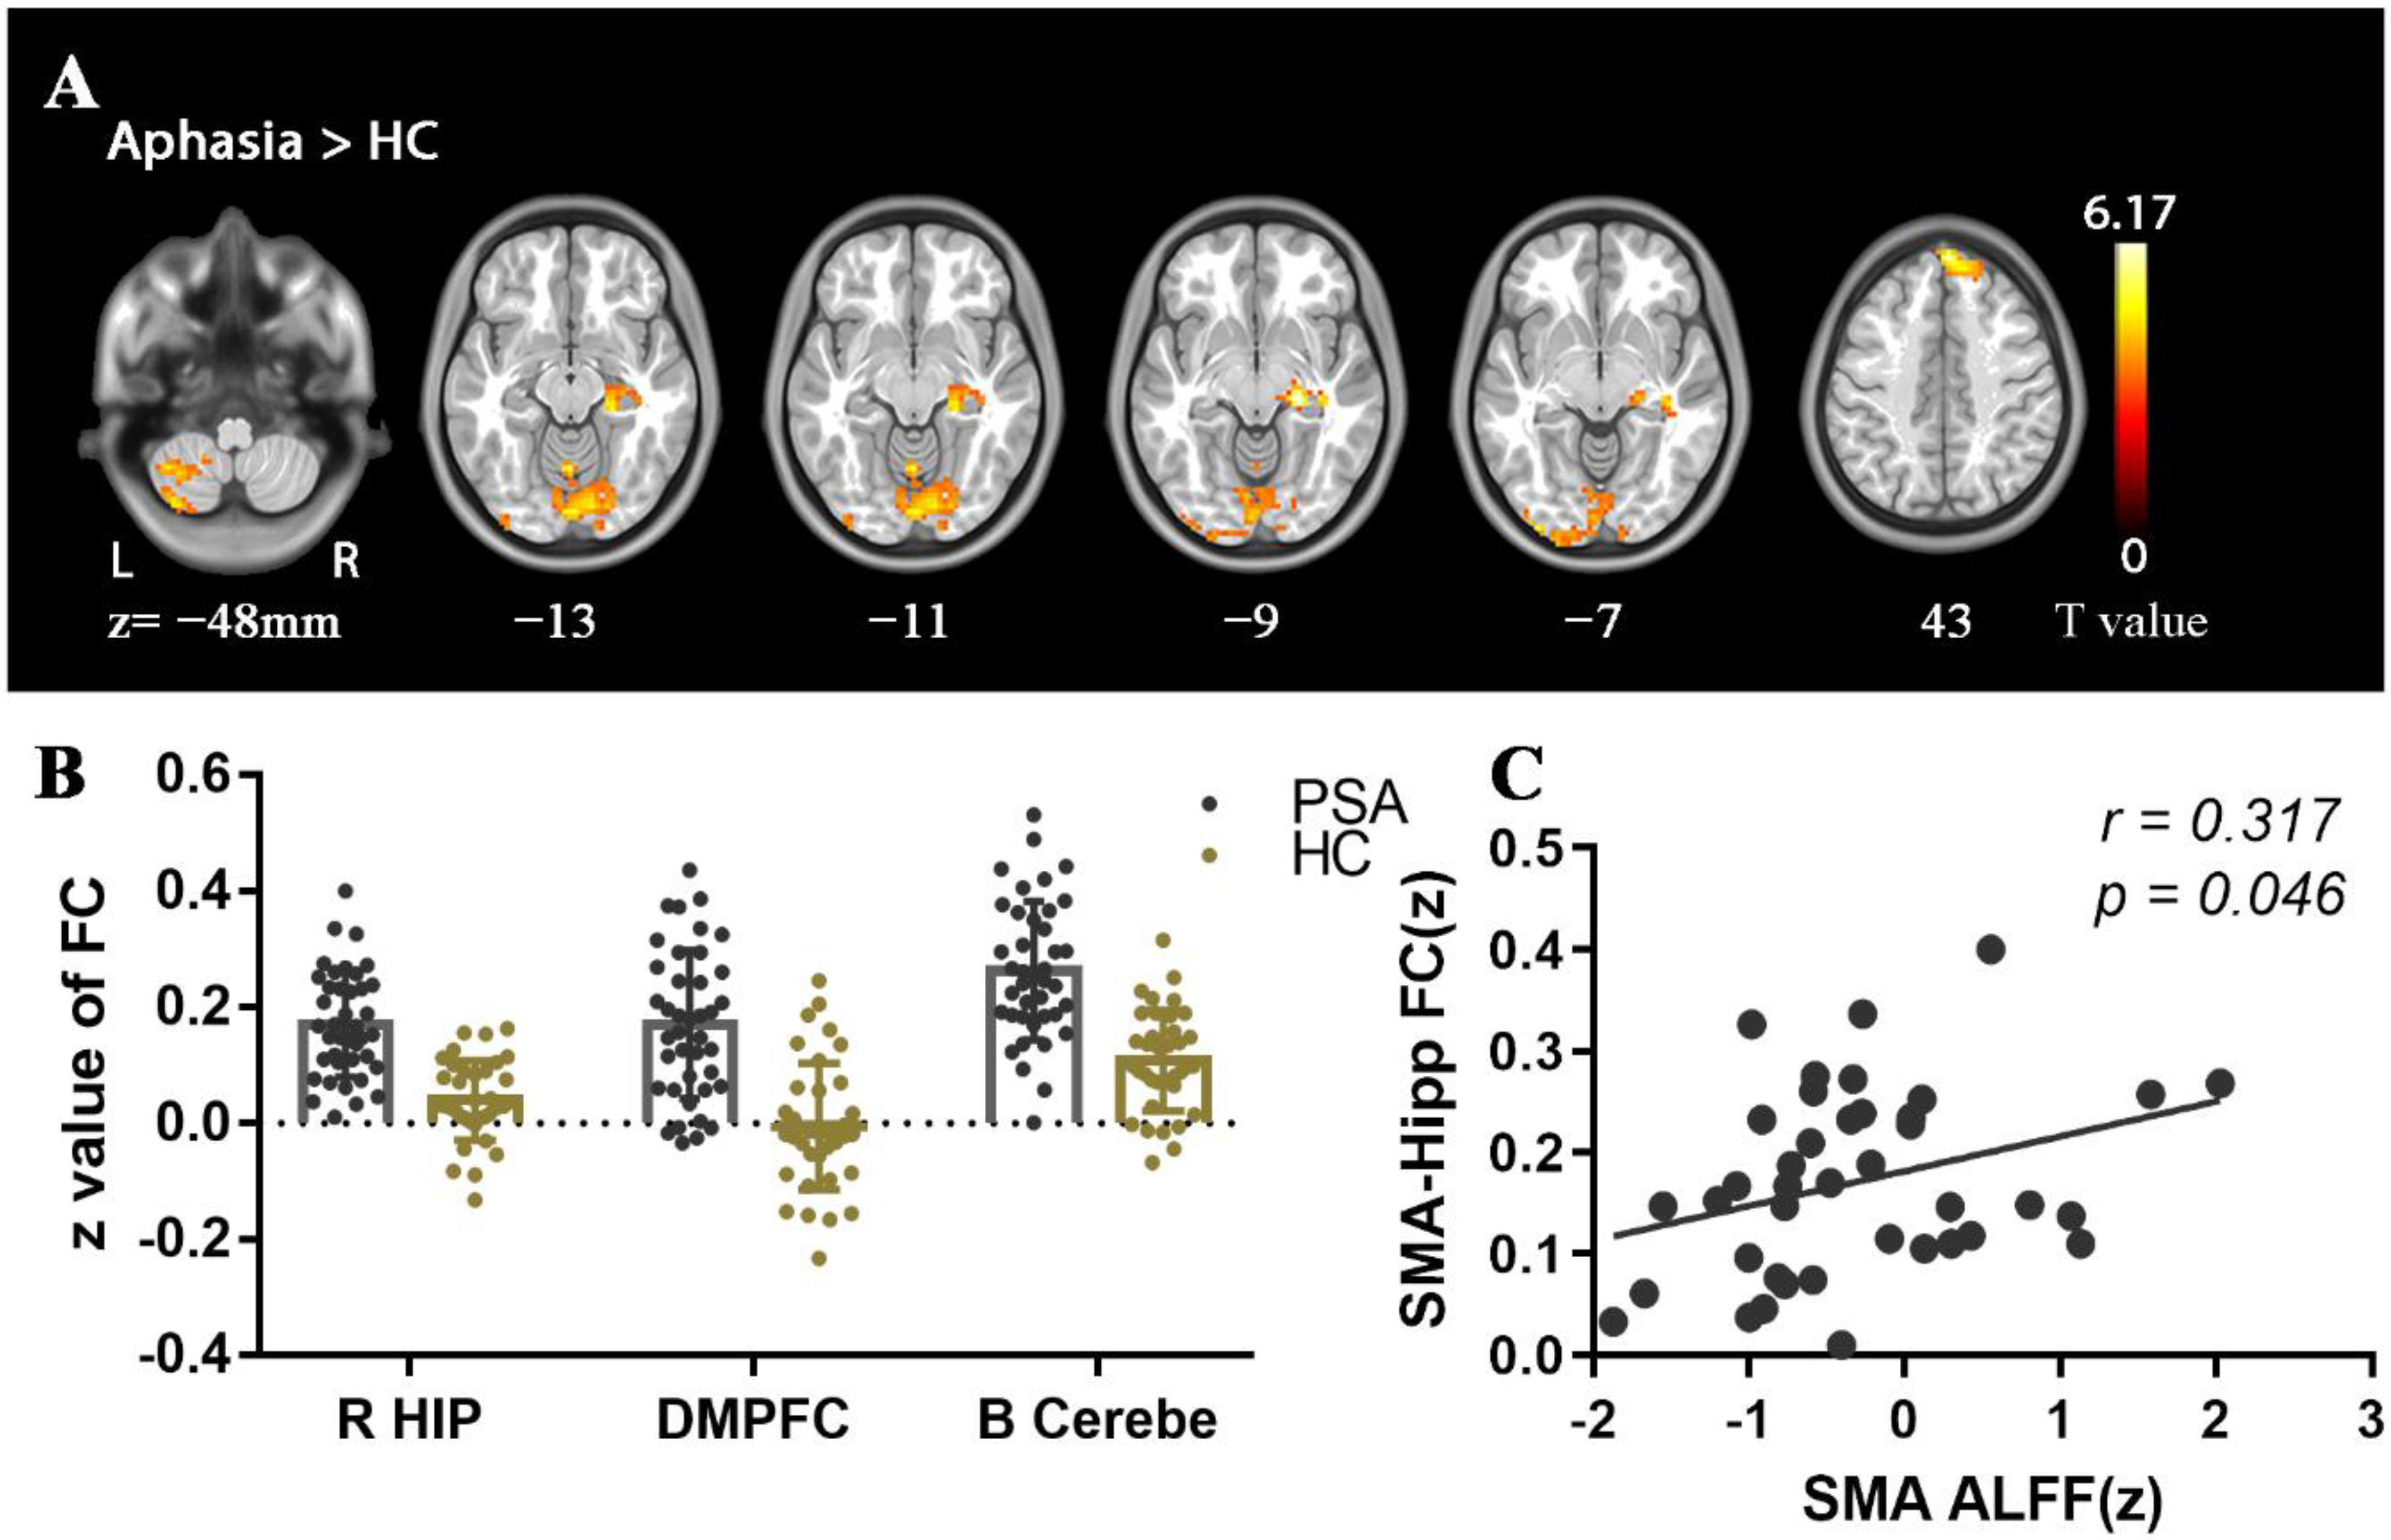
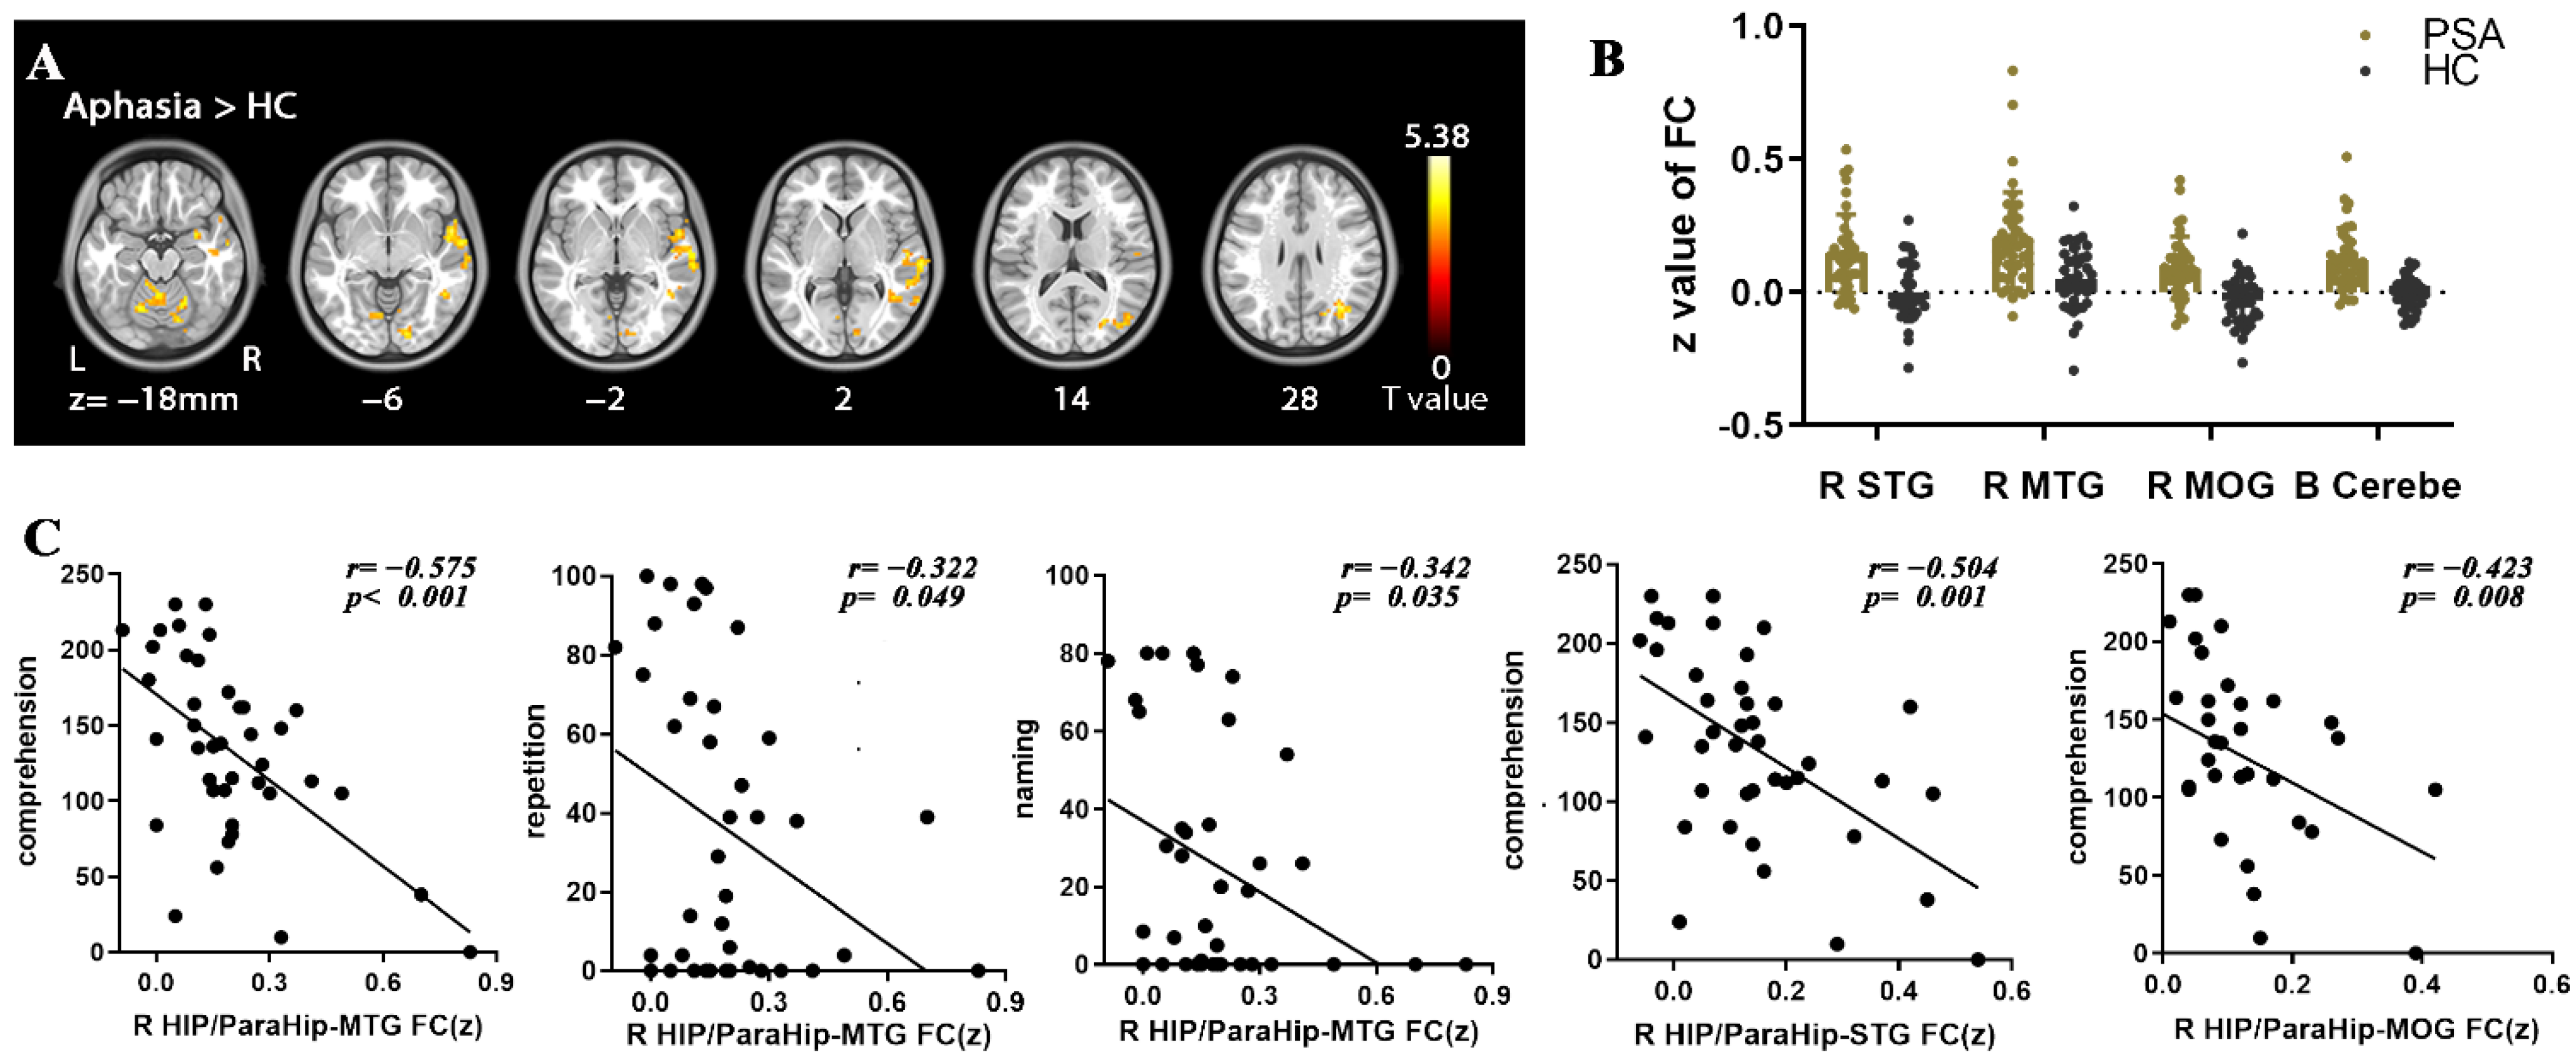
3.3. FC Contrast
3.4. Correlational Analysis
4. Discussion
5. Conclusions
Supplementary Materials
Author Contributions
Funding
Institutional Review Board Statement
Informed Consent Statement
Data Availability Statement
Acknowledgments
Conflicts of Interest
References
- Engelter, S.T.; Gostynski, M.; Papa, S.; Frei, M.; Born, C.; Ajdacic-Gross, V.; Gutzwiller, F.; Lyrer, P.A. Epidemiology of aphasia attributable to first ischemic stroke: Incidence, severity, fluency, etiology, and thrombolysis. Stroke 2006, 37, 1379–1384. [Google Scholar] [CrossRef] [PubMed] [Green Version]
- Pedersen, P.M.; Vinter, K.; Olsen, T.S. Aphasia after stroke: Type, severity and prognosis. The Copenhagen aphasia study. Cerebrovasc. Dis. 2004, 17, 35–43. [Google Scholar] [CrossRef] [PubMed]
- Ellis, C.; Simpson, A.N.; Bonilha, H.; Mauldin, P.D.; Simpson, K.N. The one-year attributable cost of poststroke aphasia. Stroke 2012, 43, 1429–1431. [Google Scholar] [CrossRef] [PubMed]
- Lam, J.M.; Wodchis, W.P. The relationship of 60 disease diagnoses and 15 conditions to preference-based health-related quality of life in Ontario hospital-based long-term care residents. Med. Care 2010, 48, 380–387. [Google Scholar] [CrossRef] [PubMed]
- Hermann, D.M.; Chopp, M. Promoting brain remodelling and plasticity for stroke recovery: Therapeutic promise and potential pitfalls of clinical translation. Lancet Neurol. 2012, 11, 369–380. [Google Scholar] [CrossRef] [Green Version]
- Rehabilitation, recovery of peop LEwAaSC: Predictors of Poststroke Aphasia Recovery: A Systematic Review-Informed Individual Participant Data Meta-Analysis. Stroke 2021, 52, 1778–1787. [CrossRef]
- Vitti, E.; Hillis, A.E. Treatment of post-stroke aphasia: A narrative review for stroke neurologists. Int. J. Stroke 2021, 16, 1002–1008. [Google Scholar] [CrossRef]
- Fridriksson, J.; Hillis, A.E. Current Approaches to the Treatment of Post-Stroke Aphasia. J. Stroke 2021, 23, 183–201. [Google Scholar] [CrossRef]
- Godecke, E.; Armstrong, E.; Rai, T.; Ciccone, N.; Rose, M.L.; Middleton, S.; Whitworth, A.; Holland, A.; Ellery, F.; Hankey, G.J.; et al. A randomized control trial of intensive aphasia therapy after acute stroke: The Very Early Rehabilitation for SpEech (VERSE) study. Int. J. Stroke 2021, 16, 556–572. [Google Scholar] [CrossRef]
- Spielmann, K.; van de Sandt-Koenderman, W.M.E.; Heijenbrok-Kal, M.H.; Ribbers, G.M. Transcranial Direct Current Stimulation Does Not Improve Language Outcome in Subacute Poststroke Aphasia. Stroke 2018, 49, 1018–1020. [Google Scholar] [CrossRef]
- Jiang, Y.; Duan, M.; Li, X.; Huang, H.; Zhao, G.; Li, X.; Li, S.; Song, X.; He, H.; Yao, D.; et al. Function-structure coupling: White matter functional magnetic resonance imaging hyper-activation associates with structural integrity reductions in schizophrenia. Hum. Brain Mapp. 2021, 42, 4022–4034. [Google Scholar] [CrossRef] [PubMed]
- van Oers, C.A.; Vink, M.; van Zandvoort, M.J.; van der Worp, H.B.; de Haan, E.H.; Kappelle, L.J.; Ramsey, N.F.; Dijkhuizen, R.M. Contribution of the left and right inferior frontal gyrus in recovery from aphasia. A functional MRI study in stroke patients with preserved hemodynamic responsiveness. Neuroimage 2010, 49, 885–893. [Google Scholar] [CrossRef] [PubMed]
- Winhuisen, L.; Thiel, A.; Schumacher, B.; Kessler, J.; Rudolf, J.; Haupt, W.F.; Heiss, W.D. The right inferior frontal gyrus and poststroke aphasia: A follow-up investigation. Stroke 2007, 38, 1286–1292. [Google Scholar] [CrossRef] [PubMed] [Green Version]
- Richter, M.; Miltner, W.H.; Straube, T. Association between therapy outcome and right-hemispheric activation in chronic aphasia. Brain 2008, 131 Pt 5, 1391–1401. [Google Scholar] [CrossRef] [PubMed] [Green Version]
- Fox, M.D.; Raichle, M.E. Spontaneous fluctuations in brain activity observed with functional magnetic resonance imaging. Nat. Rev. Neurosci. 2007, 8, 700–711. [Google Scholar] [CrossRef]
- Li, J.L.; Du, D.R.; Gao, W.; Sun, X.C.; Xie, H.Z.; Zhang, G.; Li, J.; Li, H.L.; Li, K.F. The regional neuronal activity in left posterior middle temporal gyrus is correlated with the severity of chronic aphasia. Neuropsych. Dis. Treat. 2017, 13, 1937–1945. [Google Scholar] [CrossRef] [Green Version]
- van Hees, S.; McMahon, K.; Angwin, A.; de Zubicaray, G.; Read, S.; Copland, D.A. A Functional MRI Study of the Relationship Between Naming Treatment Outcomes and Resting State Functional Connectivity in Post-Stroke Aphasia. Hum. Brain Mapp. 2014, 35, 3919–3931. [Google Scholar] [CrossRef]
- Yang, M.; Li, J.; Li, Y.; Li, R.; Pang, Y.; Yao, D.; Liao, W.; Chen, H. Altered Intrinsic Regional Activity and Interregional Functional Connectivity in Post-stroke Aphasia. Sci. Rep. 2016, 6, 24803. [Google Scholar] [CrossRef] [Green Version]
- Wei, T.; Liang, X.; He, Y.; Zang, Y.; Han, Z.; Caramazza, A.; Bi, Y. Predicting conceptual processing capacity from spontaneous neuronal activity of the left middle temporal gyrus. J. Neurosci. 2012, 32, 481–489. [Google Scholar] [CrossRef]
- Guo, J.; Biswal, B.B.; Han, S.; Li, J.; Yang, S.; Yang, M.; Chen, H. Altered dynamics of brain segregation and integration in poststroke aphasia. Hum. Brain Mapp. 2019, 40, 3398–3409. [Google Scholar] [CrossRef] [Green Version]
- Ma, S.; Calhoun, V.D.; Phlypo, R.; Adali, T. Dynamic changes of spatial functional network connectivity in healthy individuals and schizophrenia patients using independent vector analysis. Neuroimage 2014, 90, 196–206. [Google Scholar] [CrossRef] [PubMed] [Green Version]
- Siegel, J.S.; Ramsey, L.E.; Snyder, A.Z.; Metcalf, N.V.; Chacko, R.V.; Weinberger, K.; Baldassarre, A.; Hacker, C.D.; Shulman, G.L.; Corbetta, M. Disruptions of network connectivity predict impairment in multiple behavioral domains after stroke. Proc. Natl. Acad. Sci. USA 2016, 113, E4367–E4376. [Google Scholar] [CrossRef] [PubMed] [Green Version]
- Carter, A.R.; Shulman, G.L.; Corbetta, M. Why use a connectivity-based approach to study stroke and recovery of function? Neuroimage 2012, 62, 2271–2280. [Google Scholar] [CrossRef] [PubMed] [Green Version]
- Gao, S.R.; Chu, Y.F.; Shi, S.Q.; Peng, Y.; Dai, S.D.; Wang, M.H. A standardization research of the aphasia battery of Chinese. Chin. Ment. Health J. 1992, 6, 125–128. [Google Scholar]
- Zhang, N.; Xia, M.; Qiu, T.; Wang, X.; Lin, C.P.; Guo, Q.; Lu, J.; Wu, Q.; Zhuang, D.; Yu, Z.; et al. Reorganization of cerebro-cerebellar circuit in patients with left hemispheric gliomas involving language network: A combined structural and resting-state functional MRI study. Hum. Brain Mapp. 2018, 39, 4802–4819. [Google Scholar] [CrossRef]
- Yan, C.-G.; Yan, Z. DPARSF: A MATLAB Toolbox for “Pipeline” Data Analysis of Resting-State fMRI. Front. Syst. Neurosci. 2010, 4, 13. [Google Scholar] [CrossRef] [Green Version]
- Song, X.W.; Dong, Z.Y.; Long, X.Y.; Li, S.F.; Zuo, X.N.; Zhu, C.Z.; He, Y.; Yan, C.G.; Zang, Y.F. REST: A toolkit for resting-state functional magnetic resonance imaging data processing. PLoS ONE 2011, 6, e25031. [Google Scholar] [CrossRef]
- Brett, M.; Leff, A.P.; Rorden, C.; Ashburner, J. Spatial normalization of brain images with focal lesions using cost function masking. Neuroimage 2001, 14, 486–500. [Google Scholar] [CrossRef] [Green Version]
- Yang, M.; Yang, P.; Fan, Y.S.; Li, J.; Yao, D.; Liao, W.; Chen, H. Altered Structure and Intrinsic Functional Connectivity in Post-stroke Aphasia. Brain Topogr. 2018, 31, 300–310. [Google Scholar] [CrossRef]
- Zang, Y.F.; He, Y.; Zhu, C.Z.; Cao, Q.J.; Sui, M.Q.; Liang, M.; Tian, L.X.; Jiang, T.Z.; Wang, Y.F. Altered baseline brain activity in children with ADHD revealed by resting-state functional MRI. Brain Dev. 2007, 29, 83–91. [Google Scholar] [CrossRef]
- Liao, W.; Wu, G.R.; Xu, Q.; Ji, G.J.; Zhang, Z.; Zang, Y.F.; Lu, G. DynamicBC: A MATLAB toolbox for dynamic brain connectome analysis. Brain Connect. 2014, 4, 780–790. [Google Scholar] [CrossRef] [PubMed] [Green Version]
- de Lacy, N.; Doherty, D.; King, B.H.; Rachakonda, S.; Calhoun, V.D. Disruption to control network function correlates with altered dynamic connectivity in the wider autism spectrum. Neuroimage Clin. 2017, 15, 513–524. [Google Scholar] [CrossRef] [PubMed]
- Hertrich, I.; Dietrich, S.; Ackermann, H. The role of the supplementary motor area for speech and language processing. Neurosci. Biobehav. Rev. 2016, 68, 602–610. [Google Scholar] [CrossRef] [PubMed]
- Courson, M.; Macoir, J.; Tremblay, P. Role of medial premotor areas in action language processing in relation to motor skills. Cortex 2017, 95, 77–91. [Google Scholar] [CrossRef] [PubMed] [Green Version]
- Botha, H.; Utianski, R.L.; Whitwell, J.L.; Duffy, J.R.; Clark, H.M.; Strand, E.A.; Machulda, M.M.; Tosakulwong, N.; Knopman, D.S.; Petersen, R.C.; et al. Disrupted functional connectivity in primary progressive apraxia of speech. Neuroimage Clin. 2018, 18, 617–629. [Google Scholar] [CrossRef]
- Saur, D.; Lange, R.; Baumgaertner, A.; Schraknepper, V.; Willmes, K.; Rijntjes, M.; Weiller, C. Dynamics of language reorganization after stroke. Brain 2006, 129, 1371–1384. [Google Scholar] [CrossRef] [Green Version]
- Geranmayeh, F.; Chau, T.W.; Wise, R.J.S.; Leech, R.; Hampshire, A. Domain-general subregions of the medial prefrontal cortex contribute to recovery of language after stroke. Brain 2017, 140, 1947–1958. [Google Scholar] [CrossRef] [Green Version]
- Stockert, A.; Wawrzyniak, M.; Klingbeil, J.; Wrede, K.; Kummerer, D.; Hartwigsen, G.; Kaller, C.P.; Weiller, C.; Saur, D. Dynamics of language reorganization after left temporo-parietal and frontal stroke. Brain 2020, 143, 844–861. [Google Scholar] [CrossRef]
- Utianski, R.L.; Duffy, J.R.; Clark, H.M.; Strand, E.A.; Botha, H.; Schwarz, C.G.; Machulda, M.M.; Senjem, M.L.; Spychalla, A.J.; Jack, C.R., Jr.; et al. Prosodic and phonetic subtypes of primary progressive apraxia of speech. Brain Lang 2018, 184, 54–65. [Google Scholar] [CrossRef]
- Marien, P.; Ackermann, H.; Adamaszek, M.; Barwood, C.H.; Beaton, A.; Desmond, J.; De Witte, E.; Fawcett, A.J.; Hertrich, I.; Kuper, M.; et al. Consensus paper: Language and the cerebellum: An ongoing enigma. Cerebellum 2014, 13, 386–410. [Google Scholar] [CrossRef]
- Stoodley, C.J.; Schmahmann, J.D. Functional topography in the human cerebellum: A meta-analysis of neuroimaging studies. Neuroimage 2009, 44, 489–501. [Google Scholar] [CrossRef] [PubMed]
- Stoodley, C.J.; Valera, E.M.; Schmahmann, J.D. Functional topography of the cerebellum for motor and cognitive tasks: An fMRI study. Neuroimage 2012, 59, 1560–1570. [Google Scholar] [CrossRef] [PubMed] [Green Version]
- Zhang, X.; Chen, Z.; Li, N.; Liang, J.; Zou, Y.; Wu, H.; Kang, Z.; Dou, Z.; Qiu, W. Regional Alteration within the Cerebellum and the Reorganization of the Cerebrocerebellar System following Poststroke Aphasia. Neural. Plast. 2022, 2022, 3481423. [Google Scholar] [CrossRef]
- Carrera, E.; Tononi, G. Diaschisis: Past, present, future. Brain 2014, 137 Pt 9, 2408–2422. [Google Scholar] [CrossRef] [Green Version]
- Wawrzyniak, M.; Schneider, H.R.; Klingbeil, J.; Stockert, A.; Hartwigsen, G.; Weiller, C.; Saur, D. Resolution of diaschisis contributes to early recovery from post-stroke aphasia. Neuroimage 2022, 251, 119001. [Google Scholar] [CrossRef] [PubMed]
- Sebastian, R.; Kim, J.H.; Brenowitz, R.; Tippett, D.C.; Desmond, J.E.; Celnik, P.A.; Hillis, A.E. Cerebellar neuromodulation improves naming in post-stroke aphasia. Brain Commun. 2020, 2, fcaa179. [Google Scholar] [CrossRef] [PubMed]
- Piai, V.; Anderson, K.L.; Lin, J.J.; Dewar, C.; Parvizi, J.; Dronkers, N.F.; Knight, R.T. Direct brain recordings reveal hippocampal rhythm underpinnings of language processing. Proc. Natl. Acad. Sci. USA 2016, 113, 11366–11371. [Google Scholar] [CrossRef] [Green Version]
- Walenski, M.; Europa, E.; Caplan, D.; Thompson, C.K. Neural networks for sentence comprehension and production: An ALE-based meta-analysis of neuroimaging studies. Hum. Brain Mapp. 2019, 40, 2275–2304. [Google Scholar] [CrossRef] [Green Version]
- Bonilha, L.; Hillis, A.E.; Hickok, G.; den Ouden, D.B.; Rorden, C.; Fridriksson, J. Temporal lobe networks supporting the comprehension of spoken words. Brain 2017, 140, 2370–2380. [Google Scholar] [CrossRef] [Green Version]
- Awad, M.; Warren, J.E.; Scott, S.K.; Turkheimer, F.E.; Wise, R.J. A common system for the comprehension and production of narrative speech. J. Neurosci. 2007, 27, 11455–11464. [Google Scholar] [CrossRef] [Green Version]
- Silbert, L.J.; Honey, C.J.; Simony, E.; Poeppel, D.; Hasson, U. Coupled neural systems underlie the production and comprehension of naturalistic narrative speech. Proc. Natl. Acad. Sci. USA 2014, 111, E4687–E4696. [Google Scholar] [CrossRef] [PubMed] [Green Version]
- Gainotti, G. Contrasting opinions on the role of the right hemisphere in the recovery of language. A critical survey. Aphasiology 2015, 29, 1020–1037. [Google Scholar] [CrossRef]
- Heiss, W.D. WSO Leadership in Stroke Medicine Award Lecture Vienna, September 26, 2008: Functional imaging correlates to disturbance and recovery of language function. Int. J. Stroke 2009, 4, 129–136. [Google Scholar] [CrossRef] [PubMed]
- Postman-Caucheteux, W.A.; Birn, R.M.; Pursley, R.H.; Butman, J.A.; Solomon, J.M.; Picchioni, D.; McArdle, J.; Braun, A.R. Single-trial fMRI shows contralesional activity linked to overt naming errors in chronic aphasic patients. J. Cogn. Neurosci. 2010, 22, 1299–1318. [Google Scholar] [CrossRef] [PubMed] [Green Version]
- Meinzer, M.; Breitenstein, C. Functional imaging studies of treatment-induced recovery in chronic aphasia. Aphasiology 2008, 22, 1251–1268. [Google Scholar] [CrossRef]


| Patients | HCs | p Value | |
|---|---|---|---|
| Sample size (n) | 40 | 37 | |
| Sex (male/female) | 31/9 | 25/12 | 0.328 ** |
| Age(years) § | 57.35 (11.79) | 55.14 (11.39) | 0.405 ‡ |
| Education(years) § | 7.58 (5.09) | 9.64 (4.97) | 0.077 ‡ |
| Handedness (left/right) | 0/40 | 0/37 | - |
| Lesion volume (cm3) †† | 39.29 (14.69, 79.08) | - | - |
| Disease duration (weeks) †† | 2(1, 5.75) | - | - |
| ABC scores | - | - | |
| Spontaneous speech score †† | 10.09 (0.19,14.35) | - | - |
| Auditory comprehension score § | 133.60 (59.96) | - | - |
| Repetition score †† | 24 (0,68.50) | - | - |
| Naming score †† | 9.25 (0,49.50) | - | - |
| AQ § | 43.21 (29.08) | - | - |
| Brain Regions | MNI (x,y,z) | Cluster Size (Voxels) | T Value | p Value | |
|---|---|---|---|---|---|
| Patients > HCs | |||||
| R HIP-ParaHip | 36, −48, 3 | 80 | 5.82 | 6.828 × 10⁻⁸ | |
| B SMA | 9, 0, 75 | 109 | 4.69 | 6.054 × 10⁻⁶ | |
| ALFF | L HIP-ParaHip | −27, −33, −9 | 54 | 5.66 | 1.324 × 10⁻⁷ |
| R insula | 36, 6, −15 | 45 | 5.20 | 8.375 × 10⁻⁷ | |
| R caudate nucleus | 12, 9, 18 | 55 | 5.05 | 1.513 × 10⁻⁶ | |
| L cerebellum | −15, −45, −45 | 219 | 5.53 | 2.235 × 10⁻⁷ | |
| Patients < HCs | |||||
| ALFF | R cerebellum | 9 −90 −27 | 49 | −5.01 | 1.741 × 10⁻⁶ |
| Bilateral posterior cingulate | 0 −27 21 | 45 | −5.42 | 3.537 × 10⁻⁷ | |
| Brain Regions | MNI (x,y,z) | Cluster Size (Voxels) | T Value | p Value | |
|---|---|---|---|---|---|
| Patients > HCs | |||||
| dALFF | B SMA | 21, 0, 75 | 45 | 3.96 | 8.495 × 10⁻⁵ |
| Patients < HCs | |||||
| dALFF | R cerebellum | 12, −90, −27 | 53 | −4.64 | 7.315 × 10⁻⁶ |
| Seed Region | Connective Regions | MNI (x,y,z) | Cluster Size (Voxels) | T Value | p Value |
|---|---|---|---|---|---|
| Patients > HCs | |||||
| R HIP-ParaHip | R STG | 63, −3, −9 | 270 | 4.67 | 6.484 × 10⁻⁶ |
| R MTG | 54, −60 9 | 81 | 4.18 | 3.889 × 10⁻⁵ | |
| R MOG | 36, −63, 27 | 131 | 4.55 | 1.010 × 10⁻⁵ | |
| Bilateral cerebellum | 15, −42, −36 | 790 | 5.38 | 4.081 × 10⁻⁷ | |
| B SMA | R HIP-ParaHip | 24, −24, −9 | 78 | 6.17 | 1.618 × 10⁻⁸ |
| DMPFC | 3, 54, 42 | 140 | 5.74 | 9.441 × 10⁻⁸ | |
| Bilateral cerebellum | −39, −60, −45 | 1620 | 5.54 | 2.139 × 10⁻⁷ | |
Publisher’s Note: MDPI stays neutral with regard to jurisdictional claims in published maps and institutional affiliations. |
© 2022 by the authors. Licensee MDPI, Basel, Switzerland. This article is an open access article distributed under the terms and conditions of the Creative Commons Attribution (CC BY) license (https://creativecommons.org/licenses/by/4.0/).
Share and Cite
Xie, X.; Zhang, T.; Bai, T.; Chen, C.; Ji, G.-J.; Tian, Y.; Yang, J.; Wang, K. Resting-State Neural-Activity Alterations in Subacute Aphasia after Stroke. Brain Sci. 2022, 12, 678. https://0-doi-org.brum.beds.ac.uk/10.3390/brainsci12050678
Xie X, Zhang T, Bai T, Chen C, Ji G-J, Tian Y, Yang J, Wang K. Resting-State Neural-Activity Alterations in Subacute Aphasia after Stroke. Brain Sciences. 2022; 12(5):678. https://0-doi-org.brum.beds.ac.uk/10.3390/brainsci12050678
Chicago/Turabian StyleXie, Xiaohui, Ting Zhang, Tongjian Bai, Chen Chen, Gong-Jun Ji, Yanghua Tian, Jinying Yang, and Kai Wang. 2022. "Resting-State Neural-Activity Alterations in Subacute Aphasia after Stroke" Brain Sciences 12, no. 5: 678. https://0-doi-org.brum.beds.ac.uk/10.3390/brainsci12050678