Association of Polygenic Liability for Alcohol Dependence and EEG Connectivity in Adolescence and Young Adulthood

 ,
,
Abstract
:1. Introduction
2. Methods
2.1. Sample and Measures
2.2. Statistical Analysis
3. Results
4. Discussion
Limitations and Future Directions
5. Conclusions and Significance
Supplementary Materials
Author Contributions
Funding
Acknowledgments
Conflicts of Interest
References
- Dick, D.M.; Kendler, K.S. The impact of gene-environment interaction on alcohol use disorders. Alcohol. Res. 2012, 34, 318–324. [Google Scholar] [PubMed]
- Porjesz, B.; Rangaswamy, M.; Kamarajan, C.; Jones, K.A.; Padmanabhapillai, A.; Begleiter, H. The utility of neurophysiological markers in the study of alcoholism. Clin. Neurophysiol. 2005, 116, 993–1018. [Google Scholar] [CrossRef] [PubMed]
- Filbey, F.M. The American Journal of Drug and Alcohol Abuse An introduction to “The addiction connectome: Brain connectivity in drug and alcohol addiction”. Am. J. Drug Alcohol Abus. 2013, 39, 341–342. [Google Scholar] [CrossRef] [PubMed]
- Cardenas, V.A.; Price, M.; Fein, G. EEG coherence related to fMRI resting state synchrony in long-term abstinent alcoholics. NeuroImage Clin. 2018, 17, 481–490. [Google Scholar] [CrossRef]
- Sanchez-Roige, S.; Palmer, A.A.; Fontanillas, P.; Elson, S.L.; Adams, M.J.; Howard, D.M.; Edenberg, H.J.; Davies, G.; Crist, R.C.; Deary, I.J.; et al. Genome-Wide Association Study Meta-Analysis of the Alcohol Use Disorders Identification Test (AUDIT) in Two Population-Based Cohorts. Am. J. Psychiatry 2019, 176, 107–118. [Google Scholar] [CrossRef]
- Kranzler, H.R.; Zhou, H.; Kember, R.L.; Vickers Smith, R.; Justice, A.C.; Damrauer, S.; Tsao, P.S.; Klarin, D.; Baras, A.; Reid, J.; et al. Genome-wide association study of alcohol consumption and use disorder in 274,424 individuals from multiple populations. Nat. Commun. 2019, 10, 1499. [Google Scholar] [CrossRef]
- Liu, M.; Jiang, Y.; Wedow, R.; Li, Y.; Brazel, D.M.; Chen, F.; Datta, G.; Davila-Velderrain, J.; McGuire, D.; Tian, C.; et al. Association studies of up to 1.2 million individuals yield new insights into the genetic etiology of tobacco and alcohol use. Nat. Genet. 2019, 51, 237–244. [Google Scholar] [CrossRef]
- Walters, R.K.; Polimanti, R.; Johnson, E.C.; McClintick, J.N.; Adams, M.J.; Adkins, A.E.; Aliev, F.; Bacanu, S.-A.; Batzler, A.; Bertelsen, S.; et al. Transancestral GWAS of alcohol dependence reveals common genetic underpinnings with psychiatric disorders. Nat. Neurosci. 2018, 21, 1656–1669. [Google Scholar] [CrossRef] [Green Version]
- Purcell, S.M.; Wray, N.R.; Stone, J.L.; Visscher, P.M.; O’Donovan, M.C.; Sullivan, P.F.; Sklar, P.; Ruderfer, D.M.; McQuillin, A.; Morris, D.W.; et al. Common polygenic variation contributes to risk of schizophrenia and bipolar disorder. Nature 2009, 460, 748–752. [Google Scholar]
- Michael, A.; Mirza, K.A.; Mukundan, C.R.; Channabasavanna, S.M. Interhemispheric electroencephalographic coherence as a biological marker in alcoholism. Acta Psychiatr. Scand. 1993, 87, 213–217. [Google Scholar] [CrossRef]
- Nunez, P.L.; Srinivasan, R.; Westdorp, A.F.; Wijesinghe, R.S.; Tucker, D.M.; Silberstein, R.B.; Cadusch, P.J. EEG coherency. I: Statistics, reference electrode, volume conduction, Laplacians, cortical imaging, and interpretation at multiple scales. Electroencephalogr. Clin. Neurophysiol. 1997, 103, 499–515. [Google Scholar] [CrossRef]
- Srinivasan, R.; Winter, W.R.; Ding, J.; Nunez, P.L. EEG and MEG coherence: Measures of functional connectivity at distinct spatial scales of neocortical dynamics. J. Neurosci. Methods 2007, 166, 41–52. [Google Scholar] [CrossRef] [PubMed] [Green Version]
- Thatcher, R.W.; North, D.M.; Biver, C.J. Development of cortical connections as measured by EEG coherence and phase delays. Hum. Brain Mapp. 2008, 29, 1400–1415. [Google Scholar] [CrossRef] [PubMed]
- Murias, M.; Swanson, J.M.; Srinivasan, R. Functional Connectivity of Frontal Cortex in Healthy and ADHD Children Reflected in EEG Coherence. Cereb. Cortex 2007, 17, 1788–1799. [Google Scholar] [CrossRef] [PubMed]
- Uhlhaas, P.J.; Singer, W. Neural Synchrony in Brain Disorders: Relevance for Cognitive Dysfunctions and Pathophysiology. Neuron 2006, 52, 155–168. [Google Scholar] [CrossRef] [Green Version]
- Kislova, O.O.; Rusalova, M.N. EEG coherence in humans: relationship with success in recognizing emotions in the voice. Neurosci. Behav. Physiol. 2009, 39, 545–552. [Google Scholar] [CrossRef]
- De Vico Fallani, F.; Nicosia, V.; Sinatra, R.; Astolfi, L.; Cincotti, F.; Mattia, D.; Wilke, C.; Doud, A.; Latora, V.; He, B.; et al. Defecting or Not Defecting: How to “Read” Human Behavior during Cooperative Games by EEG Measurements. PLoS ONE 2010, 5, e14187. [Google Scholar] [CrossRef]
- Kumar, S.; Rao, S.L.; Chandramouli, B.A.; Pillai, S.V. Reduction of Functional Brain Connectivity in Mild Traumatic Brain Injury during Working Memory. J. Neurotrauma 2009, 26, 665–675. [Google Scholar] [CrossRef]
- Marosi, E.; Rodríguez, H.; Harmony, T.; Yañez, G.; Rodrìguez, M.; Bernal, J.; Fernàndez, T.; Silva, J.; Reyes, A.; Guerrero, V. Broad band spectral EEG parameters correlated with different IQ measurements. Int. J. Neurosci. 1999, 97, 17–27. [Google Scholar] [CrossRef]
- Thatcher, R.W.; North, D.; Biver, C. EEG and intelligence: Relations between EEG coherence, EEG phase delay and power. Clin. Neurophysiol. 2005, 116, 2129–2141. [Google Scholar] [CrossRef]
- Babiloni, C.; Frisoni, G.B.; Vecchio, F.; Pievani, M.; Geroldi, C.; De Carli, C.; Ferri, R.; Vernieri, F.; Lizio, R.; Rossini, P.M. Global Functional Coupling of Resting EEG Rhythms is Related to White-Matter Lesions Along the Cholinergic Tracts in Subjects with Amnesic Mild Cognitive Impairment. J. Alzheimer’s Dis. 2010, 19, 859–871. [Google Scholar] [CrossRef] [PubMed]
- Gasser, T.; Rousson, V.; Schreiter Gasser, U. EEG power and coherence in children with educational problems. J. Clin. Neurophysiol. 2003, 20, 273–282. [Google Scholar] [CrossRef] [PubMed]
- Barry, R.J.; Clarke, A.R.; McCarthy, R.; Selikowitz, M.; Johnstone, S.J.; Rushby, J.A. Age and gender effects in EEG coherence: I. Developmental trends in normal children. Clin. Neurophysiol. 2004, 115, 2252–2258. [Google Scholar] [CrossRef] [PubMed]
- Chorlian, D.B.; Rangaswamy, M.; Porjesz, B. EEG coherence: topography and frequency structure. Exp. brain Res. 2009, 198, 59–83. [Google Scholar] [CrossRef]
- Barry, R.J.; Clarke, A.R.; McCarthy, R.; Selikowitz, M.; Johnstone, S.J.; Hsu, C.-I.; Bond, D.; Wallace, M.J.; Magee, C.A. Age and gender effects in EEG coherence: II. Boys with attention deficit/hyperactivity disorder. Clin. Neurophysiol. 2005, 116, 977–984. [Google Scholar] [CrossRef]
- Sankari, Z.; Adeli, H.; Adeli, A. Intrahemispheric, interhemispheric, and distal EEG coherence in Alzheimer’s disease. Clin. Neurophysiol. 2011, 122, 897–906. [Google Scholar] [CrossRef]
- Murias, M.; Webb, S.J.; Greenson, J.; Dawson, G. Resting state cortical connectivity reflected in EEG coherence in individuals with autism. Biol. Psychiatry 2007, 62, 270–273. [Google Scholar] [CrossRef]
- Sritharan, A.; Line, P.; Sergejew, A.; Silberstein, R.; Egan, G.; Copolov, D. EEG coherence measures during auditory hallucinations in schizophrenia. Psychiatry Res. 2005, 136, 189–200. [Google Scholar] [CrossRef]
- Winterer, G.; Enoch, M.-A.; White, K.V.; Saylan, M.; Coppola, R.; Goldman, D. EEG phenotype in alcoholism: increased coherence in the depressive subtype. Acta Psychiatr. Scand. 2003, 108, 51–60. [Google Scholar] [CrossRef]
- Porjesz, B.; Rangaswamy, M. Neurophysiological endophenotypes, CNS disinhibition, and risk for alcohol dependence and related disorders. Sci.World J. 2007, 7, 131–141. [Google Scholar] [CrossRef]
- Whedon, M.; Perry, N.B.; Calkins, S.D.; Bell, M.A. Changes in frontal EEG coherence across infancy predict cognitive abilities at age 3: The mediating role of attentional control. Dev. Psychol. 2016, 52, 1341–1352. [Google Scholar] [CrossRef] [PubMed]
- Segalowitz, S.J.; Santesso, D.L.; Jetha, M.K. Electrophysiological changes during adolescence: A review. Brain Cogn. 2010, 72, 86–100. [Google Scholar] [CrossRef] [PubMed]
- Duffy, F.H.; Mcanulty, G.B.; Albert, M.S. Effects of age upon interhemispheric EEG coherence in normal adults. Neurobiol. Aging 1996, 17, 587–599. [Google Scholar] [CrossRef]
- Rangaswamy, M.; Porjesz, B. Understanding alcohol use disorders with neuroelectrophysiology. Handb. Clin. Neurol. 2014, 125, 383–414. [Google Scholar] [Green Version]
- Jaušovec, N.; Jaušovec, K. Resting brain activity: Differences between genders. Neuropsychologia 2010, 48, 3918–3925. [Google Scholar] [CrossRef]
- Volf, N.V.; Razumnikova, O.M. Sex differences in EEG coherence during a verbal memory task in normal adults. Int. J. Psychophysiol. 1999, 34, 113–122. [Google Scholar] [CrossRef]
- Giedd, J.N.; Rapoport, J.L. Structural MRI of pediatric brain development: What have we learned and where are we going? Neuron 2010, 67, 728–734. [Google Scholar] [CrossRef]
- Gogtay, N.; Thompson, P.M. Mapping gray matter development: Implications for typical development and vulnerability to psychopathology. Brain Cogn. 2010, 72, 6–15. [Google Scholar] [CrossRef] [Green Version]
- Grant, B.F.; Goldstein, R.B.; Saha, T.D.; Chou, S.P.; Jung, J.; Zhang, H.; Pickering, R.P.; Ruan, W.J.; Smith, S.M.; Huang, B.; et al. Epidemiology of DSM-5 Alcohol Use Disorder: Results From the National Epidemiologic Survey on Alcohol and Related Conditions III. JAMA Psychiatry 2015, 72, 757–766. [Google Scholar] [CrossRef]
- Kendler, K.S.; Gardner, C.O.; Edwards, A.C.; Dick, D.M.; Hickman, M.; MacLeod, J.; Heron, J. Childhood Risk Factors for Heavy Episodic Alcohol Use and Alcohol Problems in Late Adolescence: A Marginal Structural Model Analysis. J. Stud. Alcohol. Drugs 2018, 79, 370–379. [Google Scholar] [CrossRef]
- Volkow, N.D.; Koob, G.F.; Croyle, R.T.; Bianchi, D.W.; Gordon, J.A.; Koroshetz, W.J.; Pérez-Stable, E.J.; Riley, W.T.; Bloch, M.H.; Conway, K.; et al. The conception of the ABCD study: From substance use to a broad NIH collaboration. Dev. Cogn. Neurosci. 2018, 32, 4–7. [Google Scholar] [CrossRef] [PubMed]
- Kwon, D.; Pfefferbaum, A.; Sullivan, E.V.; Pohl, K.M. Regional growth trajectories of cortical myelination in adolescents and young adults: longitudinal validation and functional correlates. Brain Imaging Behav. 2018, 1–25. [Google Scholar] [CrossRef] [PubMed]
- Bucholz, K.K.; McCutcheon, V.V.; Agrawal, A.; Dick, D.M.; Hesselbrock, V.M.; Kramer, J.R.; Kuperman, S.; Nurnberger, J.I.; Salvatore, J.E.; Schuckit, M.A.; et al. Comparison of Parent, Peer, Psychiatric, and Cannabis Use Influences Across Stages of Offspring Alcohol Involvement: Evidence from the COGA Prospective Study. Alcohol. Clin. Exp. Res. 2017, 41, 359–368. [Google Scholar] [CrossRef] [PubMed] [Green Version]
- Bucholz, K.K.; Cadoret, R.; Cloninger, C.R.; Dinwiddie, S.H.; Hesselbrock, V.M.; Nurnberger, J.I.; Reich, T.; Schmidt, I.; Schuckit, M.A. A new, semi-structured psychiatric interview for use in genetic linkage studies: A report on the reliability of the SSAGA. J. Stud. Alcohol. 1994, 55, 149–158. [Google Scholar] [CrossRef] [PubMed]
- Kuperman, S.; Chan, G.; Kramer, J.R.; Wetherill, L.; Bucholz, K.K.; Dick, D.; Hesselbrock, V.; Porjesz, B.; Rangaswamy, M.; Schuckit, M. A model to determine the likely age of an adolescent’s first drink of alcohol. Pediatrics 2013, 131, 242–248. [Google Scholar] [CrossRef]
- Purcell, S.; Neale, B.; Todd-Brown, K.; Thomas, L.; Ferreira, M.A.R.; Bender, D.; Maller, J.; Sklar, P.; de Bakker, P.I.W.; Daly, M.J.; et al. PLINK: A Tool Set for Whole-Genome Association and Population-Based Linkage Analyses. Am. J. Hum. Genet. 2007, 81, 559–575. [Google Scholar] [CrossRef] [Green Version]
- O’Connell, J.R.; Weeks, D.E. PedCheck: A program for identification of genotype incompatibilities in linkage analysis. Am. J. Hum. Genet. 1998, 63, 259–266. [Google Scholar]
- Delaneau, O.; Howie, B.; Cox, A.J.; Zagury, J.-F.; Marchini, J. Haplotype estimation using sequencing reads. Am. J. Hum. Genet. 2013, 93, 687–696. [Google Scholar] [CrossRef]
- Das, S.; Forer, L.; Schönherr, S.; Sidore, C.; Locke, A.E.; Kwong, A.; Vrieze, S.I.; Chew, E.Y.; Levy, S.; McGue, M.; et al. Next-generation genotype imputation service and methods. Nat. Genet. 2016, 48, 1284–1287. [Google Scholar] [CrossRef] [Green Version]
- Sanchez-Roige, S.; Fontanillas, P.; Elson, S.L.; Gray, J.C.; de Wit, H.; Davis, L.K.; MacKillop, J.; Palmer, A.A. Genome-wide association study of alcohol use disorder identification test (AUDIT) scores in 20,328 research participants of European ancestry. Addict. Biol. 2019, 24, 121–131. [Google Scholar] [CrossRef]
- Davis, H.P.; Keller, F. Colorado Assessment Tests (CATs), 1.2 ed.; Colorado Springs: Colorado, CO, USA, 2002. [Google Scholar]
- Shallice, T. Specific impairments of planning. Philos. Trans. R. Soc. Lond. B. Biol. Sci. 1982, 298, 199–209. [Google Scholar] [CrossRef]
- Pandey, A.K.; Ardekani, B.A.; Kamarajan, C.; Zhang, J.; Chorlian, D.B.; Byrne, K.N.-H.; Pandey, G.; Meyers, J.L.; Kinreich, S.; Stimus, A.; et al. Lower Prefrontal and Hippocampal Volume and Diffusion Tensor Imaging Differences Reflect Structural and Functional Abnormalities in Abstinent Individuals with Alcohol Use Disorder. Alcohol. Clin. Exp. Res. 2018, 42, 1883–1896. [Google Scholar] [CrossRef] [PubMed]
- Chorlian, D.B.; Rangaswamy, M.; Manz, N.; Meyers, J.L.; Kang, S.J.; Kamarajan, C.; Pandey, A.K.; Wang, J.-C.; Wetherill, L.; Edenberg, H.; et al. Genetic correlates of the development of theta event related oscillations in adolescents and young adults. Int. J. Psychophysiol. 2017, 115, 24–39. [Google Scholar] [CrossRef] [PubMed]
- Salvatore, J.E.; Cho, S.B.; Dick, D.M. Genes, Environments, and Sex Differences in Alcohol Research. J. Stud. Alcohol. Drugs 2017, 78, 494–501. [Google Scholar] [CrossRef] [PubMed]
- Chorlian, D.B.; Rangaswamy, M.; Manz, N.; Kamarajan, C.; Pandey, A.K.; Edenberg, H.; Kuperman, S.; Porjesz, B. Gender modulates the development of theta event related oscillations in adolescents and young adults. Behav. Brain Res. 2015, 292, 342–352. [Google Scholar] [CrossRef] [Green Version]
- Cousminer, D.L.; Berry, D.J.; Timpson, N.J.; Ang, W.; Thiering, E.; Byrne, E.M.; Taal, H.R.; Huikari, V.; Bradfield, J.P.; Kerkhof, M.; et al. Genome-wide association and longitudinal analyses reveal genetic loci linking pubertal height growth, pubertal timing and childhood adiposity. Hum. Mol. Genet. 2013, 22, 2735–2747. [Google Scholar] [CrossRef] [Green Version]
- Kang, S.J.; Rangaswamy, M.; Manz, N.; Wang, J.-C.; Wetherill, L.; Hinrichs, T.; Almasy, L.; Brooks, A.; Chorlian, D.B.; Dick, D.; et al. Family-based genome-wide association study of frontal θ oscillations identifies potassium channel gene KCNJ6. Genes Brain. Behav. 2012, 11, 712–719. [Google Scholar] [CrossRef]
- Fein, G.; Di Sclafani, V.; Cardenas, V.A.; Goldmann, H.; Tolou-Shams, M.; Meyerhoff, D.J. Cortical gray matter loss in treatment-naïve alcohol dependent individuals. Alcohol. Clin. Exp. Res. 2002, 26, 558–564. [Google Scholar] [CrossRef]
- Jernigan, T.L.; Butters, N.; DiTraglia, G.; Schafer, K.; Smith, T.; Irwin, M.; Grant, I.; Schuckit, M.; Cermak, L.S. Reduced cerebral grey matter observed in alcoholics using magnetic resonance imaging. Alcohol. Clin. Exp. Res. 1991, 15, 418–427. [Google Scholar] [CrossRef]
- Hommer, D.W.; Momenan, R.; Kaiser, E.; Rawlings, R.R. Evidence for a Gender-Related Effect of Alcoholism on Brain Volumes. Am. J. Psychiatry 2001, 158, 198–204. [Google Scholar] [CrossRef]
- O’Neill, J.; Cardenas, V.A.; Meyerhoff, D.J. Effects of abstinence on the brain: Quantitative magnetic resonance imaging and magnetic resonance spectroscopic imaging in chronic alcohol abuse. Alcohol. Clin. Exp. Res. 2001, 25, 1673–1682. [Google Scholar]
- Sowell, E.R.; Delis, D.; Stiles, J.; Jernigan, T.L. Improved memory functioning and frontal lobe maturation between childhood and adolescence: A structural MRI study. J. Int. Neuropsychol. Soc. 2001, 7, 312–322. [Google Scholar] [CrossRef] [PubMed]
- Sowell, E.R.; Peterson, B.S.; Thompson, P.M.; Welcome, S.E.; Henkenius, A.L.; Toga, A.W. Mapping cortical change across the human life span. Nat. Neurosci. 2003, 6, 309–315. [Google Scholar] [CrossRef] [PubMed]
- Kelly, A.M.C.; Di Martino, A.; Uddin, L.Q.; Shehzad, Z.; Gee, D.G.; Reiss, P.T.; Margulies, D.S.; Castellanos, F.X.; Milham, M.P. Development of anterior cingulate functional connectivity from late childhood to early adulthood. Cereb. Cortex 2009, 19, 640–657. [Google Scholar] [CrossRef]
- Stevens, M.C. The developmental cognitive neuroscience of functional connectivity. Brain Cogn. 2009, 70, 1–12. [Google Scholar] [CrossRef]
- Sowell, E.R.; Thompson, P.M.; Toga, A.W. Mapping Changes in the Human Cortex throughout the Span of Life. Neurosci. 2004, 10, 372–392. [Google Scholar] [CrossRef]
- Pfefferbaum, A.; Rohlfing, T.; Pohl, K.M.; Lane, B.; Chu, W.; Kwon, D.; Nolan Nichols, B.; Brown, S.A.; Tapert, S.F.; Cummins, K.; et al. Adolescent Development of Cortical and White Matter Structure in the NCANDA Sample: Role of Sex, Ethnicity, Puberty, and Alcohol Drinking. Cereb. Cortex 2016, 26, 4101–4121. [Google Scholar] [CrossRef]
- Sullivan, E.V. Development of Brain Structures, Connections, and Functions. Neuropsychol. Rev. 2010, 20, 325–326. [Google Scholar] [CrossRef] [Green Version]


| Prospective Study EEG Subsample of European Ancestry | |
|---|---|
| Genotyped (N) | 1426 |
| Female (%) | 51.6% |
| Mean Age (SD) | 17.7 (7.4) |
| Self-reported as ‘White’ (%) | 98.1% |
| Self-reported as ‘Black’ (%) | 0.1 |
| Self-reported as ‘Latin/Hispanic’ (%) | 0.1 |
| Self-reported as ‘Other’ (%) | 4.4 |
| Family History of AUD (%) | 41.1 |
| Ever Drinkers (%) | 71.8 |
| DSM-5 AUD (%) | 35.4 |
| DSM-5 Cannabis Use Disorder, lifetime (%) | 23.4 |
| DSM-5 Cocaine Use Disorder, lifetime (%) | 4.2 |
| DSM-5 Opioid Use Disorder, lifetime (%) | 5.3 |
| Ages 12–17 | Ages 18–25 | Ages 26–31 | |||||
|---|---|---|---|---|---|---|---|
| Low theta | High alpha | Low theta | High alpha | Low theta | High alpha | ||
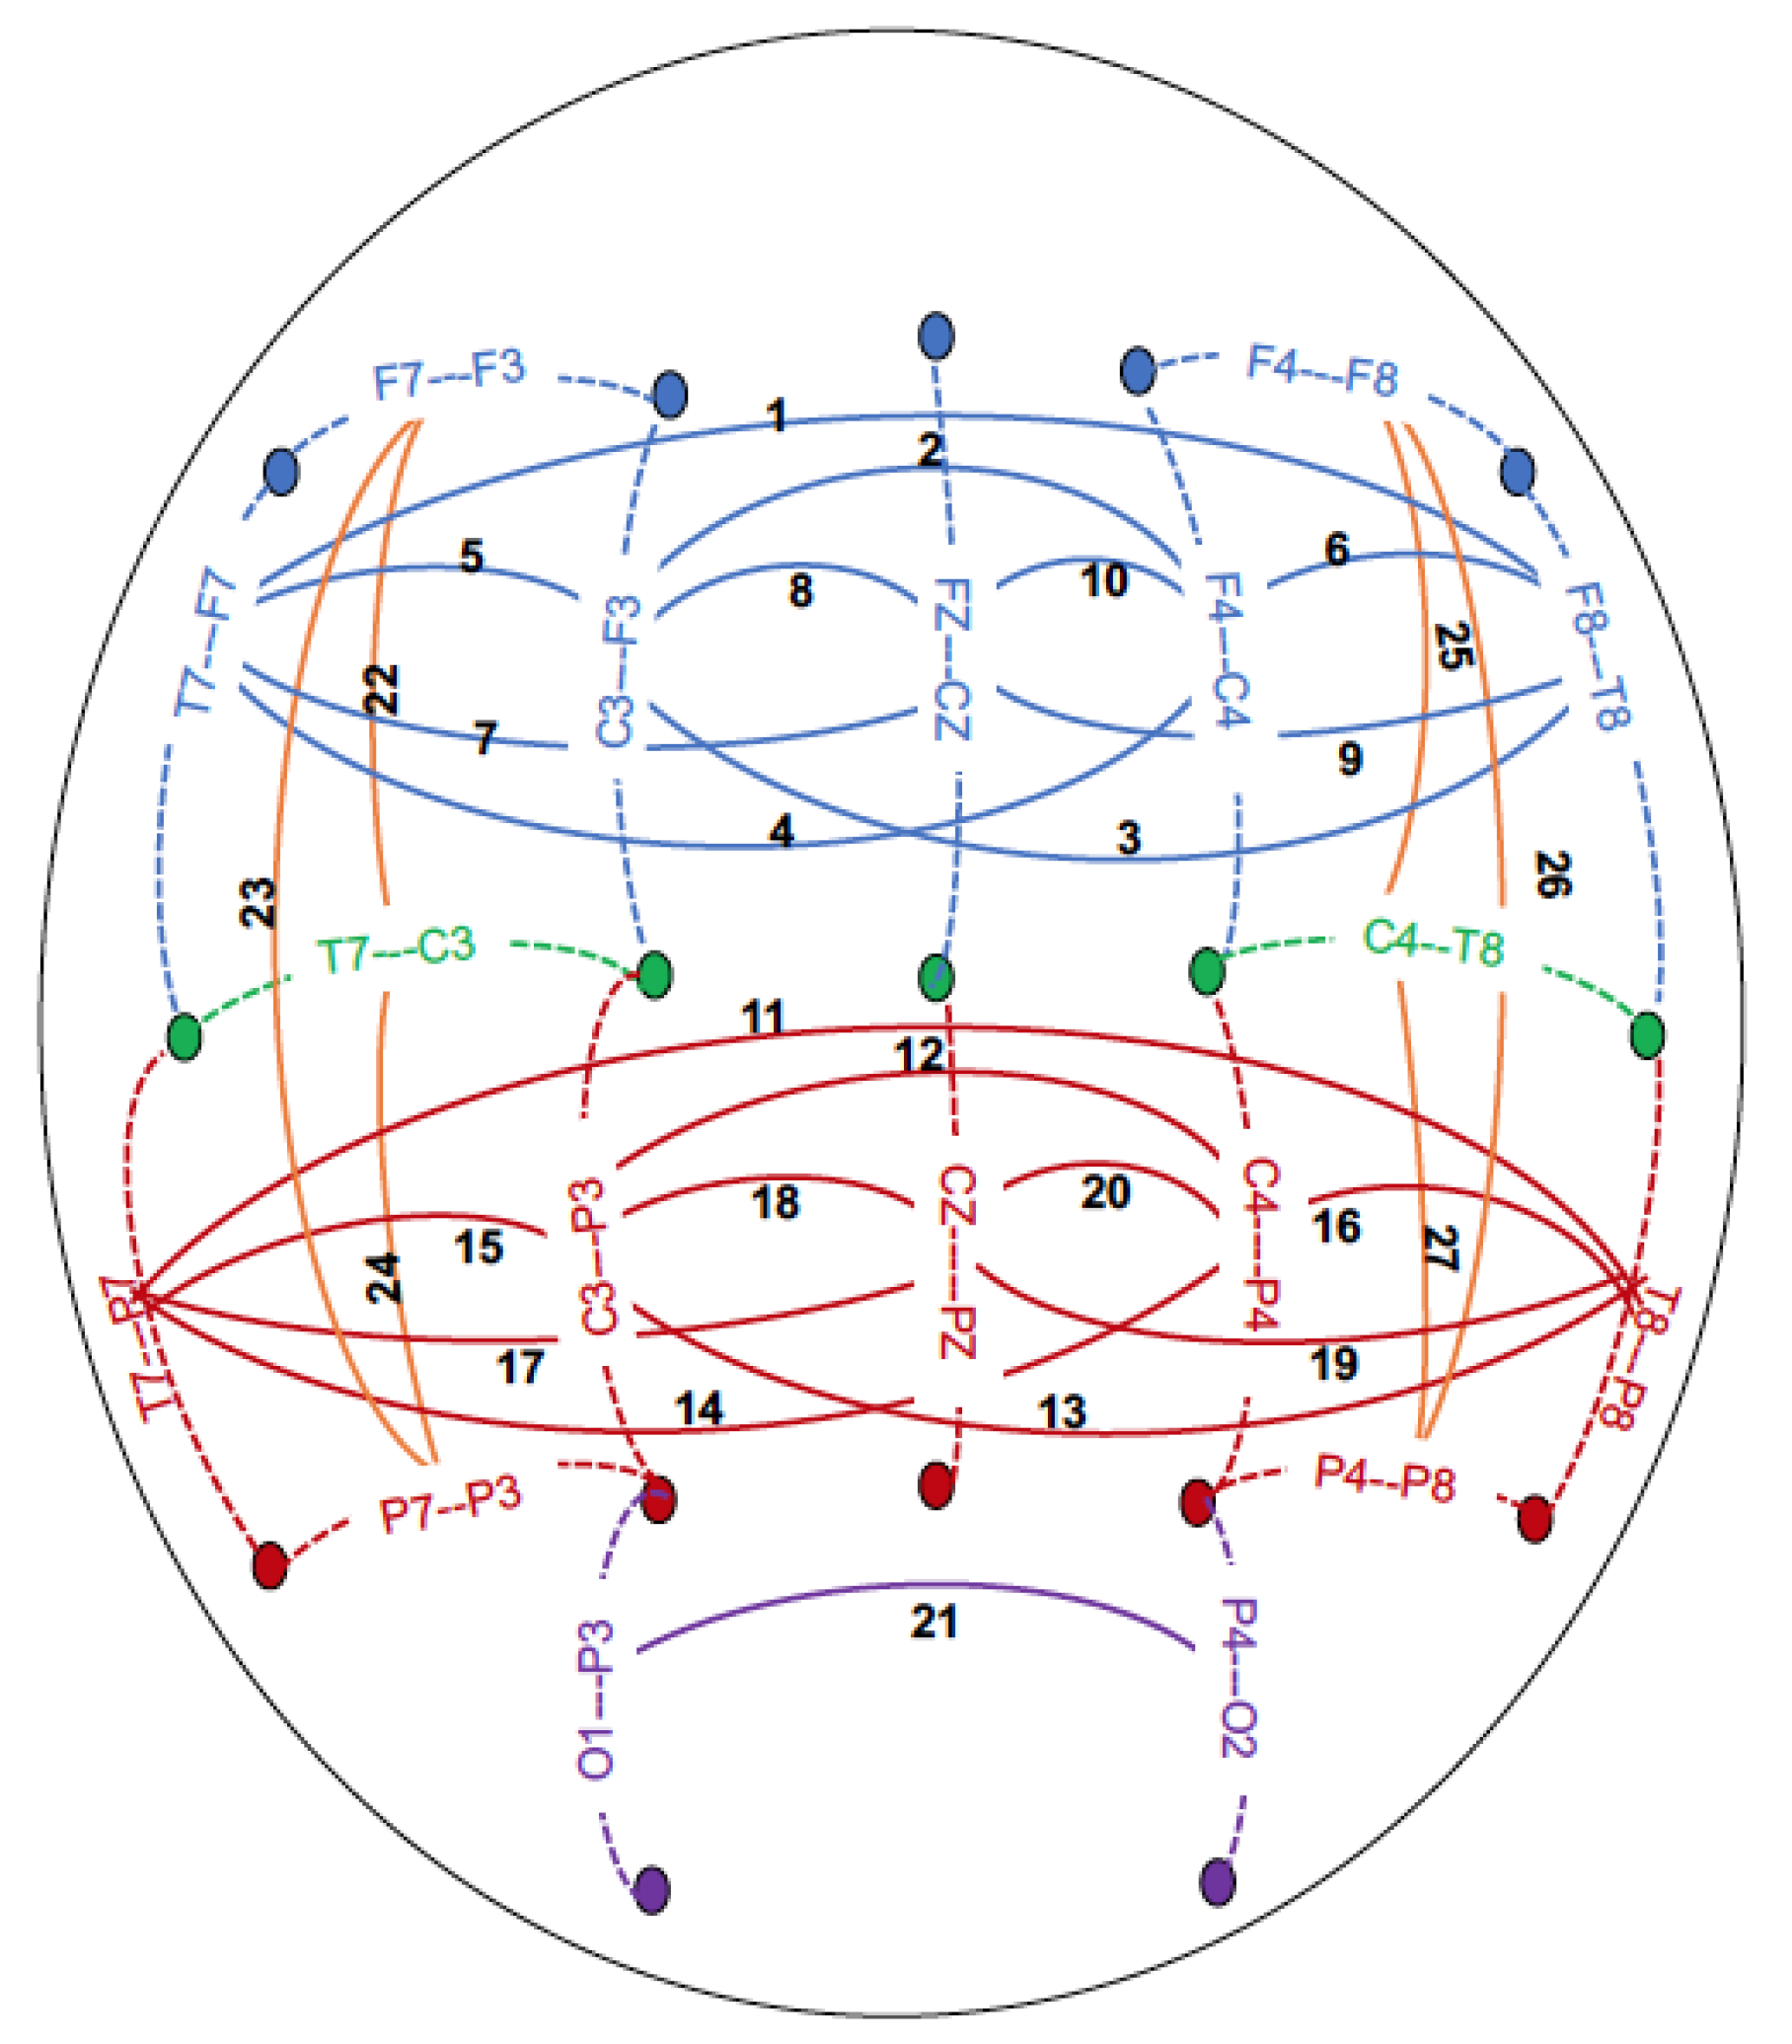
| Pair Frontal central sagittal | beta (−log10 p-value) | beta (−log10 p-value) | beta (−log10 p-value) | ||||
| 1 | F8-T8--F7-T7 | 0.01 (1.55) | 0.01 (0.58) | 0.01 (0.70) | 0.01 (2.25) | (0.01)1.04 | 0.02 (4.12) |
| 2 | F4-C4--F3-C3 | 0.01 (1.09) | 0.02 (2.56) | 0.03 (6.15 *) | 0.03 (4.98) | 0.02 (3.77) | 0.03 (5.66) |
| 3 | F3-C3--F8-T8 | 0.01 (1.56) | 0.00 (0.54) | 0.01 (1.98) | 0.01 (1.81) | 0.01 (1.43) | 0.03 (5.71) |
| 4 | F4-C4--F7-T7 | 0.01 (0.73) | 0.01 (0.86) | 0.01 (1.87) | 0.02 (2.90) | 0.01 (1.08) | 0.02 (3.03) |
| 5 | F3-C3--F7-T7 | 0.01 (0.55) | 0.00 (0.64) | 0.03 (4.25) | 0.05 (7.62 *) | 0.02 (2.08) | 0.04 (6.95 *) |
| 6 | F4-C4--F8-T8 | 0.01 (1.15) | 0.01 (1.18) | 0.01 (0.57) | 0.01 (0.89) | 0.02 (1.83) | 0.03 (3.73) |
| 7 | FZ-CZ--F7-T7 | 0.0 (0.36) | 0.01 (1.10) | 0.01 (2.11) | 0.02 (4.65) | 0.01 (1.46) | 0.02 (4.04) |
| 8 | FZ-CZ--F3-C3 | 0.02 (2.37) | 0.03 (5.06) | 0.05 (9.30 **) | 0.05 (9.60 **) | 0.03 (3.48) | 0.03 (4.30) |
| 9 | FZ-CZ--F8-T8 | 0.01 (1.14) | 0.01 (1.23) | 0.00 (0.26) | 0.01 (1.32) | 0.01 (0.81) | 0.02 (3.01) |
| 10 | FZ-CZ--F4-C4 | 0.01 (0.65) | 0.01 (1.34) | 0.03 (3.85) | 0.02 (2.82) | 0.04 (5.80) | 0.04 (6.87 *) |
| Central-Parietal sagittal | |||||||
| 11 | T8-P8--T7-P7 | 0.00 (0.88) | 0.01 (1.34) | 0.02 (7.14 *) | 0.03 (6.19 *) | 0.02 (6.33 *) | 0.05 (10.81 ***) |
| 12 | C4-P4--C3-P3 | 0.01 (0.79) | 0.02 (2.59) | 0.03 (8.03 **) | 0.04 (6.54 *) | 0.03 (5.46) | 0.03 (4.23) |
| 13 | C3-P3--T8-P8 | 0.00 (0.60) | 0.02 (1.70) | 0.02 (5.94) | 0.03 (4.61) | 0.01 (2.49) | 0.04 (6.38*) |
| 14 | C4-P4--T7-P7 | 0.01 (1.19) | 0.02 (1.61) | 0.02 (4.78) | 0.04 (6.48 *) | 0.01 (3.54) | 0.03 (5.27) |
| 15 | C3-P3--T7-P7 | 0.01 (0.73) | 0.01 (1.46) | 0.02 (2.10) | 0.04 (8.06 **) | 0.01 (0.67) | 0.04 (6.55 *) |
| 16 | C4-P4--T8-P8 | 0.01 (1.66) | 0.02 (2.25) | 0.03 (4.91) | 0.03 (4.38) | 0.02 (3.20) | 0.04 (6.14 *) |
| 17 | T7-P7--CZ-PZ | 0.00 (0.57) | 0.01 (1.03) | 0.02 (4.47) | 0.04 (5.30) | 0.01 (3.42) | 0.04 (5.81) |
| 18 | C3-P3--CZ-PZ | 0.02 (2.85) | 0.02 (2.56) | 0.05 (10.12 ***) | 0.04 (6.67 *) | 0.04 (6.61 *) | 0.04 (5.58) |
| 19 | T8-P8--CZ-PZ | 0.01 (1.42) | 0.01 (1.47) | 0.02 (6.39 *) | 0.03 (5.58) | 0.01 (2.74) | 0.03 (3.61) |
| 20 | C4-P4--CZ-PZ | 0.01 (1.40) | 0.02 (1.70) | 0.03 (4.24) | 0.03 (4.09) | 0.03 (4.76) | 0.03 (3.56) |
| Parietal-Occipital sagittal | |||||||
| 21 | P4-O2--P3-O1 | 0.02 (3.72) | 0.03 (3.20) | 0.04 (11.65 ***) | 0.05 (10.07 ***) | 0.05 (10.52 ***) | 0.06 (9.75 **) |
| Intrahemispheric lateral | |||||||
| 22 | T7-C3--F7-F3 | 0.01 (0.99) | 0.01 (0.60) | 0.04 (6.19 *) | 0.03 (3.76) | 0.03 (4.70) | 0.02 (2.14) |
| 23 | P7-P3--F7-F3 | 0.00 (0.99) | 0.01 (1.14) | 0.02 (5.49) | 0.02 (4.01) | 0.02 (2.64) | 0.01 (1.61) |
| 24 | P7-P3--T7-C3 | 0.01 (1.76) | 0.03 (3.89) | 0.03 (5.64) | 0.04 (5.62) | 0.03 (4.08) | 0.04 (6.11 *) |
| 25 | T8-C4--F8-F4 | 0.00 (0.27) | 0.01 (1.15) | 0.03 (3.34) | 0.01 (1.09) | 0.04 (5.19) | 0.03 (3.33) |
| 26 | P8-P4--F8-F4 | 0.00 (0.38) | 0.01 (1.68) | 0.01 (2.89) | 0.02 (3.57) | 0.01 (2.67) | 0.01 (2.37) |
| 27 | P8-P4--T8-C4 | 0.00 (0.72) | 0.02 (1.49) | 0.03 (6.39 *) | 0.03 (3.17) | 0.03 (4.88) | 0.03 (2.67) |
| DSM-IV AD PRS (p < 0.001) | ||
|---|---|---|
| Neuropsychological Performance | Beta (Model 1) | Beta (Model 2) |
| TOLT Performance (number of optimal trials) | −0.097 ** | −0.027 * |
| TOLT Speed (average trial time) | 0.012 | 0.010 |
| VST Backwards Visual Span | 0.090 * | 0.040 * |
| VST Forwards Visual Span | −0.123 *** | −0.071 ** |
| Substance Use Disorders (Lifetime) | ||
| DSM-5 Max Alcohol Use Disorder Symptom Count | 0.087 ** | 0.033 * |
| DSM-5 Max Cannabis Use Disorder Symptom Count | 0.043 | 0.023 |
| DSM-5 Max Cocaine Use Disorder Symptom Count | 0.037 | 0.017 |
| DSM-5 Max Opioid Use Disorder Symptom Count | 0.069 ** | 0.049 * |
© 2019 by the authors. Licensee MDPI, Basel, Switzerland. This article is an open access article distributed under the terms and conditions of the Creative Commons Attribution (CC BY) license (http://creativecommons.org/licenses/by/4.0/).
Share and Cite
Meyers, J.L.; Chorlian, D.B.; Johnson, E.C.; Pandey, A.K.; Kamarajan, C.; Salvatore, J.E.; Aliev, F.; Subbie-Saenz de Viteri, S.; Zhang, J.; Chao, M.; et al. Association of Polygenic Liability for Alcohol Dependence and EEG Connectivity in Adolescence and Young Adulthood. Brain Sci. 2019, 9, 280. https://0-doi-org.brum.beds.ac.uk/10.3390/brainsci9100280
Meyers JL, Chorlian DB, Johnson EC, Pandey AK, Kamarajan C, Salvatore JE, Aliev F, Subbie-Saenz de Viteri S, Zhang J, Chao M, et al. Association of Polygenic Liability for Alcohol Dependence and EEG Connectivity in Adolescence and Young Adulthood. Brain Sciences. 2019; 9(10):280. https://0-doi-org.brum.beds.ac.uk/10.3390/brainsci9100280
Chicago/Turabian StyleMeyers, Jacquelyn L., David B. Chorlian, Emma C. Johnson, Ashwini K. Pandey, Chella Kamarajan, Jessica E. Salvatore, Fazil Aliev, Stacey Subbie-Saenz de Viteri, Jian Zhang, Michael Chao, and et al. 2019. "Association of Polygenic Liability for Alcohol Dependence and EEG Connectivity in Adolescence and Young Adulthood" Brain Sciences 9, no. 10: 280. https://0-doi-org.brum.beds.ac.uk/10.3390/brainsci9100280