EEG Window Length Evaluation for the Detection of Alzheimer’s Disease over Different Brain Regions

 ,
,  ,
,  ,
,  , ,
, , 
Abstract
:1. Introduction
2. Materials and Methods
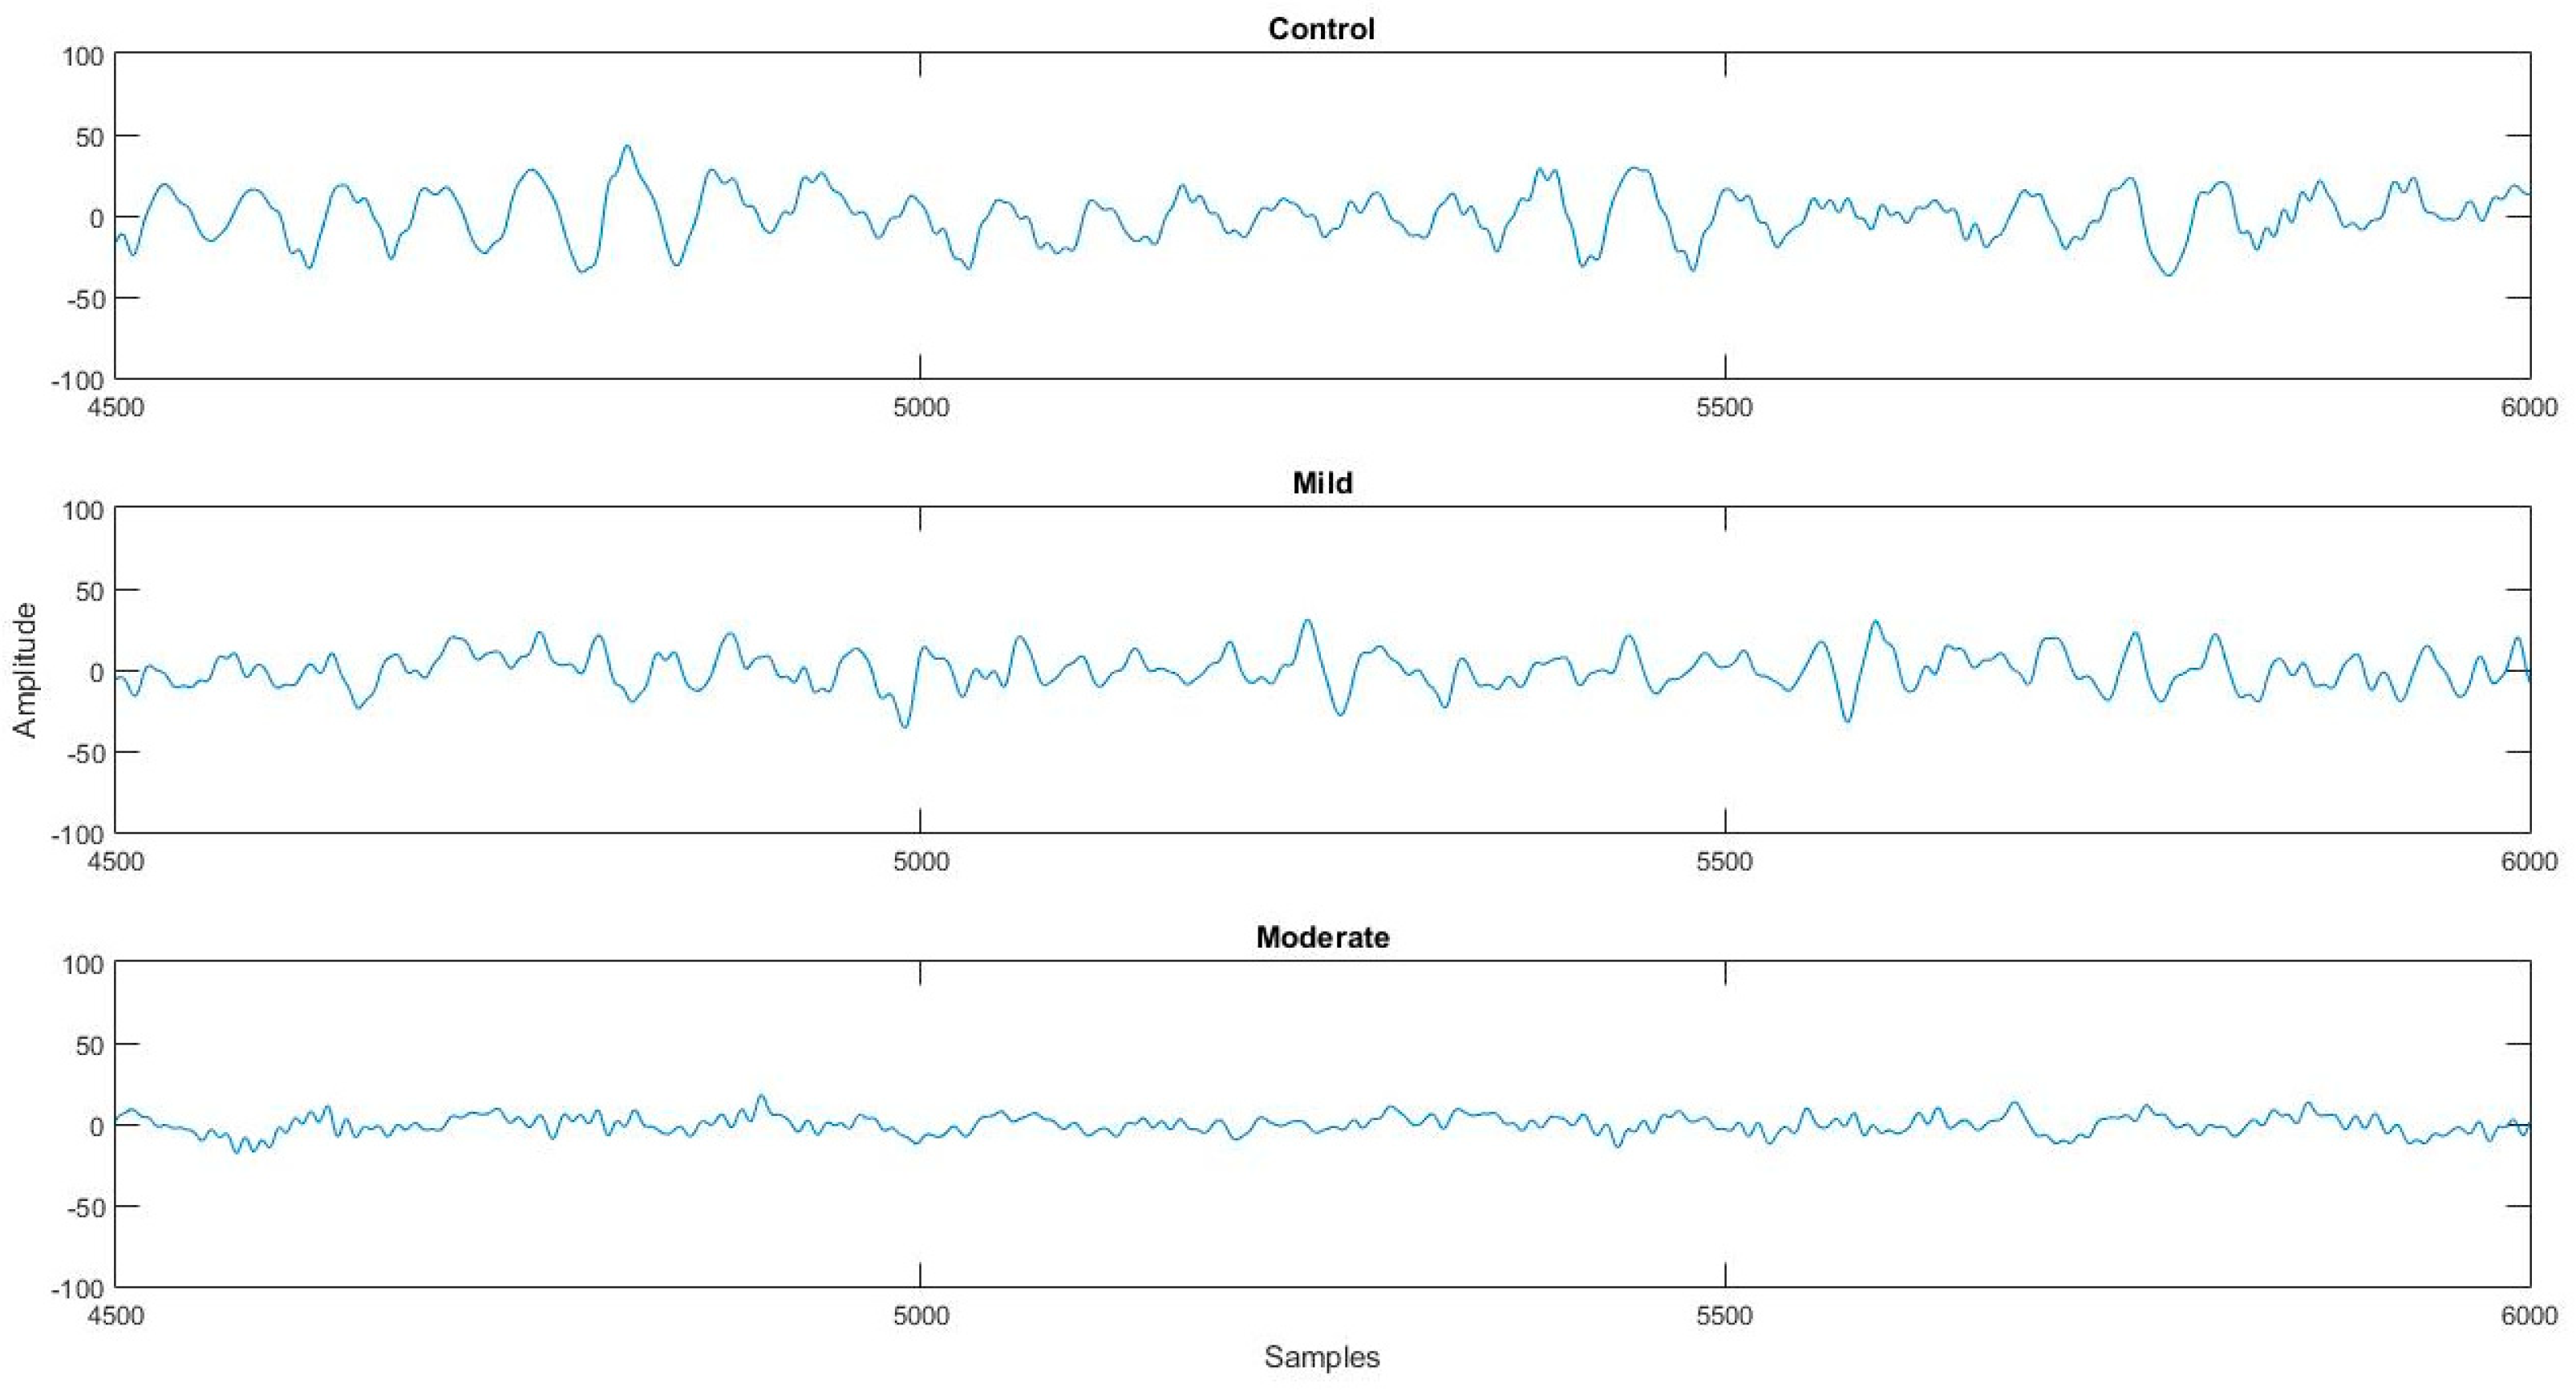
2.1. Data Acquisition
2.2. Feature Extraction
- Shannon entropy (ShanEN),
- Multiscale entropy (MSE),
- Mean,
- Variance,
- Standard deviation (STD),
- Skewness,
- Kurtosis, and
- Interquartile Range (IQR).
- 9.
- Energy of the δ, θ, α, β, and γ bands,
- 10.
- Relative band power (RBP) of the δ, θ, α, β, and γ bands,
- 11.
- Approximate entropy (ApEN) of the δ, θ, α, β, and γ bands,
- 12.
- Permutation entropy (PermEN) of the δ, θ, α, β, and γ bands,
- 13.
- Tsallis entropy (TsalEN) of the δ, θ, α, β, and γ bands,
- 14.
- Sample entropy (SamplEN) of the δ, θ, α, β, and γ bands,
2.3. Classification
3. Results
4. Discussion
5. Conclusions
Author Contributions
Funding
Acknowledgments
Conflicts of Interest
References
- Abásolo, D.; Hornero, R.; Espino, P.; Poza, J.; Sánchez, C.I.; De La Rosa, R. Analysis of regularity in the EEG background activity of Alzheimer’s disease patients with Approximate Entropy. Clin. Neurophysiol. 2005, 116, 1826–1834. [Google Scholar] [CrossRef] [PubMed]
- Crews, L.; Masliah, E. Molecular mechanisms of neurodegeneration in Alzheimer ’s disease. Hum. Mol. Genet. 2010, 19, R12–R20. [Google Scholar] [CrossRef]
- Patterson, C. World Alzheimer Report 2018 The State of the Art of Dementia Research: New Frontiers. London, UK, 2018. Available online: https://www.alz.co.uk/research/WorldAlzheimerReport2018.pdf (accessed on 10 April 2019).
- Marshal, S.E.F.; Folstein, F.; Mchugh, P.R. Mini-Mental State’ A Ppractical method for grading the cognitive state of patients for the clinician. J. Phychiat. 1975, 12, 189–198. [Google Scholar]
- Morris, J.C. The Clinical Dementia Rating (CDR): Current version and scoring rules. Neurology 2012, 43, 2412. [Google Scholar] [CrossRef]
- Jeong, J.; Kim, S.Y.; Han, S.H. Non-linear dynamical analysis of the EEG in Alzheimer’s disease with optimal embedding dimension. Electroencephalogr. Clin. Neurophysiol. 1998, 106, 220–228. [Google Scholar] [CrossRef]
- Coronel, C.; Garn, H.; Waser, M.; Deistler, M.; Benke, T.; Dal-Bianco, P.; Ransmayr, G.; Seiler, S.; Grossegger, D.; Schmidt, R. Quantitative EEG markers of entropy and auto mutual information in relation to MMSE scores of probable Alzheimer’s disease patients. Entropy 2017, 19, 130. [Google Scholar] [CrossRef]
- Dauwels, J.; Vialatte, F.; Cichocki, A. Diagnosis of Alzheimer’s Disease from EEG Signals: Where Are We Standing? Curr. Alzheimer Res. 2010, 999, 1–19. [Google Scholar] [CrossRef]
- Garn, H.; Waser, M.; Deistler, M.; Benke, T.; Dal-Bianco, P.; Ransmayr, G.; Schmidt, H.; Sanin, G.; Santer, P.; Caravias, C.; et al. Quantitative EEG markers relate to Alzheimer’s disease severity in the Prospective Dementia Registry Austria (PRODEM). Clin. Neurophysiol. 2015, 126, 505–513. [Google Scholar] [CrossRef]
- Falk, T.H.; Fraga, F.J.; Trambaiolli, L.; Anghinah, R. EEG amplitude modulation analysis for semi-automated diagnosis of Alzheimer’s disease. EURASIP J. Adv. Signal. Process. 2012, 2012, 1–9. [Google Scholar] [CrossRef]
- Deng, B.; Cai, L.; Li, S.; Wang, R.; Yu, H.; Chen, Y.; Wang, J. Multivariate multi-scale weighted permutation entropy analysis of EEG complexity for Alzheimer’s disease. Cogn. Neurodyn. 2017, 11, 217–231. [Google Scholar] [CrossRef]
- Kulkarni, N.N.; Bairagi, V.K. Extracting Salient Features for EEG-based Diagnosis of Alzheimer’s Disease Using Support Vector Machine Classifier. IETE J. Res. 2017, 63, 11–22. [Google Scholar] [CrossRef]
- Chen, Y.; Cai, L.; Wang, R.; Song, Z.; Deng, B.; Wang, J.; Yu, H. DCCA cross-correlation coefficients reveals the change of both synchronization and oscillation in EEG of Alzheimer disease patients. Phys. A Stat. Mech. Appl. 2018, 490, 171–184. [Google Scholar] [CrossRef]
- Song, Z.; Deng, B.; Wang, J.; Wang, R. Biomarkers for Alzheimer’s Disease Defined by a Novel Brain Functional Network Measure. IEEE Trans. Biomed. Eng. 2018, 61, 1003–1009. [Google Scholar] [CrossRef] [PubMed]
- Simons, S.; Abásolo, D. Distance-based Lempel-Ziv complexity for the analysis of electroencephalograms in patients with Alzheimer’s disease. Entropy 2017, 19, 129. [Google Scholar] [CrossRef]
- Triggiani, A.I.; Bevilacqua, V.; Brunetti, A.; Lizio, R.; Tattoli, G.; Cassano, F.; Soricelli, A.; Ferri, R.; Nobili, F.; Gesualdo, L.; et al. Classification of healthy subjects and Alzheimer’s disease patients with dementia from cortical sources of resting state EEG rhythms: A study using artificial neural networks. Front. Neurosci. 2017, 10, 1–13. [Google Scholar] [CrossRef] [PubMed]
- Dottori, M.; Sedeno, L.; Martorell Caro, M.; Alifano, F.; Hesse, E.; Mikulan, E.; García, A.M.; Ruiz-Tagle, A.; Lillo, P.; Slachevsky, A.; et al. Towards affordable biomarkers of frontotemporal dementia: A classification study via network’s information sharing. Sci. Rep. 2017, 7, 1–12. [Google Scholar] [CrossRef] [PubMed]
- Neto, E.; Biessmann, F.; Aurlien, H.; Nordby, H.; Eichele, T. Regularized linear discriminant analysis of EEG features in dementia patients. Front. Aging Neurosci. 2016, 8, 1–10. [Google Scholar] [CrossRef]
- Ieracitano, C.; Mammone, N.; Bramanti, A.; Hussain, A.; Morabito, F.C. A Convolutional Neural Network approach for classification of dementia stages based on 2D-spectral representation of EEG recordings. Neurocomputing 2019, 323, 96–107. [Google Scholar] [CrossRef]
- Ruiz-Gómez, S.J.; Gomez, C.; Poza, J.; Gutierrez-Tobal, G.C.; Tola-Arribas, M.A.; Cano, M.; Hornero, R. Automated multiclass classification of spontaneous EEG activity in Alzheimer’s disease and mild cognitive impairment. Entropy 2018, 20, 35. [Google Scholar] [CrossRef]
- Nicastro, N.; Assal, F.; Seeck, M. From here to epilepsy: The risk of seizure in patients with Alzheimer’s disease. Epileptic Disord. 2016, 18, 1–12. [Google Scholar]
- Tylová, L.; Kukal, J.; Hubata-Vacek, V.; Vyšata, O. Unbiased estimation of permutation entropy in EEG analysis for Alzheimer’s disease classification. Biomed. Signal. Process. Control. 2018, 39, 424–430. [Google Scholar] [CrossRef]
- Waser, M.; Garn, H.; Schmidt, R.; Benke, T.; Dal-Bianko, P.; Ransmayr, G.; Schmidt, H.; Seiler, S.; Sanin, G.; Mayer, F.; et al. Quantifying synchrony patterns in the EEG of Alzheimer’s patients with linear and non-linear connectivity markers. J. Neural Transm. 2016, 123, 297–316. [Google Scholar] [CrossRef] [PubMed]
- Abásolo1, D.; Hornero, R.; Espino, P. Approximate entropy of eeg background activity in alzheimer’s disease patients. Intell. Autom. Soft Comput. 2009, 15, 591–603. [Google Scholar]
- Poza, J.; Gomez, C.; Garcia, M.; Tola-Arribas, M.A.; Carreres, A.; Cano, M.; Hornero, R. Spatio-Temporal Fluctuations of Neural Dynamics in Mild Cognitive Impairment and Alzheimer’s Disease. Curr. Alzheimer Res. 2017, 14, 924–936. [Google Scholar] [CrossRef] [PubMed]
- Labate, D.; La Foresta, F.; Morabito, G.; Palamara, I.; Morabito, F.C. Entropic measures of EEG complexity in alzheimer’s disease through a multivariate multiscale approach. IEEE Sens. J. 2013, 13, 3284–3292. [Google Scholar] [CrossRef]
- Bertè, F.; Lamponi, G.; Calabrò, R.S.; Bramanti, P. Elman neural network for the early identification of cognitive impairment in Alzheimer’s disease. Funct. Neurol. 2014, 29, 57–65. [Google Scholar]
- Liu, X.; Zhang, C.; Zheng, J.; Ma, Y.; Shang, X.; Zhang, Q.; Zheng, W.; Li, X.; Gao, J.; Wang, R.; et al. Multiple characteristics analysis of Alzheimer’s electroencephalogram by power spectral density and Lempel–Ziv complexity. Cogn. Neurodyn. 2016, 10, 121–133. [Google Scholar] [CrossRef]
- Fraga, F.J.; Falk, T.; Kanda, P.A.M.; Anghinah, R. Characterizing Alzheimer’s Disease Severity via Resting-Awake EEG Amplitude Modulation Analysis. PLoS ONE 2013, 8, e72240. [Google Scholar] [CrossRef]
- Delorme, A.; Makeig, S. EEGLAB: An open source toolbox for analysis of single-trial EEG dynamics including independent component analysis. J. Neurosci. Methods 2004, 134, 9–21. [Google Scholar] [CrossRef]
- Breiman, L.E.O. Random Forests. Mach. Learn. 2001, 45, 5–32. [Google Scholar] [CrossRef] [Green Version]
- Duda, R.O.; Hart, P.E.; Stork, D.G. Pattern Classification, 2nd ed.; John Wiley and Sons, Inc.: New York, NY, USA, 2000. [Google Scholar]
- Mchugh, M.L. Lessons in biostatistics Interrater reliability: The kappa statistic. Biochem. Medica 2012, 22, 276–282. [Google Scholar] [CrossRef]
- Posner, E.V.; Dyakin, V.V.; Lucas, J.; Dyakina-Fagnano, N.V. The Chain of Chirality Transfer as Determinant of Brain Functional Laterality. Breaking the Chirality Silence: Search for New Generation of Biomarkers; Relevance to Neurodegenerative Diseases, Cognitive Psychology, and Nutrition Science. Neurol. Neurosci. Res. 2017, 1, 1–12. [Google Scholar]
- Ramsøy, T.Z.; Skov, M.; Christensen, M.K.; Stahlhut, C. Frontal brain asymmetry and willingness to pay. Front. Neurosci. 2018, 12, 1–12. [Google Scholar] [CrossRef]
- Bakkour, A.; Morris, J.C.; Wolk, D.A.; Dickerson, B.C. The effects of aging and Alzheimer’s disease on cerebral cortical anatomy: Specificity and differential relationships with cognition. Neuroimage 2013, 76, 332–344. [Google Scholar] [CrossRef]
- Liu, H.; Zhang, L.; Xi, Q.; Zhao, X.; Wang, F.; Wang, X.; Men, W.; Lin, Q. Changes in brain lateralization in patients with mild cognitive impairment and Alzheimer’s disease: A resting-state functional magnetic resonance study from Alzheimer’s disease neuroimaging initiative. Front. Neurol. 2018, 9, 1–10. [Google Scholar] [CrossRef]
- Jacobs, H.I.L.; Van Boxtel, M.P.J.; Jolles, F.R.J.; Verhey, F.R.; Uylings, H.B.M. Parietal cortex matters in Alzheimer’s disease: An overview of structural, functional and metabolic findings. Neurosci. Biobehav. Rev. 2012, 36, 297–309. [Google Scholar] [CrossRef]
- Dauwels, J.; Vialatte, F.; Musha, T.; Cichocki, A. A comparative study of synchrony measures for the early diagnosis of Alzheimer’s disease based on EEG. Neuroimage 2010, 49, 668–693. [Google Scholar] [CrossRef]
- Khodayari-Rostamabad, A.; Hasey, G.; MacCrimmon, D.J.; Reilly, J.P.; De Bruin, H. A pilot study to determine whether machine learning methodologies using pre-treatment electroencephalography can predict the symptomatic response to clozapine therapy. Clin. Neurophysiol. 2010, 121, 1998–2006. [Google Scholar] [CrossRef]
- Simpraga, S.; Alvarez-Jimenez, R.; Mansvelder, H.D.; Van Gerven, J.M.A.; Groeneveld, G.J.; Poil, S.S.; Linkenkaer-Hansen, K. EEG machine learning for accurate detection of cholinergic intervention and Alzheimer’s disease. Sci. Rep. 2017, 7, 1–11. [Google Scholar] [CrossRef]
- Tzimourta, K.D.; Afrantou, T.; Ioannidis, P.; Karatzikou, M.; Tzallas, A.T.; Giannakeas, N.; Astrakas, L.G.; Angelidis, P.; Glavas, E.; Grigoriadis, N.; et al. Analysis of electroencephalographic signals complexity regarding Alzheimer’s Disease. Comput. Electr. Eng. 2019, 76, 198–212. [Google Scholar] [CrossRef]


| Moderate AD | Mild AD | Controls | |
|---|---|---|---|
| Age | 62.5 (61.25–68.25) | 73.5 (68.5–77.25) | 67 (62.25–72) |
| Gender (m:f) | 3:3 | 3:5 | 7:3 |
| Education level (P:S:H) | 3:3 | 4:2:2 | 3:3:4 |
| MMSE | 15 (14–16) | 21 (20–22) | 30 |
| Disease duration (months) | 32 (24–36) | 22 (19.5–24) | - |
| Classification Problem | MLP | KNN | SVM | NB | DT | RF |
|---|---|---|---|---|---|---|
| CN/AD | 86.11 | 80.98 | 77.23 | 66.20 | 83.29 | 91.80 |
| CN/mild | 89.02 | 85.16 | 77.11 | 54.80 | 85.76 | 91.77 |
| CN/moderate | 95.23 | 93.62 | 91.09 | 81.93 | 94.48 | 96.76 |
| CN-mild/moderate | 94.20 | 91.39 | 88.86 | 80.05 | 92.15 | 94.99 |
| mild/moderate | 90.17 | 87.48 | 79.15 | 70.03 | 86.30 | 91.71 |
| CN/mild/moderate | 80.71 | 74.88 | 66.59 | 46.74 | 77.55 | 88.79 |
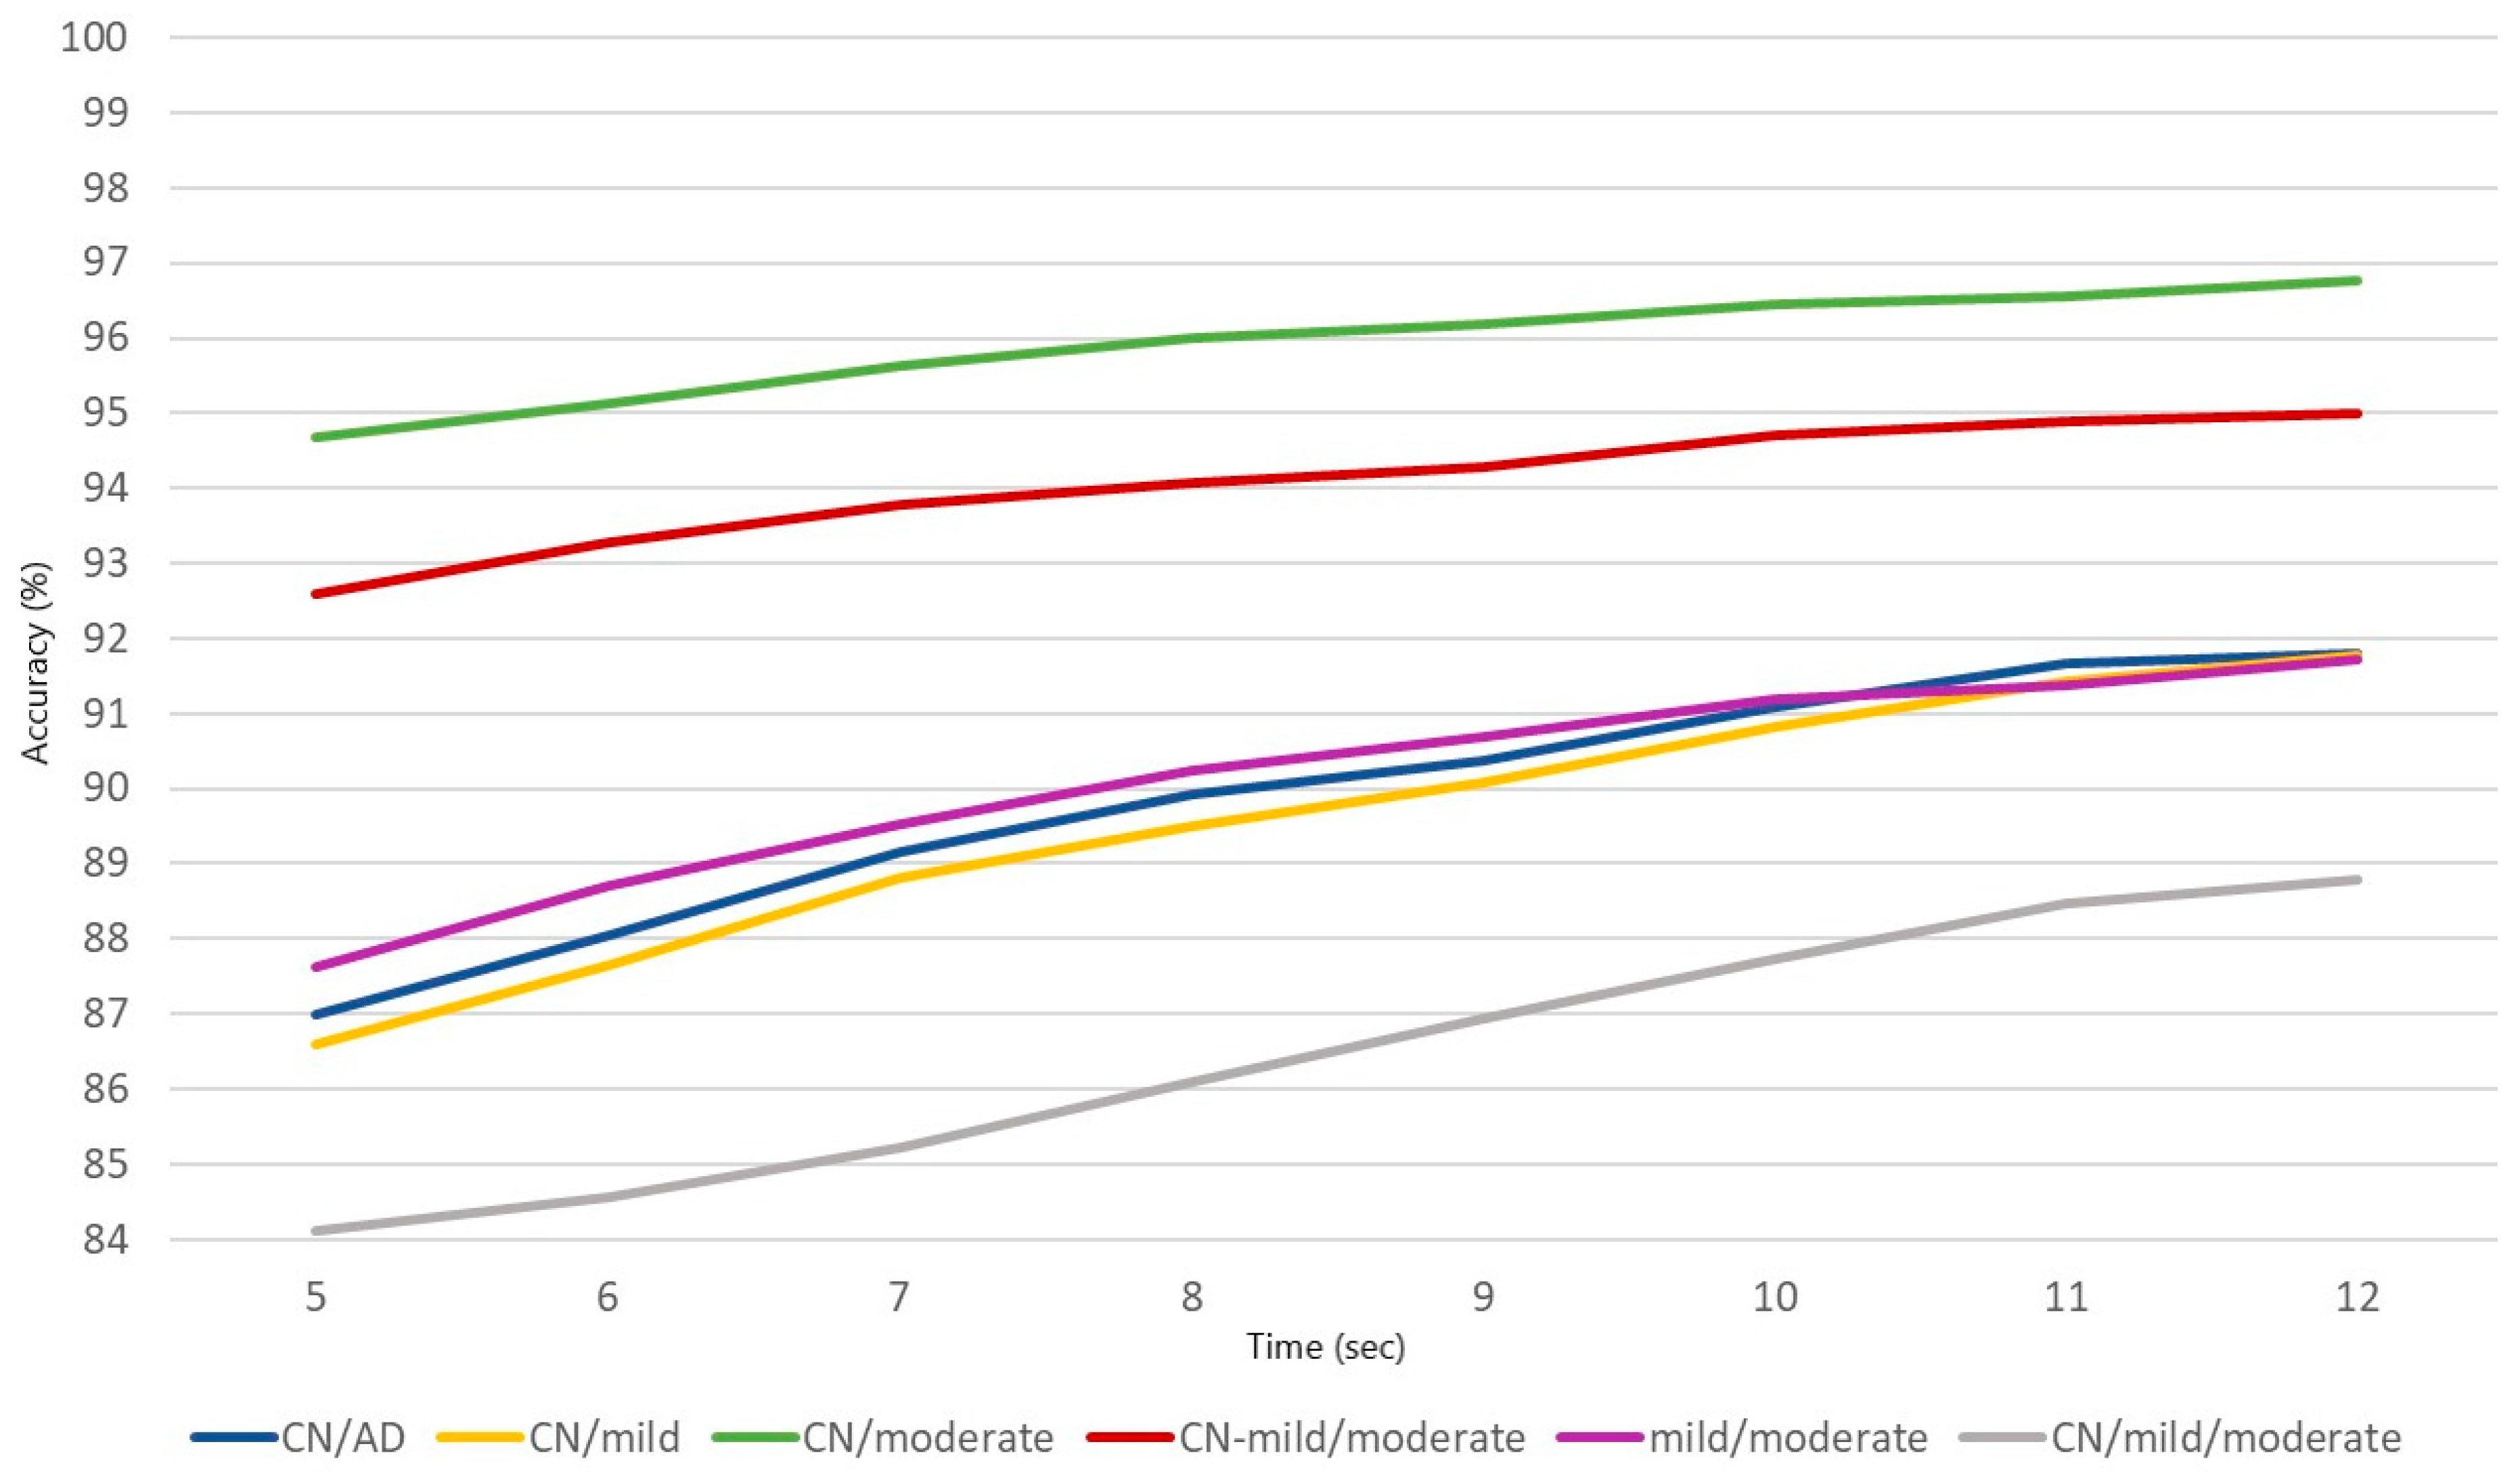
| Classification Problem | 5 s | 6 s | 7 s | 8 s | 9 s | 10 s | 11 s | 12 s |
|---|---|---|---|---|---|---|---|---|
| CN/AD | 86.98 | 88.04 | 89.15 | 89.93 | 90.37 | 91.09 | 91.66 | 91.80 |
| CN/mild | 86.60 | 87.65 | 88.81 | 89.50 | 90.09 | 90.81 | 91.43 | 91.77 |
| CN/moderate | 94.68 | 95.13 | 95.64 | 95.99 | 96.18 | 96.46 | 96.56 | 96.76 |
| CN-mild/moderate | 92.59 | 93.27 | 93.78 | 94.06 | 94.29 | 94.70 | 94.88 | 94.99 |
| mild/moderate | 87.63 | 88.70 | 89.52 | 90.25 | 90.69 | 91.19 | 91.38 | 91.71 |
| CN/mild/moderate | 82.34 | 83.73 | 85.23 | 86.10 | 86.93 | 87.72 | 88.47 | 88.79 |
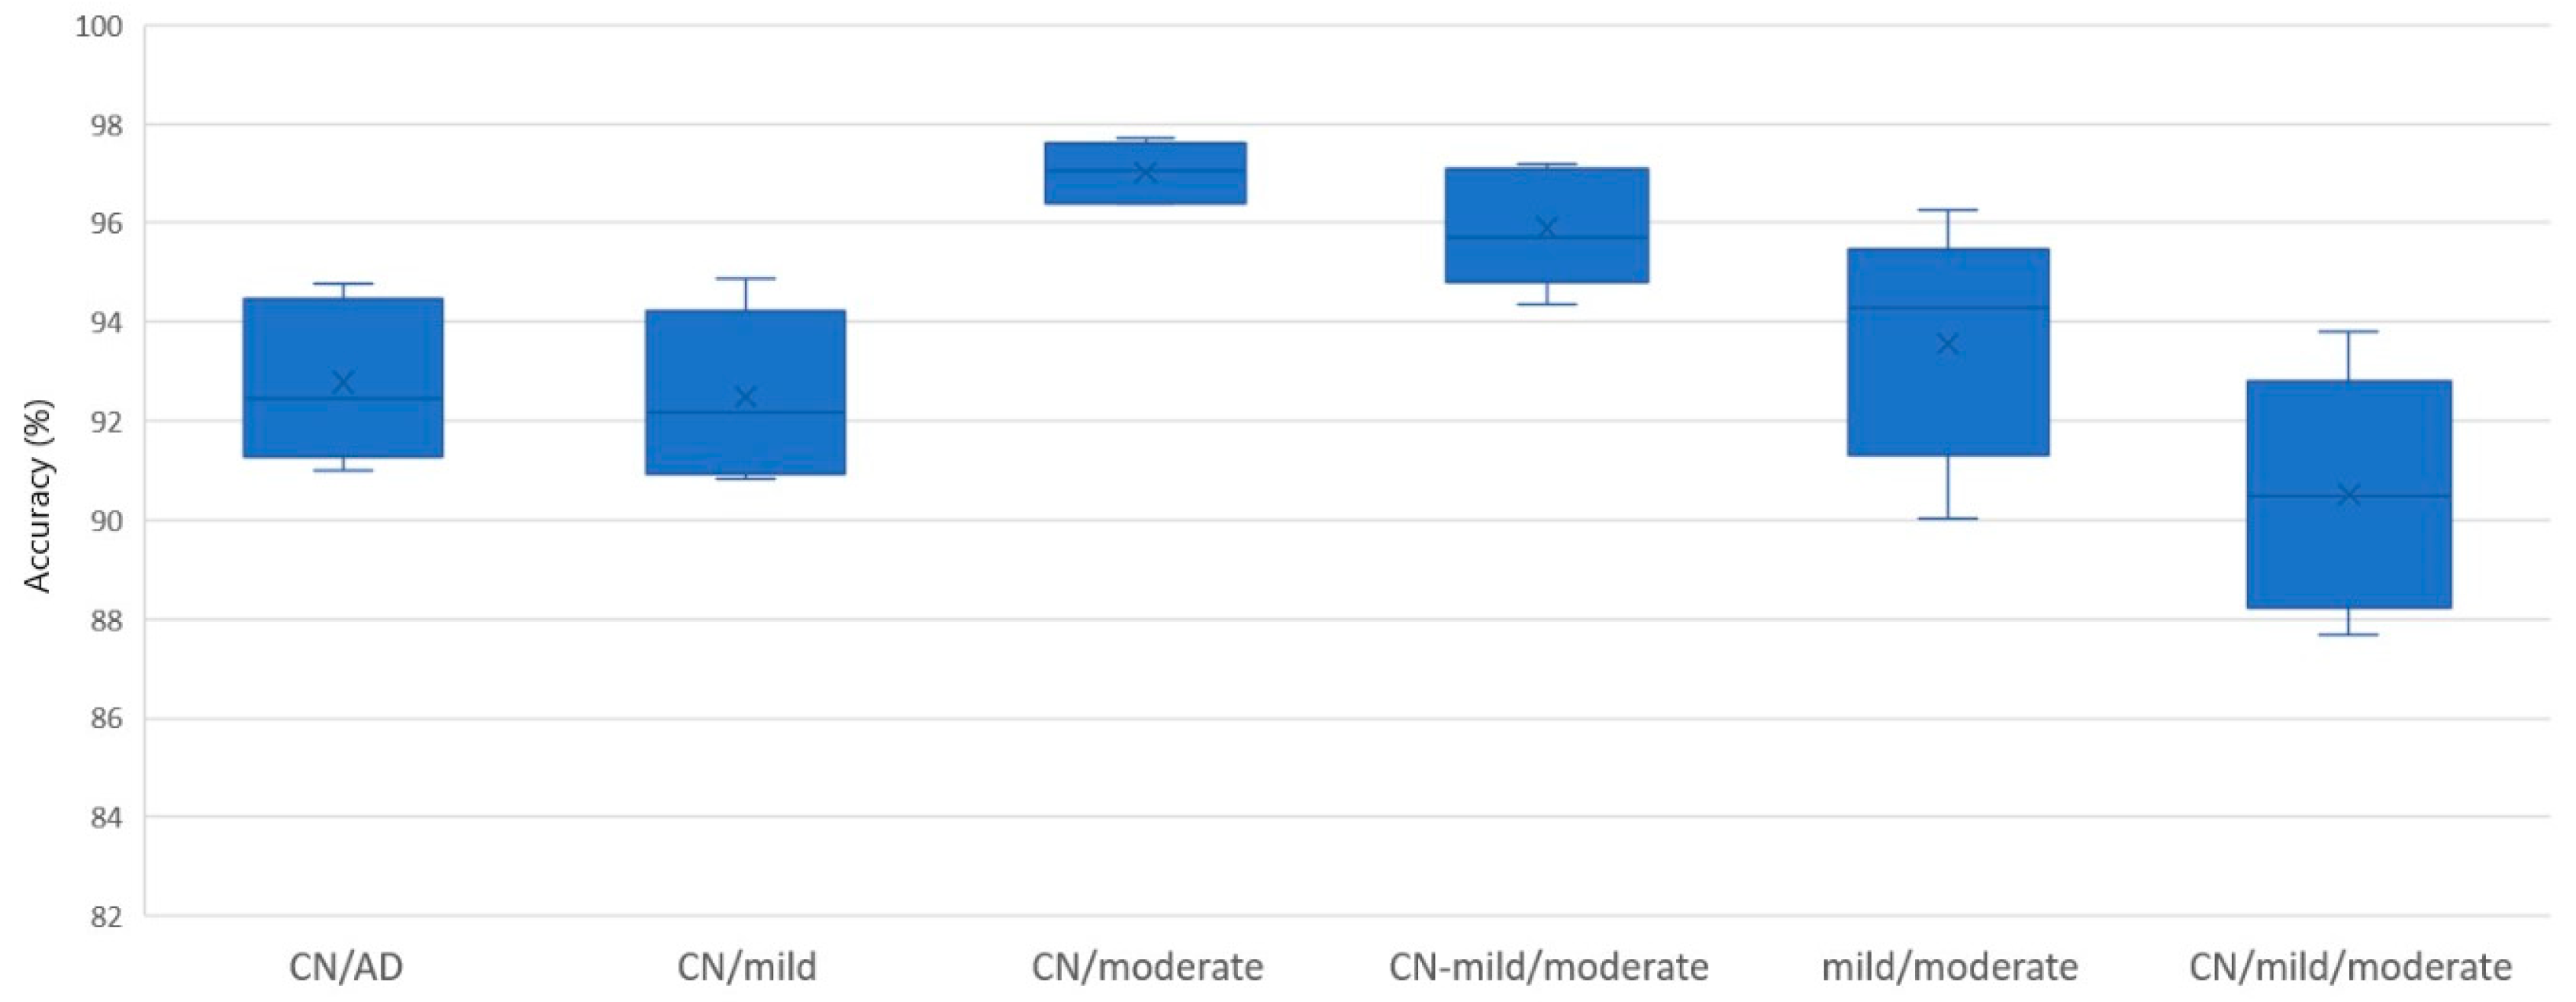
| Classification Problem | ACC (%) | Precision (%) | F1-score | Kappa |
|---|---|---|---|---|
| CN/AD | 91.80 | 93.35 | 0.9077 | 0.8340 |
| CN/mild | 91.77 | 93.11 | 0.8739 | 0.8132 |
| CN/moderate | 96.76 | 97.78 | 0.9277 | 0.9069 |
| CN-mild/moderate | 94.99 | 92.24 | 0.8372 | 0.8079 |
| mild/moderate | 91.71 | 91.42 | 0.8837 | 0.8194 |
| CN/mild/moderate | 88.79 | 88.83 | 0.8474 | 0.8860 |
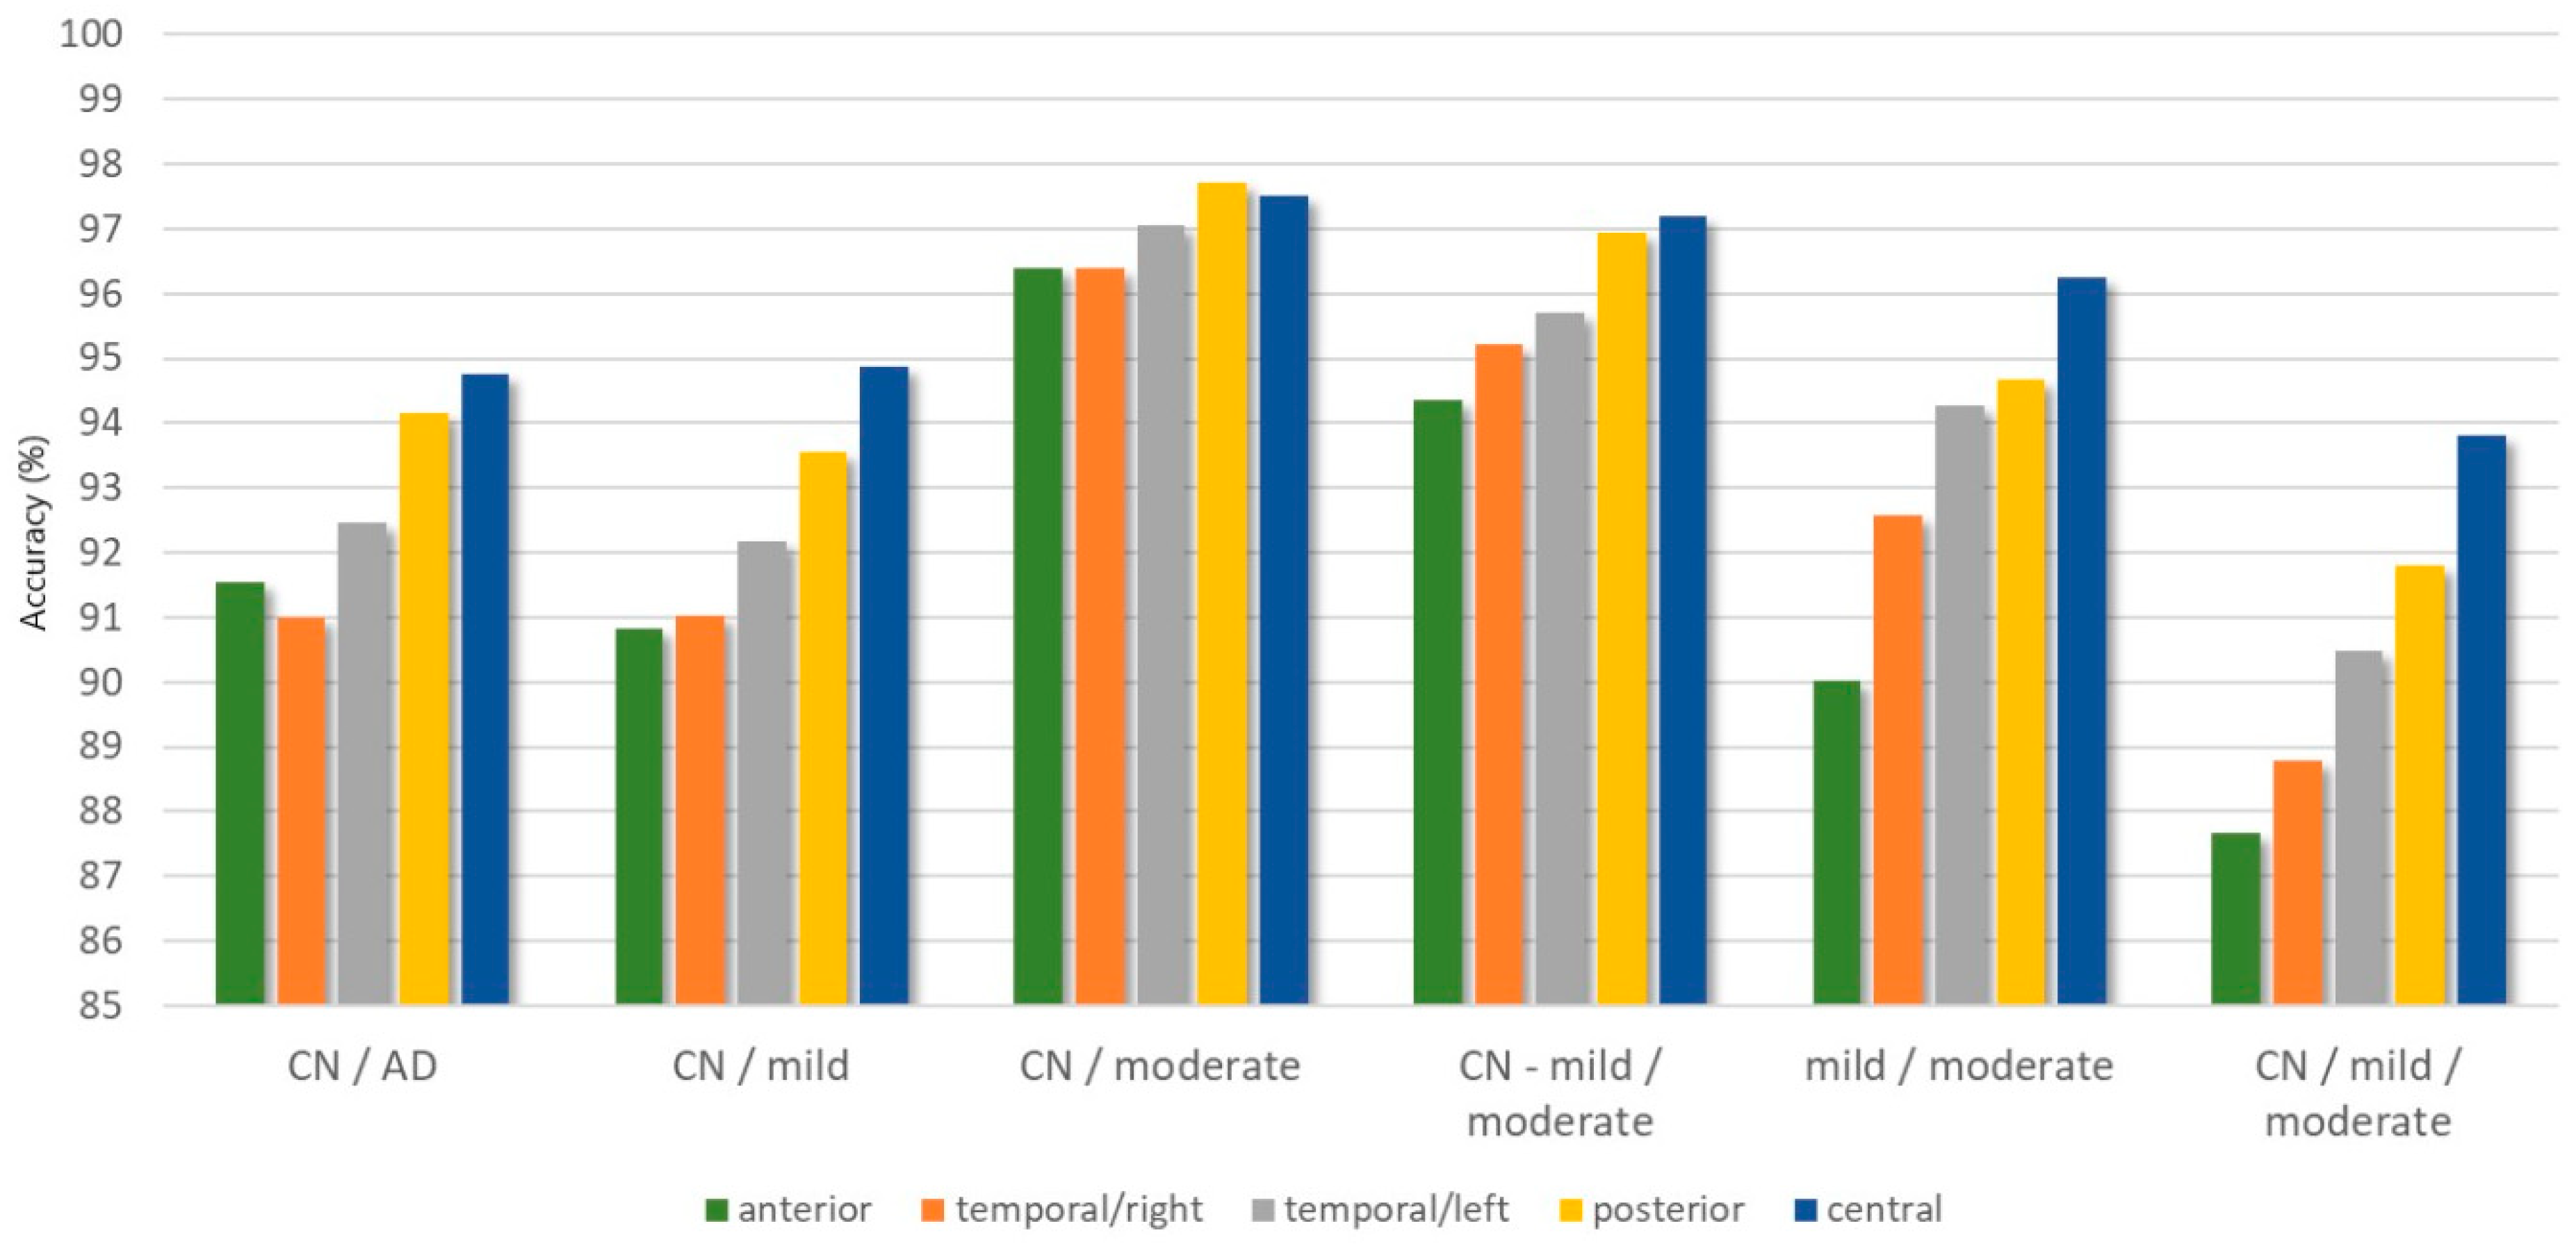
| Classification Problem | ACC (%) | Precision (%) | F1-score | Kappa | |
|---|---|---|---|---|---|
| anterior | CN/AD | 91.53 | 90.32 | 0.9244 | 0.8283 |
| CN/mild | 90.84 | 92.47 | 0.8561 | 0.7894 | |
| CN/moderate | 96.39 | 97.70 | 0.9188 | 0.8957 | |
| CN-mild/moderate | 94.37 | 90.78 | 0.8161 | 0.7833 | |
| mild/moderate | 90.03 | 89.48 | 0.8610 | 0.7835 | |
| CN/mild/moderate | 87.67 | 87.31 | 0.8041 | 0.7861 | |
| central | CN/AD | 94.76 | 94.00 | 0.9534 | 0.8936 |
| CN/mild | 94.87 | 96.44 | 0.9179 | 0.8807 | |
| CN/moderate | 97.51 | 97.68 | 0.9469 | 0.9307 | |
| CN-mild/moderate | 97.19 | 96.40 | 0.9163 | 0.8796 | |
| mild/moderate | 96.24 | 96.44 | 0.9518 | 0.9210 | |
| CN/mild/moderate | 93.80 | 94.43 | 0.9051 | 0.8930 | |
| temporal/left | CN/AD | 92.45 | 91.98 | 0.9337 | 0.8462 |
| CN/mild | 92.18 | 91.53 | 0.8754 | 0.8186 | |
| CN/moderate | 97.05 | 99.11 | 0.9319 | 0.9131 | |
| CN-mild/moderate | 95.71 | 94.49 | 0.8599 | 0.8348 | |
| mild/moderate | 94.28 | 93.78 | 0.9234 | 0.8778 | |
| CN/mild/moderate | 90.49 | 90.73 | 0.8528 | 0.8339 | |
| temporal/right | CN/AD | 90.99 | 88.94 | 0.9148 | 0.8194 |
| CN/mild | 91.02 | 92.12 | 0.8769 | 0.8065 | |
| CN/moderate | 96.40 | 97.95 | 0.9232 | 0.8997 | |
| CN-mild/moderate | 95.23 | 94.80 | 0.8434 | 0.8156 | |
| mild/moderate | 92.57 | 92.93 | 0.8884 | 0.8329 | |
| CN/mild/moderate | 88.78 | 89.83 | 0.8488 | 0.8112 | |
| posterior | CN/AD | 94.17 | 93.90 | 0.9468 | 0.8823 |
| CN/mild | 93.55 | 93.25 | 0.9055 | 0.8566 | |
| CN/moderate | 97.72 | 98.04 | 0.9485 | 0.9338 | |
| CN-mild/moderate | 96.95 | 94.20 | 0.9425 | 0.8492 | |
| mild/moderate | 94.66 | 93.29 | 0.9239 | 0.8828 | |
| CN/mild/moderate | 91.80 | 91.57 | 0.8981 | 0.8600 |
| Authors | No. of Subjects | Window Length | MMSE Range | Method | Classification Problem | ACC |
|---|---|---|---|---|---|---|
| Falk et al. [10] | 11 CN/11 mild/10 moderate | 5 s | CN: 26.6 ± 2.7 mild: 18.5 ± 4.7 mod: 14.8 ± 3.9 | HHT, Amplitude modulation analysis, SVM | CN/AD CN/mild CN/mod mild/mod | 90.60% 74.10% 71.40% 53.80% |
| Deng et al. [11] | 14 CN/14 AD | 8 s | CN: 28–30 AD: 12–15 | Multivariate Multiscale Weighted Permutation Entropy, ROC analysis | CN/AD | 96.70% |
| Kulkarni et al. [12] | 50 CN/50 AD | ~5 s | Spectral entropy, Spectral centroid, Spectral roll-off, Zero Crossing Rate, SVM | CN/AD | 96.00% | |
| Chen et al. [13] | 15 CN/15 AD | 8 s | CN: 28.1–30 AD: 12.5–15.7 | Detrended Fluctuation Analysis, Cross-correlation coefficient, LDA | CN/AD | 90.00% (only C3–P3) |
| Song et al. [14] | 15 CN/15 AD | 8 s | CN: 27.1 ± 1.3 AD: 21.3 ± 5.8 | Brain Functional Connectivity Analysis, weighted-permutation entropy, KNN | CN/AD | 96.63% |
| Simons and Abasolo [15] | 11 CN/11 AD | 5 s | CN: 30 AD: 13.1 ± 5.9 | Distance-based Lempel Ziv Complexity | CN/AD | 78.25% (only O1–O2) |
| This study | 10 CN/14 AD | 12 s | CN: 30 mild: 21 ± 1.3 mod: 15 ± 1.6 | moments, STD, IQR, Energy, RBP, ShanEN, ApEN, TsalEN, PermEN, MSE, SamplEN, Random Forests | CN/AD CN/mild CN/mod mild/mod CN-mild/mod CN/mild/mod | 91.80% 91.77% 96.76% 91.71% 94.99% 88.79% |
© 2019 by the authors. Licensee MDPI, Basel, Switzerland. This article is an open access article distributed under the terms and conditions of the Creative Commons Attribution (CC BY) license (http://creativecommons.org/licenses/by/4.0/).
Share and Cite
Tzimourta, K.D.; Giannakeas, N.; Tzallas, A.T.; Astrakas, L.G.; Afrantou, T.; Ioannidis, P.; Grigoriadis, N.; Angelidis, P.; Tsalikakis, D.G.; Tsipouras, M.G. EEG Window Length Evaluation for the Detection of Alzheimer’s Disease over Different Brain Regions. Brain Sci. 2019, 9, 81. https://0-doi-org.brum.beds.ac.uk/10.3390/brainsci9040081
Tzimourta KD, Giannakeas N, Tzallas AT, Astrakas LG, Afrantou T, Ioannidis P, Grigoriadis N, Angelidis P, Tsalikakis DG, Tsipouras MG. EEG Window Length Evaluation for the Detection of Alzheimer’s Disease over Different Brain Regions. Brain Sciences. 2019; 9(4):81. https://0-doi-org.brum.beds.ac.uk/10.3390/brainsci9040081
Chicago/Turabian StyleTzimourta, Katerina D., Nikolaos Giannakeas, Alexandros T. Tzallas, Loukas G. Astrakas, Theodora Afrantou, Panagiotis Ioannidis, Nikolaos Grigoriadis, Pantelis Angelidis, Dimitrios G. Tsalikakis, and Markos G. Tsipouras. 2019. "EEG Window Length Evaluation for the Detection of Alzheimer’s Disease over Different Brain Regions" Brain Sciences 9, no. 4: 81. https://0-doi-org.brum.beds.ac.uk/10.3390/brainsci9040081