
CYP7A1, NPC1L1, ABCB1, and CD36 Polymorphisms Are Associated with Increased Serum Coenzyme Q10 after Long-Term Supplementation in Women

 , ,
, , 
Abstract
:1. Introduction
2. Materials and Methods
2.1. CoQ10 Supplementation
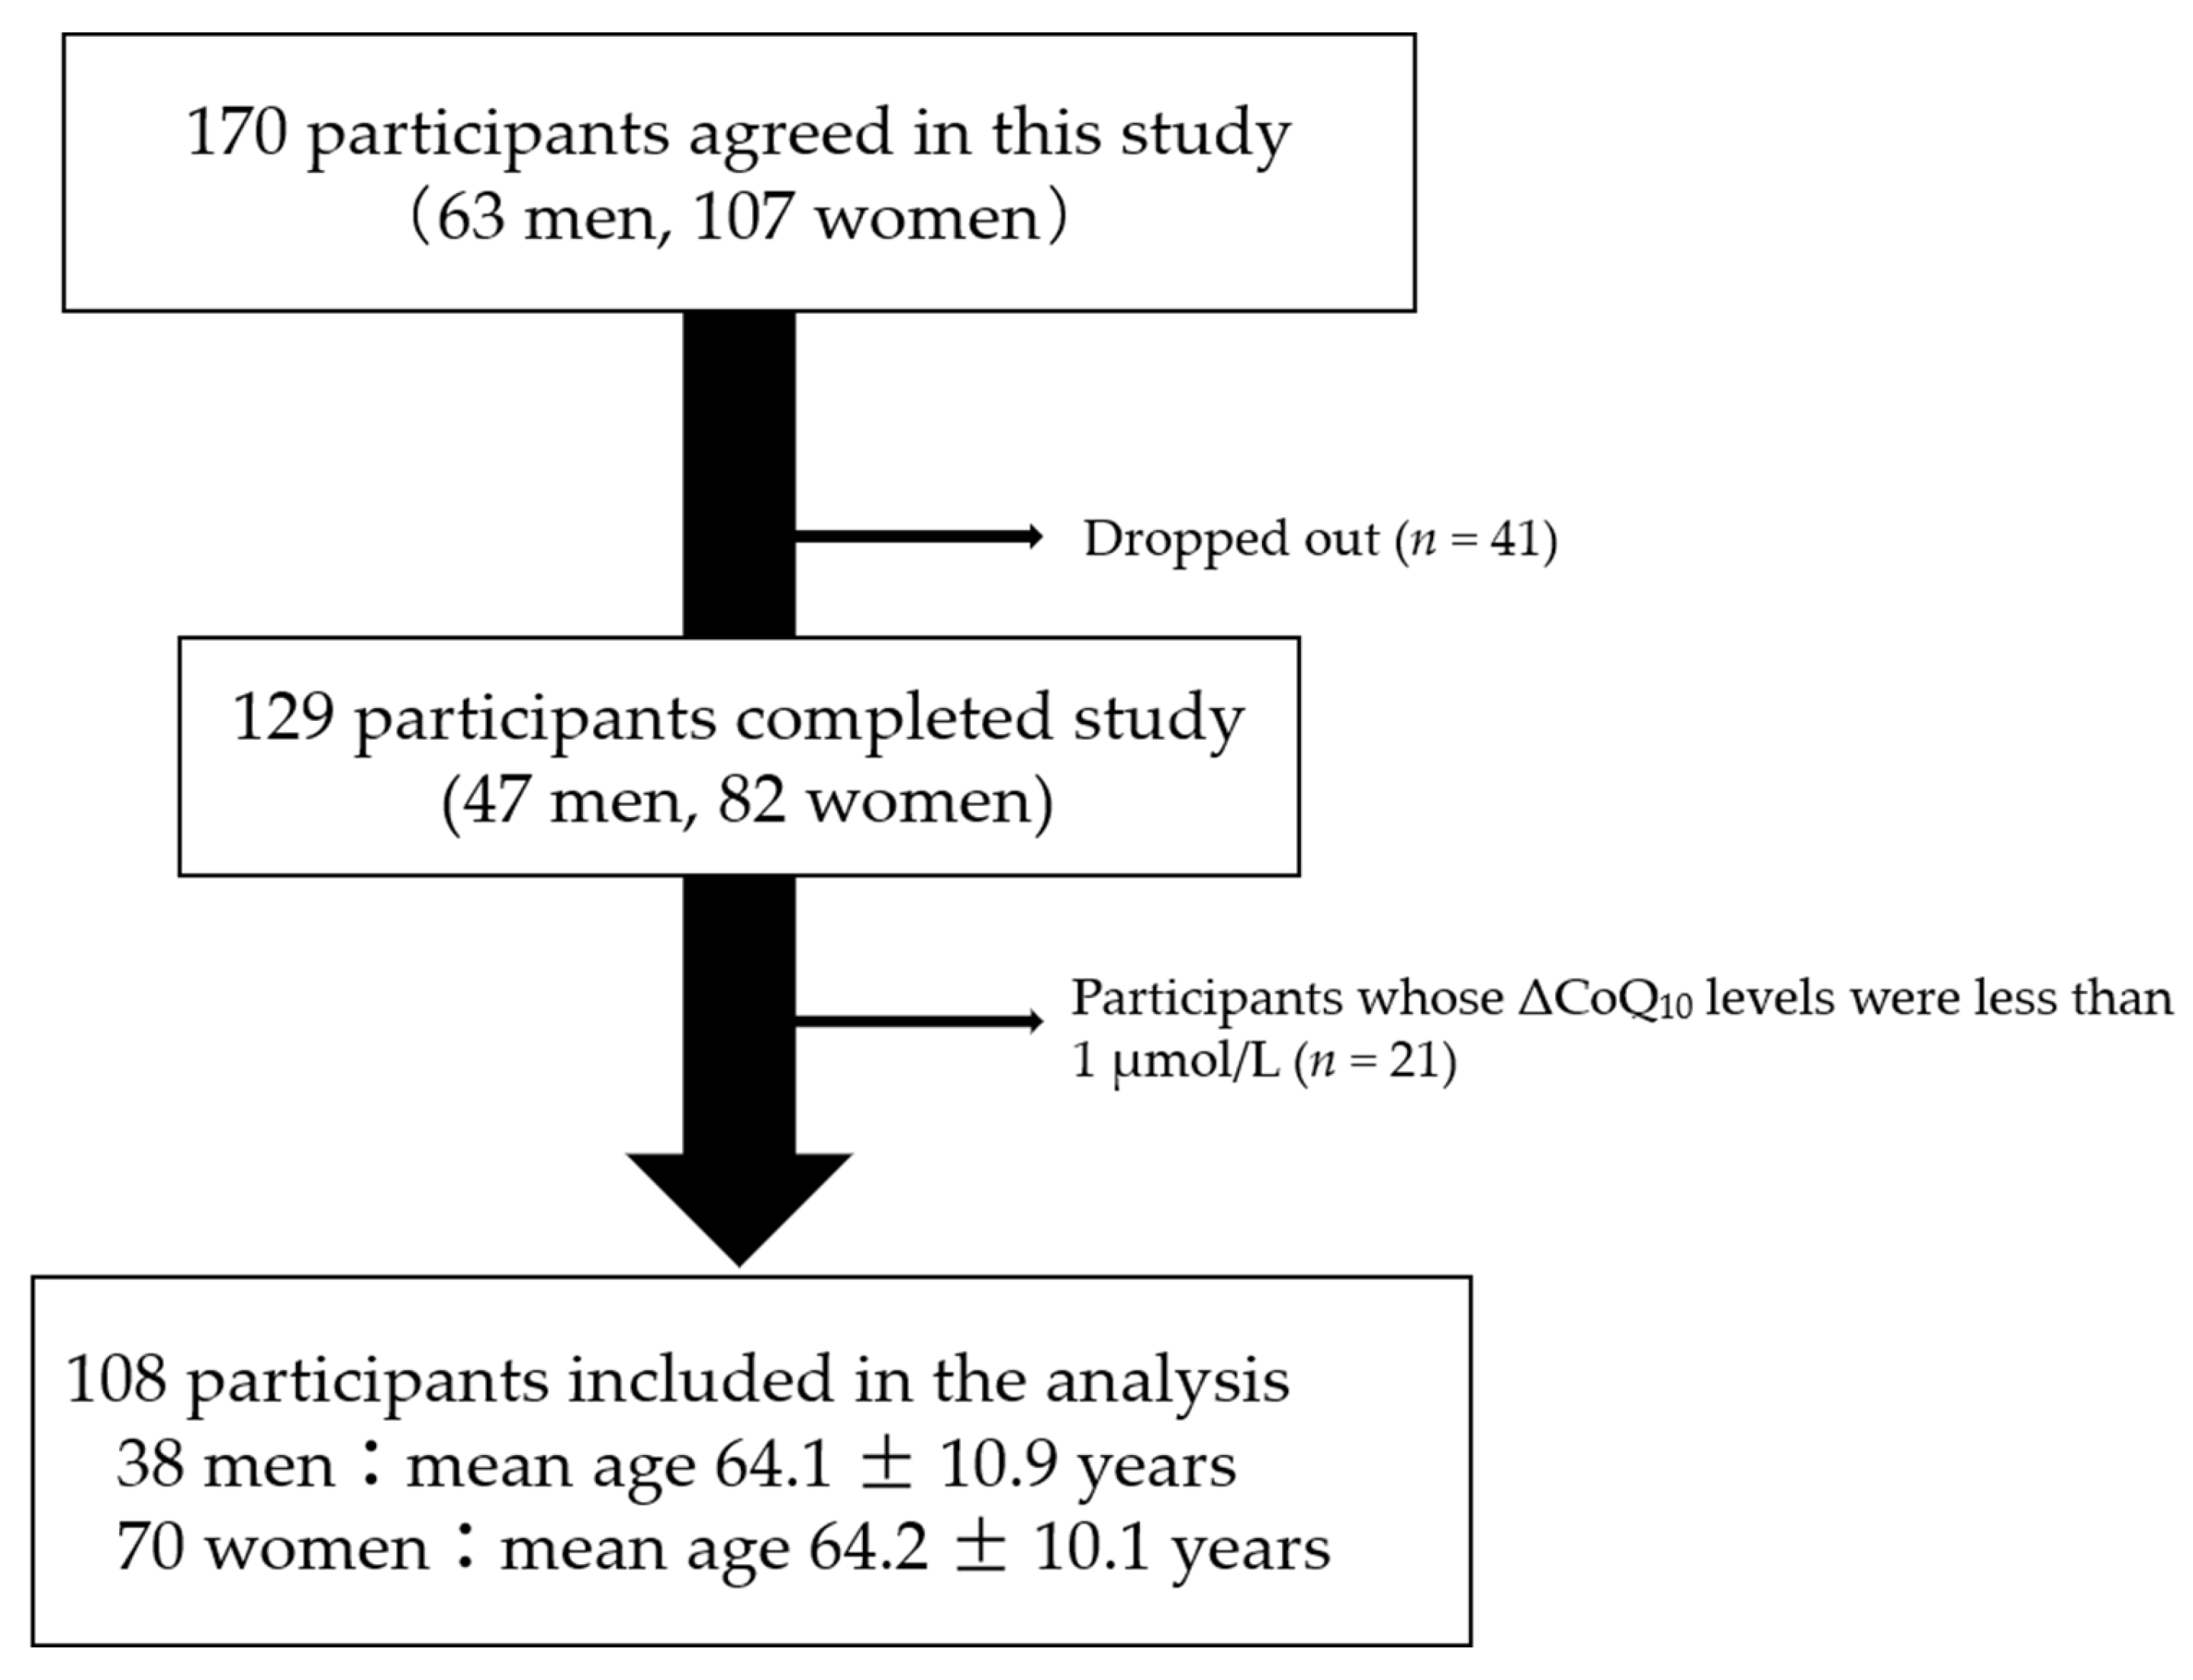
2.2. Study Design
2.3. Measurements of Serum CoQ10 and Total Cholesterol
2.4. Polymerase Chain Reaction (PCR)-Restriction Fragment Length Polymorphism (RFLP) Genotyping
2.5. Data Analysis
3. Results
4. Discussion
5. Conclusions
Supplementary Materials
Author Contributions
Funding
Institutional Review Board Statement
Informed Consent Statement
Data Availability Statement
Acknowledgments
Conflicts of Interest
References
- Crane, F.L. Biochemical Functions of Coenzyme Q10. J. Am. Coll. Nutr. 2001, 20, 591–598. [Google Scholar] [CrossRef]
- Frei, B.; Kim, M.C.; Ames, B.N. Ubiquinol-10 is an effective lipid-soluble antioxidant at physiological concentrations. Proc. Natl. Acad. Sci. USA 1990, 87, 4879–4883. [Google Scholar] [CrossRef] [Green Version]
- López-Lluch, G.; Rodríguez-Aguilera, J.C.; Santos-Ocaña, C.; Navas, P. Is coenzyme Q a key factor in aging? Mech. Ageing Dev. 2010, 131, 225–235. [Google Scholar] [CrossRef] [PubMed]
- Tian, G.; Sawashita, J.; Kubo, H.; Nishio, S.-Y.; Hashimoto, S.; Suzuki, N.; Yoshimura, H.; Tsuruoka, M.; Wang, Y.; Liu, Y.; et al. Ubiquinol-10 Supplementation Activates Mitochondria Functions to Decelerate Senescence in Senescence-Accelerated Mice. Antioxid. Redox Signal. 2014, 20, 2606–2620. [Google Scholar] [CrossRef]
- Yan, J.; Fujii, K.; Yao, J.; Kishida, H.; Hosoe, K.; Sawashita, J.; Takeda, T.; Mori, M.; Higuchi, K. Reduced coenzyme Q10 supplementation decelerates senescence in SAMP1 mice. Exp. Gerontol. 2006, 41, 130–140. [Google Scholar] [CrossRef]
- Varela-López, A.; Ochoa, J.J.; Llamas-Elvira, J.M.; López-Frías, M.; Planells, E.; Ramirez-Tortosa, M.; Ramirez-Tortosa, C.L.; Giampieri, F.; Battino, M.; Quiles, J.L. Age-Related Loss in Bone Mineral Density of Rats Fed Lifelong on a Fish Oil-Based Diet Is Avoided by Coenzyme Q10 Addition. Nutrients 2017, 9, 176. [Google Scholar] [CrossRef] [PubMed] [Green Version]
- Chen, H.-C.; Huang, C.-C.; Lin, T.-J.; Hsu, M.-C.; Hsu, Y.-J. Ubiquinol Supplementation Alters Exercise Induced Fatigue by Increasing Lipid Utilization in Mice. Nutrients 2019, 11, 2550. [Google Scholar] [CrossRef] [PubMed] [Green Version]
- Mantle, D.; Hargreaves, I. Coenzyme Q10 and Degenerative Disorders Affecting Longevity: An Overview. Antioxidants 2019, 8, 44. [Google Scholar] [CrossRef] [Green Version]
- Deguchi, S.; Fujii, K.; Kurihara, T. The effect of the reduced form of coenzyme Q10 (ubiquinol, Kaneka QHTM) on QOL im-provement in the elderly. J. Clin. Ther. Med. 2008, 24, 233–238. [Google Scholar]
- Hofman-Bang, C.; Rehnqvist, N.; Swedberg, K.; Wiklund, I.; Åström, H. Coenzyme Q10 as an adjunctive in the treatment of chronic congestive heart failure. J. Card. Fail. 1995, 1, 101–107. [Google Scholar] [CrossRef]
- Lister, R.E. An Open, Pilot Study to Evaluate the Potential Benefits of Coenzyme Q10 Combined with Ginkgo Biloba Extract in Fibromyalgia Syndrome. J. Int. Med. Res. 2002, 30, 195–199. [Google Scholar] [CrossRef] [PubMed]
- Castro-Marrero, J.; Cordero, M.D.; Segundo, M.J.; Sáez-Francàs, N.; Calvo, N.; Román-Malo, L.; Aliste, L.; De Sevilla, T.F.; Alegre, J. Does Oral Coenzyme Q10 Plus NADH Supplementation Improve Fatigue and Biochemical Parameters in Chronic Fatigue Syndrome? Antioxid. Redox Signal. 2015, 22, 679–685. [Google Scholar] [CrossRef] [PubMed] [Green Version]
- Castro-Marrero, J.; Sáez-Francàs, N.; Segundo, M.J.; Calvo, N.; Faro, M.; Aliste, L.; De Sevilla, T.F.; Alegre, J. Effect of coenzyme Q10 plus nicotinamide adenine dinucleotide supplementation on maximum heart rate after exercise testing in chronic fatigue syndrome—A randomized, controlled, double-blind trial. Clin. Nutr. 2016, 35, 826–834. [Google Scholar] [CrossRef] [PubMed] [Green Version]
- Banach, M.; Serban, C.; Sahebkar, A.; Ursoniu, S.; Rysz, J.; Muntner, P.; Toth, P.P.; Jones, S.R.; Rizzo, M.; Glasser, S.P.; et al. Effects of coenzyme Q10 on statin-induced myopathy: A meta-analysis of randomized controlled trials. Mayo Clin. Proc. 2015, 90, 24–34. [Google Scholar] [CrossRef]
- Kennedy, C.; Koller, Y.; Surkova, E. Effect of Coenzyme Q10 on statin-associated myalgia and adherence to statin therapy: A systematic review and meta-analysis. Atherosclerosis 2020, 299, 1–8. [Google Scholar] [CrossRef]
- Negida, A.; Menshawy, A.; El Ashal, G.; ElFouly, Y.; Hani, Y.; Hegazy, Y.; El Ghonimy, S.; Fouda, S.; Rashad, Y. Coenzyme Q10 for Patients with Parkinson’;s Disease: A Systematic Review and Meta-Analysis. CNS Neurol. Disord. Drug Targets 2016, 15, 45–53. [Google Scholar] [CrossRef]
- Saboori, S.; Rad, E.Y.; Mardani, M.; Khosroshahi, M.Z.; Nouri, Y.; Falahi, E. Effect of Q10 supplementation on body weight and body mass index: A systematic review and meta-analysis of randomized controlled clinical trials. Diabetes Metab. Syndr. Clin. Res. Rev. 2019, 13, 1179–1185. [Google Scholar] [CrossRef]
- Arenas-Jal, M.; Suñé-Negre, J.M.; García-Montoya, E. Coenzyme Q10 supplementation: Efficacy, safety, and formulation challenges. Compr. Rev. Food Sci. Food Saf. 2020, 19, 574–594. [Google Scholar] [CrossRef] [Green Version]
- Barakat, A.; Shegokar, R.; Dittgen, M.; Müller, R.H. Coenzyme Q10 oral bioavailability: Effect of formulation type. J. Pharm. Investig. 2013, 43, 431–451. [Google Scholar] [CrossRef]
- Hosoe, K.; Kitano, M.; Kishida, H.; Kubo, H.; Fujii, K.; Kitahara, M. Study on safety and bioavailability of ubiquinol (Kaneka QH™) after single and 4-week multiple oral administration to healthy volunteers. Regul. Toxicol. Pharmacol. 2007, 47, 19–28. [Google Scholar] [CrossRef]
- López-Lluch, G.; del Pozo-Cruz, J.; Sánchez-Cuesta, A.; Cortés-Rodríguez, A.B.; Navas, P. Bioavailability of coenzyme Q10 supplements depends on carrier lipids and solubilization. Nutrient 2019, 57, 133–140. [Google Scholar] [CrossRef]
- Evans, M.; Baisley, J.; Barss, S.; Guthrie, N. A randomized, double-blind trial on the bioavailability of two CoQ10 formulations. J. Funct. Foods 2009, 1, 65–73. [Google Scholar] [CrossRef]
- Pravst, I.; Aguilera, J.C.R.; Rodriguez, A.B.C.; Jazbar, J.; Locatelli, I.; Hristov, H.; Žmitek, K. Comparative Bioavailability of Different Coenzyme Q10 Formulations in Healthy Elderly Individuals. Nutriets 2020, 12, 784. [Google Scholar] [CrossRef] [Green Version]
- Qin, B.; Liu, L.; Pan, Y.; Zhu, Y.; Wu, X.; Song, S.; Han, G. PEGylated Solanesol for Oral Delivery of Coenzyme Q10. J. Agric. Food Chem. 2017, 65, 3360–3367. [Google Scholar] [CrossRef]
- Alehagen, U.; Aaseth, J.; Alexander, J.; Johansson, P.; Larsson, A. Supplemental selenium and coenzyme Q10 reduce glycation along with cardiovascular mortality in an elderly population with low selenium status—A four-year, prospective, randomised, double-blind placebo-controlled trial. J. Trace Elements Med. Biol. 2020, 61, 126541. [Google Scholar] [CrossRef]
- Kinoshita, T.; Maruyama, K.; Tanigawa, T. The Effects of Long-Term Ubiquinol Intake on Improving the Quality of Life of Community Residents. Funct. Foods Health Dis. 2016, 6, 16. [Google Scholar] [CrossRef] [Green Version]
- Mantle, D.; Dybring, A. Bioavailability of Coenzyme Q10: An Overview of the Absorption Process and Subsequent Metabolism. Antioxidants 2020, 9, 386. [Google Scholar] [CrossRef] [PubMed]
- Nashimoto, S.; Takekawa, Y.; Takekuma, Y.; Sugawara, M.; Sato, Y. Transport via Niemann-Pick C1 Like 1 contributes to the intestinal absorption of ubiquinone. Drug Metab. Pharmacokinet. 2020, 35, 527–533. [Google Scholar] [CrossRef]
- Takekawa, Y.; Sato, Y.; Yamaki, Y.; Imai, M.; Noto, K.; Sumi, M.; Takekuma, Y.; Iseki, K.; Sugawara, M. An Approach to Improve Intestinal Absorption of Poorly Absorbed Water-Insoluble Components via Niemann–Pick C1-Like 1. Biol. Pharm. Bull. 2016, 39, 301–307. [Google Scholar] [CrossRef] [PubMed] [Green Version]
- Niklowitz, P.; Onur, S.; Fischer, A.; Laudes, M.; Palussen, M.; Menke, T.; Döring, F. Coenzyme Q10 serum concentration and redox status in European adults: Influence of age, sex, and lipoprotein concentration. J. Clin. Biochem. Nutr. 2016, 58, 240–245. [Google Scholar] [CrossRef] [PubMed] [Green Version]
- Padilla-Lopez, S.; Jiménez-Hidalgo, M.; Martin-Montalvo, A.; Clarke, C.F.; Navas, P.; Santos-Ocaña, C. Genetic evidence for the requirement of the endocytic pathway in the uptake of coenzyme Q6 in Saccharomyces cerevisiae. Biochim. Biophys. Acta (BBA) Biomembr. 2009, 1788, 1238–1248. [Google Scholar] [CrossRef] [PubMed] [Green Version]
- Anderson, C.M.; Kazantzis, M.; Wang, J.; Venkatraman, S.; Goncalves, R.L.S.; Quinlan, C.L.; Ngoc, V.A.-A.; Jastroch, M.; Benjamin, D.I.; Nie, B.; et al. Dependence of Brown Adipose Tissue Function on CD36-Mediated Coenzyme Q Uptake. Cell Rep. 2015, 10, 505–515. [Google Scholar] [CrossRef] [PubMed] [Green Version]
- Itagaki, S.; Ochiai, A.; Kobayashi, M.; Sugawara, M.; Hirano, T.; Iseki, K. Interaction of Coenzyme Q10 with the Intestinal Drug Transporter P-Glycoprotein. J. Agric. Food Chem. 2008, 56, 6923–6927. [Google Scholar] [CrossRef]
- Wolking, S.; Schaeffeler, E.; Lerche, H.; Schwab, M.; Nies, A.T. Impact of Genetic Polymorphisms of ABCB1 (MDR1, P-Glycoprotein) on Drug Disposition and Potential Clinical Implications: Update of the Literature. Clin. Pharmacokinet. 2015, 54, 709–735. [Google Scholar] [CrossRef]
- Ramos-Arellano, L.E.; Salgado-Bernabé, A.B.; Guzmán-Guzmán, I.P.; Salgado-Goytia, L.; Muñoz-Valle, J.F.; Parra-Rojas, I. CD36 haplotypes are associated with lipid profile in normal-weight subjects. Lipids Health Dis. 2013, 12, 167. [Google Scholar] [CrossRef] [Green Version]
- Tomei, S.; Singh, P.; Mathew, R.; Mattei, V.; Garand, M.; Alwakeel, M.; Sharif, E.; Al Khodor, S. The Role of Polymorphisms in Vitamin D-Related Genes in Response to Vitamin D Supplementation. Nutrients 2020, 12, 2608. [Google Scholar] [CrossRef]
- Degenhardt, F.; Niklowitz, P.; Szymczak, S.; Jacobs, G.; Lieb, W.; Menke, T.; Laudes, M.; Esko, T.; Weidinger, S.; Franke, A.; et al. Genome-wide association study of serum coenzyme Q10levels identifies susceptibility loci linked to neuronal diseases. Hum. Mol. Genet. 2016, 25, 2881–2891. [Google Scholar] [CrossRef] [Green Version]
- Fischer, A.; Schmelzer, C.; Rimbach, G.; Niklowitz, P.; Menke, T.; Döring, F. Association between genetic variants in the Coenzyme Q10 metabolism and Coenzyme Q10 status in humans. BMC Res. Notes 2011, 4, 245. [Google Scholar] [CrossRef] [Green Version]
- Kinoshita, T.; Fujii, K. Long-Term Intake of Ubiquinol May Improve Cognitive Performance in Community Residents. J. Jpn. Assoc. Rural. Med. 2019, 68, 8–17. [Google Scholar] [CrossRef] [Green Version]
- Ushikoshi-Nakayama, R.; Ryo, K.; Yamazaki, T.; Kaneko, M.; Sugano, T.; Ito, Y.; Matsumoto, N.; Saito, I. Effect of gummy candy containing ubiquinol on secretion of saliva: A randomized, double-blind, placebo-controlled parallel-group comparative study and an in vitro study. PLoS ONE 2019, 14, e0214495. [Google Scholar] [CrossRef] [Green Version]
- Takahashi, M.; Nagata, M.; Kaneko, T.; Suzuki, T. Miso Soup Consumption Enhances the Bioavailability of the Reduced Form of Supplemental Coenzyme Q10. J. Nutr. Metab. 2020, 2020, 5349086. [Google Scholar] [CrossRef] [Green Version]
- Meaney, S. Epigenetic regulation of cholesterol homeostasis. Front. Genet. 2014, 5, 311. [Google Scholar] [CrossRef] [Green Version]
- Sahoo, S.; Aurich, M.K.; Jonsson, J.J.; Thiele, I. Membrane transporters in a human genome-scale metabolic knowledgebase and their implications for disease. Front. Physiol. 2014, 5, 91. [Google Scholar] [CrossRef] [PubMed] [Green Version]
- Wang, Y.; Harding, S.V.; Thandapilly, S.J.; Tosh, S.M.; Jones, P.J.H.; Ames, N.P. Barley β-glucan reduces blood cholesterol levels via interrupting bile acid metabolism. Br. J. Nutr. 2017, 118, 822–829. [Google Scholar] [CrossRef] [Green Version]
- Wu, J.; Cui, W.; Cai, Q.; Fei, J.; Zhang, S.-D.; Han, T.-Q.; Hu, H.; Jiang, Z.-Y. The NPC1L1 Polymorphism 1679C>G Is Associated with Gallstone Disease in Chinese Patients. PLoS ONE 2016, 11, e0147562. [Google Scholar] [CrossRef] [Green Version]
- Samanian, S.; Mahjoubi, F.; Mahjoubi, B.; Mirzaee, R.; Azizi, R. MDR1 gene polymorphisms: Possible association with its ex-pression and clinicopathology characteristics in colorectal cancer patients. Asian Pac. J. Cancer Prev. 2011, 12, 3141–3145. [Google Scholar] [PubMed]
- Riera, P.; Artigas-Baleri, A.; Salazar, J.; Sebio, A.; Virgili, A.C.; Arranz, M.J.; Páez, D. ABCB1 Genetic Variants as Predictors of Irinotecan-Induced Severe Gastrointestinal Toxicity in Metastatic Colorectal Cancer Patients. Front. Pharmacol. 2020, 11, 973. [Google Scholar] [CrossRef]
- Silverstein, R.L.; Febbraio, M. CD36, a Scavenger Receptor Involved in Immunity, Metabolism, Angiogenesis, and Behavior. Sci. Signal. 2009, 2, re3. [Google Scholar] [CrossRef] [Green Version]
- Love-Gregory, L.; Sherva, R.; Schappe, T.; Qi, J.-S.; McCrea, J.; Klein, S.; Connelly, M.A.; Abumrad, N.A. Common CD36 SNPs reduce protein expression and may contribute to a protective atherogenic profile. Hum. Mol. Genet. 2010, 20, 193–201. [Google Scholar] [CrossRef] [PubMed] [Green Version]
- Sollai, G.; Melis, M.; Mastinu, M.; Pani, D.; Cosseddu, P.; Bonfiglio, A.; Crnjar, R.; Tepper, B.J.; Barbarossa, I.T. Human Tongue Electrophysiological Response to Oleic Acid and Its Associations with PROP Taster Status and the CD36 Polymorphism (rs1761667). Nutrients 2019, 11, 315. [Google Scholar] [CrossRef] [PubMed] [Green Version]
- Kimchi-Sarfaty, C.; Oh, J.M.; Kim, I.-W.; Sauna, Z.E.; Calcagno, A.M.; Ambudkar, S.V.; Gottesman, M.M. A "Silent" Polymorphism in the MDR1 Gene Changes Substrate Specificity. Science 2007, 315, 525–528. [Google Scholar] [CrossRef] [PubMed] [Green Version]
- Iwanicki, T.; Balcerzyk, A.; Niemiec, P.; Trautsolt, W.; Grzeszczak, W.; Ochalska-Tyka, A.; Krauze, J.; Nowak, T.; Żak, I. The relationship betweenCYP7A1polymorphisms, coronary artery disease & serum lipid markers. Biomark. Med. 2019, 13, 1199–1208. [Google Scholar] [CrossRef] [PubMed]
- Srivastava, A.; Choudhuri, G.; Mittal, B. CYP7A1 (−204 A>C; rs3808607 and −469 T>C; rs3824260) promoter polymorphisms and risk of gallbladder cancer in North Indian population. Metabolism 2010, 59, 767–773. [Google Scholar] [CrossRef]
- Miao, L.; Yin, R.-X.; Hu, X.-J.; Wu, D.-F.; Cao, X.-L.; Li, Q.; Yan, T.-T.; Aung, L.H.H.; Wu, J.-Z.; Lin, W.-X. Association of rs2072183 SNP and serum lipid levels in the Mulao and Han populations. Lipids Health Dis. 2012, 11, 61. [Google Scholar] [CrossRef] [Green Version]
- Kim, D.S.; Burt, A.A.; Ranchalis, J.E.; Jarvik, E.R.; Rosenthal, E.A.; Hatsukami, T.S.; Furlong, C.E.; Jarvik, G.P. Novel gene-by-environment interactions: APOB and NPC1L1 variants affect the relationship between dietary and total plasma cholesterol. J. Lipid Res. 2013, 54, 1512–1520. [Google Scholar] [CrossRef] [PubMed] [Green Version]
- Martinelli, M.; Scapoli, L.; Cura, F.; Rodia, M.T.; Ugolini, G.; Montroni, I.; Solmi, R. Colorectal cancer susceptibility: Apparent gender-related modulation by ABCB1 gene polymorphisms. J. Biomed. Sci. 2014, 21, 1–8. [Google Scholar] [CrossRef] [PubMed] [Green Version]
- Chu, Y.; Lao, W.; Jin, G.; Dai, D.; Chen, L.; Kang, H. Evaluation of the relationship between CD36 and MARCO single-nucleotide polymorphisms and susceptibility to carotid atherosclerosis in a Chinese Han population. Gene 2017, 633, 66–70. [Google Scholar] [CrossRef]


| No. | Gene | dbSNP ID | Major Allele | Minor Allele | Forward Primer Sequence | Reverse Primer Sequence | PCR Product Size | Restriction Enzyme | Expected Band Pattern after Digestion (Allele) |
|---|---|---|---|---|---|---|---|---|---|
| 1 | SREBP2 | rs133291 | C | T | 5’-AAC AGT TTG ACA GCA AAG CAG A-3’ | 5’-CTT TCT CTT GCC CCA TCA TTA C-3’ | 381 bp | BtgI | 238 bp + 143 bp (C) 381 bp (T) |
| 2 | HMGCR | rs3846663 | C | T | 5’-TCA GCC TAA TCC ATT GTG TCC-3’ | 5’-CTT TGC ATG CTC CTT GAA CA-3’ | 333 bp | HpyCH4III | 150 bp + 110 bp + 73 bp (C) 183 + 150 bp (T) |
| 3 | APOB | rs1042034 | A | G | 5’-TTA TCA AAA GAA GCC CAA GAG G-3’ | 5’-ACG AAG GGC CAT AAT GTA TTG A-3’ | 330 bp | TspRI | 330 bp (A)187 bp + 143 bp (G) |
| 4 | CYP7A1 | rs3808607 | G | T | 5’-AAG GAT GCC ACT GAA AAG AGA C-3’ | 5’-CTC TCT GGC AAA GCA CCT AAA T-3’ | 441 bp | BsaI-HF | 221 bp + 180 bp + 40 bp (G) 261 bp + 180 bp (T) |
| 5 | NPC1L1 | rs2072183 | C | G | 5’-AAT GAG TCC CAA GGT GAC CA-3’ | 5’-ACC ACC GGG ATG ACA GAT AG-3’ | 362 bp | TaqaI | 275 bp + 87 bp (C) 362 bp (G) |
| 6 | ABCB1 | rs1045642 | C | T | 5’-AAA GTG TGC TGG TCC TGA AGT T-3’ | 5’-TTC TCT TCA CTT CTG GGA GAC C-3’ | 350 bp | MboI | 172 bp + 152 bp + 26 bp (C) 324 bp + 26 bp (T) |
| 7 | ABCB1 | rs2032582 | G | T | 5’-ATA GCA AAT CTT GGG ACA GGA A-3’ | 5’-CCA AGA ACT GGC TTT GCT ACT T-3’ | 352 bp | BseYI | 192 bp + 160 bp (G) 352 bp (T) |
| 8 | CD36 | rs1761667 | G | A | 5’-GCC TCT GAA TTT ATG CAT GTT G-3’ | 5’-CGC CTT AGA ATA TTT TGG GAG A-3’ | 325 bp | HhaI | 174 bp + 151 bp (G) 325 bp (A) |
| Characteristics | All (n = 108) | Men (n = 38) | Women (n = 70) | p-Value | |
|---|---|---|---|---|---|
| Age | 64.2 ± 10.4 | 64.1 ± 10.9 | 64.2 ± 10.1 | 0.95 | |
| CoQ10 | (µmol/L) | 1.17 ± 0.38 | 1.28 ± 0.36 | 1.11 ± 0.38 | 0.025 |
| TC | (mmol/L) | 5.09 ± 0.81 | 4.87 ± 0.88 | 5.21 ± 0.75 | 0.051 |
| CoQ10/TC | (µmol/mol) | 232 ± 74 | 269 ± 82 | 213 ± 60 | 0.0005 |
| SNP ID | Gene | Major > Minor | p-Value (HR/LR) | |||
|---|---|---|---|---|---|---|
| Men | Women | |||||
| ΔCoQ10 | Δ[CoQ10/TC] | ΔCoQ10 | Δ[CoQ10/TC] | |||
| rs133291 | SREBP2 | C > T | 0.93 | 0.24 | 0.19 | 0.31 |
| rs3846663 | HMGCR | C > T | 0.68 | 0.061 | 0.58 | 0.43 |
| rs1042034 | APOB | A > G | 0.95 | 0.62 | 0.80 | 0.58 |
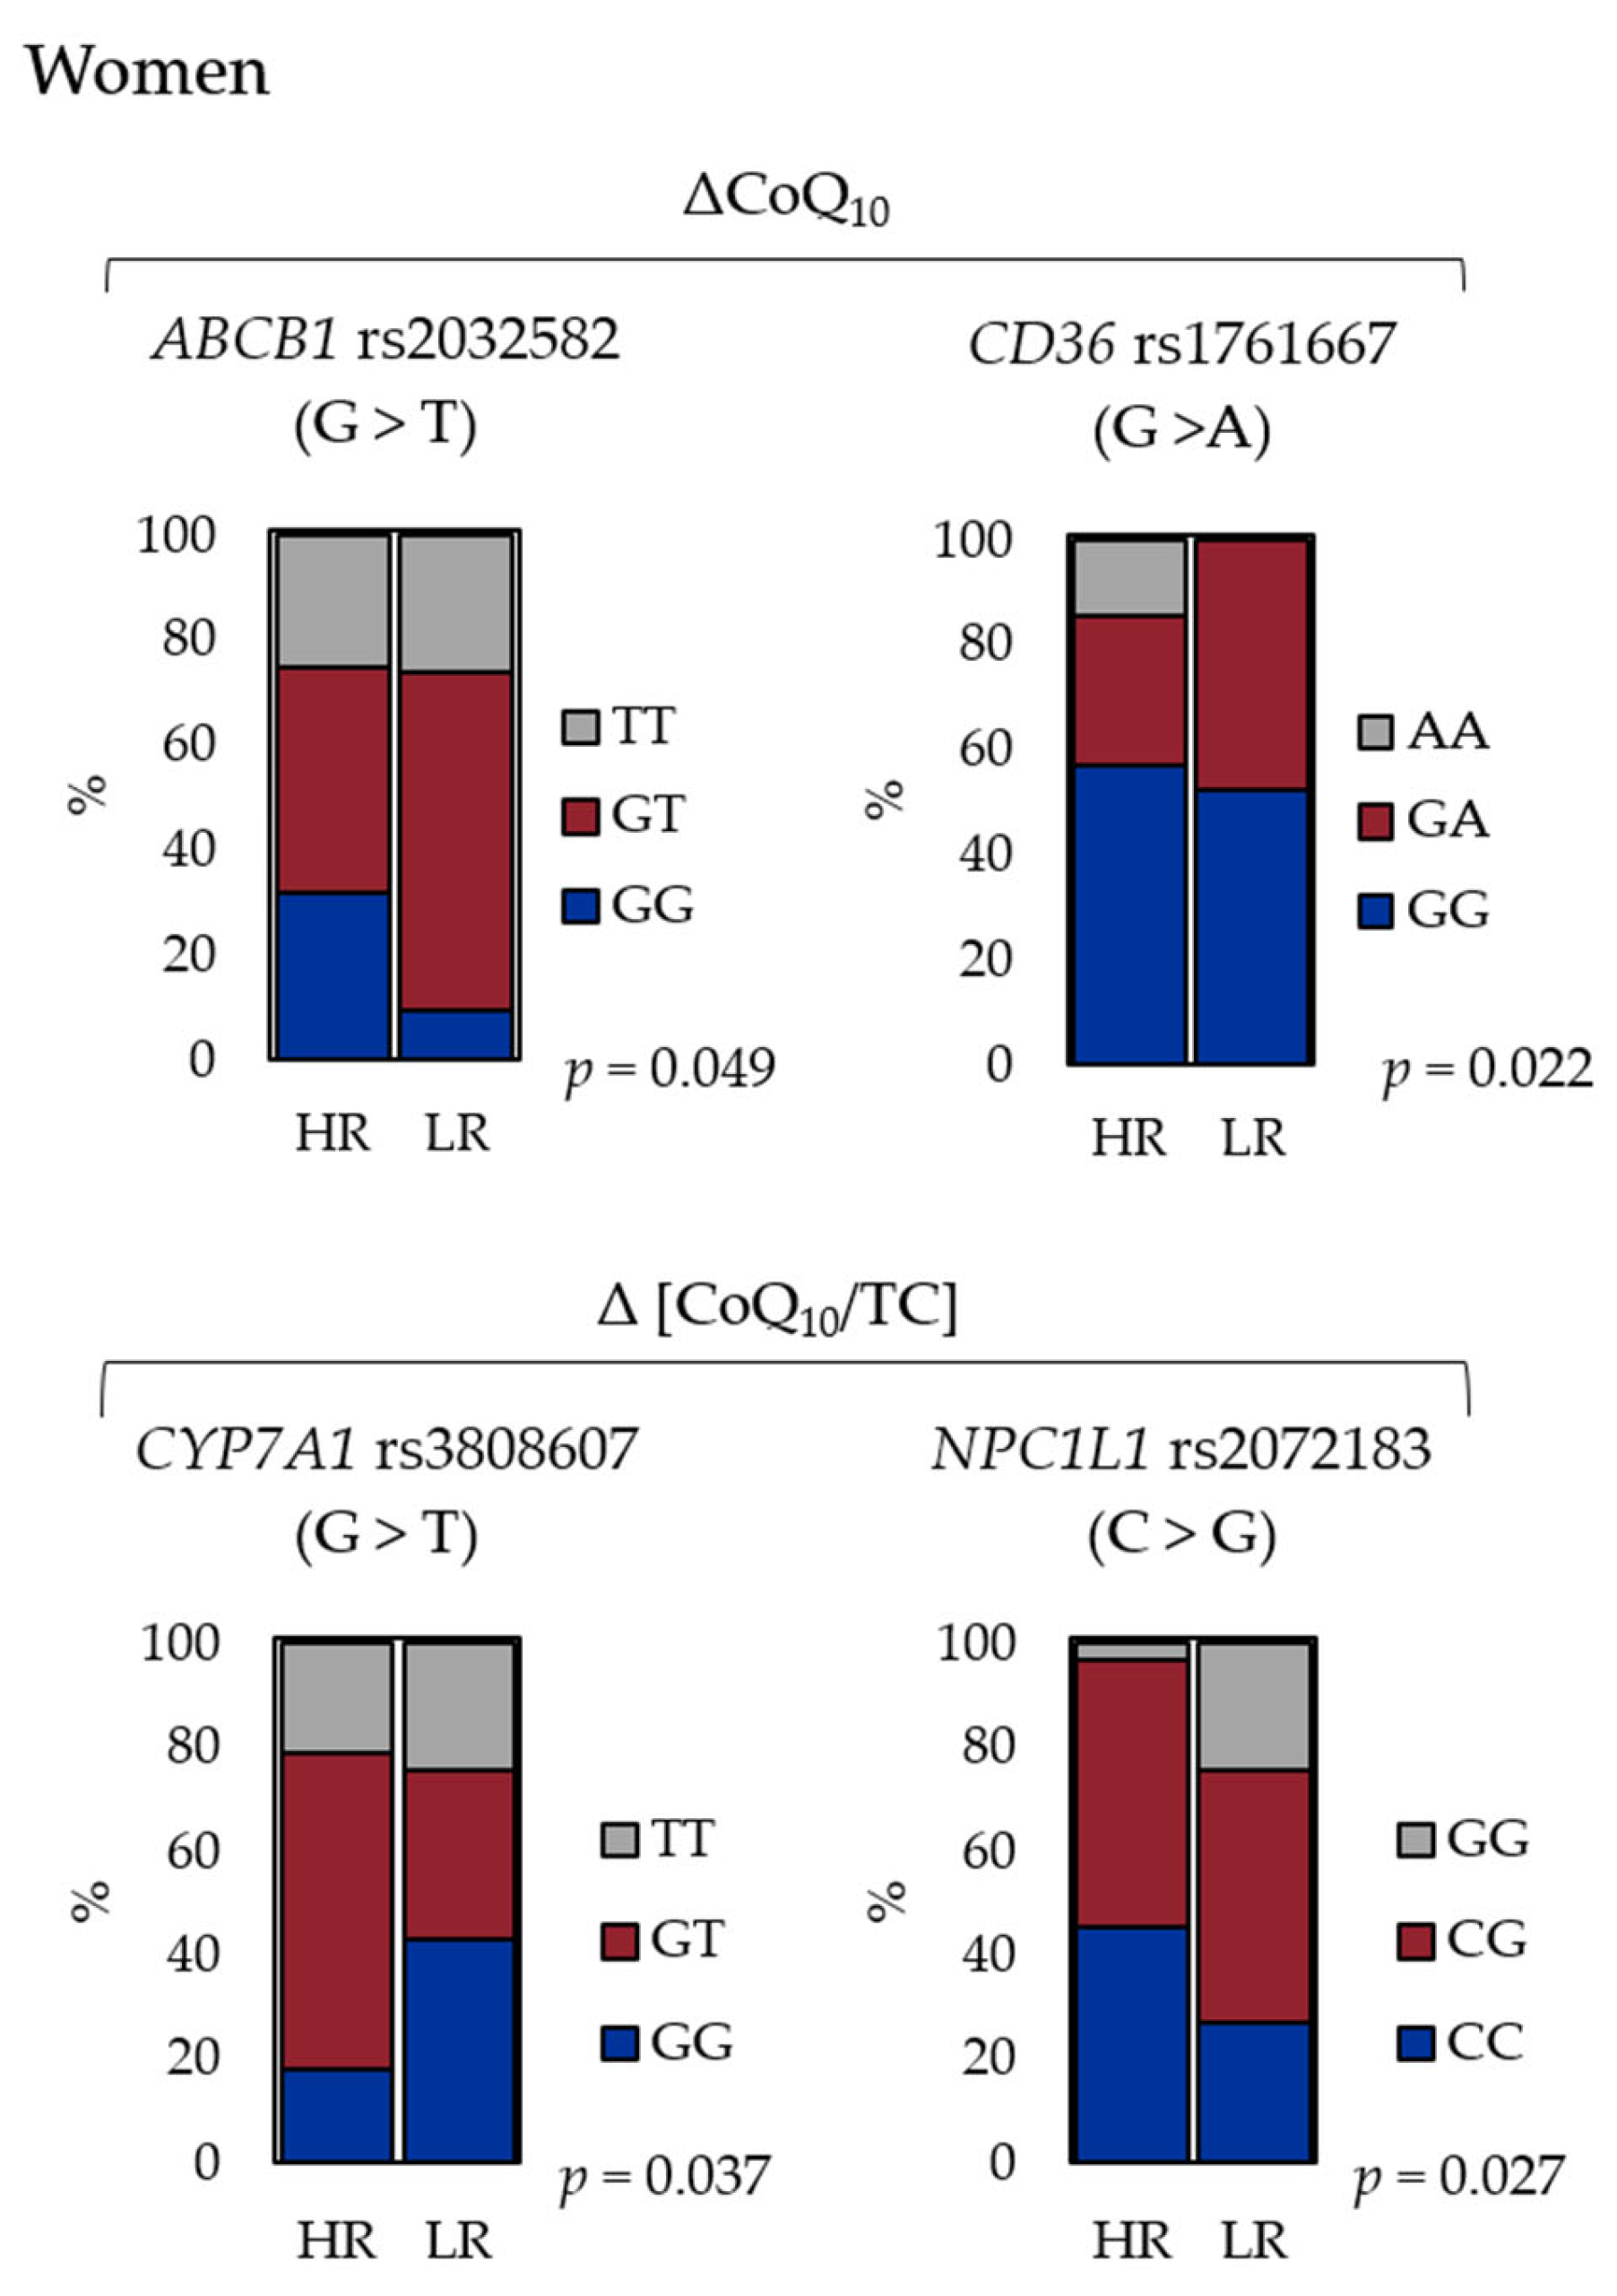
| rs3808607 | CYP7A1 | G > T | 0.41 | 0.61 | 0.24 | 0.037 |
| rs2072183 | NPC1L1 | C > G | 0.48 | 0.46 | 0.10 | 0.027 |
| rs1045642 | ABCB1 | C > T | 0.32 | 0.57 | 0.29 | 0.27 |
| rs2032582 | ABCB1 | G > T | 0.66 | 0.57 | 0.049 | 0.053 |
| rs1761667 | CD36 | G > A | 0.13 | 0.36 | 0.022 | 0.075 |
| N | p-Value | ||
|---|---|---|---|
| Group 1 | Group 2 | ||
| ΔCoQ10 | |||
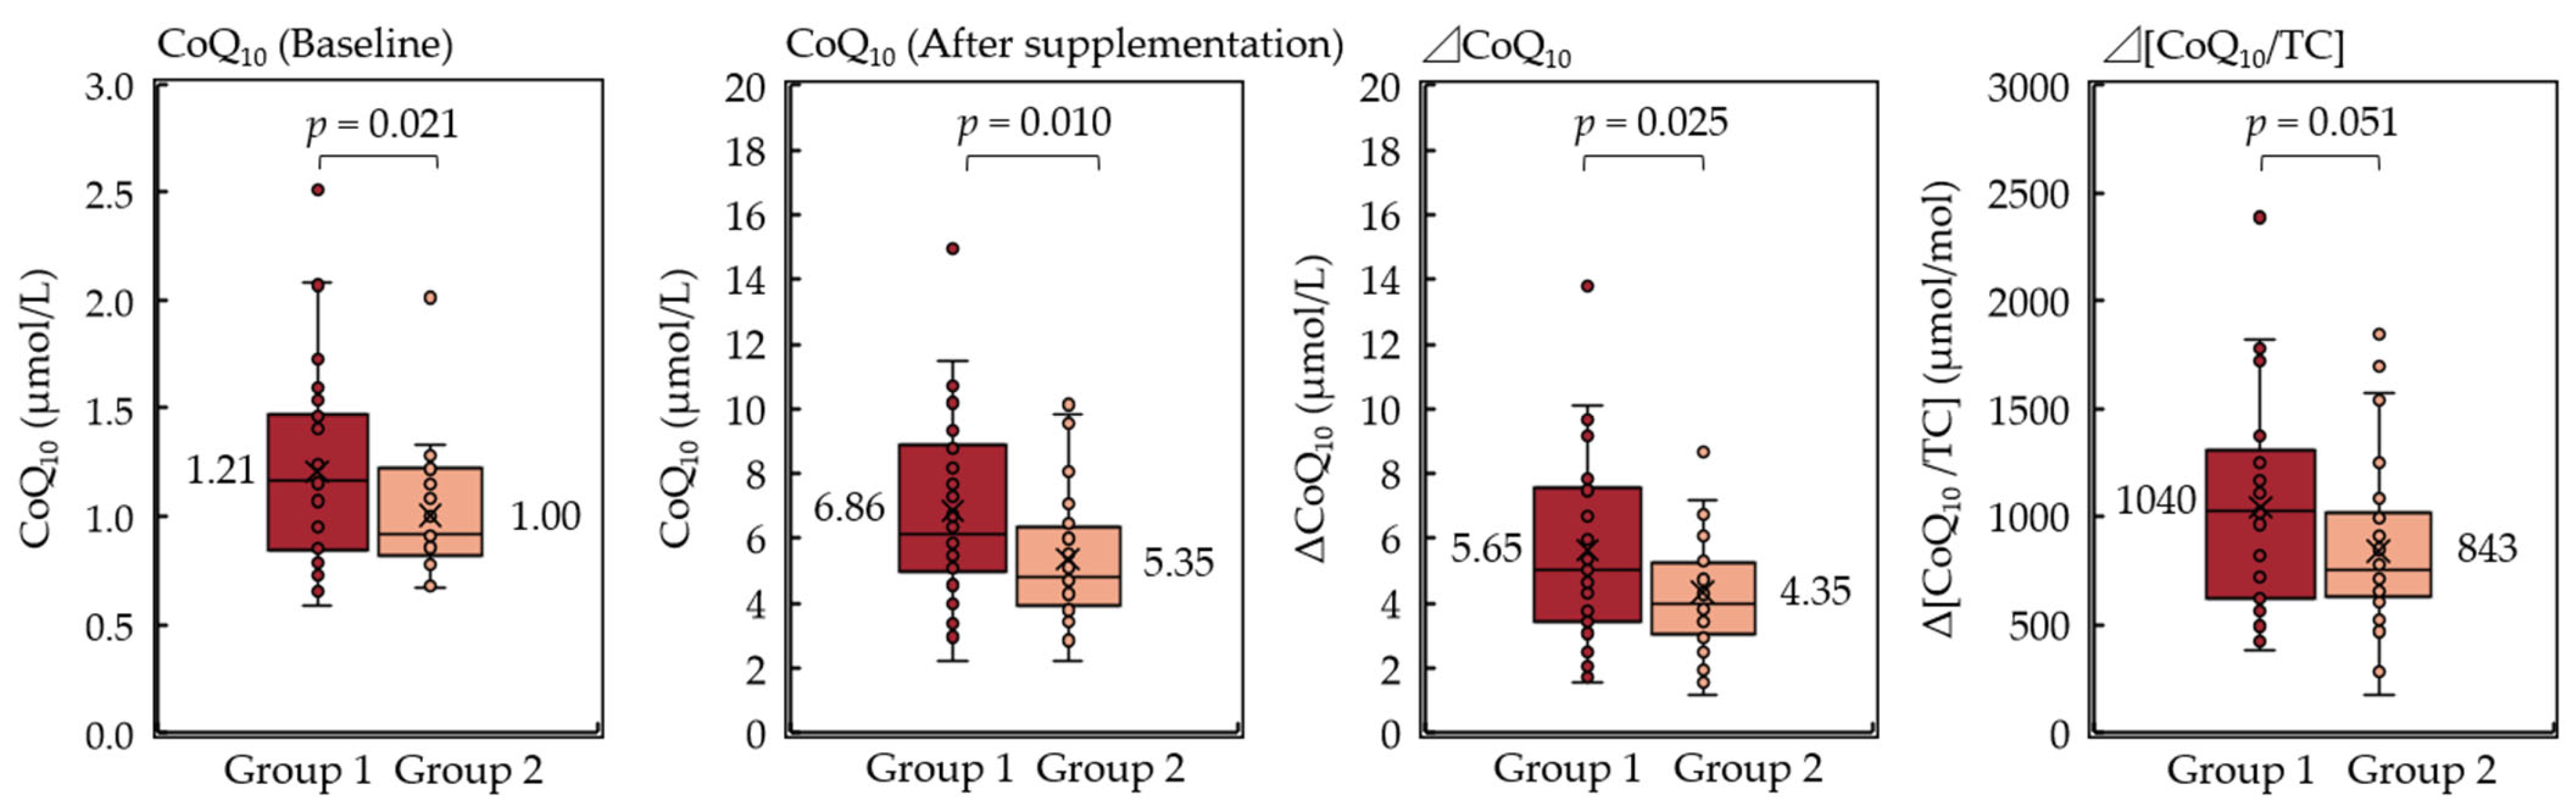
| More than average (5.05 μmol/L) | 19 | 9 | |
| Less than average | 19 | 23 | 0.063 |
| Δ[CoQ10/TC] | |||
| More than average (952 μmol/mol) | 24 | 9 | |
| Less than average | 14 | 23 | 0.003 |
Publisher’s Note: MDPI stays neutral with regard to jurisdictional claims in published maps and institutional affiliations. |
© 2021 by the authors. Licensee MDPI, Basel, Switzerland. This article is an open access article distributed under the terms and conditions of the Creative Commons Attribution (CC BY) license (http://creativecommons.org/licenses/by/4.0/).
Share and Cite
Takahashi, M.; Nagata, M.; Kinoshita, T.; Kaneko, T.; Suzuki, T. CYP7A1, NPC1L1, ABCB1, and CD36 Polymorphisms Are Associated with Increased Serum Coenzyme Q10 after Long-Term Supplementation in Women. Antioxidants 2021, 10, 431. https://0-doi-org.brum.beds.ac.uk/10.3390/antiox10030431
Takahashi M, Nagata M, Kinoshita T, Kaneko T, Suzuki T. CYP7A1, NPC1L1, ABCB1, and CD36 Polymorphisms Are Associated with Increased Serum Coenzyme Q10 after Long-Term Supplementation in Women. Antioxidants. 2021; 10(3):431. https://0-doi-org.brum.beds.ac.uk/10.3390/antiox10030431
Chicago/Turabian StyleTakahashi, Michiyo, Mayumi Nagata, Tetsu Kinoshita, Takehiko Kaneko, and Toshikazu Suzuki. 2021. "CYP7A1, NPC1L1, ABCB1, and CD36 Polymorphisms Are Associated with Increased Serum Coenzyme Q10 after Long-Term Supplementation in Women" Antioxidants 10, no. 3: 431. https://0-doi-org.brum.beds.ac.uk/10.3390/antiox10030431