
In Vivo Brain GSH: MRS Methods and Clinical Applications

 , , ,
, , ,
Abstract
:1. Introduction
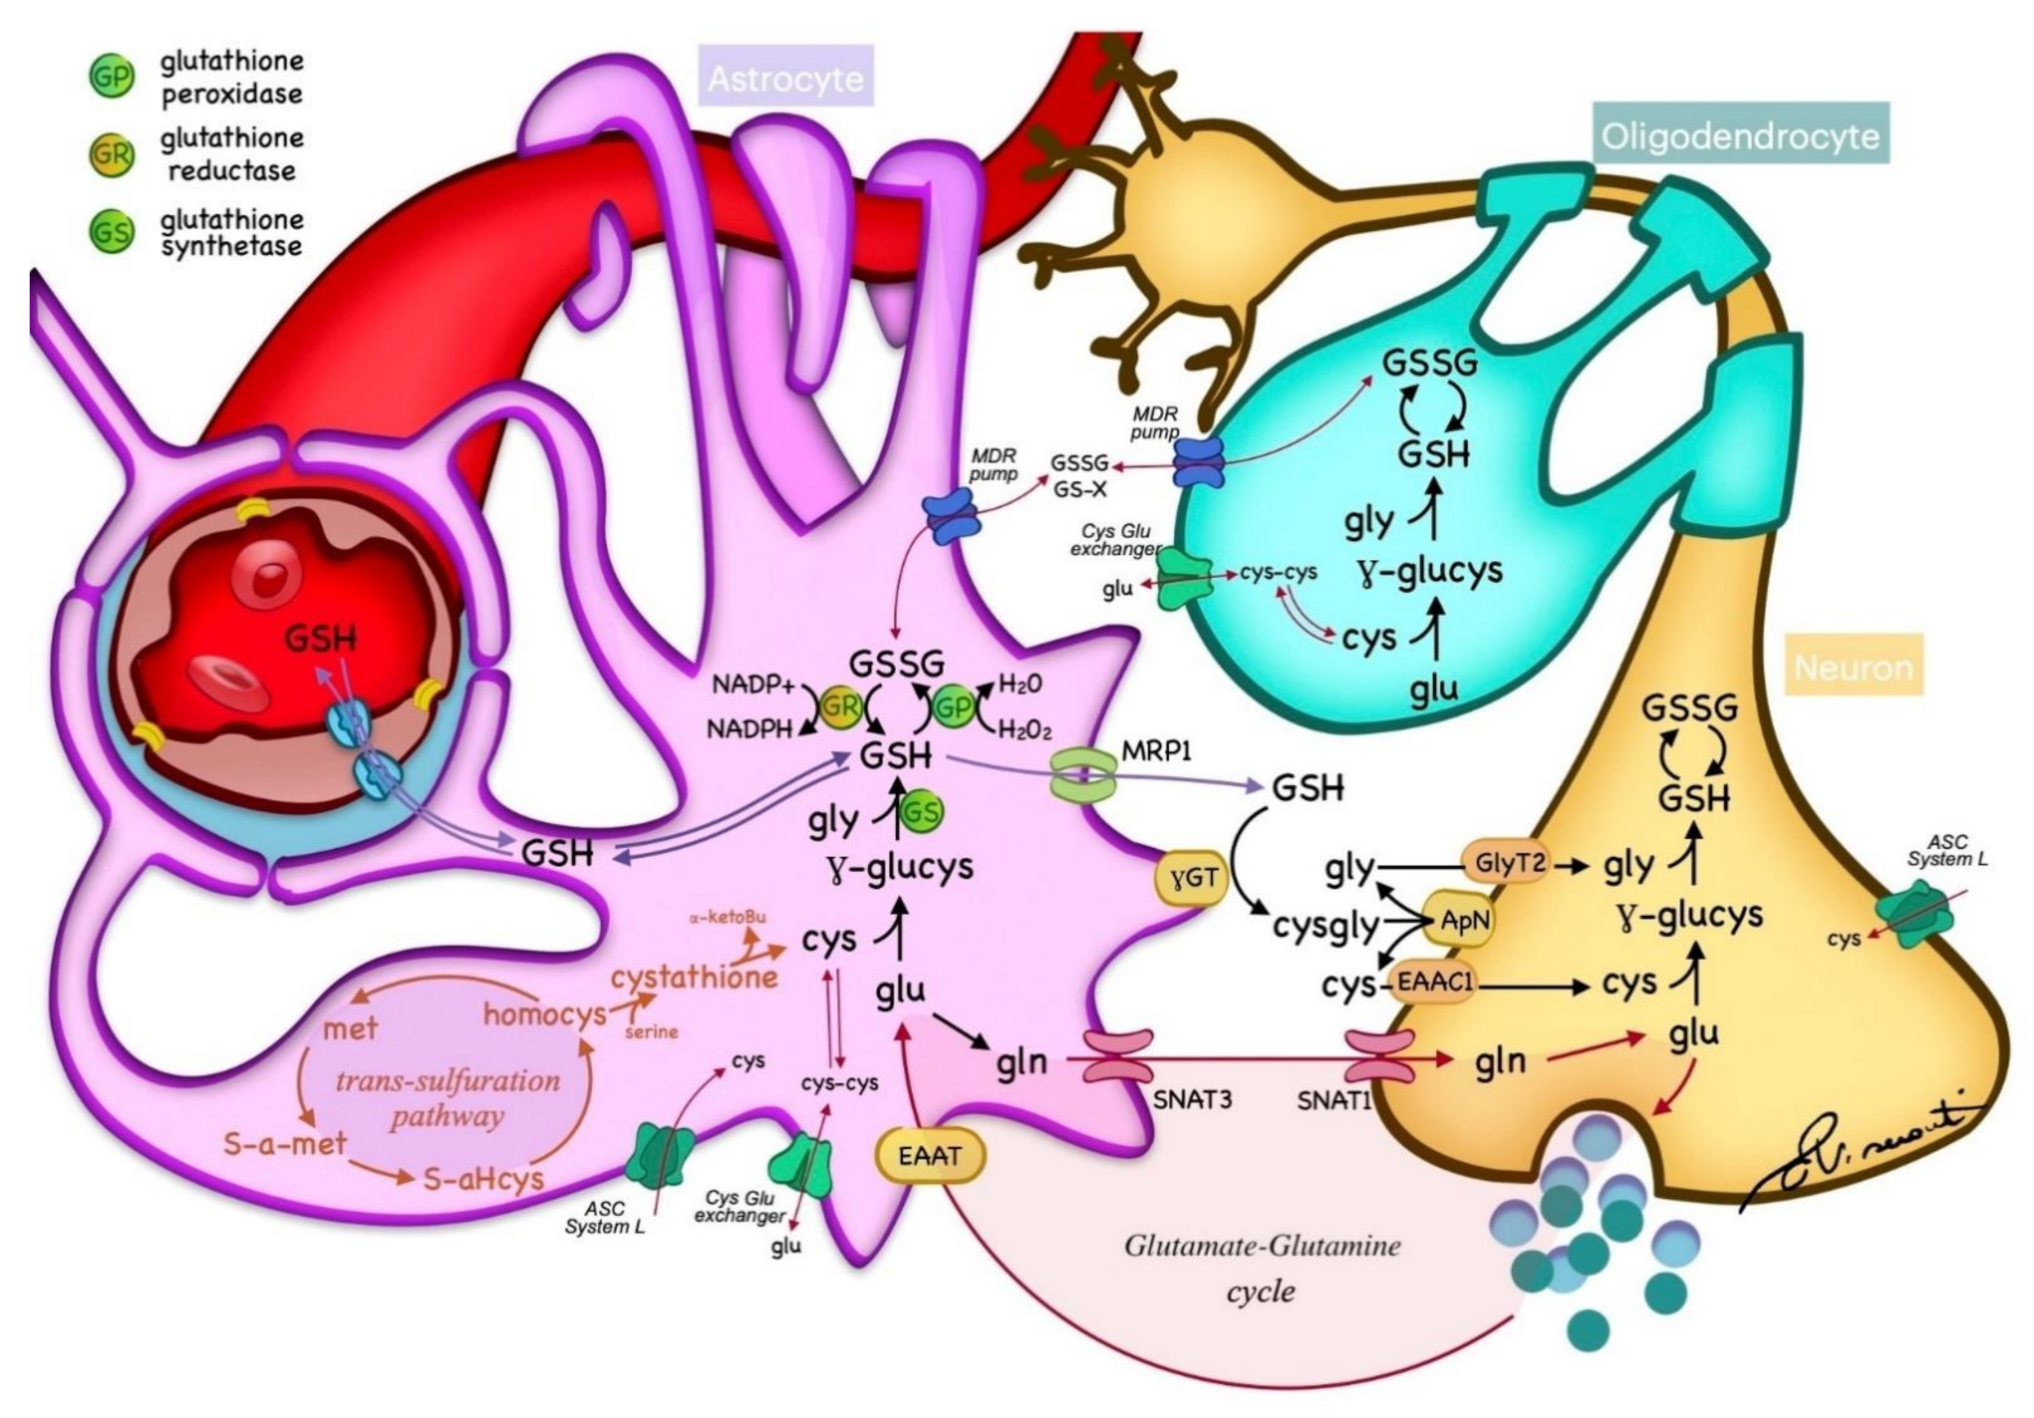
2. GSH Metabolism
3. Noninvasive GSH Measurement
3.1. GSH Measurement—Unedited Techniques
3.2. GSH Measurement—Edited Techniques
3.2.1. Multiple Quantum Filter
3.2.2. J-Difference Editing
Multiplexed Edited Detection
Accelerated MEGA PRESS with Parallel Reconstruction in Multivoxel
3.3. GSH Measurement at High Fields
4. Detection Techniques Reliability
5. Brain Areas GSH Concentration
6. Clinical Applications of GSH Imaging
6.1. GSH and Brain Tumors
6.2. GSH and Psychiatric Disorders
6.3. GSH and Degenerative Disorders
6.4. OTHERS
- -
- GSH and Epilepsy
- -
- Toxic and metabolic disorders
7. Conclusions
Author Contributions
Funding
Conflicts of Interest
Abbreviation
References
- Dwivedi, D.; Megha, K.; Mishra, R.; Mandal, P.K. Glutathione in Brain: Overview of Its Conformations, Functions, Biochemical Characteristics, Quantitation and Potential Therapeutic Role in Brain Disorders. Neurochem. Res. 2020, 45, 1461–1480. [Google Scholar] [CrossRef]
- Dasari, S. Glutathione S-transferases Detoxify Endogenous and Exogenous Toxic Agents- Minireview. J. Dairy Vet. Anim. Res. 2017, 5, 157–159. [Google Scholar] [CrossRef] [Green Version]
- Emir, U.E.; Raatz, S.; Mcpherson, S.; Hodges, J.S.; Torkelson, C.; Tawfik, P.; White, T.; Terpstra, M. Noninvasive quantification of ascorbate and glutathione concentration in the elderly human brain. NMR Biomed. 2011, 24, 888–894. [Google Scholar] [CrossRef] [PubMed] [Green Version]
- Bains, J.S.; Shaw, C.A. Neurodegenerative disorders in humans: The role of glutathione in oxidative stress-mediated neuronal death. Brain Res. Rev. 1997, 25, 335–358. [Google Scholar] [CrossRef]
- Schulz, J.B.; Lindenau, J.; Seyfried, J.; Dichgans, J. Glutathione, oxidative stress and neurodegeneration. Eur. J. Biochem. 2000, 267, 4904–4911. [Google Scholar] [CrossRef] [PubMed]
- Cárdenas-Rodríguez, N.; Coballase-Urrutia, E.; Pérez-Cruz, C.; Montesinos-Correa, H.; Rivera-Espinosa, L.; Sampieri, A.; Carmona-Aparicio, L. Relevance of the glutathione system in temporal lobe epilepsy: Evidence in human and experimental models. Oxid. Med. Cell. Longev. 2014, 2014, 759293. [Google Scholar] [CrossRef]
- Gonen, O.M.; Moffat, B.A.; Desmond, P.M.; Lui, E.; Kwan, P.; O’Brien, T.J. Seven-tesla quantitative magnetic resonance spectroscopy of glutamate, γ-aminobutyric acid, and glutathione in the posterior cingulate cortex/precuneus in patients with epilepsy. Epilepsia 2020, 61, 2785–2794. [Google Scholar] [CrossRef] [PubMed]
- Choi, I.Y.; Lee, S.P.; Denney, D.R.; Lynch, S.G. Lower levels of glutathione in the brains of secondary progressive multiple sclerosis patients measured by 1H magnetic resonance chemical shift imaging at 3 T. Mult. Scler. J. 2011, 17, 289–296. [Google Scholar] [CrossRef] [Green Version]
- Prinsen, H.; De Graaf, R.A.; Mason, G.F.; Pelletier, D.; Juchem, C. Reproducibility Measurement of Glutathione, GABA, and Glutamate: Towards In Vivo Neurochemical Profiling of Multiple Sclerosis with MR Spectroscopy at 7 Tesla. J. Magn. Reson. Imaging 2018, 45, 187–198. [Google Scholar] [CrossRef] [Green Version]
- Mandal, P.K.; Saharan, S.; Tripathi, M.; Murari, G. Brain Glutathione Levels—A Novel Biomarker for Mild Cognitive Impairment and Alzheimer’s Disease. Biol. Psychiatry 2015, 78, 702–710. [Google Scholar] [CrossRef]
- Sian, J.; Dexter, D.T.; Lees, A.J.; Daniel, S.; Agid, Y.; Javoy-Agid, F.; Jenner, P.; Marsden, C.D. Alterations in glutathione levels in Parkinson’s disease and other neurodegenerative disorders affecting basal ganglia. Ann. Neurol. 1994, 36, 348–355. [Google Scholar] [CrossRef]
- Coles, L.D.; Tuite, P.J.; Öz, G.; Mishra, U.R.; Kartha, R.V.; Sullivan, K.M.; Cloyd, J.C.; Terpstra, M. Repeated-Dose Oral N-Acetylcysteine in Parkinson’s Disease: Pharmacokinetics and Effect on Brain Glutathione and Oxidative Stress. J. Clin. Pharmacol. 2018, 58, 158–167. [Google Scholar] [CrossRef] [PubMed]
- Lavoie, S.; Murray, M.M.; Deppen, P.; Knyazeva, M.G.; Berk, M.; Boulat, O.; Bovet, P.; Bush, A.I.; Conus, P.; Copolov, D.; et al. Glutathione precursor, N-acetyl-cysteine, improves mismatch negativity in schizophrenia patients. Neuropsychopharmacology 2008, 33, 2187–2199. [Google Scholar] [CrossRef] [Green Version]
- Chitty, K.M.; Lagopoulos, J.; Hickie, I.B.; Hermens, D.F. The impact of alcohol and tobacco use on invivo glutathione in youth with bipolar disorder: An exploratory study. J. Psychiatr. Res. 2014, 55, 59–67. [Google Scholar] [CrossRef] [PubMed]
- Duffy, S.L.; Lagopoulos, J.; Cockayne, N.; Hermens, D.F.; Hickie, I.B.; Naismith, S.L. Oxidative stress and depressive symptoms in older adults: A magnetic resonance spectroscopy study. J. Affect. Disord. 2015, 180, 29–35. [Google Scholar] [CrossRef]
- Soeiro-De-Souza, M.G.; Pastorello, B.F.; Da Costa Leite, C.; Henning, A.; Moreno, R.A.; Otaduy, M.C.G. Dorsal anterior cingulate lactate and glutathione levels in euthymic bipolar i disorder: 1H-MRS study. Int. J. Neuropsychopharmacol. 2016, 19, pyw032. [Google Scholar] [CrossRef] [PubMed] [Green Version]
- Rahman, I.; Kode, A.; Biswas, S.K. Assay for quantitative determination of glutathione and glutathione disulfide levels using enzymatic recycling method. Nat. Protoc. 2007, 1, 3159–3165. [Google Scholar] [CrossRef] [PubMed]
- Sultana, R.; Piroddi, M.; Galli, F.; Butterfield, D.A. Protein levels and activity of some antioxidant enzymes in hippocampus of subjects with amnestic mild cognitive impairment. Neurochem. Res. 2008, 33, 2540–2546. [Google Scholar] [CrossRef]
- Ansari, M.; Scheff, S.W. Oxidative Stress in the Progression of Alzheimer Disease in the Frontal Cortex. J. Neuropathol. Exp. Neurol. 2010, 69, 155–167. [Google Scholar] [CrossRef] [Green Version]
- Hurst, R.D.; Heales, S.J.R.; Dobbie, M.S.; Barker, J.E.; Clark, J.B. Decreased endothelial cell glutathione and increased sensitivity to oxidative stress in an in vitro blood-brain barrier model system. Brain Res. 1998, 802, 232–240. [Google Scholar] [CrossRef]
- Dringen, R.; Gutterer, J.M.; Hirrlinger, J. Glutathione metabolism in brain: Metabolic interaction between astrocytes and neurons in the defense against reactive oxygen species. Eur. J. Biochem. 2000, 267, 4912–4916. [Google Scholar] [CrossRef]
- Rae, C.D.; Williams, S.R. Glutathione in the human brain: Review of its roles and measurement by magnetic resonance spectroscopy. Anal. Biochem. 2017, 529, 127–143. [Google Scholar] [CrossRef] [PubMed]
- Lee, H.H.; Kim, H. Intact metabolite spectrum mining by deep learning in proton magnetic resonance spectroscopy of the brain. Magn. Reson. Med. 2019, 82, 33–48. [Google Scholar] [CrossRef]
- Kumar, A.; Dhull, D.K.; Gupta, V.; Channana, P.; Singh, A.; Bhardwaj, M.; Ruhal, P.; Mittal, R. Role of Glutathione-S-transferases in neurological problems. Expert Opin. Ther. Pat. 2017, 27, 299–309. [Google Scholar] [CrossRef]
- Trabesinger, A.H.; Boesiger, P. Improved selectivity of double quantum coherence filtering for the detection of glutathione in the human brain in vivo: Improved Selectivity of DQC Filtering. Magn. Reson. Med. 2001, 45, 708–710. [Google Scholar] [CrossRef] [PubMed] [Green Version]
- Yamamoto, T.; Isobe, T.; Akutsu, H.; Masumoto, T.; Ando, H.; Sato, E.; Takada, K.; Anno, I.; Matsumura, A. Influence of echo time in quantitative proton MR spectroscopy using LCModel. Magn. Reson. Imaging 2015, 33, 644–648. [Google Scholar] [CrossRef] [PubMed]
- Haase, A.; Frahm, J.; Hanicke, W.; Matthaei, D. 1H NMR chemical shift selective (CHESS) imaging. Phys. Med. Biol. 1985, 30, 341–344. [Google Scholar] [CrossRef]
- Mescher, M.; Merkle, H.; Kirsch, J.; Garwood, M.; Gruetter, R. Simultaneous in vivo spectral editing and water suppression. NMR Biomed. 1998, 11, 266–272. [Google Scholar] [CrossRef] [Green Version]
- Tkáč, I.; Starčuk, Z.; Choi, I.Y.; Gruetter, R. In vivo 1H NMR spectroscopy of rat brain at 1 ms echo time. Magn. Reson. Med. 1999, 41, 649–656. [Google Scholar] [CrossRef] [Green Version]
- Skoch, A.; Jiru, F.; Bunke, J. Spectroscopic imaging: Basic principles. Eur. J. Radiol. 2008, 67, 230–239. [Google Scholar] [CrossRef]
- Bertholdo, D.; Watcharakorn, A.; Castillo, M. Brain Proton Magnetic Resonance Spectroscopy: Introduction and Overview. Neuroimaging Clin. N. Am. 2013, 23, 359–380. [Google Scholar] [CrossRef] [PubMed]
- Posse, S.; Otazo, R.; Dager, S.R.; Alger, J. MR spectroscopic imaging: Principles and recent advances. J. Magn. Reson. Imaging 2013, 37, 1301–1325. [Google Scholar] [CrossRef] [PubMed]
- Brix, M.K.; Dwyer, G.E.; Craven, A.R.; Grüner, R.; Noeske, R.; Ersland, L. MEGA-PRESS and PRESS measure oxidation of glutathione in a phantom. Magn. Reson. Imaging 2019, 60, 32–37. [Google Scholar] [CrossRef]
- Bhogal, A.A.; Schür, R.R.; Houtepen, L.C.; van de Bank, B.; Boer, V.O.; Marsman, A.; Barker, P.B.; Scheenen, T.W.J.; Wijnen, J.P.; Vinkers, C.H.; et al. 1H–MRS processing parameters affect metabolite quantification: The urgent need for uniform and transparent standardization. NMR Biomed. 2017, 30, e3804. [Google Scholar] [CrossRef]
- Zhao, T.; Heberlein, K.; Jonas, C.; Jones, D.P.; Hu, X. New double quantum coherence filter for localized detection of glutathione in vivo. Magn. Reson. Med. 2006, 55, 676–680. [Google Scholar] [CrossRef]
- Allen, P.S.; Thompson, R.B.; Wilman, A.H. Metabolite-specific NMR spectroscopy in vivo. NMR Biomed. 1997, 10, 435–444. [Google Scholar] [CrossRef]
- Puts, N.A.J.; Edden, R.A.E. In vivo magnetic resonance spectroscopy of GABA: A methodological review. Prog. Nucl. Magn. Reson. Spectrosc. 2012, 60, 29–41. [Google Scholar] [CrossRef] [Green Version]
- Fisher, E.; Gillam, J.; Upthegrove, R.; Aldred, S.; Wood, S.J. Role of magnetic resonance spectroscopy in cerebral glutathione quantification for youth mental health: A systematic review. Early Interv. Psychiatry 2020, 14, 147–162. [Google Scholar] [CrossRef]
- Zhu, H.; Barker, P.B. MR Spectroscopy and Spectroscopic Imaging of the Brain. Methods Mol Biol 2011, 711, 203–226. [Google Scholar] [CrossRef] [Green Version]
- Mlynárik, V.; Gambarota, G.; Frenkel, H.; Gruetter, R. Localized short-echo-time proton MR spectroscopy with full signal-intensity acquisition. Magn. Reson. Med. 2006, 56, 965–970. [Google Scholar] [CrossRef] [PubMed] [Green Version]
- Lagopoulos, J.; Hermens, D.F.; Tobias-Webb, J.; Duffy, S.; Naismith, S.L.; White, D.; Scott, E.; Hickie, I.B. In vivo glutathione levels in young persons with bipolar disorder: A magnetic resonance spectroscopy study. J. Psychiatr. Res. 2013, 47, 412–417. [Google Scholar] [CrossRef]
- Duffy, S.L.; Lagopoulos, J.; Hickie, I.B.; Diamond, K.; Graeber, M.B.; Lewis, S.J.G.; Naismith, S.L. Glutathione relates to neuropsychological functioning in mild cognitive impairment. Alzheimer’s Dement. 2014, 10, 67–75. [Google Scholar] [CrossRef]
- Barbagallo, G.; Morelli, M.; Quattrone, A.; Chiriaco, C.; Vaccaro, M.G.; Gullà, D.; Rocca, F.; Caracciolo, M.; Novellino, F.; Sarica, A.; et al. In vivo evidence for decreased scyllo-inositol levels in the supplementary motor area of patients with Progressive Supranuclear Palsy: A proton MR spectroscopy study. Park. Relat. Disord. 2019, 62, 185–191. [Google Scholar] [CrossRef]
- Napolitano, A.; Longo, D.; Lucignani, M.; Pasquini, L.; Rossi-Espagnet, M.C.; Lucignani, G.; Maiorana, A.; Elia, D.; De Liso, P.; Dionisi-Vici, C.; et al. The ketogenic diet increases in vivo glutathione levels in patients with epilepsy. Metabolites 2020, 10, 504. [Google Scholar] [CrossRef]
- Kreis, R.; Hofmann, L.; Kuhlmann, B.; Boesch, C.; Bossi, E.; Hüppi, P.S. Brain metabolite composition during early human brain development as measured by quantitative in vivo 1H magnetic resonance spectroscopy. Magn. Reson. Med. 2002, 48, 949–958. [Google Scholar] [CrossRef]
- Mekle, R.; Mlynárik, V.; Gambarota, G.; Hergt, M.; Krueger, G.; Gruetter, R. MR spectroscopy of the human brain with enhanced signal intensity at ultrashort echo times on a clinical platform at 3T and 7T. Magn. Reson. Med. 2009, 61, 1279–1285. [Google Scholar] [CrossRef] [PubMed] [Green Version]
- Choi, C.; Dimitrov, I.E.; Douglas, D.; Patel, A.; Kaiser, L.G.; Amezcua, C.A.; Maher, E.A. Improvement of resolution for brain coupled metabolites by optimized 1H MRS at 7T. NMR Biomed. 2010, 23, 1044–1052. [Google Scholar] [CrossRef] [PubMed]
- An, L.; Li, S.; Murdoch, J.B.; Araneta, M.F.; Johnson, C.; Shen, J. Detection of glutamate, glutamine, and glutathione by radiofrequency suppression and echo time optimization at 7 Tesla. Magn. Reson. Med. 2015, 73, 451–458. [Google Scholar] [CrossRef]
- Moss, H.G.; Brown, T.R.; Wiest, D.B.; Jenkins, D.D. N-Acetylcysteine rapidly replenishes central nervous system glutathione measured via magnetic resonance spectroscopy in human neonates with hypoxic-ischemic encephalopathy. J. Cereb. Blood Flow Metab. 2018, 38, 950–958. [Google Scholar] [CrossRef] [PubMed]
- Terpstra, M.; Vaughan, T.J.; Ugurbil, K.; Lim, K.O.; Schulz, S.C.; Gruetter, R. Validation of glutathione quantitation from STEAM spectra against edited 1H NMR spectroscopy at 4T: Application to schizophrenia. Magn. Reson. Mater. Phys. Biol. Med. 2005, 18, 276–282. [Google Scholar] [CrossRef] [Green Version]
- Wijtenburg, S.A.; Gaston, F.E.; Spieker, E.A.; Korenic, S.A.; Kochunov, P.; Hong, L.E.; Rowland, L.M. Reproducibility of phase rotation STEAM at 3T: Focus on glutathione. Magn. Reson. Med. 2014, 72, 603–609. [Google Scholar] [CrossRef] [PubMed] [Green Version]
- Garwood, M.; DelaBarre, L. The return of the frequency sweep: Designing adiabatic pulses for contemporary NMR. J. Magn. Reson. 2001, 153, 155–177. [Google Scholar] [CrossRef] [PubMed]
- Scheenen, T.W.J.; Klomp, D.W.J.; Wijnen, J.P.; Heerschap, A. Short echo time 1H-MRSI of the human brain at 3T with minimal chemical shift displacement errors using adiabatic refocusing pulses. Magn. Reson. Med. 2008, 59, 1–6. [Google Scholar] [CrossRef] [PubMed]
- Bednařík, P.; Tkáč, I.; Giove, F.; Dinuzzo, M.; Deelchand, D.K.; Emir, U.E.; Eberly, L.E.; Mangia, S. Neurochemical and BOLD responses during neuronal activation measured in the human visual cortex at 7 Tesla. J. Cereb. Blood Flow Metab. 2015, 35, 601–610. [Google Scholar] [CrossRef] [Green Version]
- Schubert, F.; Kühn, S.; Gallinat, J.; Mekle, R.; Ittermann, B. Towards a neurochemical profile of the amygdala using short-TE 1H magnetic resonance spectroscopy at 3 T. NMR Biomed. 2017, 30, e3685. [Google Scholar] [CrossRef]
- Dhamala, E.; Abdelkefi, I.; Nguyen, M.; Hennessy, T.J.; Nadeau, H.; Near, J. Validation of in vivo MRS measures of metabolite concentrations in the human brain. NMR Biomed. 2019, 32, e4058. [Google Scholar] [CrossRef]
- Thomas, M.A.; Hattori, N.; Umeda, M.; Sawada, T.; Naruse, S. Evaluation of two-dimensional L-COSY and JPRESS using a 3 T MRI scanner: From phantoms to human brain in vivo. NMR Biomed. 2003, 16, 245–251. [Google Scholar] [CrossRef]
- Verma, G.; Hariharan, H.; Nagarajan, R.; Nanga, R.P.R.; Delikatny, E.J.; Thomas, M.A.; Poptani, H. Implementation of two-dimensional L-COSY at 7 Tesla: An investigation of reproducibility in human brain. J. Magn. Reson. Imaging 2014, 40, 1319–1327. [Google Scholar] [CrossRef] [Green Version]
- Verma, G.; Chawla, S.; Nagarajan, R.; Iqbal, Z.; Albert Thomas, M.; Poptani, H. Non-uniformly weighted sampling for faster localized two-dimensional correlated spectroscopy of the brain in vivo. J. Magn. Reson. 2017, 277, 104–112. [Google Scholar] [CrossRef] [PubMed] [Green Version]
- Provencher, S.W. Automatic quantitation of localized in vivo 1H spectra with LCModel. NMR Biomed. 2001, 14, 260–264. [Google Scholar] [CrossRef]
- Hermens, D.F.; Lagopoulos, J.; Naismith, S.L.; Tobias-Webb, J.; Hickie, I.B. Distinct neurometabolic profiles are evident in the anterior cingulate of young people with major psychiatric disorders. Transl. Psychiatry 2012, 2, e110–e118. [Google Scholar] [CrossRef] [Green Version]
- Chittyn, K.M.; Lagopoulos, J.; Hickie, I.B.; Hermens, D.F. Risky alcohol use in young persons with emerging bipolar disorder is associated with increased oxidative stress. J. Affect. Disord. 2013, 150, 1238–1241. [Google Scholar] [CrossRef]
- Harris, A.D.; Saleh, M.G.; Edden, R.A. Edited 1H Magnetic Resonance Spectroscopy In Vivo: Methods and Metabolites. Magn. Reson. Med. 2017, 77, 1377–1389. [Google Scholar] [CrossRef] [Green Version]
- Schulte, R.F.; Electric, G.; Trabesinger, A.; Communication, R.S.; Meier, D.; Boesiger, P. Double Quantum Coherence Filtering for the Detection of Glutathione at 3.0 T. Methods 2002, 10, 2002. [Google Scholar]
- Terpstra, M.; Henry, P.G.; Gruetter, R. Measurement of reduced glutathione (GSH) in human brain using LCModel analysis of difference-edited spectra. Magn. Reson. Med. 2003, 50, 19–23. [Google Scholar] [CrossRef] [PubMed] [Green Version]
- Choi, I.Y.; Lee, P. Doubly selective multiple quantum chemical shift imaging and T1 relaxation time measurement of glutathione (GSH) in the human brain in vivo. NMR Biomed. 2013, 26, 28–34. [Google Scholar] [CrossRef] [Green Version]
- Weiduschat, N.; Mao, X.; Hupf, J.; Armstrong, N.; Kang, G.; Lange, D.J.; Mitsumoto, H.; Shungu, D.C. Motor cortex glutathione deficit in ALS measured in vivo with the J-editing technique. Neurosci. Lett. 2014, 570, 102–107. [Google Scholar] [CrossRef]
- Cheong, I.; Marjańska, M.; Deelchand, D.K.; Eberly, L.E.; Walk, D.; Öz, G. Ultra-High Field Proton MR Spectroscopy in Early-Stage Amyotrophic Lateral Sclerosis. Neurochem. Res. 2017, 42, 1833–1844. [Google Scholar] [CrossRef]
- Chan, K.L.; Puts, N.A.J.; Snoussi, K.; Harris, A.D.; Barker, P.B.; Edden, R.A.E. Echo time optimization for J-difference editing of glutathione at 3T. Magn. Reson. Med. 2017, 77, 498–504. [Google Scholar] [CrossRef] [PubMed] [Green Version]
- Dreher, W.; Leibfritz, D. New method for the simultaneous detection of metabolites and water in localized in vivo1H nuclear magnetic resonance spectroscopy. Magn. Reson. Med. 2005, 54, 190–195. [Google Scholar] [CrossRef] [PubMed]
- Edden, R.A.E.; Intrapiromkul, J.; Zhu, H.; Cheng, Y.; Barker, P.B. Measuring T 2 in vivo with J-difference editing: Application to GABA at 3 tesla. J. Magn. Reson. Imaging 2012, 35, 229–234. [Google Scholar] [CrossRef] [Green Version]
- Mikkelsen, M.; Saleh, M.G.; Near, J.; Chan, K.L.; Gong, T.; Harris, A.D.; Oeltzschner, G.; Puts, N.A.J.; Cecil, K.M.; Iain, D. Correcting frequency and phase offsets in MRS data using robust spectral registration. NMR Biomed. 2020, 33, e4368. [Google Scholar] [CrossRef] [PubMed]
- Satoh, T.; Yoshioka, Y. Contribution of reduced and oxidized glutathione to signals detected by magnetic resonance spectroscopy as indicators of local brain redox state. Neurosci. Res. 2006, 55, 34–39. [Google Scholar] [CrossRef] [PubMed]
- Matsuzawa, D.; Obata, T.; Shirayama, Y.; Nonaka, H.; Konazawa, Y.; Yoshitome, E.; Takanashi, J.; Matsuda, T.; Shimizu, E.; Ikehira, H.; et al. Negative correlation between brain glutathione level and negative symptoms in schizophrenia: A 3T 1H-MRS study. PLoS ONE 2008, 3, e1944. [Google Scholar] [CrossRef] [PubMed]
- Oeltzschner, G.; Puts, N.A.J.; Chan, K.L.; Boer, V.O.; Barker, B.; Edden, R.A.E.; Science, R.; Hopkins, T.J. Dual-volume excitation and parallel reconstruction for J- difference-edited MR spectroscopy. Magn Reson Med 2017, 77, 16–22. [Google Scholar] [CrossRef]
- Chan, K.L.; Saleh, M.G.; Oeltzschner, G.; Barker, P.B.; Edden, R.A.E. Simultaneous measurement of Aspartate, NAA, and NAAG using HERMES spectral editing at 3 Tesla. Neuroimage 2017, 155, 587–593. [Google Scholar] [CrossRef]
- An, L.; Zhang, Y.; Thomasson, D.M.; Latour, L.L.; Baker, E.H.; Shen, J.; Warach, S. Measurement of glutathione in normal volunteers and stroke patients at 3T using J-difference spectroscopy with minimized subtraction errors. J. Magn. Reson. Imaging 2009, 30, 263–270. [Google Scholar] [CrossRef] [Green Version]
- Edden, R.A.E.; Puts, N.A.J.; Harris, A.D.; Barker, P.B.; Evans, C.J. Gannet: A batch-processing tool for the quantitative analysis of gamma-aminobutyric acid-edited MR spectroscopy spectra. J. Magn. Reson. Imaging 2014, 40, 1445–1452. [Google Scholar] [CrossRef]
- Mullins, P.G.; McGonigle, D.J.; O’Gorman, R.L.; Puts, N.A.J.; Vidyasagar, R.; Evans, C.J.; Edden, R.A.E.; Brookes, M.J.; Garcia, A.; Foerster, B.R.; et al. Current practice in the use of MEGA-PRESS spectroscopy for the detection of GABA. Neuroimage 2014, 86, 43–52. [Google Scholar] [CrossRef] [Green Version]
- Waddell, K.W.; Avison, M.J.; Joers, J.M.; Gore, J.C. A practical guide to robust detection of GABA in human brain by J-difference spectroscopy at 3 T using a standard volume coil. Magn. Reson. Imaging 2007, 25, 1032–1038. [Google Scholar] [CrossRef] [Green Version]
- Mikkelsen, M.; Saleh, M.G.; Near, J.; Chan, K.L.; Gong, T.; Harris, A.D.; Oeltzschner, G.; Puts, N.A.J.; Cecil, K.M.; Wilkinson, I.D.; et al. Frequency and phase correction for multiplexed edited MRS of GABA and glutathione. Magn. Reson. Med. 2018, 80, 21–28. [Google Scholar] [CrossRef] [PubMed]
- Terpstra, M.; Marjanska, M.; Henry, P.G.; Tkáč, I.; Gruetter, R. Detection of an antioxidant profile in the human brain in vivo via double editing with MEGA-PRESS. Magn. Reson. Med. 2006, 56, 1192–1199. [Google Scholar] [CrossRef] [PubMed]
- Terpstra, M.; Torkelson, C.; Emir, U.; Hodges, J.S.; Raatz, S. Noninvasive quantification of human brain antioxidant concentrations after an intravenous bolus of vitamin C. NMR Biomed. 2011, 24, 521–528. [Google Scholar] [CrossRef] [PubMed] [Green Version]
- Saleh, M.G.; Oeltzschner, G.; Chan, K.L.; Puts, N.A.J.; Mikkelsen, M.; Schär, M.; Harris, A.D.; Edden, R.A.E. Simultaneous edited MRS of GABA and glutathione. Neuroimage 2016, 142, 576–582. [Google Scholar] [CrossRef] [Green Version]
- Lopez, Y.; Price, A.N.; Puts, N.A.J.; Hughes, E.J.; Edden, R.A.E.; Mcalonan, G.M.; Arichi, T.; Vita, E. De NeuroImage Simultaneous quantification of GABA, Glx and GSH in the neonatal human brain using magnetic resonance spectroscopy. Neuroimage 2021, 233, 117930. [Google Scholar] [CrossRef]
- Saleh, M.G.; Rimbault, D.; Mikkelsen, M.; Oeltzschner, G.; Wang, M.; Jiang, D.; Alhamud, A.; Near, J.; Schär, M.; Noeske, R.; et al. Multi-Vendor Standardized Sequence for Edited Magnetic Resonance Spectroscopy. Neuroimage 2019, 189, 425–431. [Google Scholar] [CrossRef]
- Marsman, A.; Lind, A.; Petersen, E.T.; Andersen, M.; Boer, V.O. Prospective frequency and motion correction for edited 1H magnetic resonance spectroscopy. Neuroimage 2021, 233, 117922. [Google Scholar] [CrossRef]
- Srinivasan, R.; Ratiney, H.; Hammond-Rosenbluth, K.E.; Pelletier, D.; Nelson, S.J. MR spectroscopic imaging of glutathione in the white and gray matter at 7 T with an application to multiple sclerosis. Magn. Reson. Imaging 2010, 28, 163–170. [Google Scholar] [CrossRef]
- Lin, Y.; Stephenson, M.C.; Xin, L.; Napolitano, A.; Morris, P.G. Investigating the metabolic changes due to visual stimulation using functional proton magnetic resonance spectroscopy at 7 T. J. Cereb. Blood Flow Metab. 2012, 32, 1484–1495. [Google Scholar] [CrossRef] [Green Version]
- Jensen, J.E.; Auerbach, R.P.; Pisoni, A.; Pizzagalli, D.A. Localized MRS reliability of in vivo glutamate at 3 T in shortened scan times: A feasibility study. NMR Biomed. 2017, 30, e3771. [Google Scholar] [CrossRef]
- Wijtenburg, S.A.; Near, J.; Korenic, S.A.; Frank, E.; Chen, H.; Mikkelsen, M.; Chen, S. Comparing the reproducibility of commonly used magnetic resonance spectroscopy techniques to quantify cerebral glutathione. HHS Public Access 2020, 49, 176–183. [Google Scholar] [CrossRef] [Green Version]
- Prescot, A.P.; Richards, T.; Dager, S.R.; Choi, C.; Renshaw, P.F. Phase-adjusted echo time (PATE)-averaging 1H MRS: Application for improved glutamine quantification at 2.89T. NMR Biomed. 2012, 25, 1245–1252. [Google Scholar] [CrossRef] [Green Version]
- Prisciandaro, J.; Mikkelsen, M.; Saleh, M.G.; Edden, R.A. An evaluation of the reproducibility of 1 H-MRS GABA and GSH levels acquired in healthy volunteers with J-difference editing sequences at varying echo times. Magn Reson Imaging 2020, 65, 109–113. [Google Scholar] [CrossRef] [PubMed]
- Sanaei Nezhad, F.; Anton, A.; Parkes, L.M.; Deakin, B.; Williams, S.R. Quantification of glutathione in the human brain by MR spectroscopy at 3 Tesla: Comparison of PRESS and MEGA-PRESS. Magn. Reson. Med. 2017, 78, 1257–1266. [Google Scholar] [CrossRef] [PubMed]
- Da Silva, T.; Hafizi, S.; Andreazza, A.C.; Kiang, M.; Bagby, R.M.; Navas, E.; Laksono, I.; Truong, P.; Gerritsen, C.; Prce, I.; et al. Glutathione –the major redox regulator- in the prefrontal cortex of individuals at clinical high risk for psychosis. Int. J. Neuropsychopharmacol. 2018, 21, 311–318. [Google Scholar] [CrossRef] [Green Version]
- Mandal, P.K.; Tripathi, M.; Sugunan, S. Brain oxidative stress: Detection and mapping of anti-oxidant marker “Glutathione” in different brain regions of healthy male/female, MCI and Alzheimer patients using non-invasive magnetic resonance spectroscopy. Biochem. Biophys. Res. Commun. 2012, 417, 43–48. [Google Scholar] [CrossRef]
- Michels, L.; Schulte-Vels, T.; Schick, M.; O’Gorman, R.L.; Zeffiro, T.; Hasler, G.; Mueller-Pfeiffer, C. Prefrontal GABA and glutathione imbalance in posttraumatic stress disorder: Preliminary findings. Psychiatry Res. Neuroimaging 2014, 224, 288–295. [Google Scholar] [CrossRef]
- Reyes-Madrigal, F.; León-Ortiz, P.; Mao, X.; Mora-Durán, R.; Shungu, D.C.; de la Fuente-Sandoval, C. Striatal Glutathione in First-episode Psychosis Patients Measured In Vivo with Proton Magnetic Resonance Spectroscopy. Arch. Med. Res. 2019, 50, 207–213. [Google Scholar] [CrossRef] [PubMed]
- Kolodny, T.; Schallmo, M.P.; Gerdts, J.; Edden, R.A.E.; Bernier, R.A.; Murray, S.O. Concentrations of Cortical GABA and Glutamate in Young Adults with Autism Spectrum Disorder. Autism Res. 2020, 13, 1111–1129. [Google Scholar] [CrossRef]
- Traverso, N.; Ricciarelli, R.; Nitti, M.; Marengo, B.; Furfaro, A.L.; Pronzato, M.A.; Marinari, U.M.; Domenicotti, C. Role of glutathione in cancer progression and chemoresistance. Oxid. Med. Cell. Longev. 2013, 2013, 972913. [Google Scholar] [CrossRef] [Green Version]
- Ballatori, N.; Krance, S.M.; Notenboom, S.; Shi, S.; Tieu, K.; Hammond, C.L. Glutathione dysregulation and the etiology and progression of human diseases. Biol. Chem. 2009, 3903, 194–214. [Google Scholar] [CrossRef] [PubMed] [Green Version]
- Hammond, C.L.; Lee, T.K.; Ballatori, N. Novel roles for glutathione in gene expression, cell death, and membrane transport of organic solutes. J. Hepatol. 2001, 34, 946–954. [Google Scholar] [CrossRef]
- Cao, J.Y.; Dixon, S.J. Mechanisms of ferroptosis. Cell. Mol. Life Sci. 2016, 73, 2195–2209. [Google Scholar] [CrossRef] [Green Version]
- Desideri, E.; Ciccarone, F.; Ciriolo, M.R. Targeting glutathione metabolism: Partner in crime in anticancer therapy. Nutrients 2019, 11, 1926. [Google Scholar] [CrossRef] [PubMed] [Green Version]
- Schisselbauer, J.C.; LaCreta, F.P.; Tew, K.D.; Silber, R.; Papadopoulos, E.; Abrams, K. Characterization of Glutathione S-Transferase Expression in Lymphocytes from Chronic Lymphocytic Leukemia Patients. Cancer Res. 1990, 50, 3562–3568. [Google Scholar]
- Shawahna, R.; Decleves, X.; Scherrmann, J.-M. Hurdles with Using In Vitro Models to Predict Human Blood-brain Barrier Drug Permeability: A Special Focus on Transporters and Metabolizing Enzymes. Curr. Drug Metab. 2012, 14, 120–136. [Google Scholar] [CrossRef]
- Lewis, A.D.; Hayes, J.D.; Wolf, C.R. Glutathione and glutathione-dependent enzymes in ovarian adenocarcinoma cell lines derived from a patient before and after the onset of drug resistance: Intrinsic differences and cell cycle effects. Carcinogenesis 1988, 9, 1283–1287. [Google Scholar] [CrossRef]
- Grant, R.; Ironside, J.W. Glutathione S-transferases and cytochrome P450 detoxifying enzyme distribution in human cerebral glioma. J. Neurooncol. 1995, 25, 1–7. [Google Scholar] [CrossRef]
- Ali-Osman, F.; Brunner, J.M.; Kutluk, T.M.; Hess, K. Prognostic significance of glutathione S-transferase π expression and subcellular localization in human gliomas. Clin. Cancer Res. 1997, 3, 2253–2261. [Google Scholar]
- Okcu, M.F.; Selvan, M.; Wang, L.E.; Stout, L.; Erana, R.; Airewele, G.; Adatto, P.; Hess, K.; Ali-Osman, F.; Groves, M.; et al. Glutathione S-Transferase Polymorphisms and Survival in Primary Malignant Glioma. Clin. Cancer Res. 2004, 10, 2618–2625. [Google Scholar] [CrossRef] [Green Version]
- Calatozzolo, C.; Gelati, M.; Ciusani, E.; Sciacca, F.L.; Pollo, B.; Cajola, L.; Marras, C.; Silvani, A.; Vitellaro-Zuccarello, L.; Croci, D.; et al. Expression of drug resistance proteins Pgp, MRP1, MRP3, MRP5 AND GST-π in human glioma. J. Neurooncol. 2005, 74, 113–121. [Google Scholar] [CrossRef]
- Lo, H.W.; Antoun, G.R.; Ali-Osman, F. The human glutathione S-transferase P1 protein is phosphorylated and its metabolic function enhanced by the Ser/Thr protein kinases, cAMP-dependent protein kinase and protein kinase C, in glioblastoma cells. Cancer Res. 2004, 64, 9131–9138. [Google Scholar] [CrossRef] [PubMed] [Green Version]
- Pasquini, L.; Napolitano, A.; Tagliente, E.; Dellepiane, F.; Lucignani, M.; Vidiri, A.; Ranazzi, G.; Stoppacciaro, A.; Moltoni, G.; Nicolai, M.; et al. Deep Learning Can Differentiate IDH-Mutant from IDH-Wild GBM. J. Pers. Med. 2021, 11, 290. [Google Scholar] [CrossRef] [PubMed]
- Pasquini, L.; Napolitano, A.; Lucignani, M.; Tagliente, E.; Rossi-espagnet, M.C.; Vidiri, A.; Ranazzi, G.; Stoppacciaro, A.; Romano, A.; Di Napoli, A.; et al. Comparison of Machine Learning Classifiers to Predict Patient Survival and Genetics of GBM: Towards a Standardized Model for Clinical Implementation. arXiv 2021, arXiv:2102.06526. [Google Scholar]
- Tang, X.; Fu, X.; Liu, Y.; Yu, D.; Cai, S.J.; Yang, C. Blockade of glutathione metabolism in IDH1-mutated glioma. Mol. Cancer Ther. 2020, 19, 221–230. [Google Scholar] [CrossRef] [Green Version]
- Bisdas, S.; Chadzynski, G.L.; Braun, C.; Schittenhelm, J.; Skardelly, M.; Hagberg, G.E.; Ethofer, T.; Pohmann, R.; Shajan, G.; Engelmann, J.; et al. MR spectroscopy for in vivo assessment of the oncometabolite 2-hydroxyglutarate and its effects on cellular metabolism in human brain gliomas at 9.4T. J. Magn. Reson. Imaging 2016, 44, 823–833. [Google Scholar] [CrossRef]
- Batsios, G.; Najac, C.; Cao, P.; Viswanath, P.; Subramani, E.; Saito, Y.; Gillespie, A.M.; Yoshihara, H.A.I.; Larson, P.; Sando, S.; et al. In vivo detection of γ-glutamyl-transferase up-regulation in glioma using hyperpolarized γ-glutamyl-[1-13C]glycine. Sci. Rep. 2020, 10, 6244. [Google Scholar] [CrossRef] [Green Version]
- Shi, J.; Zuo, H.; Ni, L.; Xia, L.; Zhao, L.; Gong, M.; Nie, D.; Gong, P.; Cui, D.; Shi, W.; et al. An IDH1 mutation inhibits growth of glioma cells via GSH depletion and ROS generation. Neurol. Sci. 2014, 35, 839–845. [Google Scholar] [CrossRef]
- Opstad, K.S.; Provencher, S.W.; Bell, B.A.; Griffiths, J.R.; Howe, F.A. Detection of elevated glutathione in meningiomas by quantitative in vivo 1H MRS. Magn. Reson. Med. 2003, 49, 632–637. [Google Scholar] [CrossRef]
- Das, T.K.; Javadzadeh, A.; Dey, A.; Sabesan, P.; Théberge, J.; Radua, J.; Palaniyappan, L. Antioxidant defense in schizophrenia and bipolar disorder: A meta-analysis of MRS studies of anterior cingulate glutathione. Prog. Neuro-Psychopharmacol. Biol. Psychiatry 2019, 91, 94–102. [Google Scholar] [CrossRef]
- Chitty, K.M.; Lagopoulos, J.; Hickie, I.B.; Hermens, D.F. A longitudinal proton magnetic resonance spectroscopy study investigating oxidative stress as a result of alcohol and tobacco use in youth with bipolar disorder. J. Affect. Disord. 2015, 175, 481–487. [Google Scholar] [PubMed] [Green Version]
- Sydnor, V.J.; Roalf, D.R. A meta-analysis of ultra-high field glutamate, glutamine, GABA and glutathione 1HMRS in psychosis: Implications for studies of psychosis risk. Schizophr. Res. 2020, 226, 61–69. [Google Scholar] [CrossRef] [PubMed]
- Dempster, K.; Jeon, P.; MacKinley, M.; Williamson, P.; Théberge, J.; Palaniyappan, L. Early treatment response in first episode psychosis: A 7-T magnetic resonance spectroscopic study of glutathione and glutamate. Mol. Psychiatry 2020, 25, 1640–1650. [Google Scholar] [CrossRef] [Green Version]
- Girgis, R.R.; Baker, S.; Mao, X.; Gil, R.; Javitt, D.C.; Kantrowitz, J.T.; Gu, M.; Spielman, D.M.; Ojeil, N.; Xu, X.; et al. Effects of acute N-acetylcysteine challenge on cortical glutathione and glutamate in schizophrenia: A pilot in vivo proton magnetic resonance spectroscopy study. Psychiatry Res. 2019, 275, 78–85. [Google Scholar] [CrossRef]
- Demro, C.; Rowland, L.; Wijtenburg, S.A.; Waltz, J.; Gold, J.; Kline, E.; Thompson, E.; Reeves, G.; Hong, L.E.; Schiffman, J. Glutamatergic metabolites among adolescents at risk for psychosis. Psychiatry Res. 2017, 257, 179–185. [Google Scholar] [CrossRef] [PubMed]
- Wood, S.J.; Berger, G.E.; Wellard, R.M.; Proffitt, T.M.; McConchie, M.; Berk, M.; McGorry, P.D.; Pantelis, C. Medial temporal lobe glutathione concentration in first episode psychosis: A 1H-MRS investigation. Neurobiol. Dis. 2009, 33, 354–357. [Google Scholar] [CrossRef] [PubMed]
- Brennan, B.P.; Jensen, J.E.; Perriello, C.; Pope, H.G.; Jenike, M.A.; Hudson, J.I.; Rauch, S.L.; Kaufman, M.J. Lower Posterior Cingulate Cortex Glutathione Levels in Obsessive-Compulsive Disorder. Biol. Psychiatry Cogn. Neurosci. Neuroimaging 2016, 1, 116–124. [Google Scholar] [CrossRef] [Green Version]
- Durieux, A.M.S.; Horder, J.; Mendez, M.A.; Egerton, A.; Williams, S.C.R.; Wilson, C.E.; Spain, D.; Murphy, C.; Robertson, D.; Barker, G.J.; et al. Cortical and subcortical glutathione levels in adults with autism spectrum disorder. Autism Res. 2016, 9, 429–435. [Google Scholar] [CrossRef] [PubMed] [Green Version]
- Gu, F.; Chauhan, V.; Chauhan, A. Glutathione redox imbalance in brain disorders. Curr. Opin. Clin. Nutr. Metab. Care 2015, 18, 89–95. [Google Scholar] [CrossRef]
- Tong, J.; Fitzmaurice, P.S.; Moszczynska, A.; Mattina, K.; Ang, L.C.; Boileau, I.; Furukawa, Y.; Sailasuta, N.; Kish, S.J. Do glutathione levels decline in aging human brain? Free Radic. Biol. Med. 2016, 93, 110–117. [Google Scholar] [CrossRef]
- Chiang, G.C.; Mao, X.; Kang, G.; Chang, E.; Pandya, S.; Vallabhajosula, S.; Isaacson, R.; Ravdin, L.D.; Shungu, D.C. Relationships among cortical glutathione levels, brain amyloidosis, and memory in healthy older adults investigated in vivo with 1H-MRS and Pittsburgh compound-B PET. Am. J. Neuroradiol. 2017, 38, 1130–1137. [Google Scholar] [CrossRef] [Green Version]
- Saharan, S.; Mandal, P.K. The emerging role of glutathione in alzheimer’s disease. J. Alzheimer’s Dis. 2014, 40, 519–529. [Google Scholar] [CrossRef]
- Zhang, C.; Rodriguez, C.; Spaulding, J.; Aw, T.Y.; Feng, J. Age-dependent and tissue-related glutathione redox status in a mouse model of Alzheimer’s disease. J. Alzheimer’s Dis. 2012, 28, 655–666. [Google Scholar] [CrossRef] [Green Version]
- Barber, S.C.; Shaw, P.J. Oxidative stress in ALS: Key role in motor neuron injury and therapeutic target. Free Radic. Biol. Med. 2010, 48, 629–641. [Google Scholar] [CrossRef]
- D’Alessandro, G.; Calcagno, E.; Tartari, S.; Rizzardini, M.; Invernizzi, R.W.; Cantoni, L. Glutamate and glutathione interplay in a motor neuronal model of amyotrophic lateral sclerosis reveals altered energy metabolism. Neurobiol. Dis. 2011, 43, 346–355. [Google Scholar] [CrossRef]
- Weerasekera, A.; Peeters, R.; Sima, D.; Dresselaers, T.; Sunaert, S.; De Vocht, J.; Claeys, K.; Van Huffel, S.; Van Damme, P.; Himmelreich, U. Motor cortex metabolite alterations in amyotrophic lateral sclerosis assessed in vivo using edited and non-edited magnetic resonance spectroscopy. Brain Res. 2019, 1718, 22–31. [Google Scholar] [CrossRef] [PubMed]
- Mueller, S.G.; Trabesinger, A.H.; Boesiger, P.; Wieser, H.G. Brain glutathione levels in patients with epilepsy measured by in vivo 1H-MRS. Neurology 2001, 57, 1422–1427. [Google Scholar] [CrossRef]
- Njålsson, R.; Norgren, S. Physiological and pathological aspects of GSH metabolism. Acta Paediatr. Int. J. Paediatr. 2005, 94, 132–137. [Google Scholar] [CrossRef]
- Li, X.; Ding, Y.; Liu, Y.; Ma, Y.; Song, J.; Wang, Q.; Yang, Y. Five Chinese patients with 5-oxoprolinuria due to glutathione synthetase and 5-oxoprolinase deficiencies. Brain Dev. 2015, 37, 952–959. [Google Scholar] [CrossRef]
- Ristoff, E.; Larsson, A. Inborn errors in the metabolism of glutathione. Orphanet J. Rare Dis. 2007, 2, 16. [Google Scholar] [CrossRef] [PubMed] [Green Version]
- Kunishige, M.; Mitsui, T.; Akaike, M.; Kawajiri, M.; Shono, M.; Kawai, H.; Matsumoto, T. Overexpressions of myoglobin and antioxidant enzymes in ragged-red fibers of skeletal muscle from patients with mitochondrial encephalomyopathy. Muscle Nerve 2003, 28, 484–492. [Google Scholar] [CrossRef]
- Pasquini, L.; Guarnera, A.; Rossi-Espagnet, M.C.; Napolitano, A.; Martinelli, D.; Deodato, F.; Diodato, D.; Carrozzo, R.; Dionisi-Vici, C.; Longo, D. Spinal cord involvement in Kearns-Sayre syndrome: A neuroimaging study. Neuroradiology 2020, 62, 1725. [Google Scholar] [CrossRef]
- Rossi-Espagnet, M.C.; Lucignani, M.; Pasquini, L.; Napolitano, A.; Pro, S.; Romano, A.; Diodato, D.; Martinelli, D.; Longo, D. Visual pathways evaluation in Kearns Sayre syndrome: A diffusion tensor imaging study. Neuroradiology 2020, 62, 241–249. [Google Scholar] [CrossRef] [PubMed]
- Pasquini, L.; Rossi Espagnet, M.C.; Napolitano, A.; Longo, D.; Bertaina, A.; Visconti, E.; Tomà, P. Dentate nucleus T1 hyperintensity: Is it always gadolinium all that glitters? Radiol. Medica 2018, 123, 469–473. [Google Scholar] [CrossRef] [PubMed]
- Pasquini, L.; Napolitano, A.; Visconti, E.; Longo, D.; Romano, A.; Tomà, P.; Espagnet, M.C.R. Gadolinium-Based Contrast Agent-Related Toxicities. CNS Drugs 2018, 32, 229–240. [Google Scholar] [CrossRef] [PubMed]
- Rossi Espagnet, M.C.; Bernardi, B.; Pasquini, L.; Figà-Talamanca, L.; Tomà, P.; Napolitano, A. Signal intensity at unenhanced T1-weighted magnetic resonance in the globus pallidus and dentate nucleus after serial administrations of a macrocyclic gadolinium-based contrast agent in children. Pediatr. Radiol. 2017, 47, 1345–1352. [Google Scholar] [CrossRef]
- Akhtar, M.J.; Ahamed, M.; Alhadlaq, H.; Alrokayan, S. Toxicity Mechanism of Gadolinium Oxide Nanoparticles and Gadolinium Ions in Human Breast Cancer Cells. Curr. Drug Metab. 2019, 20, 907–917. [Google Scholar] [CrossRef] [PubMed]
- Xia, Q.; Feng, X.; Huang, H.; Du, L.; Yang, X.; Wang, K. Gadolinium-induced oxidative stress triggers endoplasmic reticulum stress in rat cortical neurons. J. Neurochem. 2011, 117, 38–47. [Google Scholar] [CrossRef]
- Feng, X.; Xia, Q.; Yuan, L.; Yang, X.; Wang, K. Impaired mitochondrial function and oxidative stress in rat cortical neurons: Implications for gadolinium-induced neurotoxicity. Neurotoxicology 2010, 31, 391–398. [Google Scholar] [CrossRef] [PubMed]
- Solmaz, V.; Köse Özlece, H.; Fatih Bozkurt, M.; Özkul, B.; Erbaş, O. Repeated gadoteric acid and gadobutrol exposure causes deterioration of behavior and memory functions in rats: MRI, histopathological and biochemical evidence. Brain Res. 2021, 1754, 147256. [Google Scholar] [CrossRef]
- Layne, K.A.; Wood, D.M.; Dargan, P.I. Gadolinium-based contrast agents–what is the evidence for ‘gadolinium deposition disease’ and the use of chelation therapy? Clin. Toxicol. 2020, 58, 151–160. [Google Scholar] [CrossRef] [PubMed]
- Mastaloudis, A.; Sheth, C.; Hester, S.N.; Wood, S.M.; Prescot, A.; McGlade, E.; Renshaw, P.F.; Yurgelun-Todd, D.A. Supplementation with a putative calorie restriction mimetic micronutrient blend increases glutathione concentrations and improves neuroenergetics in brain of healthy middle-aged men and women. Free Radic. Biol. Med. 2020, 153, 112–121. [Google Scholar] [CrossRef] [PubMed]
- Choi, I.Y.; Lee, P.; Denney, D.R.; Spaeth, K.; Nast, O.; Ptomey, L.; Roth, A.K.; Lierman, J.A.; Sullivan, D.K. Dairy intake is associated with brain glutathione concentration in older adults. Am. J. Clin. Nutr. 2015, 101, 287–293. [Google Scholar] [CrossRef] [Green Version]
- Lapidus, K.A.B.; Gabbay, V.; Mao, X.; Johnson, A.; Murrough, J.W.; Mathew, S.J.; Shungu, D.C. In vivo 1H MRS study of potential associations between glutathione, oxidative stress and anhedonia in major depressive disorder. Neurosci. Lett. 2014, 569, 74–79. [Google Scholar] [CrossRef] [PubMed] [Green Version]
- Shungu, D.C.; Weiduschat, N.; Murrough, J.W.; Mao, X.; Pillemer, S.; Dyke, J.P.; Medow, M.S.; Natelson, B.H.; Stewart, J.M.; Mathew, S.J. Increased ventricular lactate in chronic fatigue syndrome. III. Relationships to cortical glutathione and clinical symptoms implicate oxidative stress in disorder pathophysiology. NMR Biomed. 2012, 25, 1073–1087. [Google Scholar] [CrossRef] [PubMed] [Green Version]


| Ref | HC Participants | Age (Range or Mean ± SD) | Scanner | Method | Site of Detection (VOI Dimension and Brain Area) | GSH Concentration (HC) | Results |
|---|---|---|---|---|---|---|---|
| [33] | Phantoms | 3 T GE + 8 channels head coil | Edited: MEGA-PRESS TR/TE = 1800/131 ms + LCModel Unedited: PRESS TR/TE = 3000/30 ms + LCModel | MEGA-PRESS appears more precise at a lower GSH concentration | |||
| [91] | Phantoms + 10 HC | 26 ± 3.3 | 3 T Siemens + 32 channels head coil | Edited: MEGA-PRESS TR/TE = 2000/120 ms + Gannet Unedited: PRESS TR/TE = 2000/30 ms SPECIAL TR/TE = 2000/8 ms PR-STEAM TR/TE = 2000/6.5 ms + LCModel | 24 cm3 in MFC | MEGA-PRESS 1.87 ± 0.36 mM PRESS: 1.69 ± 0.13 mM SPECIAL = 2.3 ± 027 mM PR-STEAM: 2.29 ± 0.16 mM | Reliability comparison shows more reproducible GSH measurements for unedited sequences (only for highest values, above 3 mM) |
| [23] | Phantoms + 5 HC | 24–36; 30 ± 3 | 3 T Siemens + 32 channels head coil | Unedited: PRESS TR/TE = 2000/30 ms + CNN for GSH quantification | 20 × 20 × 20 mm3 in left FC | GSH/tNAA = ~0.07–0.15 | Implementation of a robust method for GSH quantification in MRS using CNN |
| [59] | Phantoms + 4 HC | 30–45 | 7 T Siemens + 32 channels head coil | Unedited: 2D-COSY TR/TE = 2000/20 ms | 25 × 25 × 25 mm3 in OC | GSH/Cr = 0.05 ± 0.01 | Non-uniformly weighted sampling (NUWS) sequences produced a higher SNR |
| [66] | Phantoms + 13 HC | 28 ± 9 | 3 T Magnex Scientific | Edited: Multiple Quantum Chemical Shift Imaging + Levenberg−Marquardt least square minimization algorithm | 40 × 40 × 40 mm3 in FPC | 1.2 ± 0.16 mmol/Kg | DQC filtering-based chemical shift imaging of GSH at 3T implementation |
| [86] | Phantoms + 6 HC | 34 ± 13 | 3 T Siemens/Philips/GE/Canon + 32 channels head coil | Edited: MEGA-PRESS TR/TE = 2000/80 ms + Gannet | 27 cm3 in MCC | GSH/Cr = 0.045 ± 0.013 (Philips scanner) GSH/Cr = 0.051 ± 0.007 (Siemens scanner) | In vivo GSH/Cr ratio shows relatively low variations between scanners using the universal sequence |
| [75] | Phantoms + 10 HC | 32.6 ± 8.8 | 3 T Philips + 32 channels head coil | Edited: MEGA-PRESS TR/TE = 2000/120 ms MEGA-PRIAM TR/TE = 2000/120 ms + Gannet | 33 × 33 × 33 mm3 in left and right FC | MEGA-PRESS: 2.61 ± 0.50 i.u. (left FC) 2.95 ± 0.65 i.u. (right FC) MEGA-PRIAM 2.44 ± 0.60 i.u. (left FC) 2.81 ± 0.67 i.u. (right FC) | No significant difference between MEGA-PRESS and MEGA-PRIAM in GSH estimates |
| [69] | Phantoms + 5 HC + simulations | 31 ± 8 | 3 T Philips + 32 channels head coil | Edited: MEGA-PRESS TR/TE = 2000/120 ms + Gannet | 36 × 36 × 36 mm3 in midline PC | GSH integrals normalized by the sum of the integrals from each subject averaged across all subjects ~0.4–0.5 | TE of 120 ms appears to be optimal for in vivo GSH detection |
| [94] | Phantoms + 7 HC | 23–35 | 3 T Philips + 8 channels head coil | Edited: MEGA-PRESS TR/TE = 2000/130 ms + AMARES Unedited: PRESS TR/TE = 2000/35 ms + jMRUI | 40 × 25 × 25 mm3 in ACC and 30 × 30 × 30 mm3 in OC | MEGA-PRESS: 3.2 ± 0.6 mM (ACC) 1.4 ± 0.4 mM (OC) PRESS: 2.8 ± 0.3 mM (ACC) 2.5 ± 0.7 mM. (OC) | Physiological concentrations (<4 mM) of GSH cannot be reliably quantified from PRESS spectra at 3 T |
| [65] | Phantoms + 9 HC | 25 | 4 T Varian INOVA | Edited: MEGA-PRESS TR/TE = 4000/60 ms + LCModel | 30 × 30 × 30 mm3 in OC | 1.3 ± 0.2 µmol/g | GSH concentration estimation |
| [25] | Phantoms + 2 HC | 18–32 | 1.5 T Philips | Edited: DQC Unedited: PRESS | 15.6–17.4 cm3 | DQC filter for the selective in vivo detection of GSH in the human brain presentation | |
| [84] | Phantoms + 10 HC | 34.7 ± 8.8 | 3 T Philips + 32 channels head coil | Edited: MEGA-PRESS TR/TE = 2000/80 ms HERMES TR/TE = 2000/80 ms + Gannet | 30 × 30 × 30 mm3 in Ins | SNR of the HERMES spectra is similar to those of MEGA-PRESS, with the benefit of saving half the acquisition time | |
| [47] | Phantoms + 6 HC + simulations | N.D | 7 T Philips | Unedited: asymmetric PRESS TE1/TE2 = 37/63 ms STEAM TR/TE = 2500/14–74 ms + LCModel | 25 × 30 × 30 mm3 in MPFC | Optimization of the TE delays in asymmetric PRESS enables the separation of GSH without editing | |
| [48] | Phantoms + 8 HC + simulations | 32 ± 11 | 7 T Siemens + 32 channels head coil | Unedited: asymmetric PRESS TR/TE = 3000/3.9 ms | 20 × 20 × 20 mm3 in MPFC and FC | GSH/tCr = 0.216 ± 0.02 (MPFC) GSH/tCr = 0.27 ± 0.03 (FC); | Glu and Gln higher in GM. GSH and Gln have a similar concentration (20–27% of Cr) |
| [46] | 6 HC | 22–26 | 3 T/7 T Siemens | Unedited: SPECIAL TR/TE = 4000/6 ms + LCModel | 20 × 20 × 20 mm3 in OC | 1.4 ± 0.11 mmol/Kg (3 T); 1.3 ± 0.2 mmol/Kg (7 T) | SPECIAL with ultrashort TEs resulted in a high SNR and allow to reduce RF power requirements and improve chemical shift displacement errors |
| [56] | 15 HC | 24.9 ± 3.5 | 3 T Siemens + 32 channels head coil | Edited: MEGA-PRESS TR/TE = 3200/68 ms + LCModel Unedited: SPECIAL TR/TE = 3200/8.5 ms + LCModel | 30 × 30 × 20 mm3 in DLPC and M1 | MEGA-PRESS: 0.5–3 mmol/L (M1) 3–4 mmol/L (DLPC) SPECIAL: 1.3–2.4 mmol/L (M1 and DLPC) | GSH levels detected with reasonably good precision using SPECIAL, but poor precision using MEGA-PRESS |
| [55] | 21 HC | 32.2 ± 8.1 | 3 T Siemens + quadrature head coil | Unedited: SPECIAL TR/TE = 3000/6 ms + LCModel | 15 × 15 × 15 mm3 in left A | 1.03 ± 0.38 mmol/L (CRLBs: 24 ± 11 only in 16/21 HC) | Only in a small portion of the acquired spectra GSH passed the CRLB threshold of 20% |
| [43] | 18 HC | N.D. | 3 T Siemens | Unedited: PRESS TR/TE = 2000/30 ms + LCModel | 25 × 25 × 15 mm3 in SMA | ~2.2–2.6 mmol/Kg | No difference in GSH concentration recorded between HC and PSP |
| [90] | 22 HC | 12–14 | 3 T Siemens | Unedited: 2D J-resolved PRESS TR/TE = 2000/22 ms + LCModel | 20 × 20 × 30 mm3 in RACC | GSH variation factor results of 8.6 ± 4.1%, significant Pearson correlation (0.821) resulted between test and retest | |
| [152] | 63 HC | 40–60 | 3 T Siemens | Unedited: 2D J-resolved MRS TR/TE = 2000/31–229 ms + ProFit | 19 cm3 in RACC | GSH/H20 = 0.003–0.004 | GSH significantly increased for HC receiving supplements when compared with the placebo |
| [9] | 5 HC | 32 ± 8 | 7 T Agilent + 8 channels head coil | Edited: JDE semi-LASER TR/TE = 3200/72 ms + LCModel Unedited: STEAM TR/TE = 3000/10 ms + LCModel | 30 × 30 × 30 mm3 for JDE semi-LASER and 20 × 20 × 20 mm3 for STEAM in midline OC | 1.34 ± 0.13 mM (JDE semi-LASER) 2.15 ± 0.16 mM (STEAM) | Better reliability results (in terms of Coefficient of variation CV) for JDE semi-LASER when compared to STEAM |
| [45] | 21 HC | Neonates | 1.5 T GE | Unedited: PRESS TR/TE = 3000/20 ms + LCModel | 29 × 10 × 11 mm3 in WM; 11 × 24 × 11 in Th; 22 × 13 × 15 in GM | 2.1 ± 0.7 mmol/Kg (WM) 2.4 ± 0.8 mmol/Kg (Th) 2.5 ± 0.5 mmol/Kg (GM) | Absolute brain GSH content in premature infants at term was not considerably different from that in fullterm infants |
| [35] | 5 HC | 25–32 | 3 T Siemens + quadrature head coil | Edited: DQF TR/TE = 3000/70 ms | 30 × 30 × 30 mm3 in left and right PC | 0.91 ± 0.16 mM (left PC) 0.89 ± 0.16 mM (right PC) | Sequence shown to be invariant to phase difference between excitation and DQF generating pulse. |
| [51] | 10 HC | 26.1 ± 9 | 3 T Siemens | Unedited: STEAM TR/TE = 2000/6.5 ms + LCModel | 6 cm3 in ACC and PCC | 2.74 ± 0.2 i.u. (ACC) 2.07 ± 0.0025 i.u. (PCC) | Good reliability results in terms of coefficient of variation CV (<10%) |
| [153] | 60 HC | 60–85 | 3 T Siemens | Edited: Multiple Quantum Chemical Shift Imaging + Levenberg−Marquardt least square minimization algorithm | 50 × 50 × 30 mm3 in FC and PC | 1.27 ± 0.32 mmol/Kg (FC) 1.28 ± 0.27 mmol/Kg (PC) | glutathione concentrations in brain regions were positively correlated with milk servings |
| [85] | 18 HC | Neonates | 3 T Philips | Edited: HERMES TRT/E = 2000/80 ms + Gannet | 31 × 25 × 20 mm3 in Th and ACC | 0.55–0.7 i.u. (ACC) 0.5–0.58 i.u (Th) | lower GSH levels in Th compared to the ACC and higher GSH levels in the ACC following tissue-correction |
| [87] | 20 HC | 21–35; 29 ± 5 | 3 T Philips + 32 channel head coil | Edited: HERMES TRT/E = 2000/80 ms + LCModel | 25 × 25 × 25 mm3 in MACC | GSH/tCr = 0.18 ± 0.04 | HERMES showed to be more sensitive to motion, as variability of spectral quality measures were observed for GSH when only retrospective outlier removal was applied. |
| [81] | 40 HC | 3 T Philips | Edited: HERMES TRT/E = 2000/80 ms + Gannet | Ranging from 30 × 30 × 30 to 36 × 36 × 36 mm3 in medial PC | The multi step Frequency and Phase Correction approach (msFPC) results in improved correction of frequency/phase errors in multiplexed GABA-/GSH-edited MRS experiments. | ||
| [72] | 67 HC | 8–12 | 3 T Philips | Edited: HERMES TR/TE = 2000/80 ms + Gannet | 30 × 30 × 30 mm3 in right SM, SMA, and right Ins | 0.56 ± 0.14 i.u. (SM) 0.57 ± 0.15 i.u. (SMA) 0.69 ± 0.19 i.u. (Ins) | Robust Spectral Registration (rSR) reduced more subtraction artifacts than the multistep method |
| [93] | 12 HC | 25 ± 2.5 | 3 T Siemens + 32 channel head coil | Edited:MEGA-PRESS TR/TE = 2000/120 ms HERMES TRT/E = 2000/80 ms + Gannet | 30 × 25 × 25 mm3 in DACC | 1.96 ± 0.49 i.u. (MEGA-PRESS) 3.95 ± 0.44 i.u. (HERMES) | MEGA-PRESS provide more reproducible GSH (in terms of CV%) quantification compared to HERMES |
| [73] | 4 HC | 47.3 ± 5.6 | 3 T GE | Edited: MEGA-PRESS TR/TE = 2000/80 ms | 30 × 30 × 30 mm3 in PC | 2 mM | Phantoms confirm GSH MEGA-PRESS signal and that GSSG would be undetectable at concentrations expected in vivo |
| [82] | 9 HC | 23 | 4 T Varian INOVA | Edited: DWE with MEGA-PRESS TR/TE = 4500/112 ms + LCModel | 30 × 30 × 30 mm3 in midsagittal OC | 0.8 ± 0.1 µmol/g | Double editing did not compromise sensitivity |
| [3] | 44 HC (22 young + 22 elderly) | Young = 20.4 ± 1.4 Elderly = 76.6 ± 6.1 | 4 T Varian INOVA | Edited: DWE with MEGA-PRESS TR/TE = 4500/122 ms + LCModel | 30 × 30 × 30 mm3 in midsagittal OC | Young = 0.31 ± 0.05 i.u. Elderly = 0.20 ± 0.08 i.u. | Elderly subjects had a lower GSH concentration than younger subjects |
| [83] | 12 HC | 4 T Varian INOVA | Edited: DWE with MEGA-PRESS TR/TE = 4500/102 ms + LCModel | 30 × 30 × 30 mm3 in OC | 0.7–0.9 µmol/g | GSH concentration remains costant after intravenous vitamin C infusion | |
| [67] | 11 HC | 61.5 ± 10.5 | 3 T GE + 8 channels head coil | Edited: MEGA-PRESS TR/TE = 1500/68 ms + in-house software developed in MATLAB | 20 × 25 × 25 mm3 in PG and MC | GSH/W = 1.6 ± 0.4 × 10⁻³ i.u. (MC) | Significantly lower GSH in ALS patients when compared with HC |
| [77] | 11 HC | 30 ± 11 | 3 T Philips | Edited: MEGA-PRESS TR/TE = 2000/131 ms | 50 × 30 × 30 mm3 in PC | 1.20 ± 0.14 mM | Optimal TE = 130 ms. Stroke patients not significantly different from HC |
| [154] | 10 HC | 18–65 | 3 T | Edited: MEGA-PRESS TR/TE = 1500/68 ms | 30 × 30 × 20 mm3 in OC | Anhedonia and GSH negatively correlated | |
| [155] | 13 HC | 18–45 | 3 T GE | Edited: MEGA-PRESS TR/TE = 1500/68 ms | 30 × 30 × 20 mm3 in OC | No differences between HC and CFS patients | |
| [96] | 44 HC (25 males and 19 females) | 23.6 ± 2.1 | 3 T Philips | Edited: MEGA-PRESS TR/TE = 2500/120 ms | 2.5 cm3 in FC PC, Hyp and C | ~20–22 a.u. (FC females) ~15–22 a.u. (FC males) ~30 a.u. (PC females) ~17–25 a.u. (PC males) ~15 a.u. (Hyp females) ~15 a.u. (Hyp males) ~14–17 a.u. (C females) ~10–15 a.u. (C males) | Higher GSH in young, gender matched parietal cortex hippocampus vs. older patients |
| [10] | 21 HC | 65 ± 5 | 3 T Philips | Edited: MEGA-PRESS TR/TE = 2500/120 ms + KALPANA | 15–16 cm3 in FP Hyp | 1.12 ± 0.18 mmol/L (FC) 1.02 ± 0.17 mmol/L (Hyp) | Significant reductions in GSH in both the frontal cortex and hippocampus in disease |
| [97] | 17 HC | 38.8 ± 13.1 | 3 T GE | Edited: MEGA-PRESS TR/TE = 1800/68 ms + LCModel | 25 × 40 × 30 mm3 in DLPC 28 × 30 × 25 mm3 in ACC | GSH/Cr = 0.11 ± 0.03 (ACC) GSH/Cr = 0.11 ± 0.03 (left DLPC); | Higher GSH in patients |
| [74] | 16 HC | 21–41; 30 ± 7.2 | 3 T GE + standard quadrature coil | Edited: MEGA-PRESS TR/TE = 1500/94 ms + GE software | 28 × 30 × 22 mm3 in PMPC | 0.928 ± 0.24 mM | No significant differences between GSH concentration of HC and patients |
| [3] | 14 HC | 32 ± 10 | 7 T Magnex Scientific | Unedited: STEAM TR/TE = 5000/8 ms + LCModel | Ranging from 6 × 6 × 13 to 20 × 20 × 20 mm3 in FWM, LS, PCC, OC, P, SN, and CV | Ranging from 0.50 ± 0.1 μmol/g (OC) to 1.2 ± 0.2 μmol/g (CV) | Lower GSH concentration in elderly subjects than in younger subjects |
| [89] | 10 HC | 25 ± 3 | 7 T Philips + 16 channels head coil | Unedited: STEAM TR/TE = 3000/15 ms + LCModel | 20 × 20 × 20 mm3 in OC | 2.28 ± 0.1 µmol/g | GSH increased during visual stimulation |
| [50] | 10 HC | 20 ± 3 | 4 T Varian INOVA | Edited: MEGA-PRESS TR/TE = 4500/68 ms + LCModel Unedited: STEAM TR/TE = 4500/5 ms + LCModel | 17 cm3 in ACC and 8 cm3 in OC | 1.6 ± 0.4 µmol/g (ACC) 1.6 ± 0.2 µmol/g (OC) | Validation of glutathione quantitation from the STEAM spectra |
| [7] | 10 HC | 20–70; 39.2 ± 15.3 | 7 T Siemens + 32 channels head coil | STEAM TR/TE = 8500 (9 subjects)−9300 (1 subject)/6 ms + LCModel | 20 × 20 × 20 mm3 in PCC/precuneus | 1.9 ± 0.3 mmol/L | GSH levels higher in IGE (idiopathic generalized epilepsy) compared with HC |
| [137] | 8 HC | 19–53; 28.4 ± 10.7 | 1.5 T Philips + birdcage head coil | PRESS + DCQ (double quantum coherence) filtering | 25 × 25 × 25 cm3 POC | GSH/H2O = 2.3 ± 0.9 × 10⁻⁵ (right POC) 2.5 ± 1.2 × 10⁻⁵ (left POC) | GSH/water ratio significantly reduced in both hemisphere Ins epileptic patients compared with HC |
| [44] | 7 HC | 6–17 | 3 T Siemens + 32 channels head coil | PRESS TR/TE = 1980/30 ms + LCModel | variable from 3 to 8 cm3 in the right gangliocapsular region | 2.0 ± 0.5 mM | Higher levels of brain GSH in KD patients compared with HC |
| [68] | 17 HC | 7 T and 3 T Siemens + 16 channels head coil (7 T) | MEGA-PRESS TR/TE = 2000/68 ms | 3.5 × 2.5 × 2.3 cm3 in left or right M1 (3 T and 7 T) and pons (3 T) | No significative difference in brain GSH between ALS patients and HC using 3 T scanner | ||
| [67] | 11 HC | 58.5 ± 6.6 | 3 T GE + 8 channels head coil | PRESS with J-edited spin echo method TR/TE 1500/68 ms | single voxel on primary motor cortex (M1) | GSH/H2O = 1.6 ± 0.5 × 10⁻³ GSH/Cr 1.9 ± 0.8 × 10⁻² | Reduced GSH in ALS patients compared with HC |
| [131] | 15 HC | 55–75 | 3 T GE + 8 channels head coil | PRESS with J-edited spin echo method TR/TE 1500/68 ms | 2.5 × 2.5 × 2.5 cm3 PCC and precuneus | GSH reduction with increased levels of amyloidosis | |
| [96] | 85 HC | males 26.4 ± 3.0; females 23.6 ± 2.1 | 3 T Philips + 32 channels head coil | MEGA-PRESS TR/TE = 2500/120 ms | 2.5 × 2.5 × 2.5 cm3 in several brain regions | Female HC have higher GSH levels compared to male HC with a specific distribution pattern | |
| [128] | 29 HC | 18–50 | 3 T GE | PRESS TR/TE = 3000/30 ms + LCM model | 20 × 20 × 15 mm3 in BG and 16 × 24 × 20 mm3 in DMPFC | 2–3 mM (DMPFC and BG) | No difference between GSH levels in ASD patients and HC |
| [99] | 40 HC | 18–30 | 3 T Philips + 32 channels head coil | MEGA-PRESS TR/TE = 2048/68 ms | 3 × 3 × 3 cm3 in five different regions (OC, left/right MT, TC, and PC) | Occipital 6.91 (0.68) i.u. Left MT+ 5.51 (0.86) i.u. Right MT+ 6.59 (0.67) i.u. Temporal 7.17 (0.93) i.u. Parietal 5.17 (0.59) i.u | No difference in GLX metabolites between ASD patients and HC |
| [15] | 12 HC | 50–84; 61.5 ± 4.9 | 3 T GE + 8 channel head coil | PRESS TR/TE = 2000/35 ms + LCModel | 20 × 20 × 20 mm3 in ACC | GSH/Cr = 0.22 ± 0.06 | Increased GSH in patients with depressive symptoms |
| [62] | 17 HC | 20–29 | 3 T GE + 8 channel head coil | PRESS TR/TE = 2000/35 ms + LCModel | 20 × 20 × 20 mm3 in ACC | 1.47 ± 0.47 i.u. | Less GSH in the ACC of patients with high risk of alcohol abuse |
| [14] | 49 HC | 18–30 | 3 T GE + 8 channel head coil | PRESS TR/TE = 2000/35 ms + LCModel | 20 × 20 × 20 mm3 in ACC and 1.5 × 3.0 × 1.0 in left Hyp | Decreased ACC-GSH with tobacco use in patients with bipolar disorder. No differences in GSH levels with alcohol use | |
| [61] | 25 HC | 3 T GE + 8 channel head coil | PRESS TR/TE = 2000/35 ms + LCModel | 320 × 20 × 20 mm3 in ACC | Distinct neurometabolic profiles are evident in young people with major psychiatric disorders | ||
| [24] | 45 HC | 7 T Philips | STEAM TR/TE = 2000/17 ms + LCModel | 20 × 18 × 25 mm3 in ACC, 40 × 12 × 18 mm3 in left Ins, 20 × 22 × 20 mm3 in OC | 1.75 ± 0.31 mM (ACC) 1.72 ± 0.20 mM (left Ins) 1.5 ± 0.17 mM (OC) | Reduced GSH in ACC of patients with schizophrenia | |
| [127] | 25 HC | 34.0 ± 12.3 | 3 T Siemens + 32 channels head coil | 2DJ PRESS | 20 × 20 × 20 mm3 in PCC | GSH/Cr = 0.25 | Lower GSH/Cr in PCC of patients with obsessive compulsive disorder |
| [95] | 26 HC | 22.77 ± 4.05 | 3 T GE + 8 channel head coil | MEGA-PRESS TR/TE = 1500/68 ms | 20 × 40 × 30 mm3 in MPFC | GSH/H2O = 0.0015–0.0018 | No difference in GSH levels between HC and patients at a clinical high risk for psychosis |
| [98] | 9 HC | 22.56 ± 2.35 | 3 T GE + 8 channel head coil | MEGA-PRESS TR/TE = 1500/68 ms | 4.5 × 2.5 × 2.5 mm3 in striatum | GSH/H2O = 1.10 ± 0.10 × 10⁻³ | Striatal GSH deficit in patients with a first episode of psychosis |
| [97] | 17 HC | 40.4 ± 12.3 | 3 T GE + 8 channel head coil | MEGA-PRESS TR/TE = 1800/68 ms + LCModel | 28 × 30 × 25 mm3 in ACC and 25 × 40 × 30 mm3 in DPLFC | GSH/Cr = 0.11 ± 0.03 (ACC) | Higher GSH levels in PTSD patients |
| [42] | 41 HC | 56–80; 68.7 ± 5.8 | 3 T GE + 8 channel head coil | PRESS TR/TE = 2000/35 ms + LCModel | 20 × 20 × 20 mm3 in ACC | Elevated ratios of GSH in subjects with mild cognitive impairment | |
| [126] | 18 HC | 15–29 | 3 T GE | PRESS TE 30 ms + LCModel | 2 cm in both TC | 1.5–2 mM | GSH levels significantly higher in patients with a first episode of psychosis |
Publisher’s Note: MDPI stays neutral with regard to jurisdictional claims in published maps and institutional affiliations. |
© 2021 by the authors. Licensee MDPI, Basel, Switzerland. This article is an open access article distributed under the terms and conditions of the Creative Commons Attribution (CC BY) license (https://creativecommons.org/licenses/by/4.0/).
Share and Cite
Bottino, F.; Lucignani, M.; Napolitano, A.; Dellepiane, F.; Visconti, E.; Rossi Espagnet, M.C.; Pasquini, L. In Vivo Brain GSH: MRS Methods and Clinical Applications. Antioxidants 2021, 10, 1407. https://0-doi-org.brum.beds.ac.uk/10.3390/antiox10091407
Bottino F, Lucignani M, Napolitano A, Dellepiane F, Visconti E, Rossi Espagnet MC, Pasquini L. In Vivo Brain GSH: MRS Methods and Clinical Applications. Antioxidants. 2021; 10(9):1407. https://0-doi-org.brum.beds.ac.uk/10.3390/antiox10091407
Chicago/Turabian StyleBottino, Francesca, Martina Lucignani, Antonio Napolitano, Francesco Dellepiane, Emiliano Visconti, Maria Camilla Rossi Espagnet, and Luca Pasquini. 2021. "In Vivo Brain GSH: MRS Methods and Clinical Applications" Antioxidants 10, no. 9: 1407. https://0-doi-org.brum.beds.ac.uk/10.3390/antiox10091407