
Saracatinib, a Src Tyrosine Kinase Inhibitor, as a Disease Modifier in the Rat DFP Model: Sex Differences, Neurobehavior, Gliosis, Neurodegeneration, and Nitro-Oxidative Stress


Abstract
:1. Introduction
2. Materials and Methods
2.1. Animal Source, Care and Ethics
2.2. Chemicals and Reagents
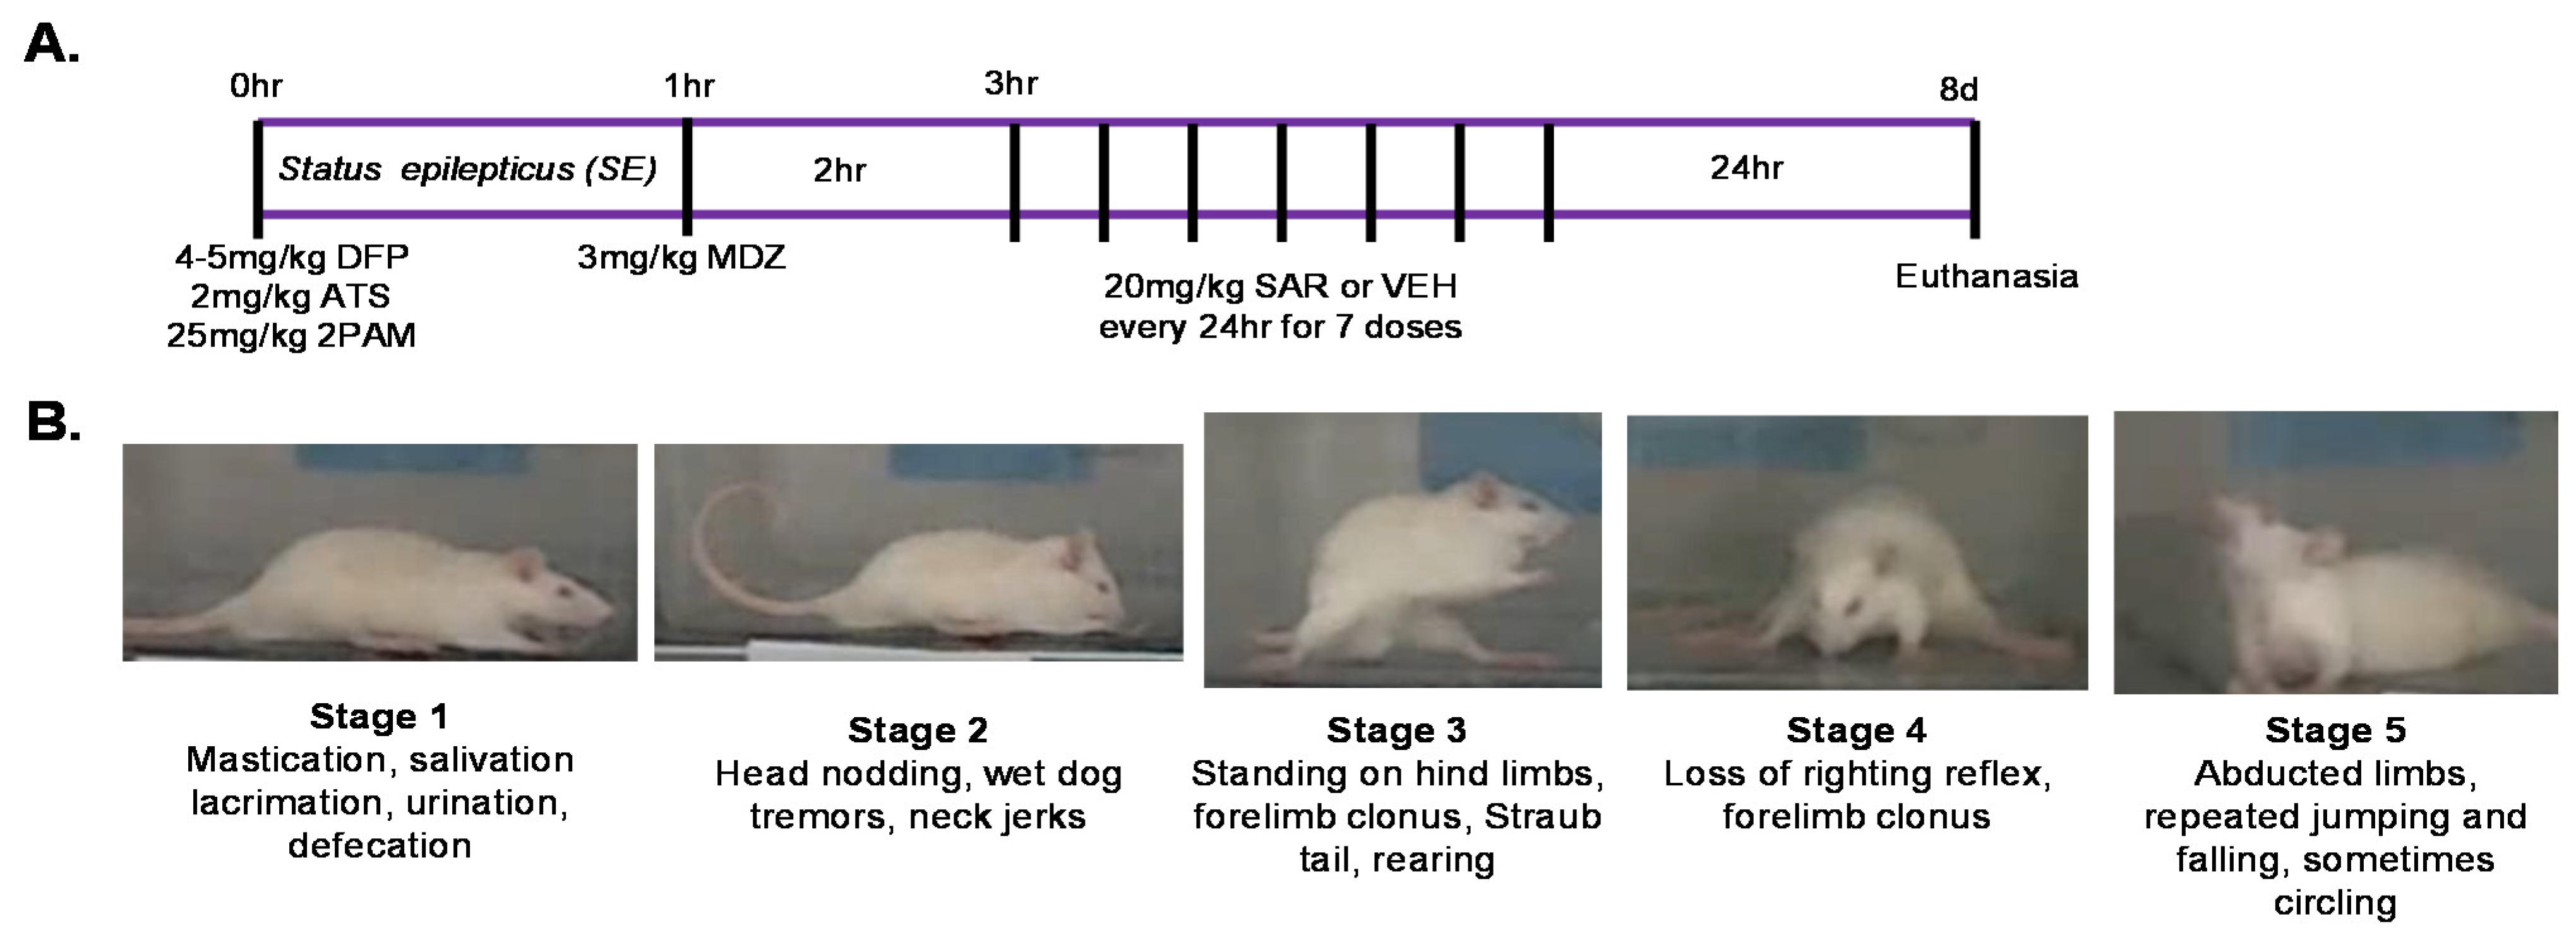
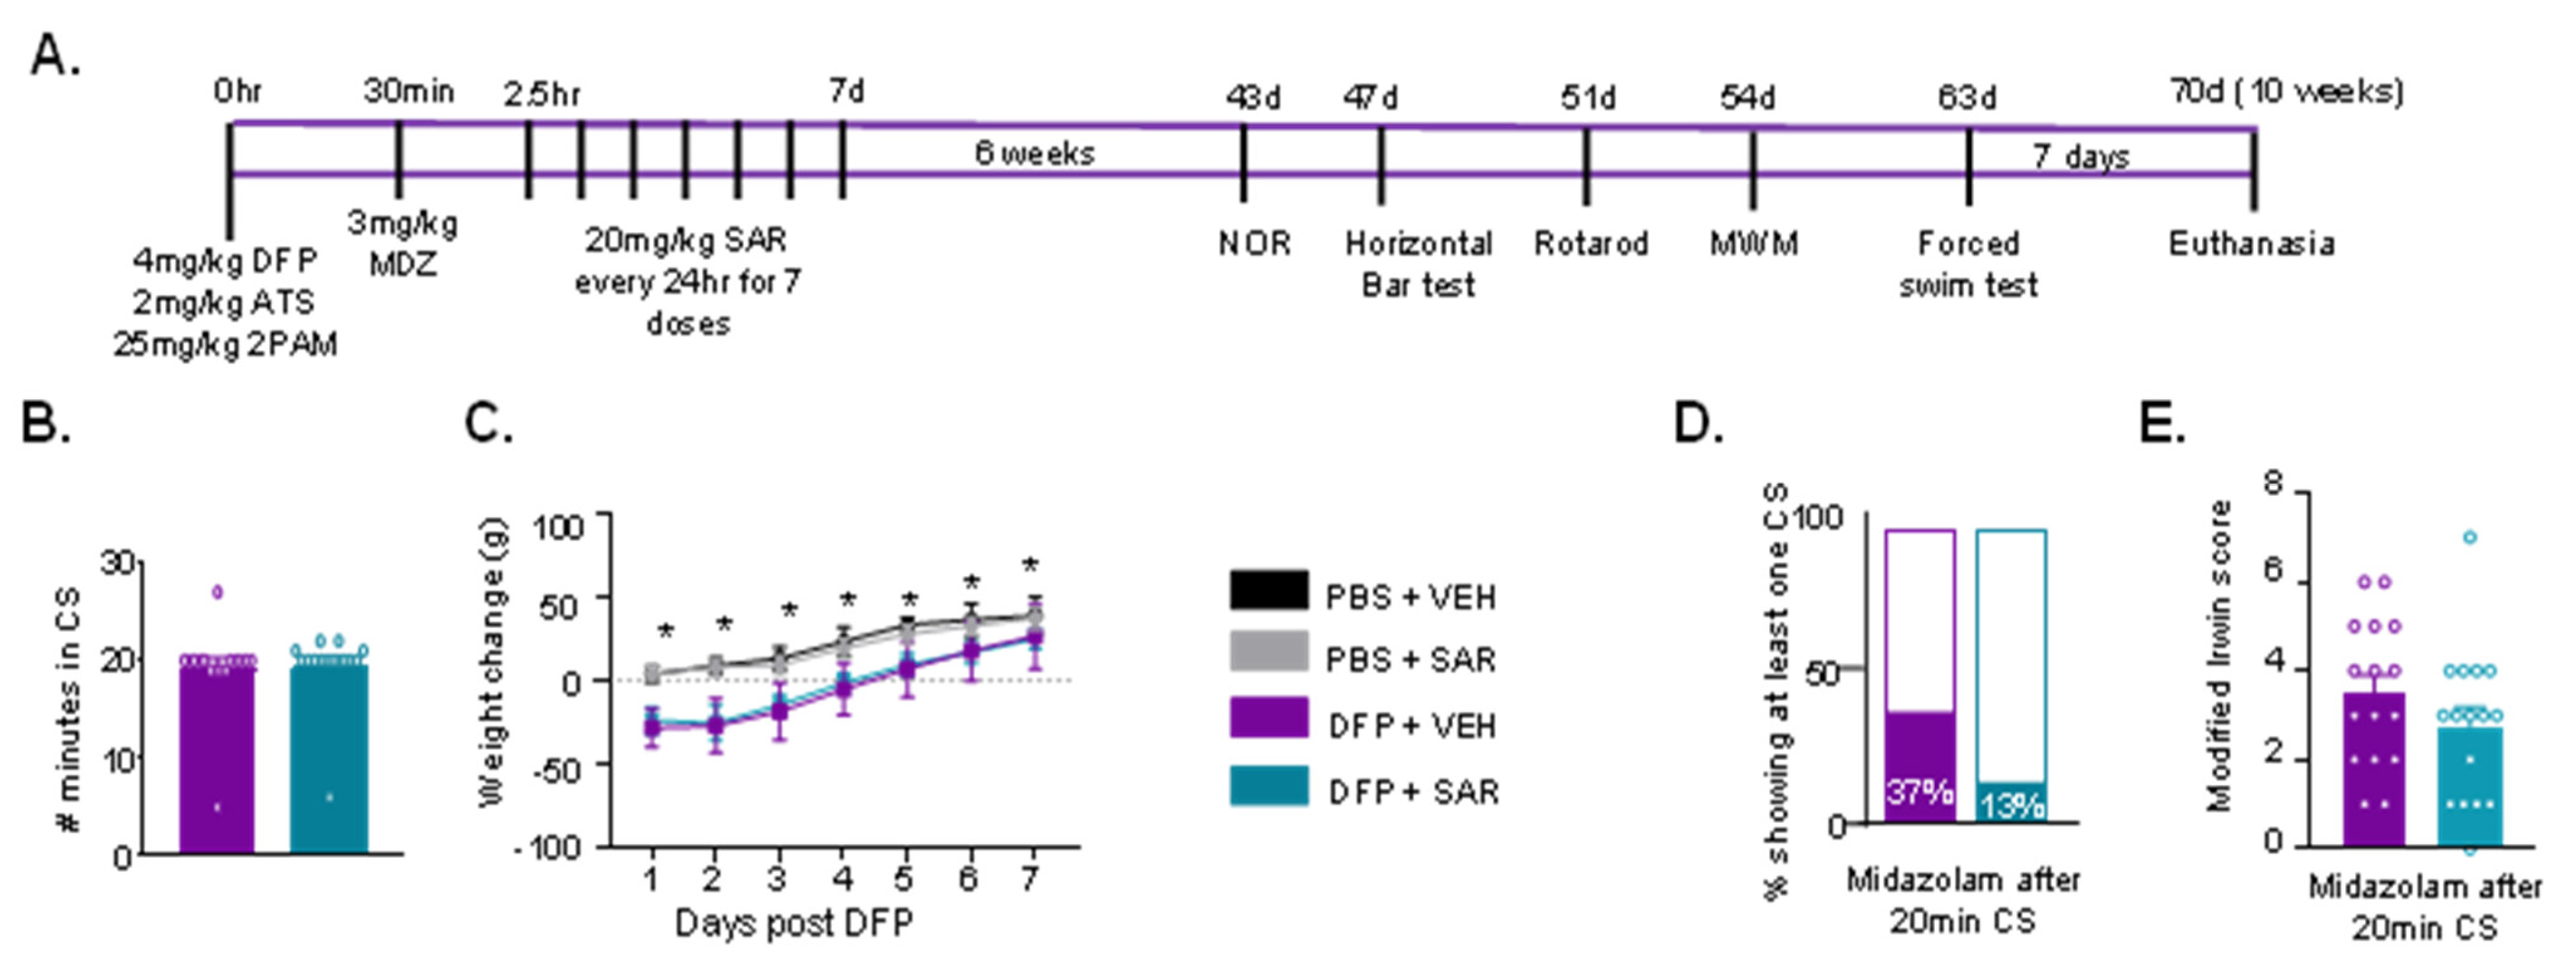
2.3. Exposure to Diisopropylflourophosphate (DFP)
2.4. Modified Irwin Scoring for Morbidity Analysis
2.5. Behavioral Evaluation
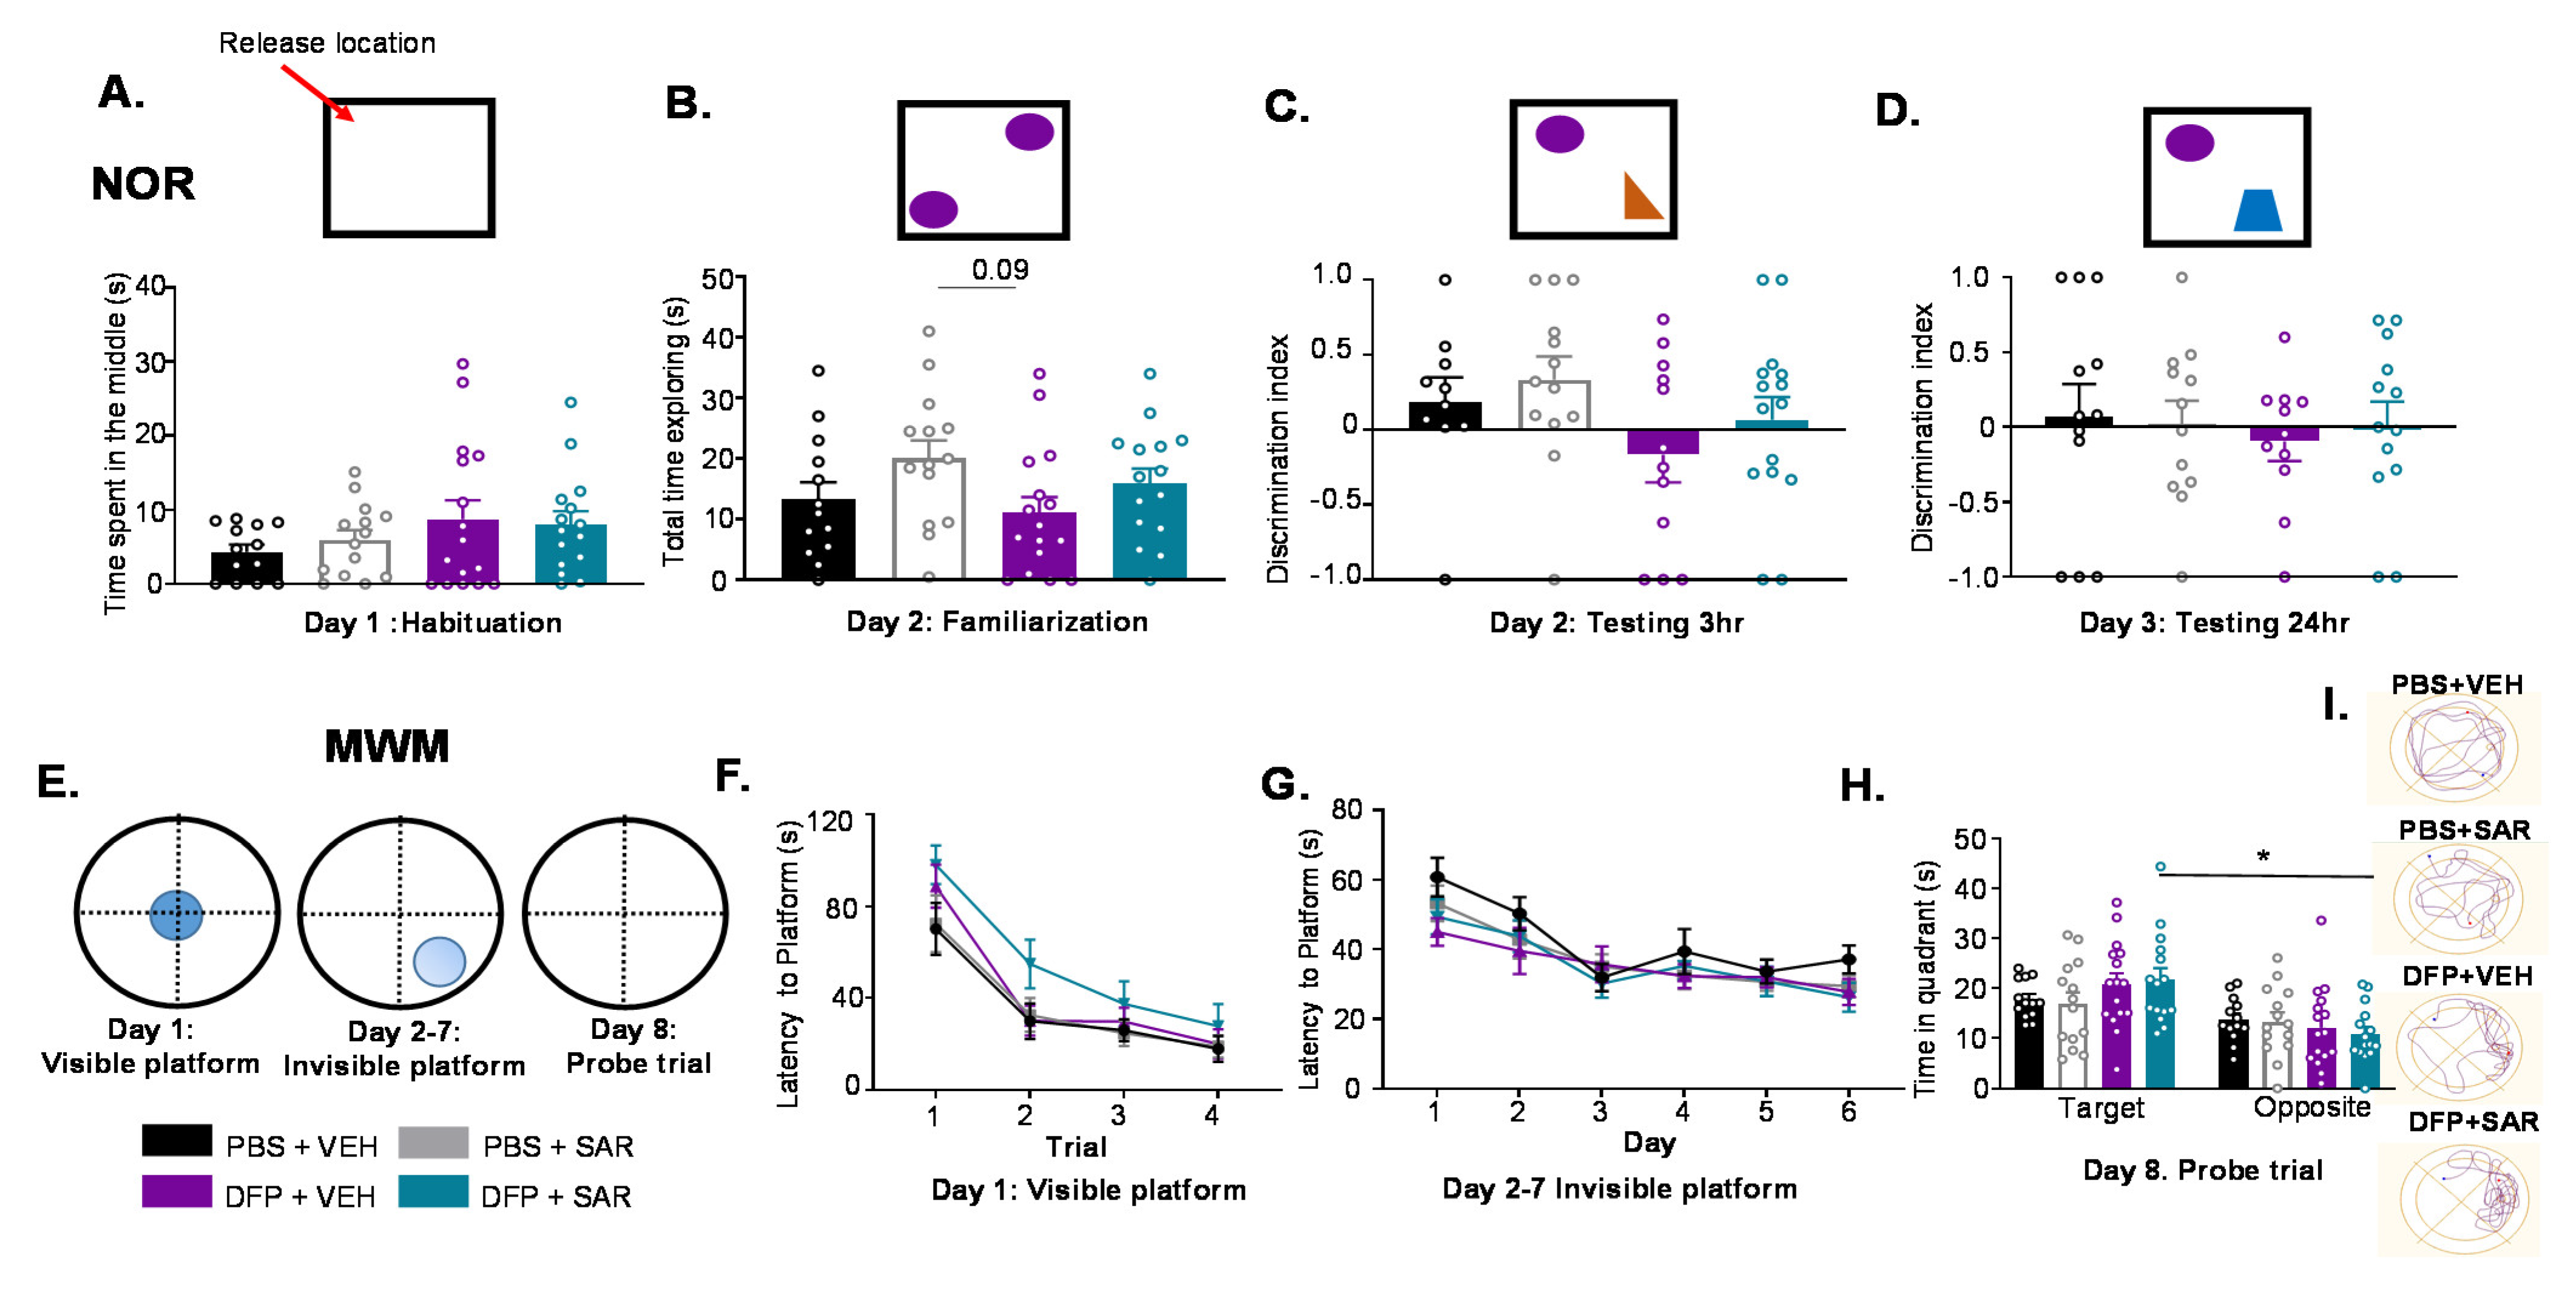
2.5.1. Novel Object Recognition
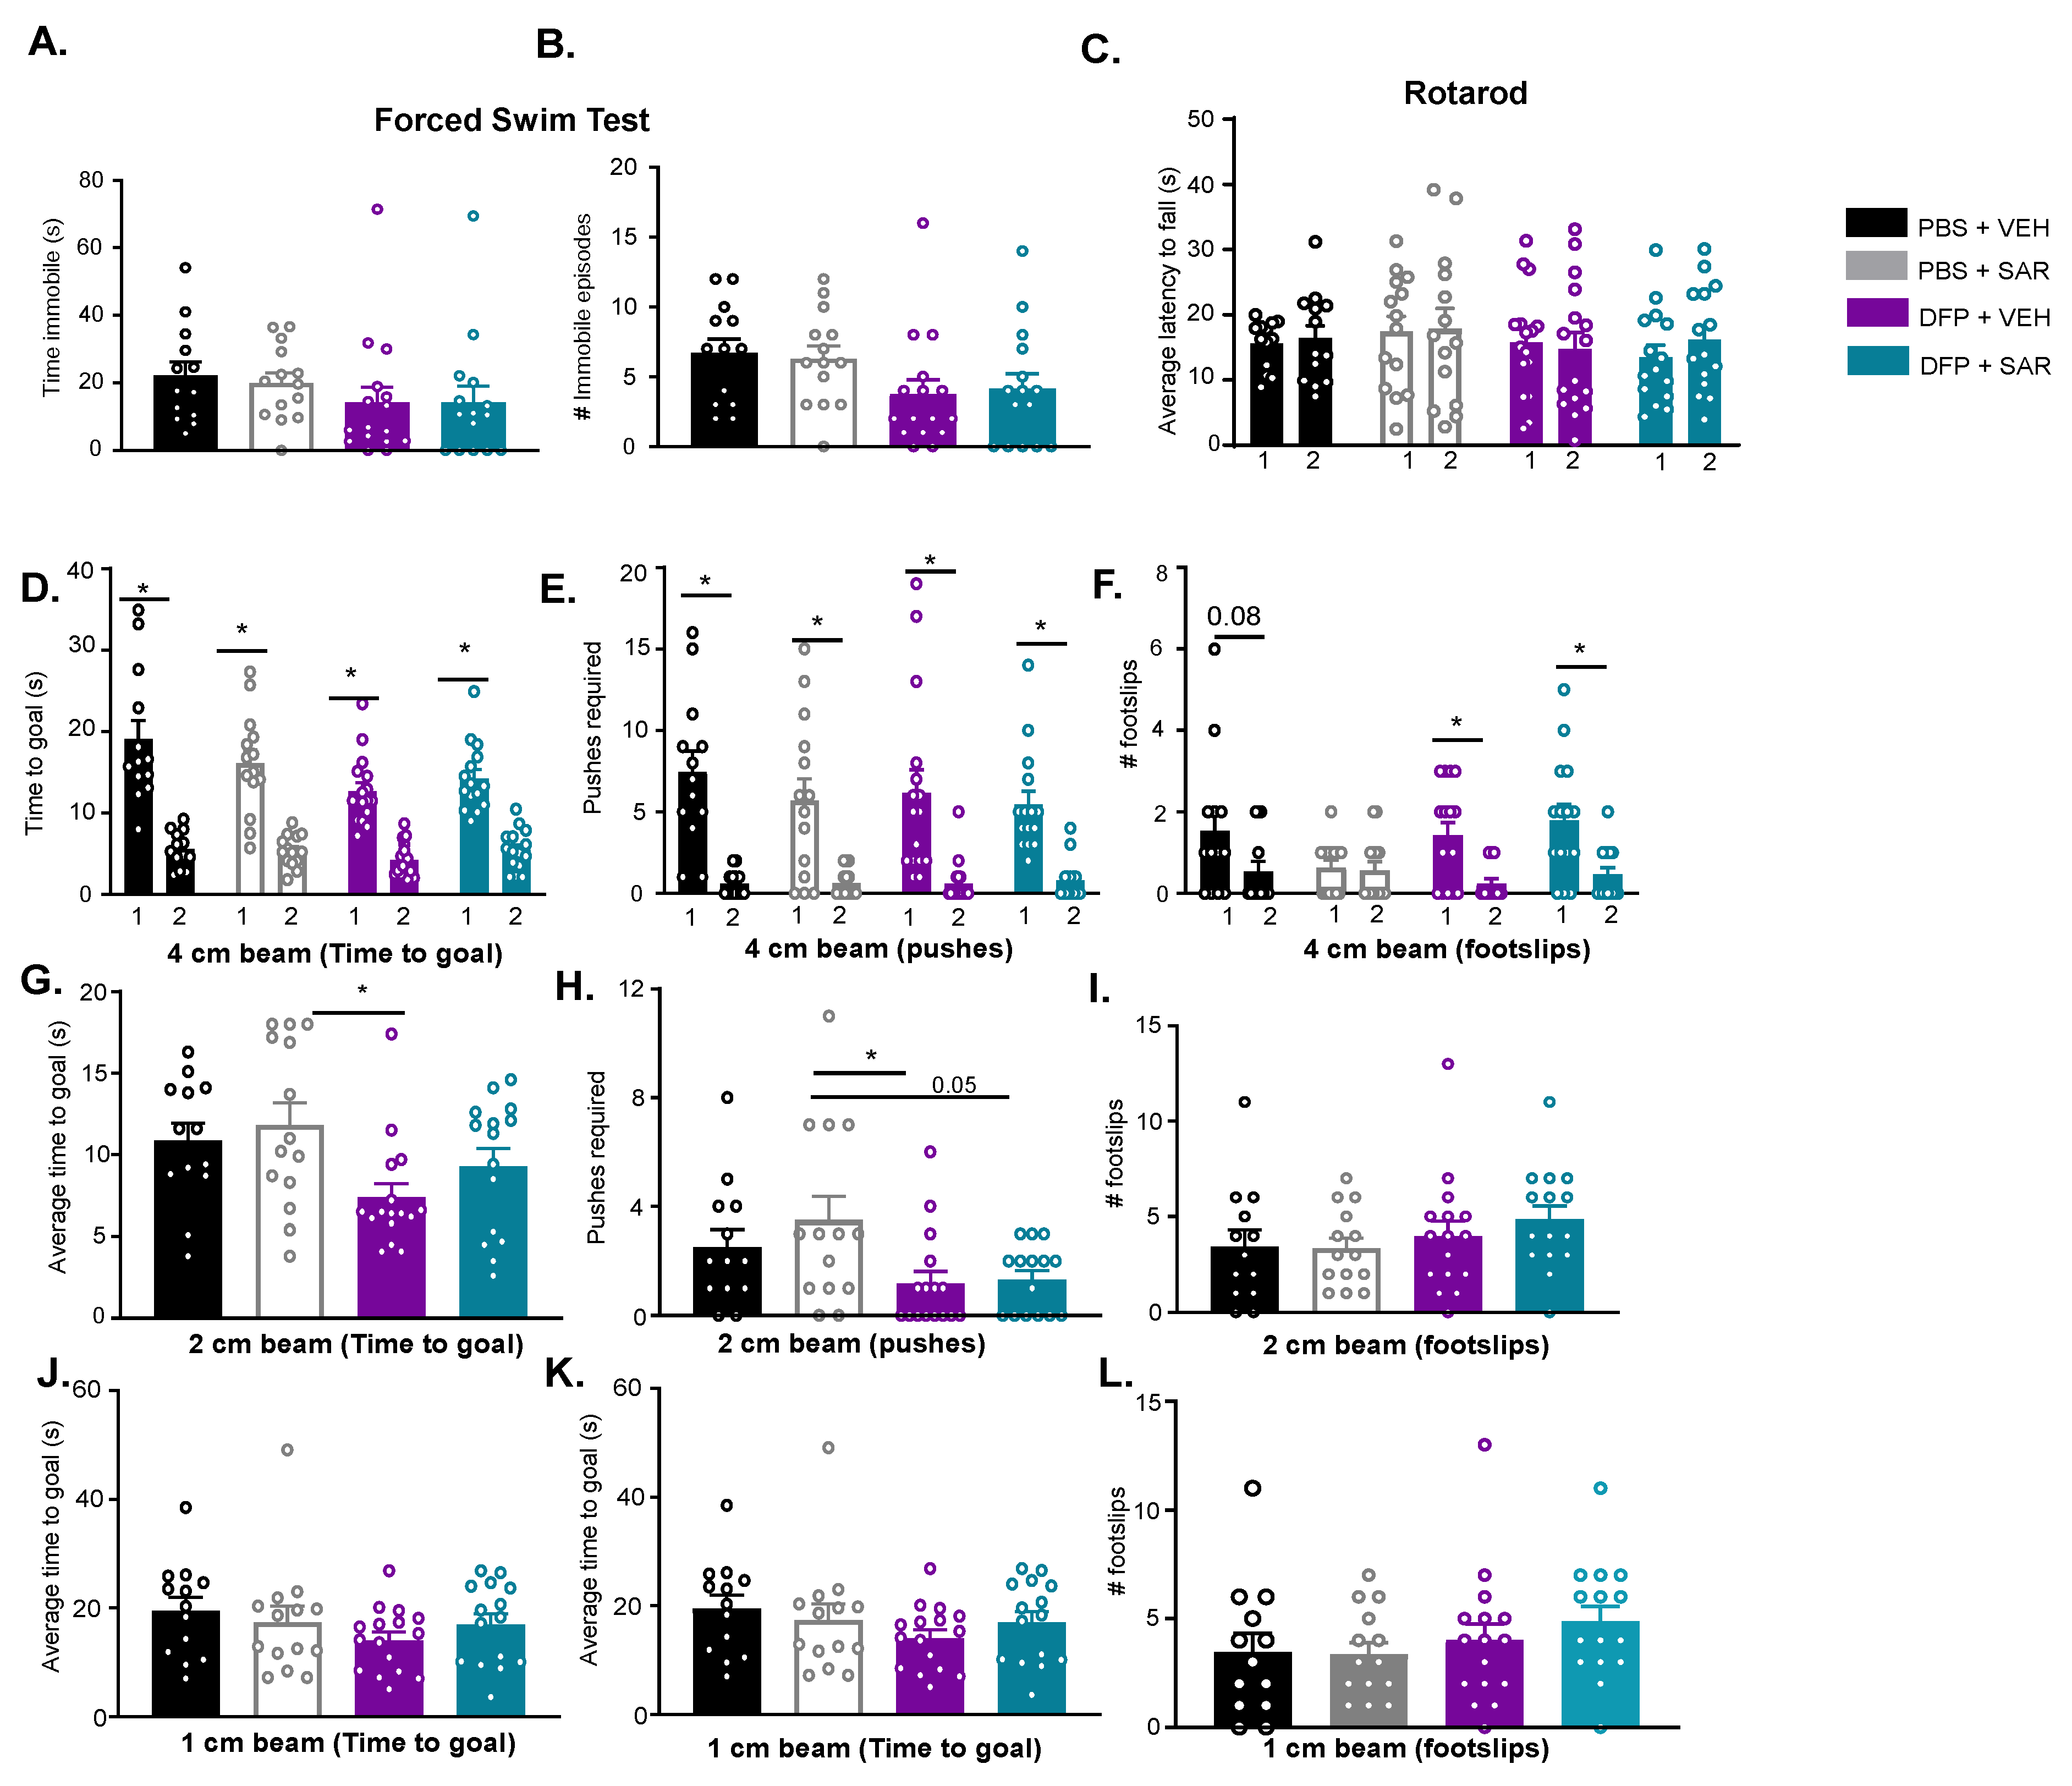
2.5.2. Horizontal Bar Test
2.5.3. Rotarod
2.5.4. Morris Water Maze (MWM)
2.5.5. Forced Swim Test
2.6. Immunohistochemistry
2.7. Western Blotting
2.8. Experimental Design, Methodological Rigor, and Statistics
3. Results
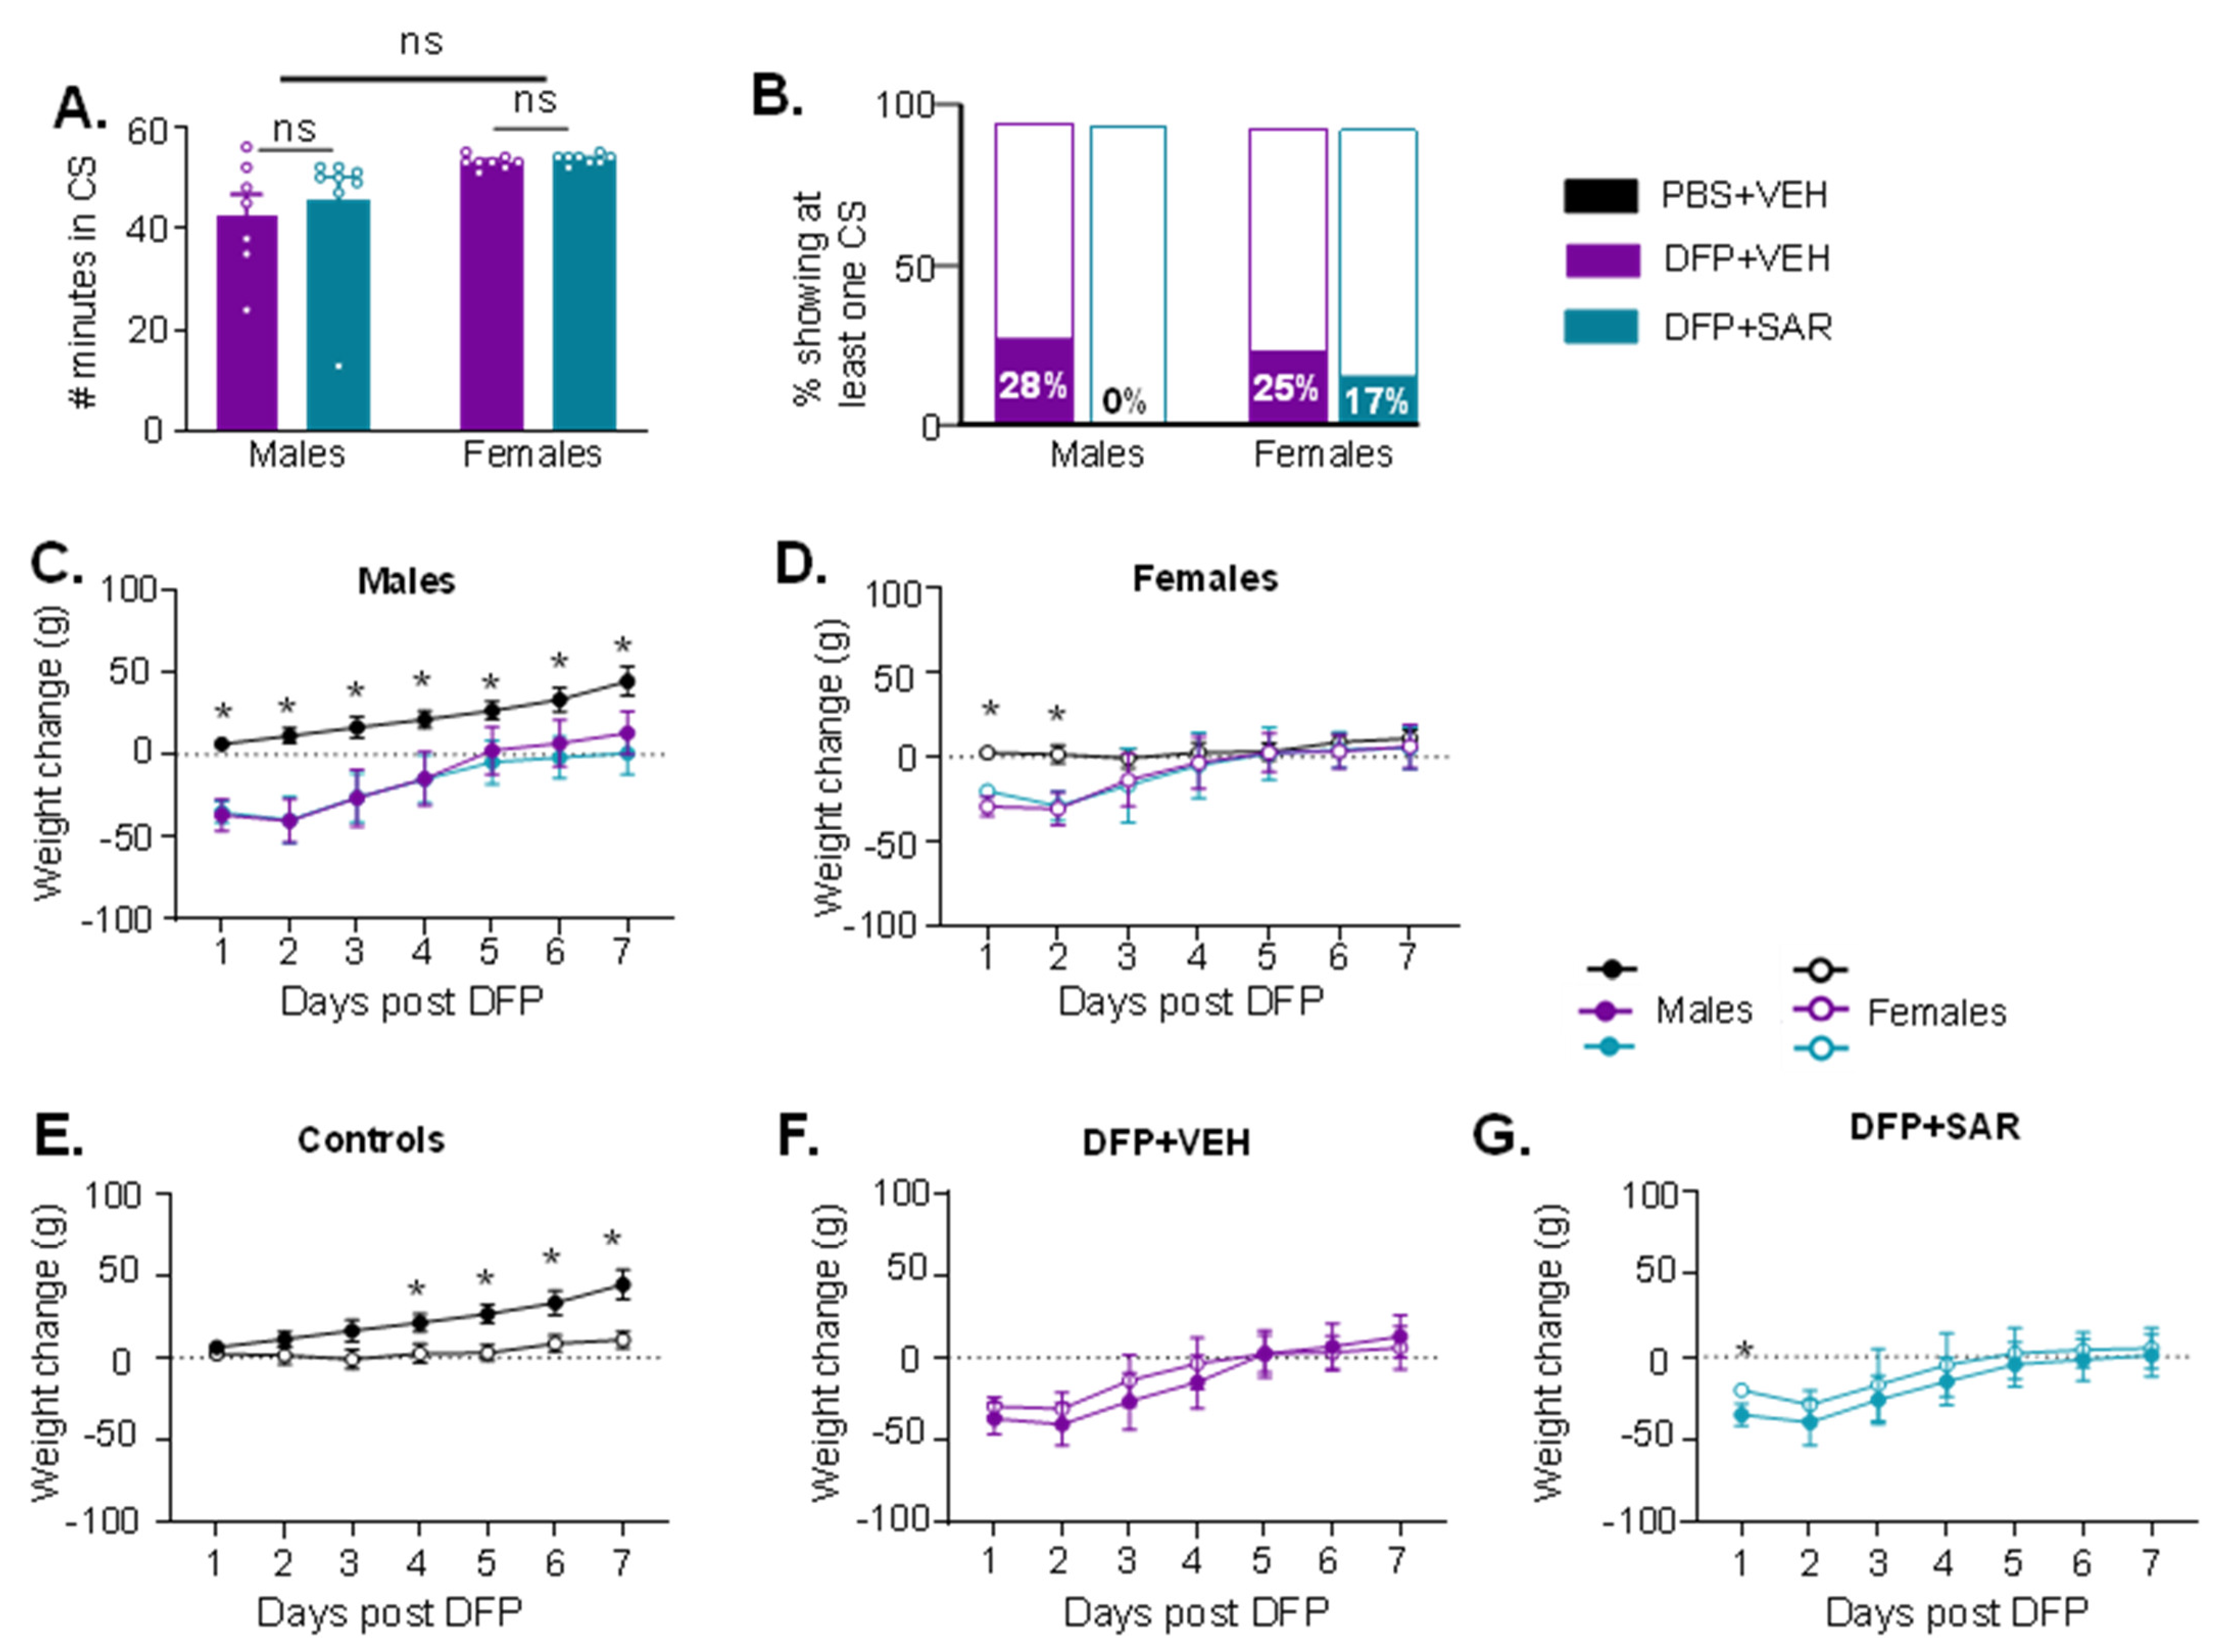
3.1. Impact of DFP and SAR Treatment: SE Severity, Weight Loss, SRS, and Mortality
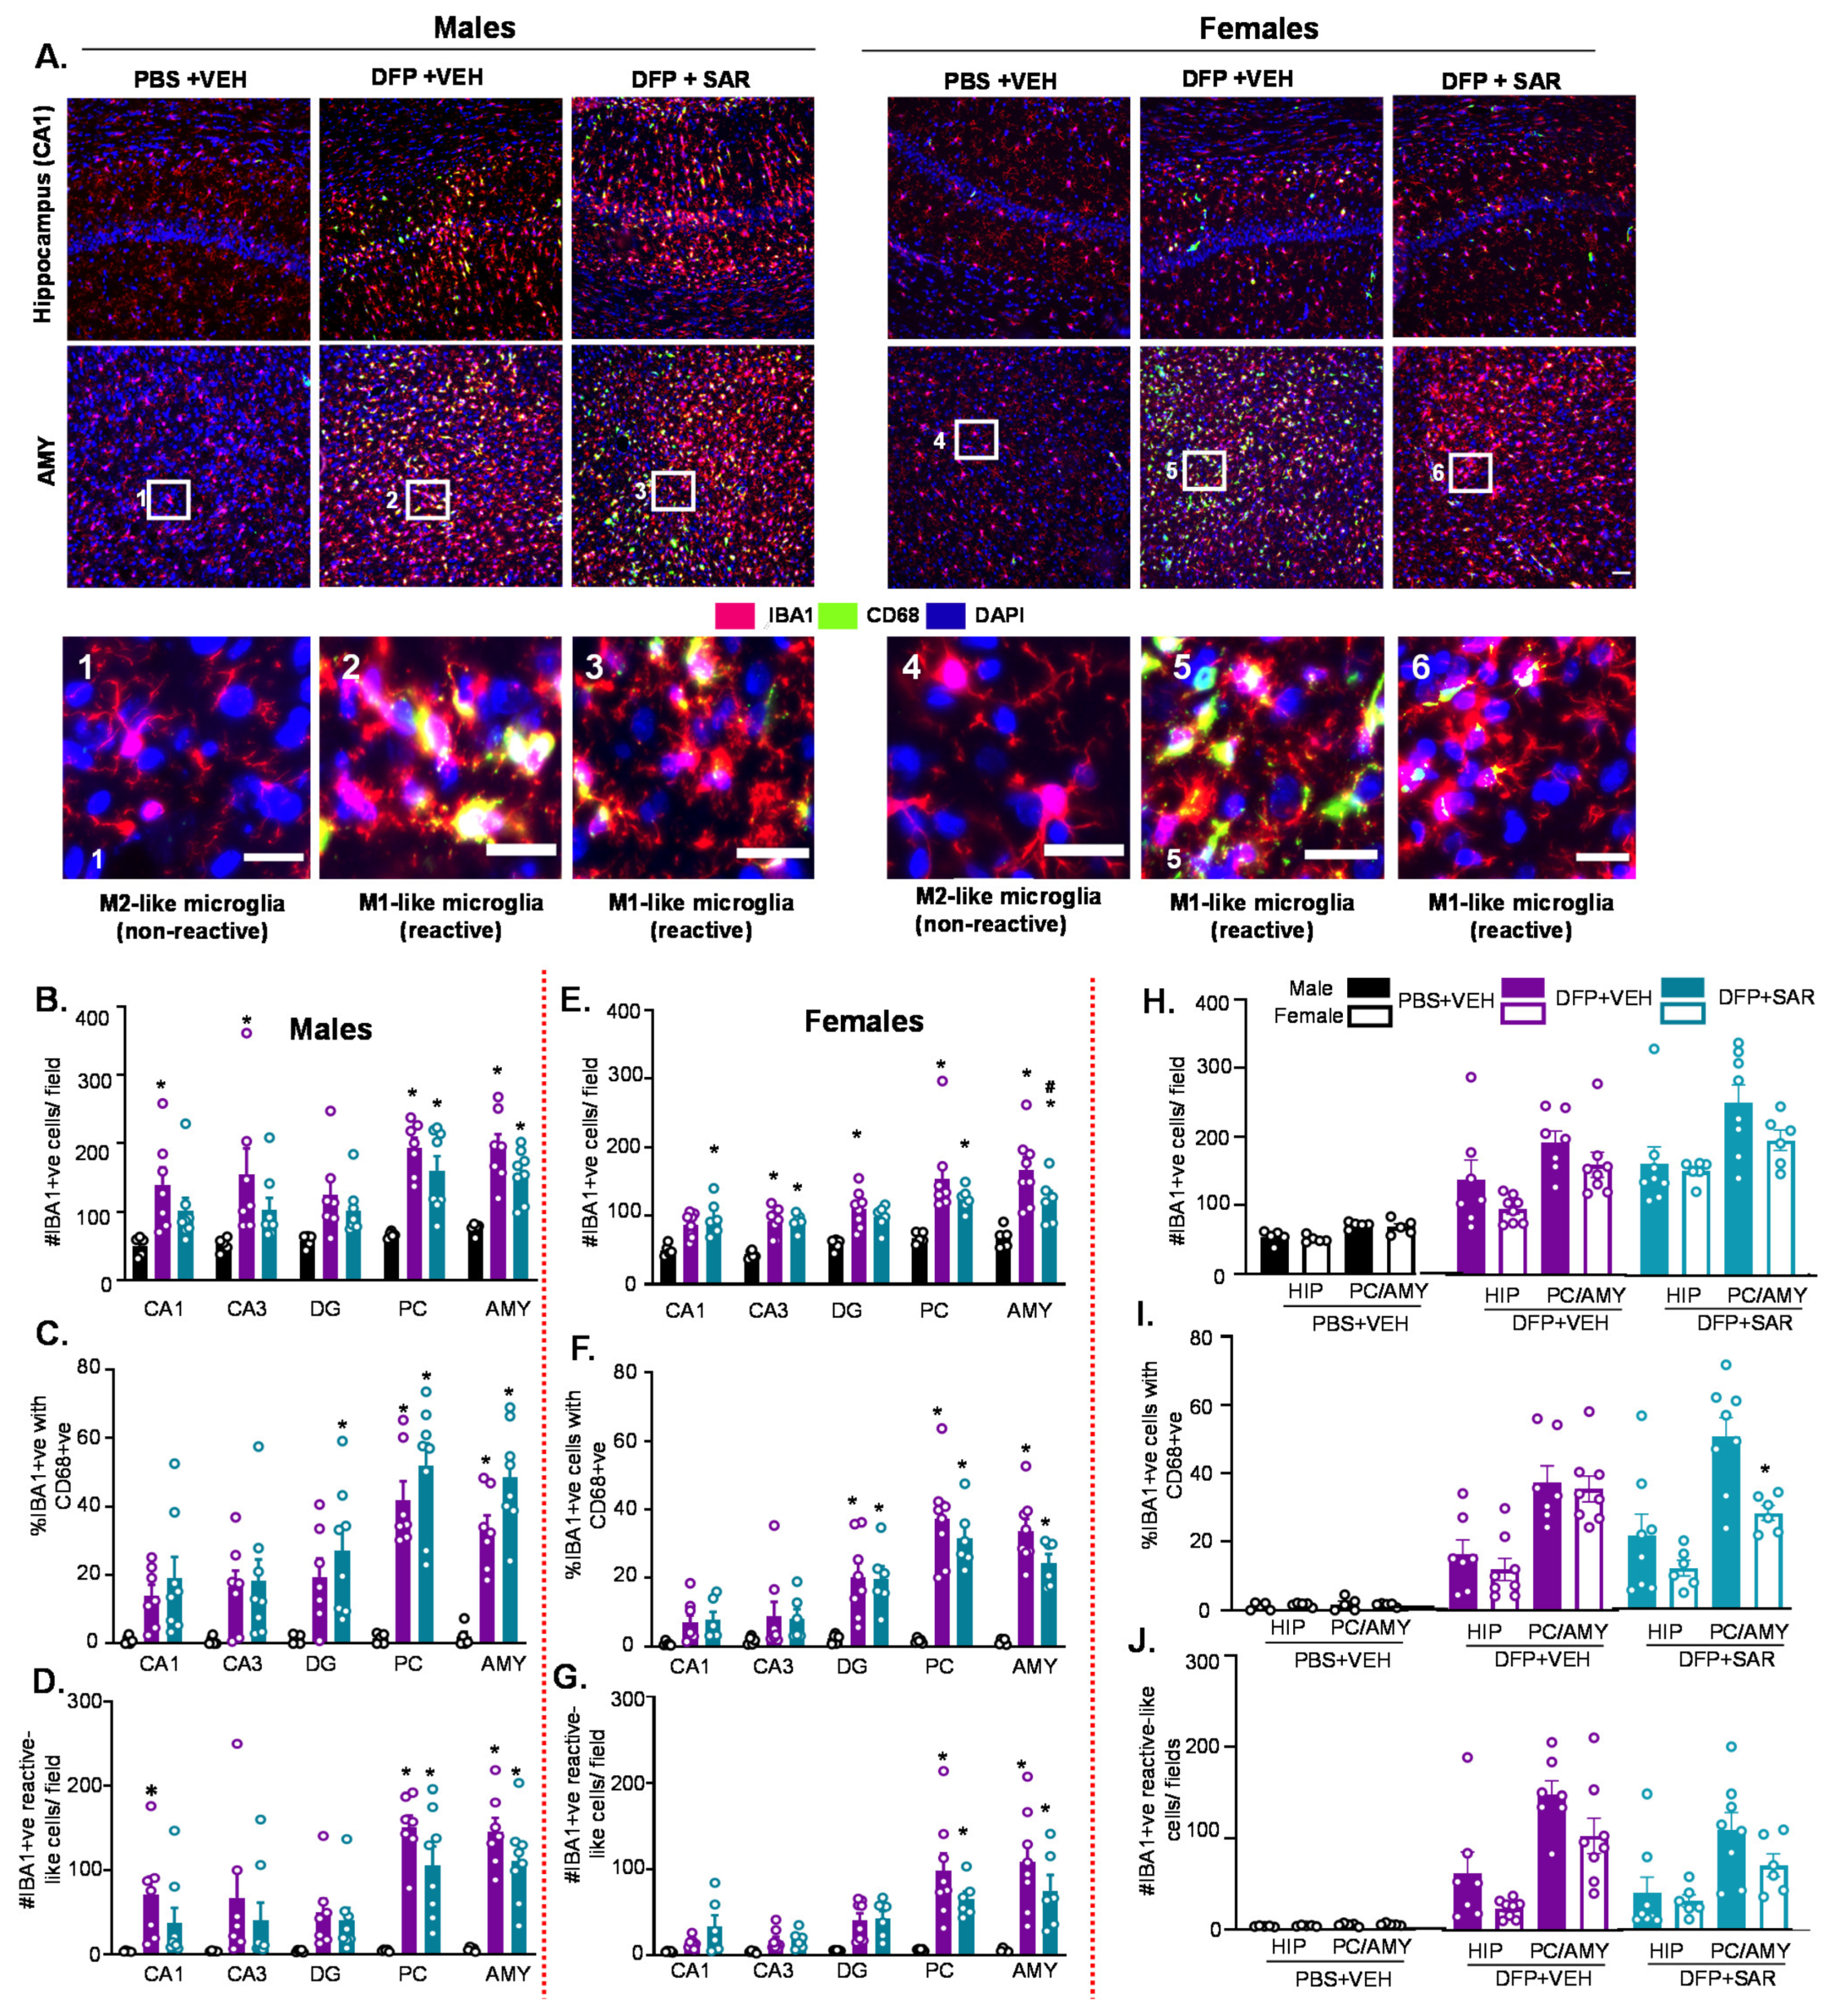
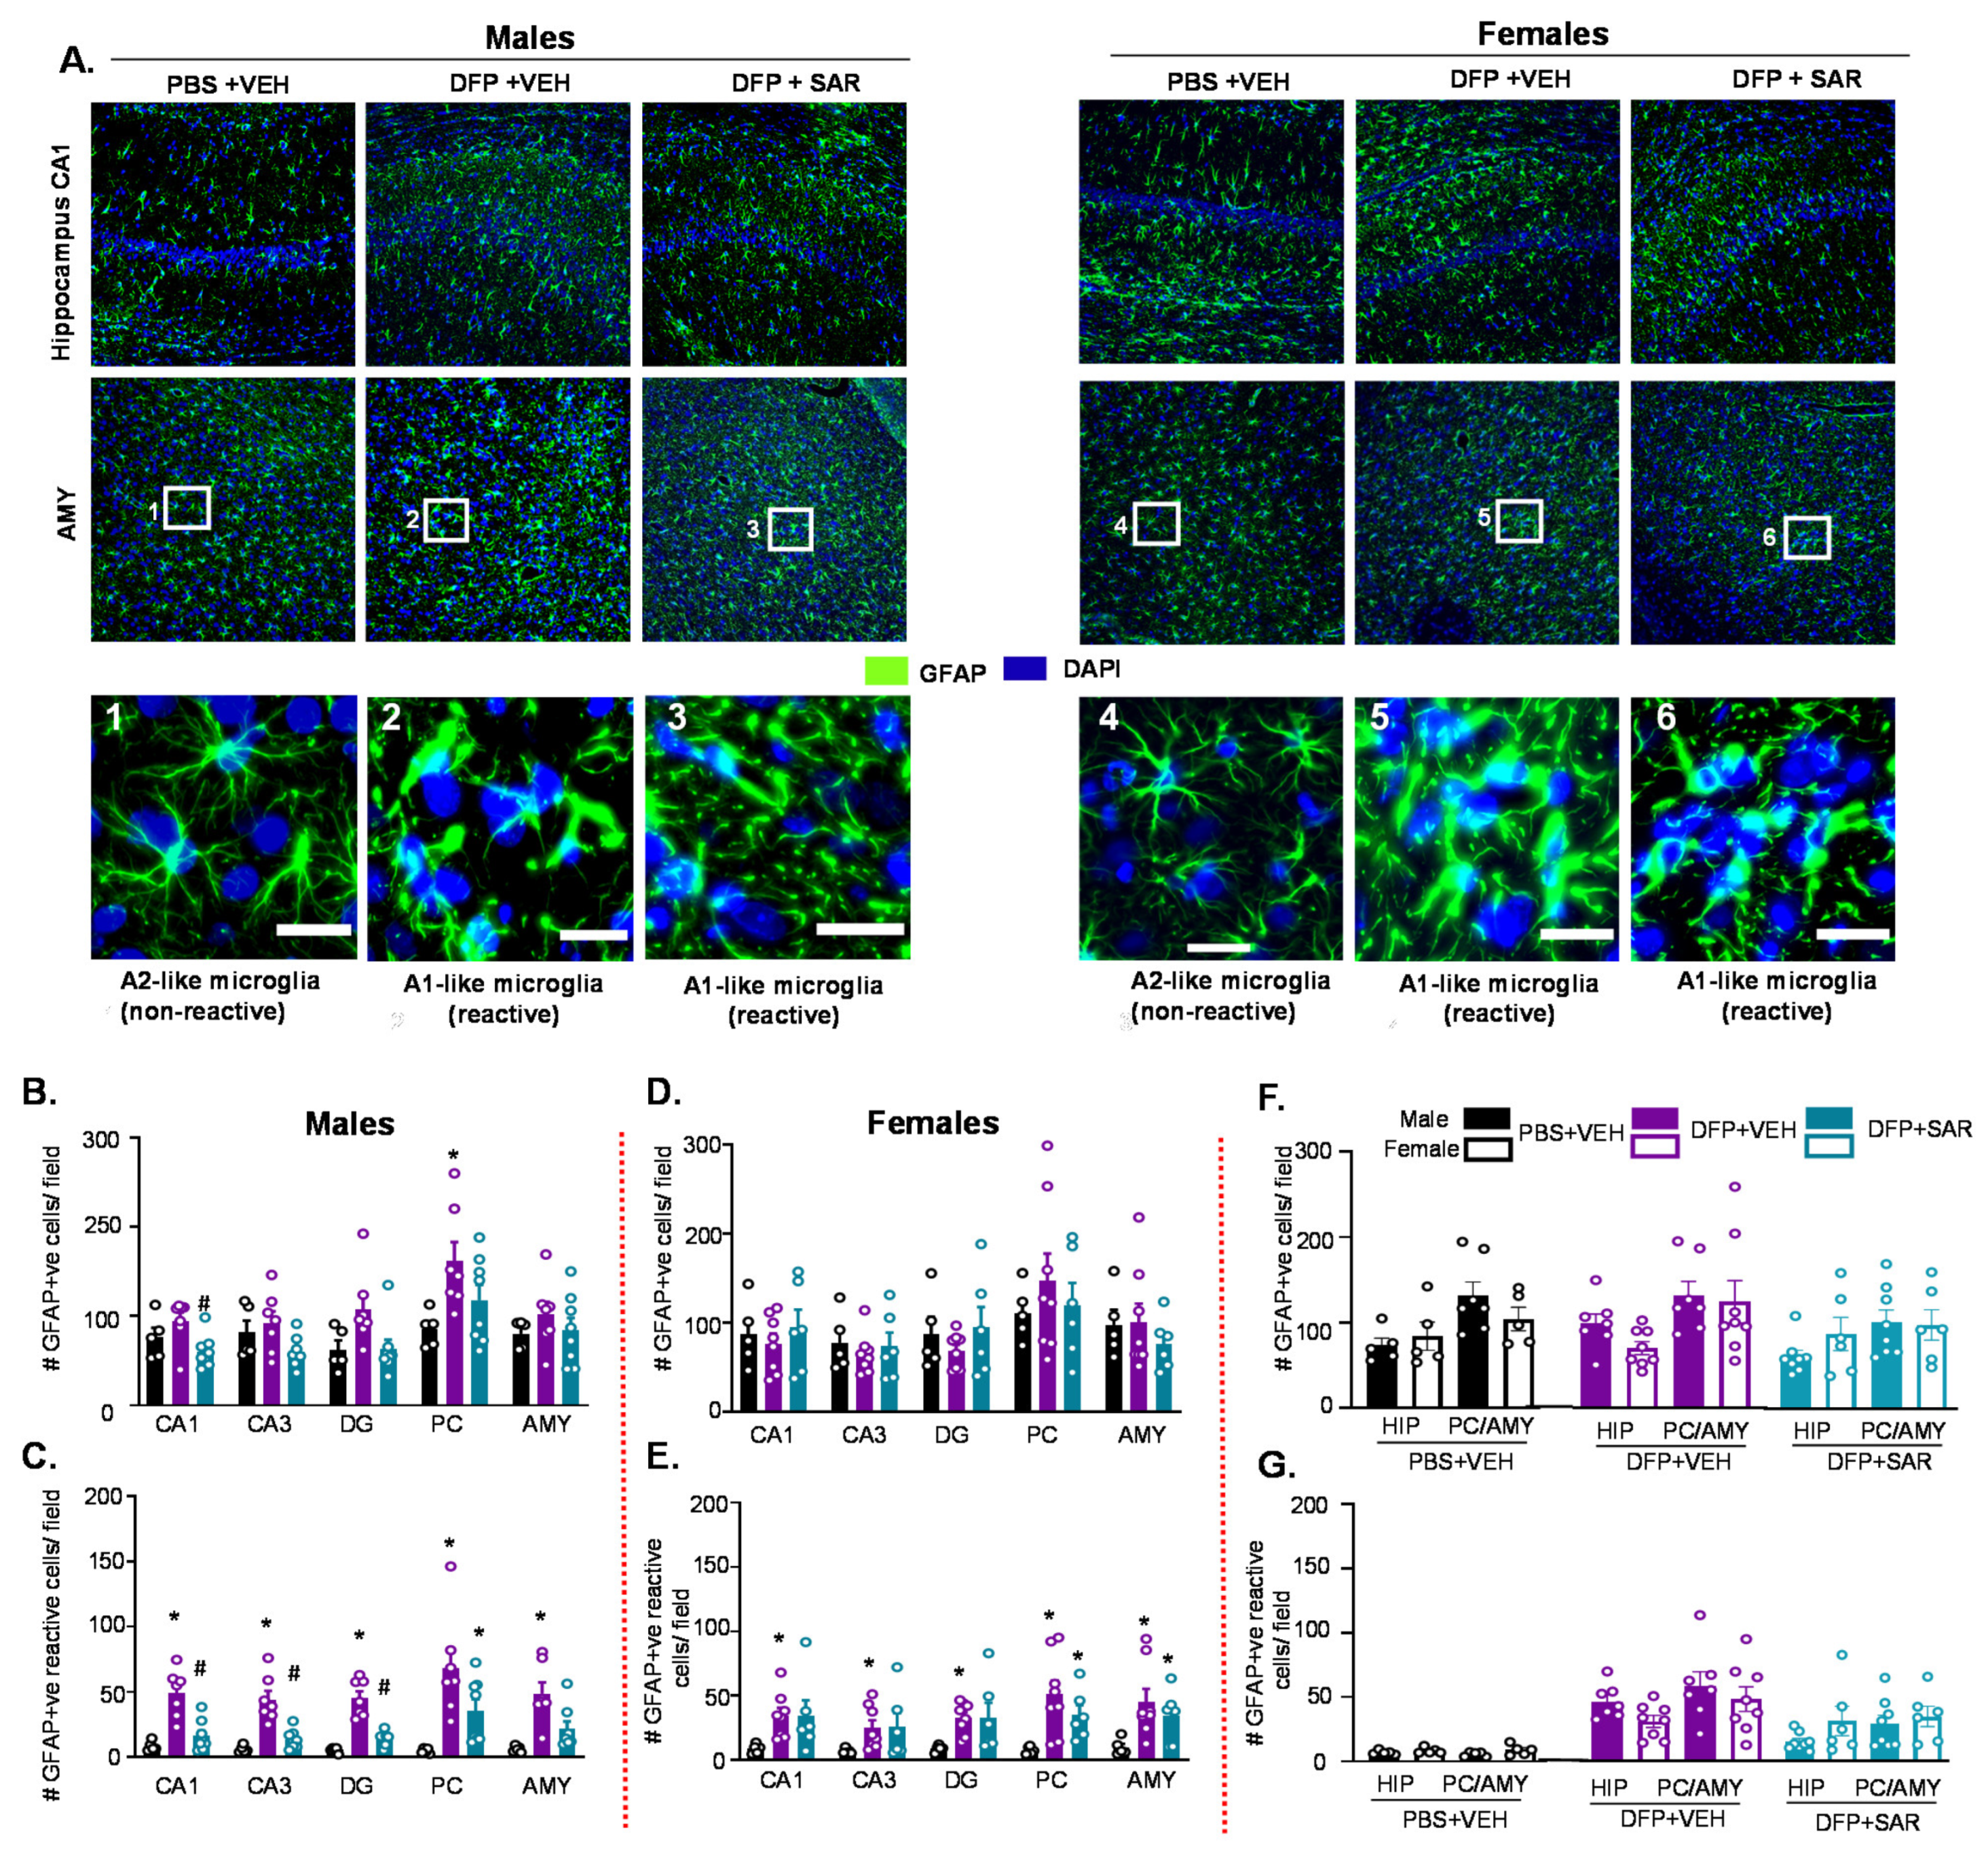
3.2. Impact of DFP Toxicity and SAR Treatment on Short-Term (8 Days) Gliosis and Neurodegeneration
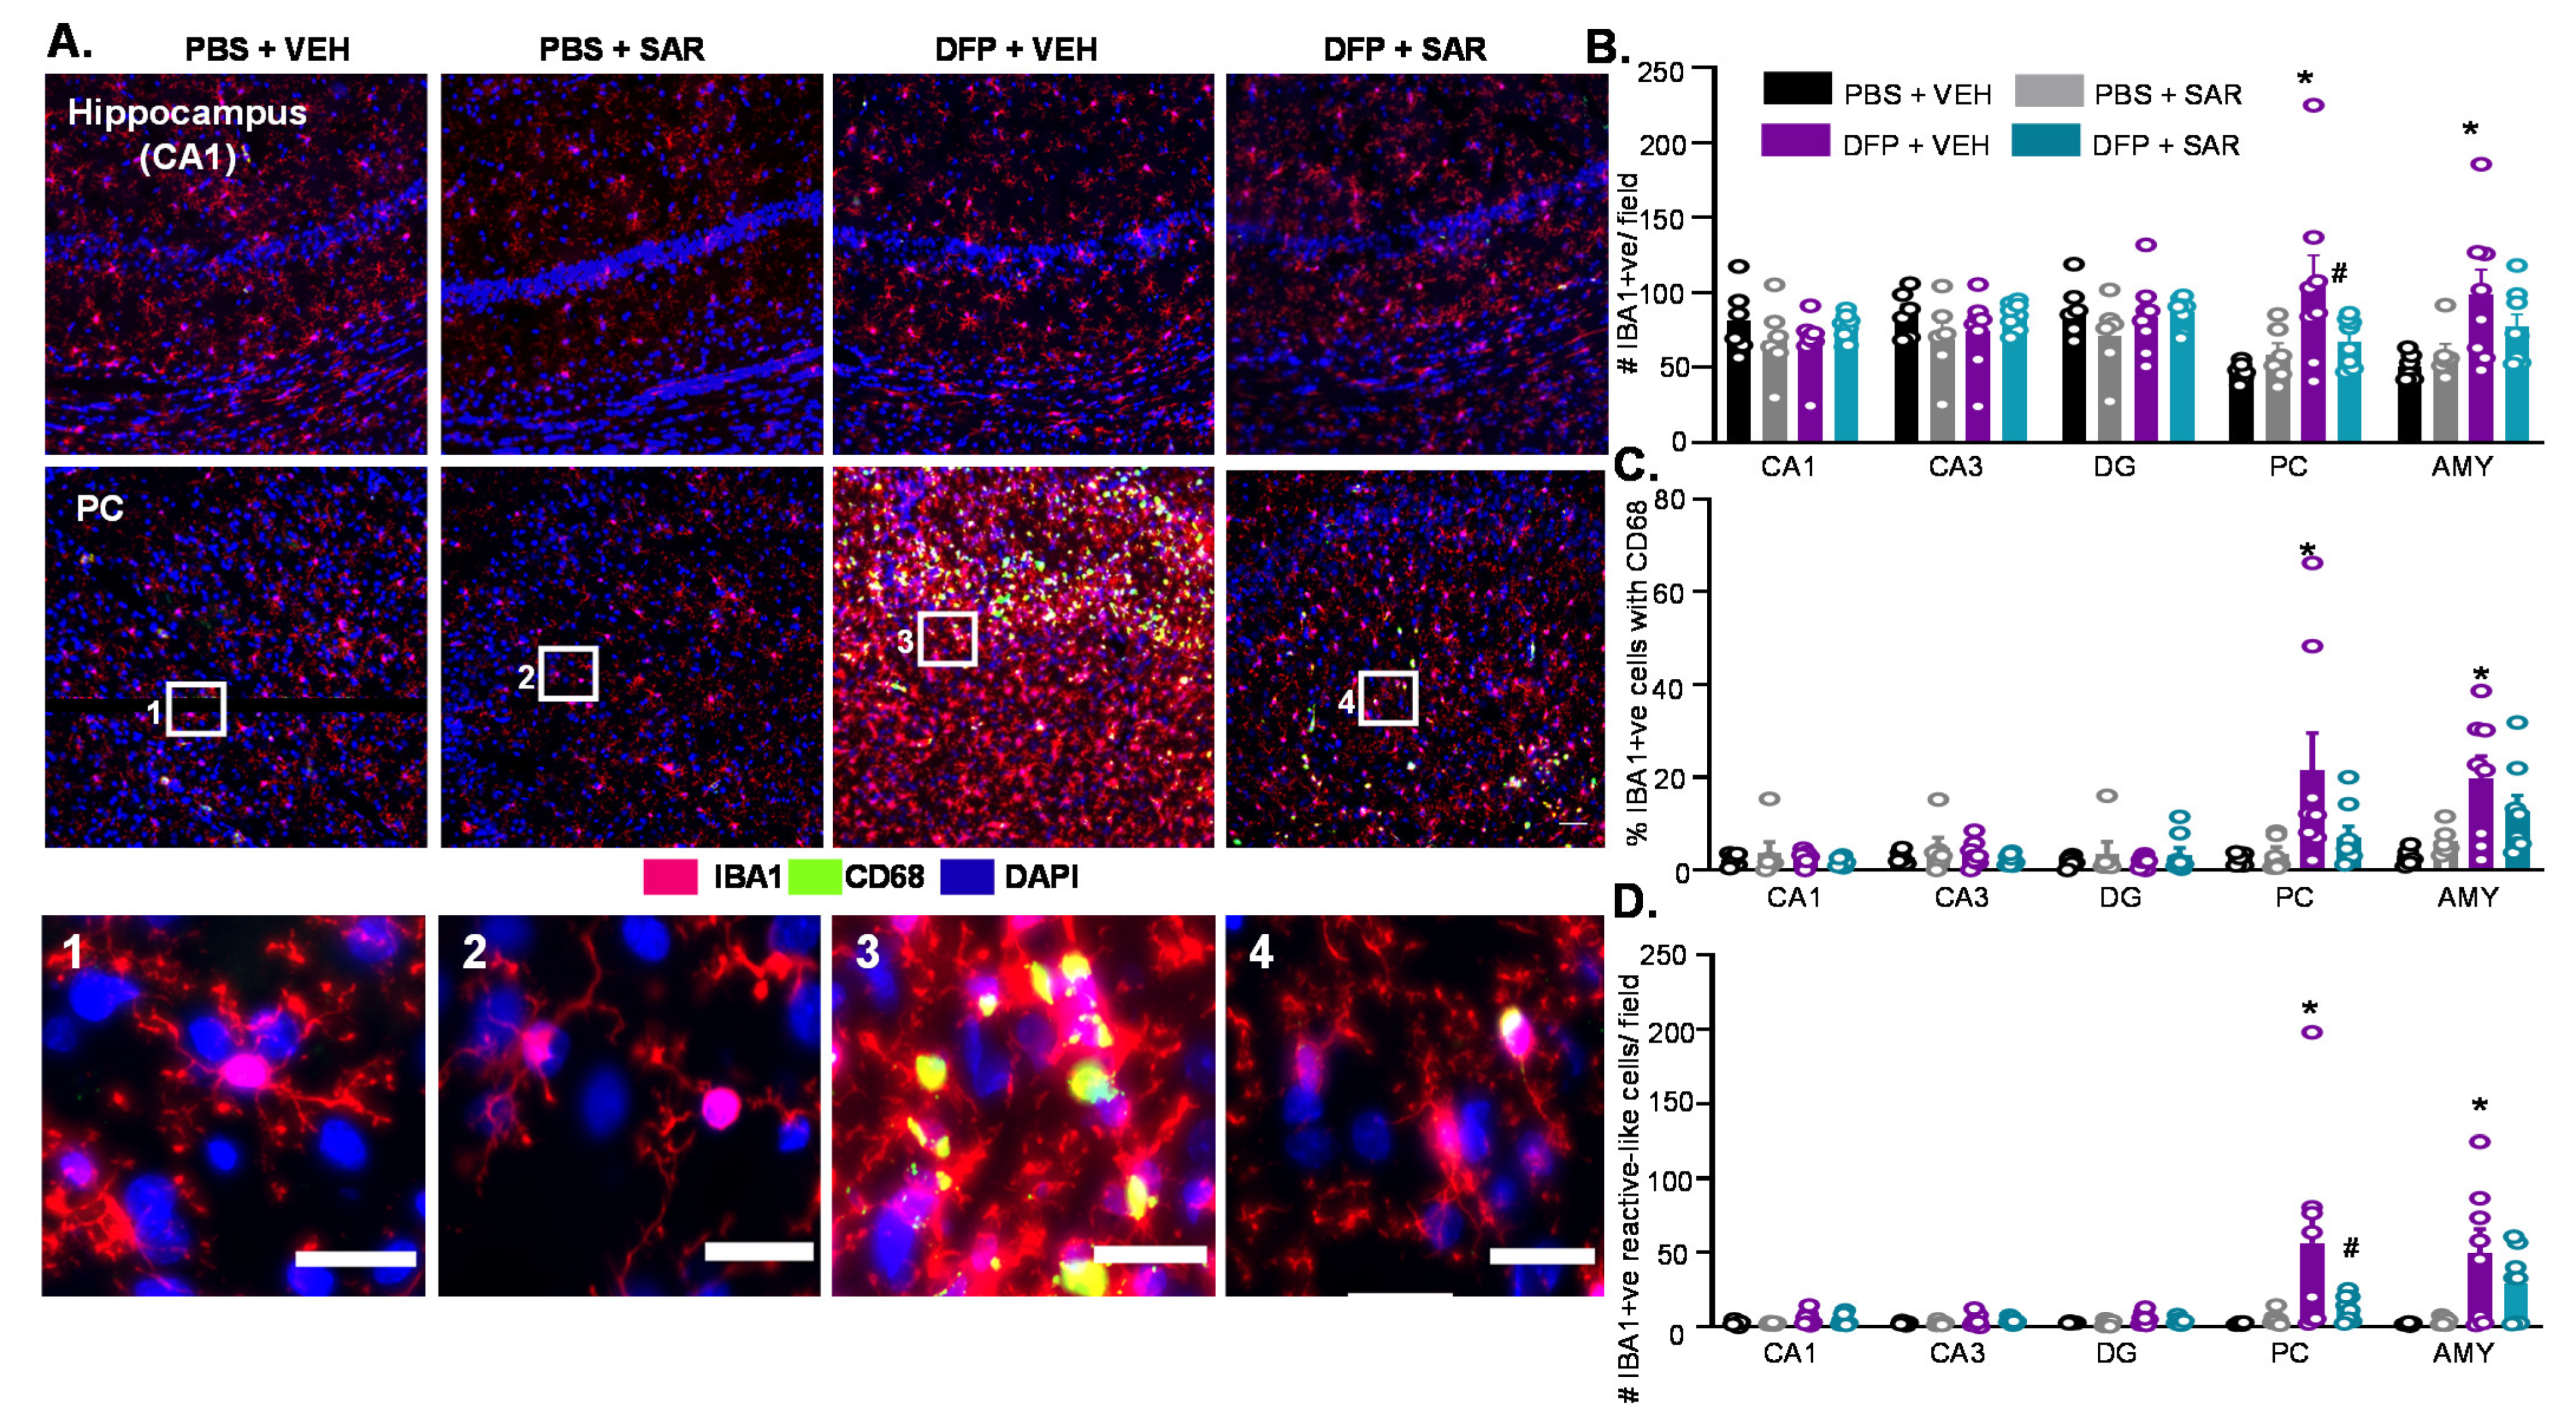
3.2.1. Microgliosis
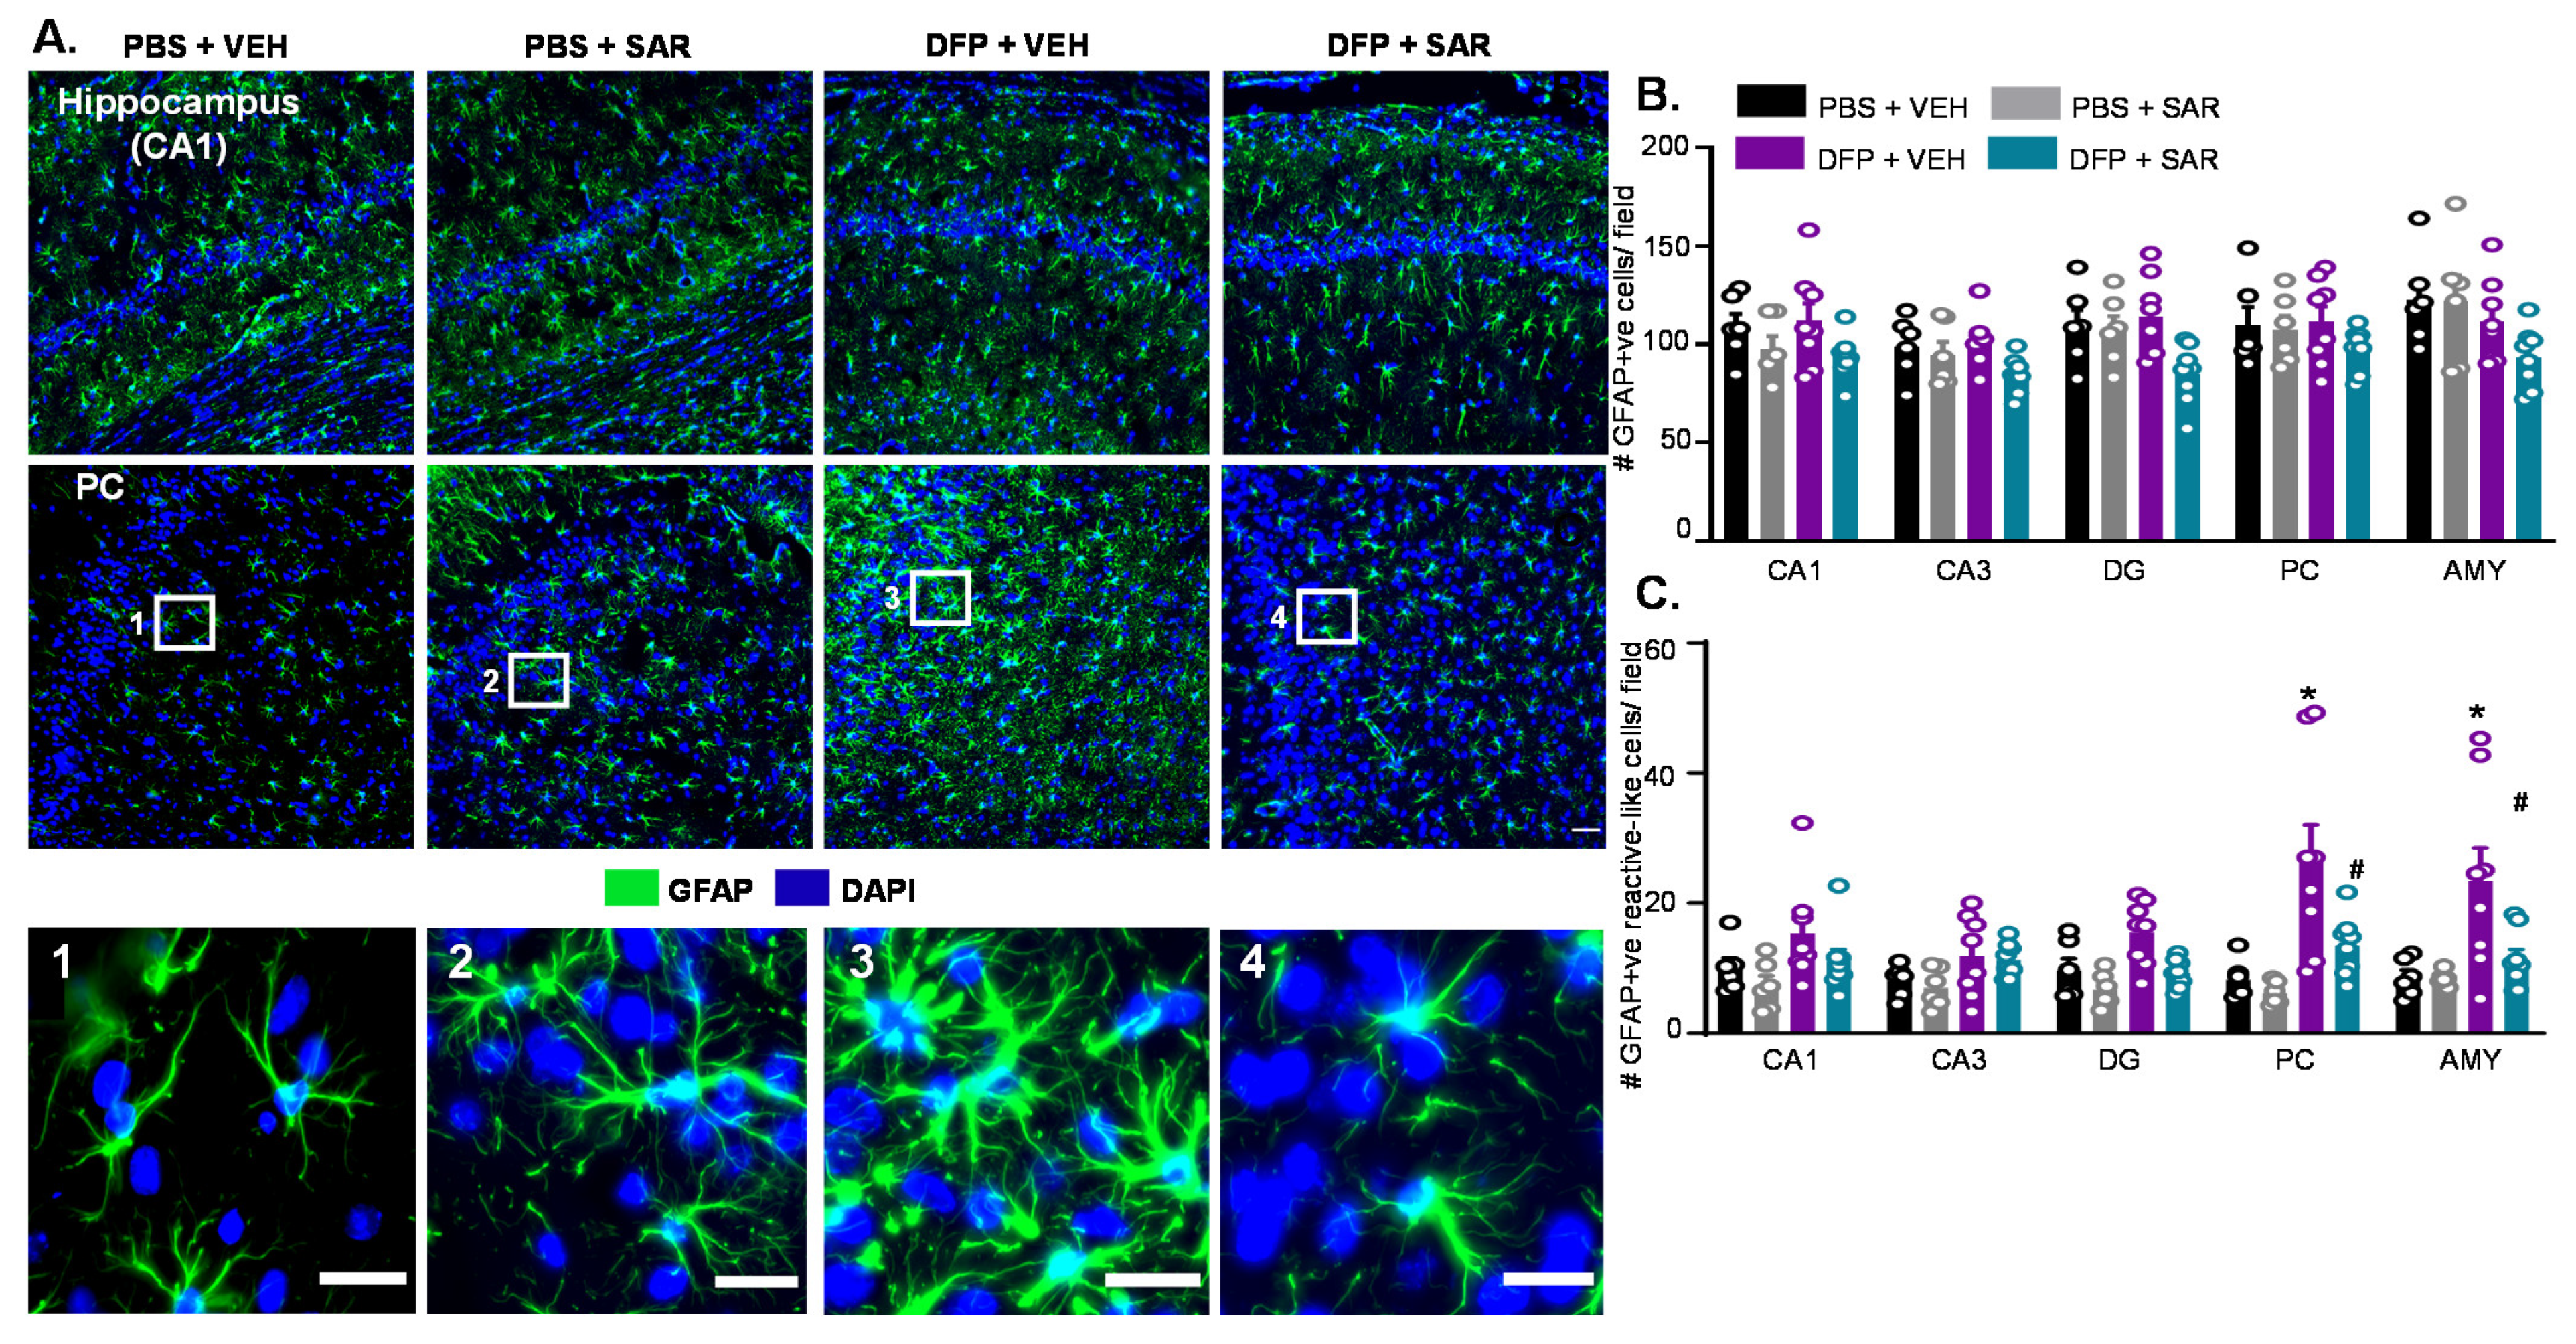
3.2.2. Astrogliosis
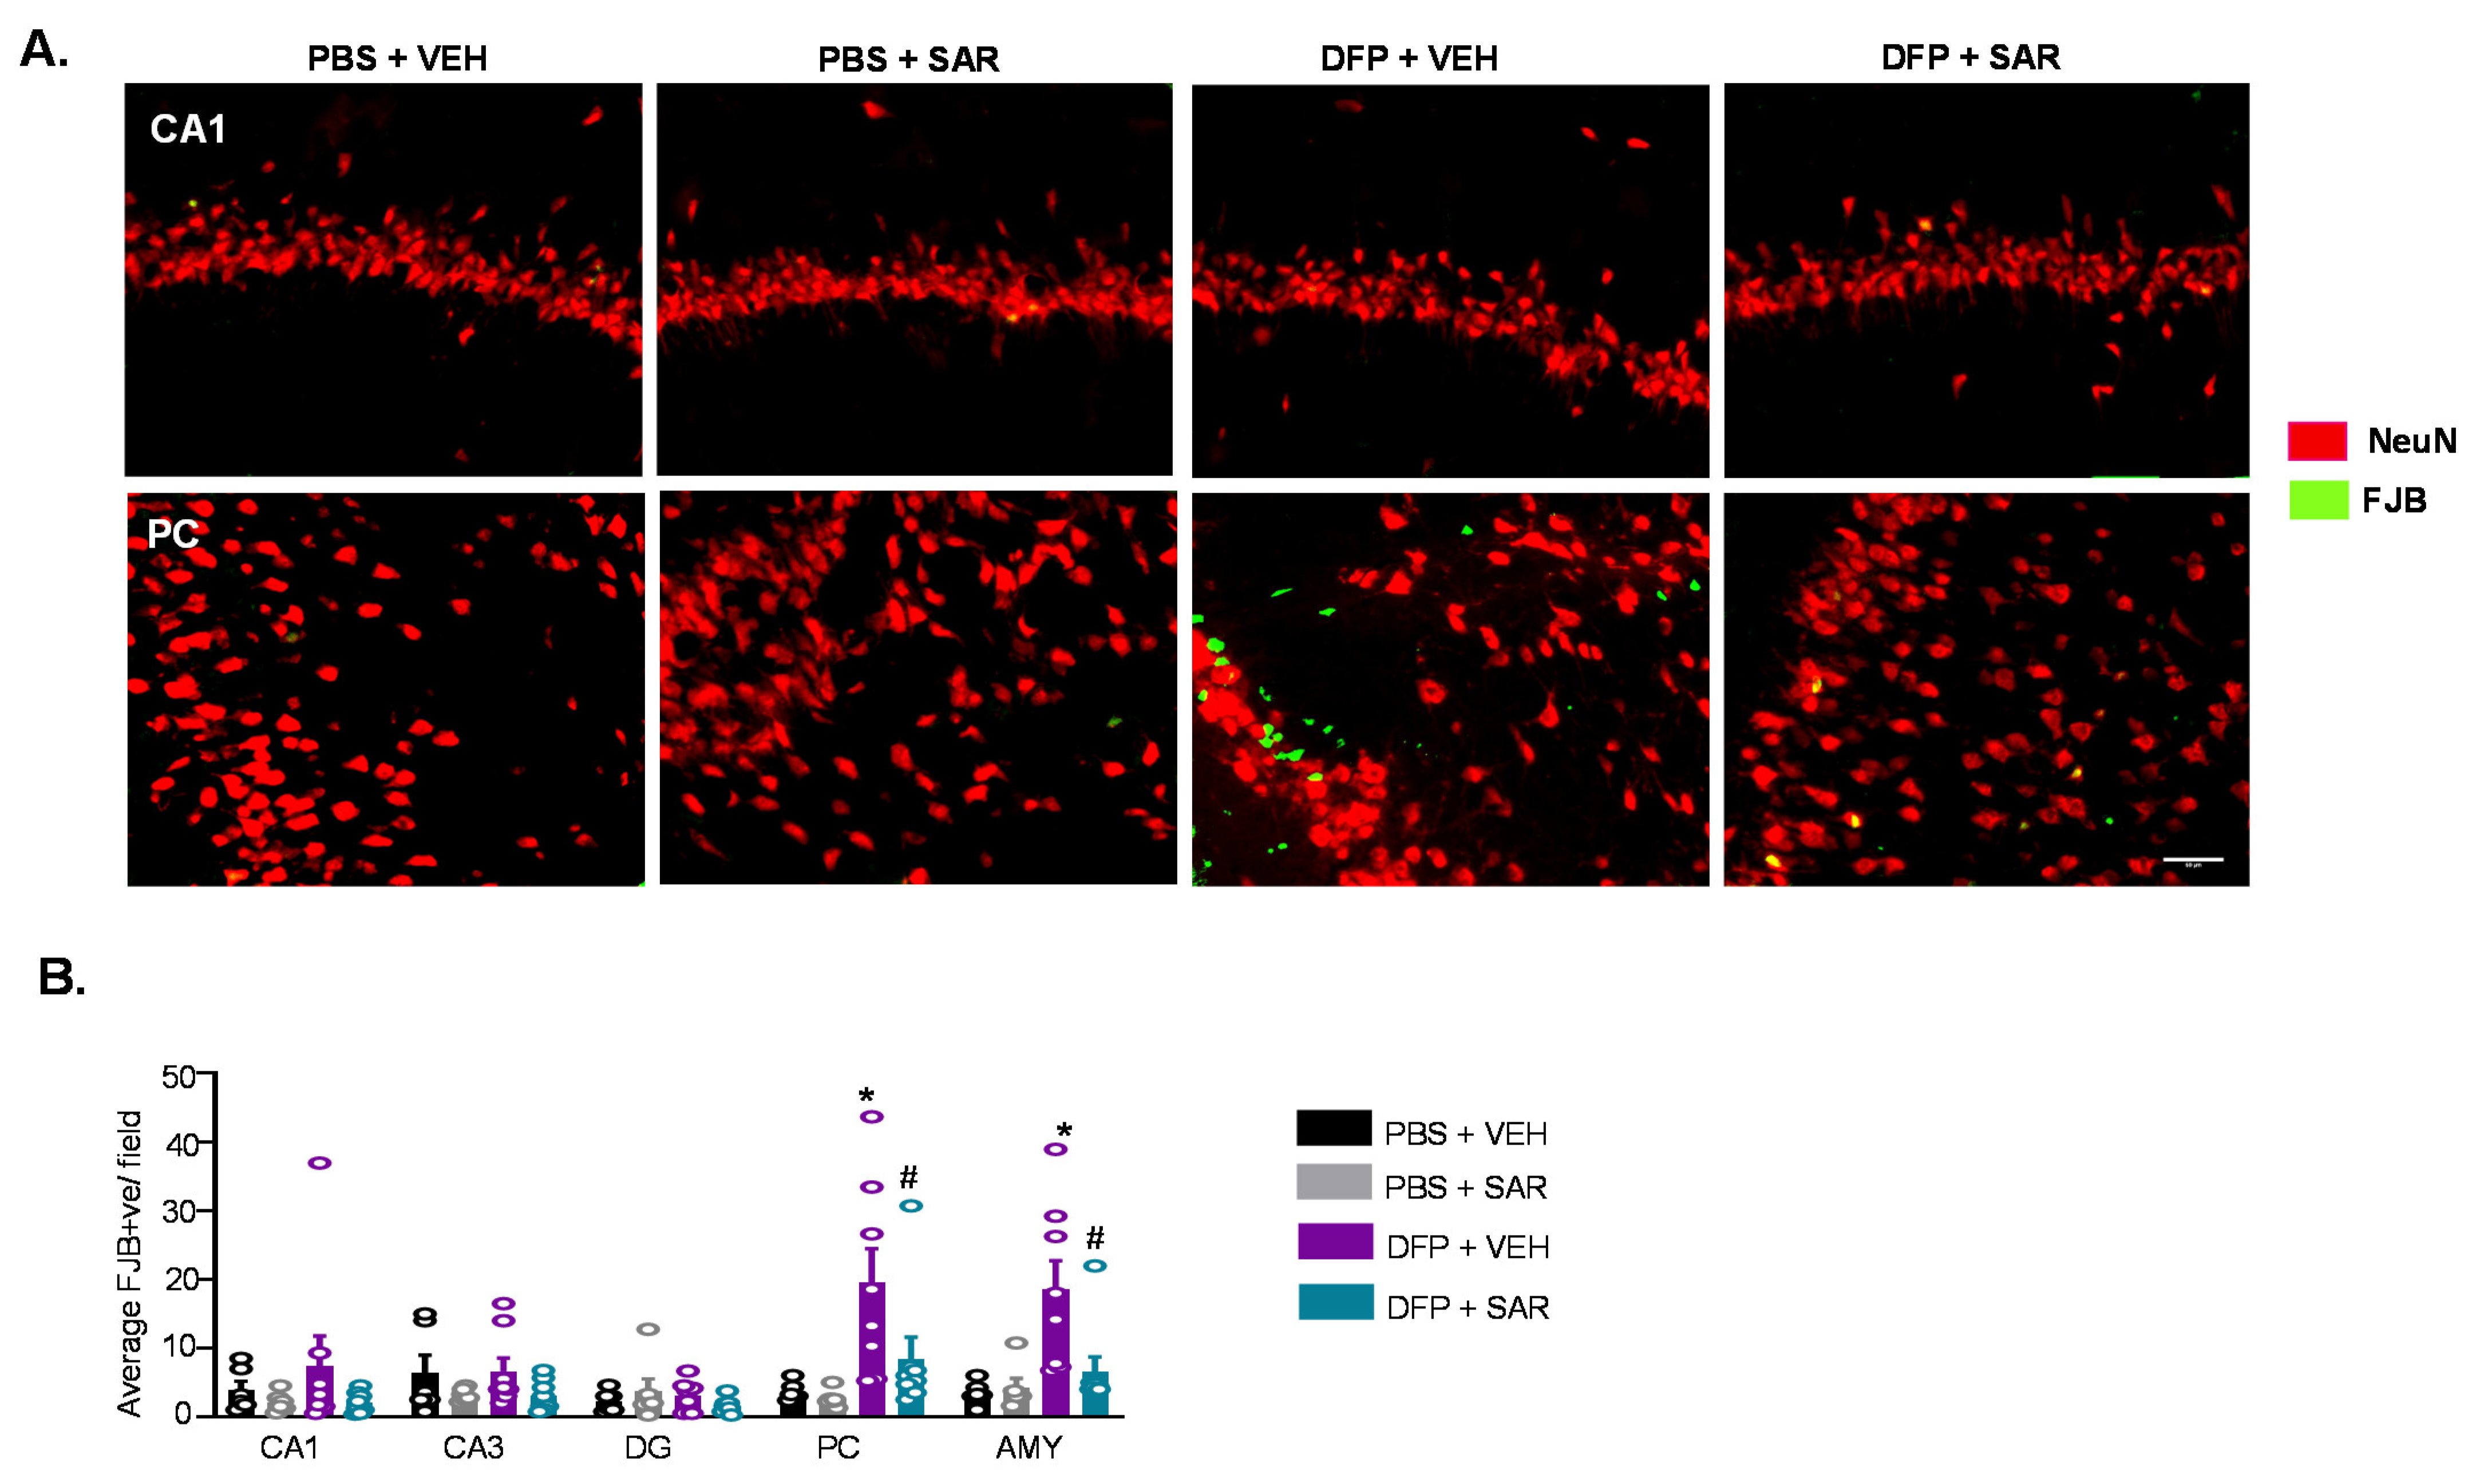
3.2.3. Neurodegeneration
3.3. DFP and SAR Effects in Animals with ~20 min of Continuous CS (SE): Weight Loss, Mortality, SRS, and Morbidity
3.4. Impact of DFP and SAR on Behavioral Comorbidities
3.4.1. Impact of DFP and SAR on Learning and Memory
3.4.2. Impact of DFP and SAR on Anxiety, Depression and Motor Activity
3.5. Long Term Impact of DFP and Mitigation by SAR on Gliosis and Neurodegeneration in Animals with ~20 min of Continuous CS during SE
3.5.1. Microgliosis
3.5.2. Astrogliosis
3.5.3. Neurodegeneration
3.6. SAR Mitigates DFP-Induced Toxicity as an Antioxidant
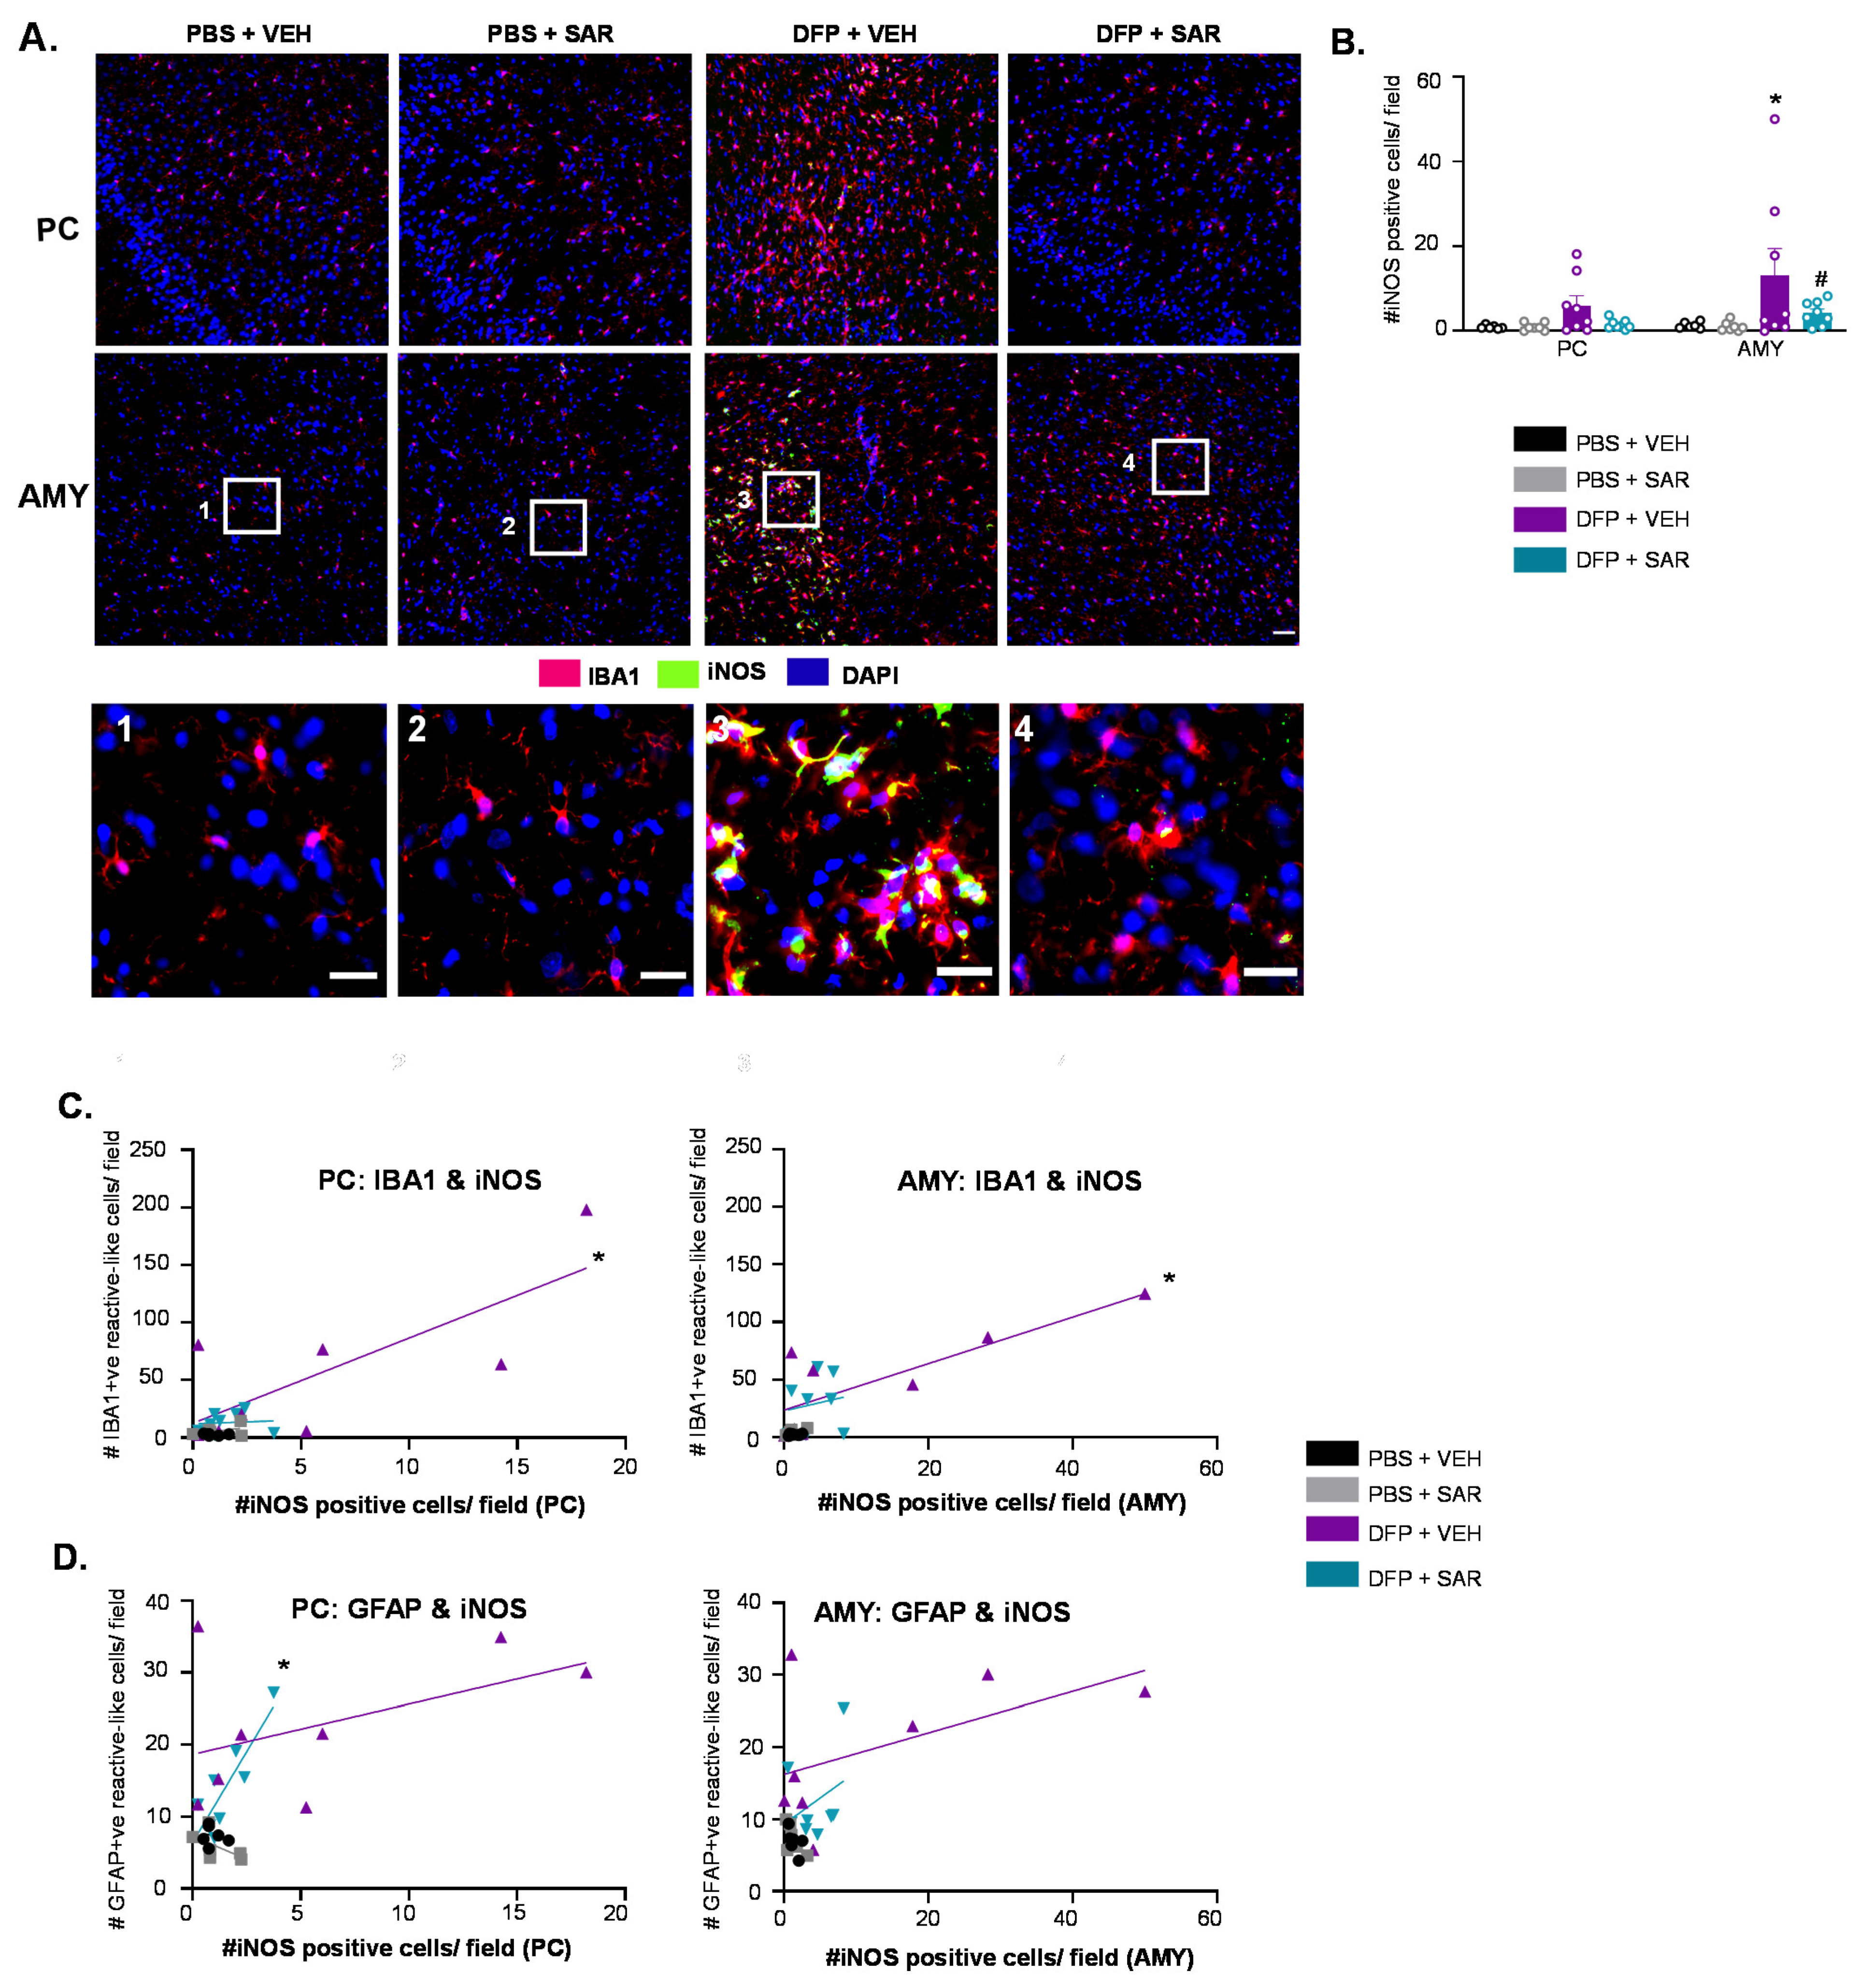
3.6.1. SAR Mitigates DFP-Induced iNOS
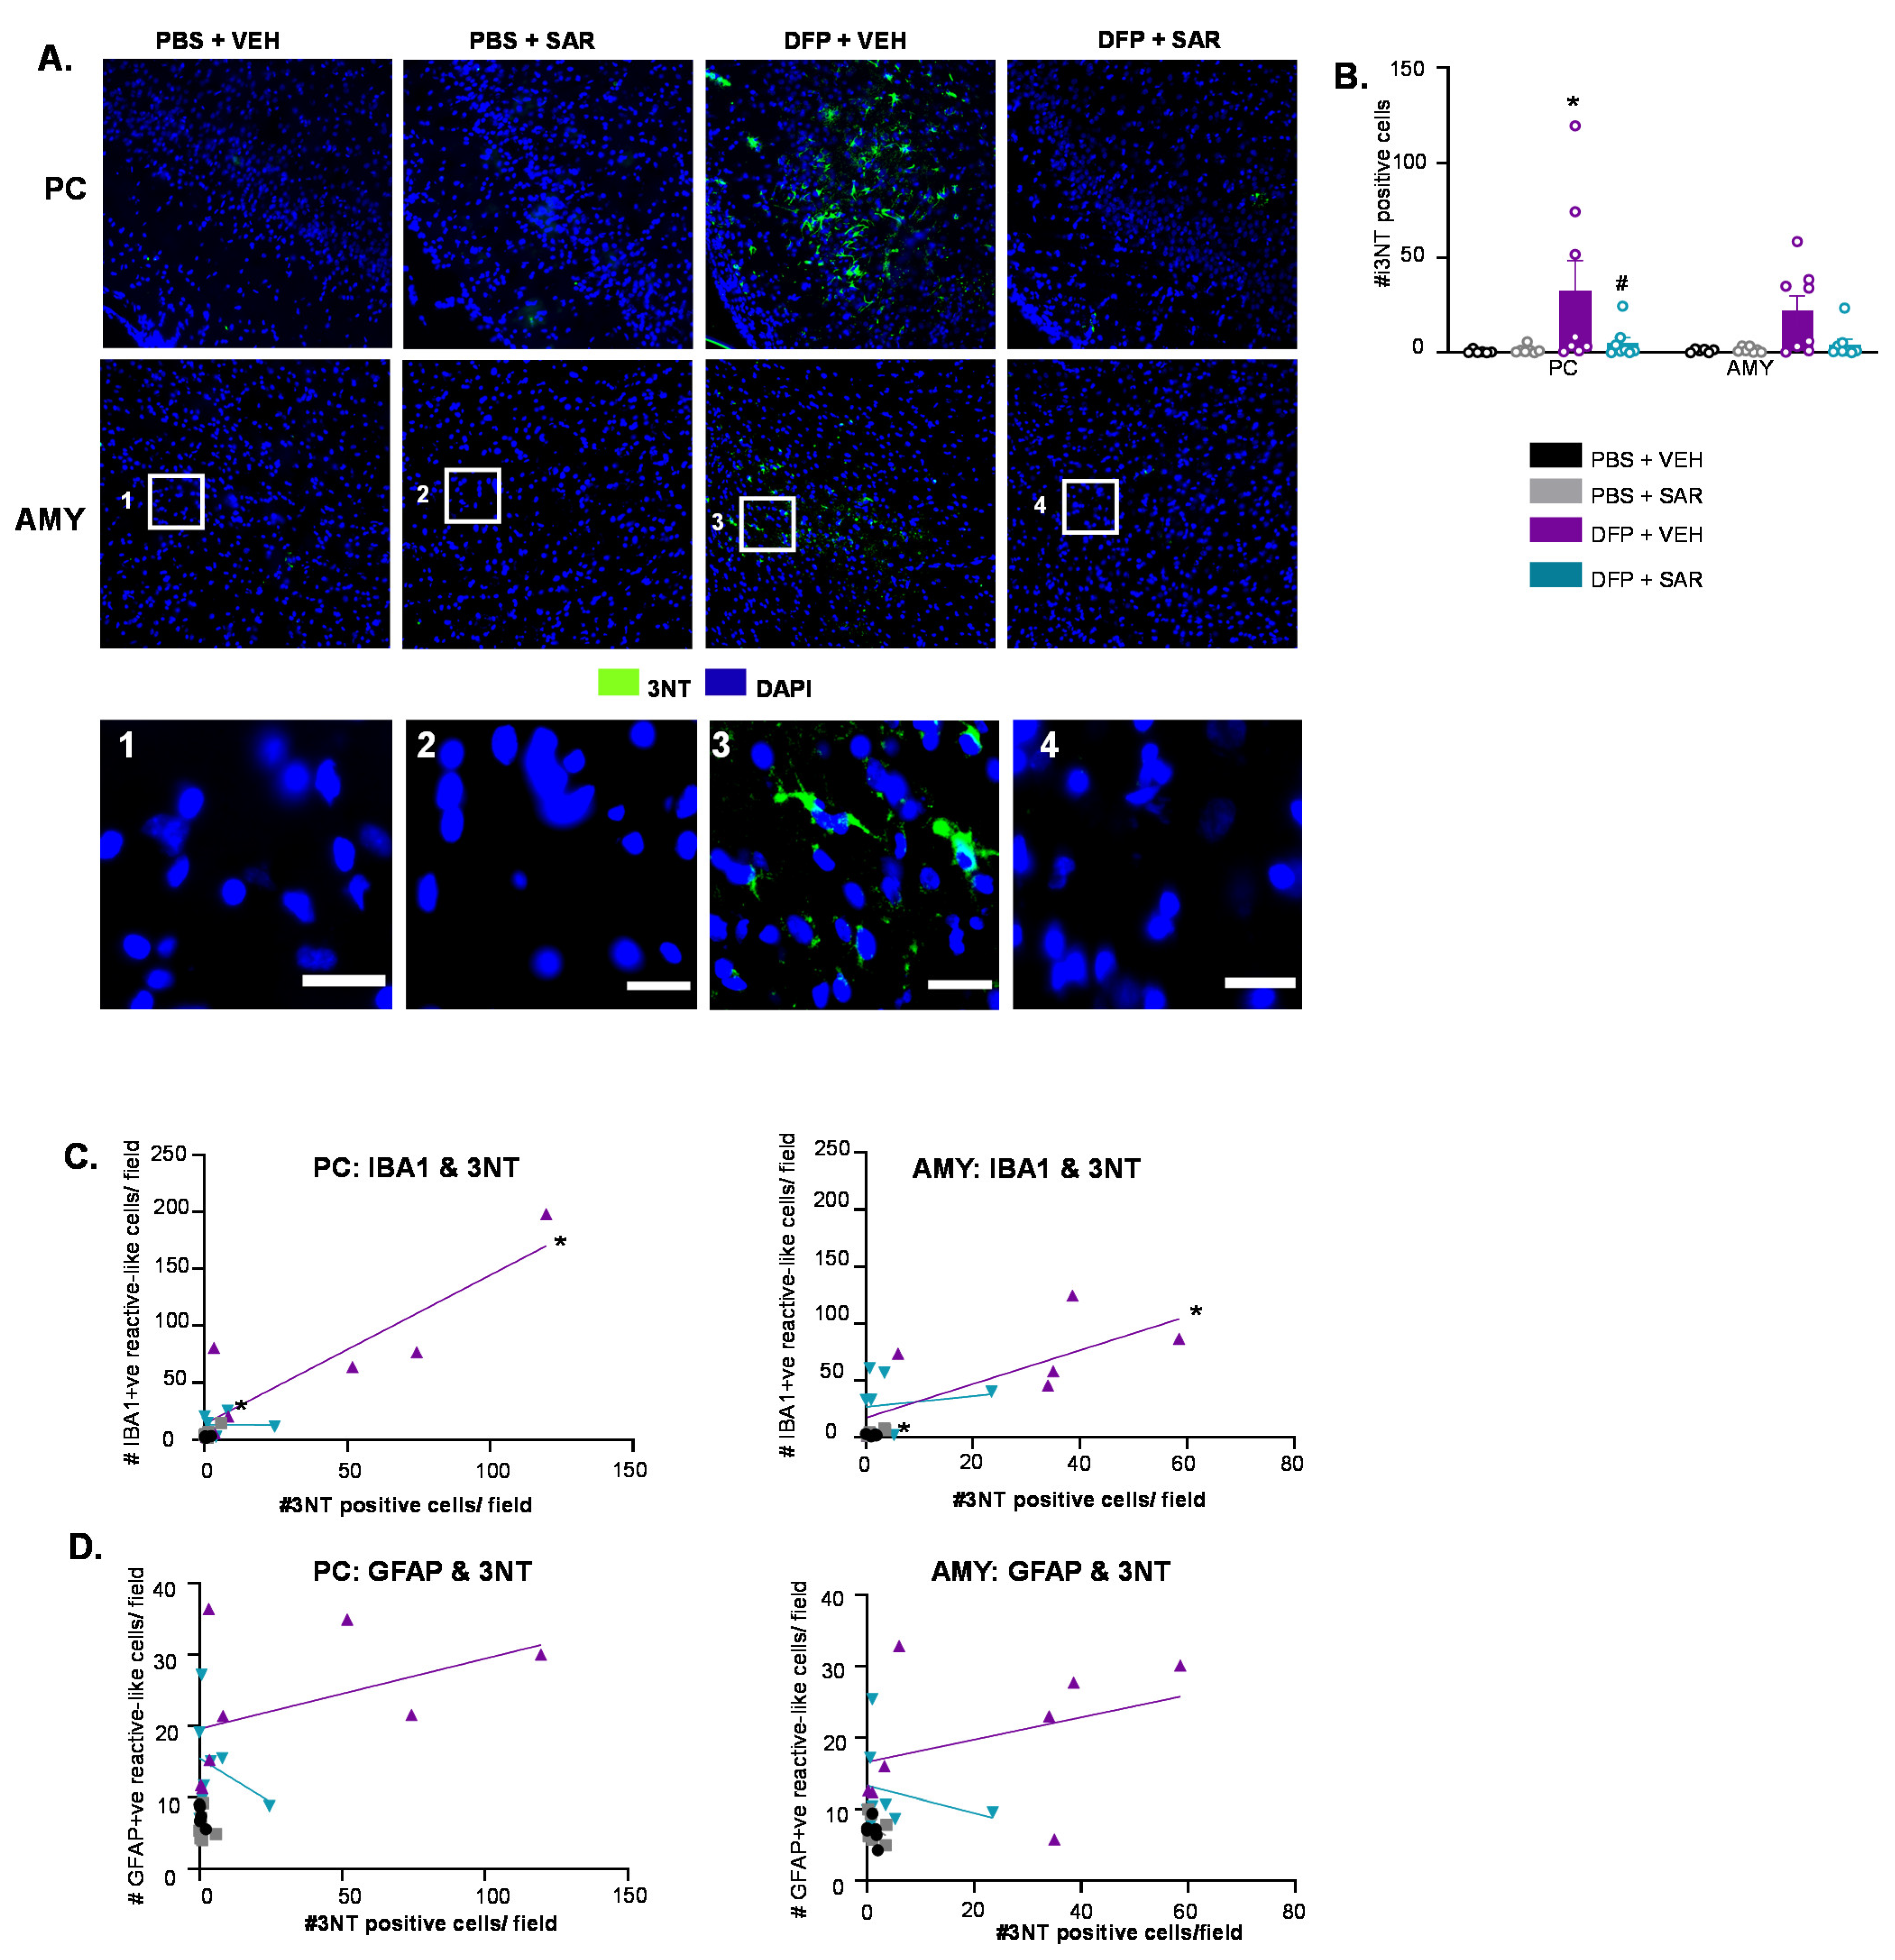
3.6.2. SAR Mitigates DFP-Induced 3NT
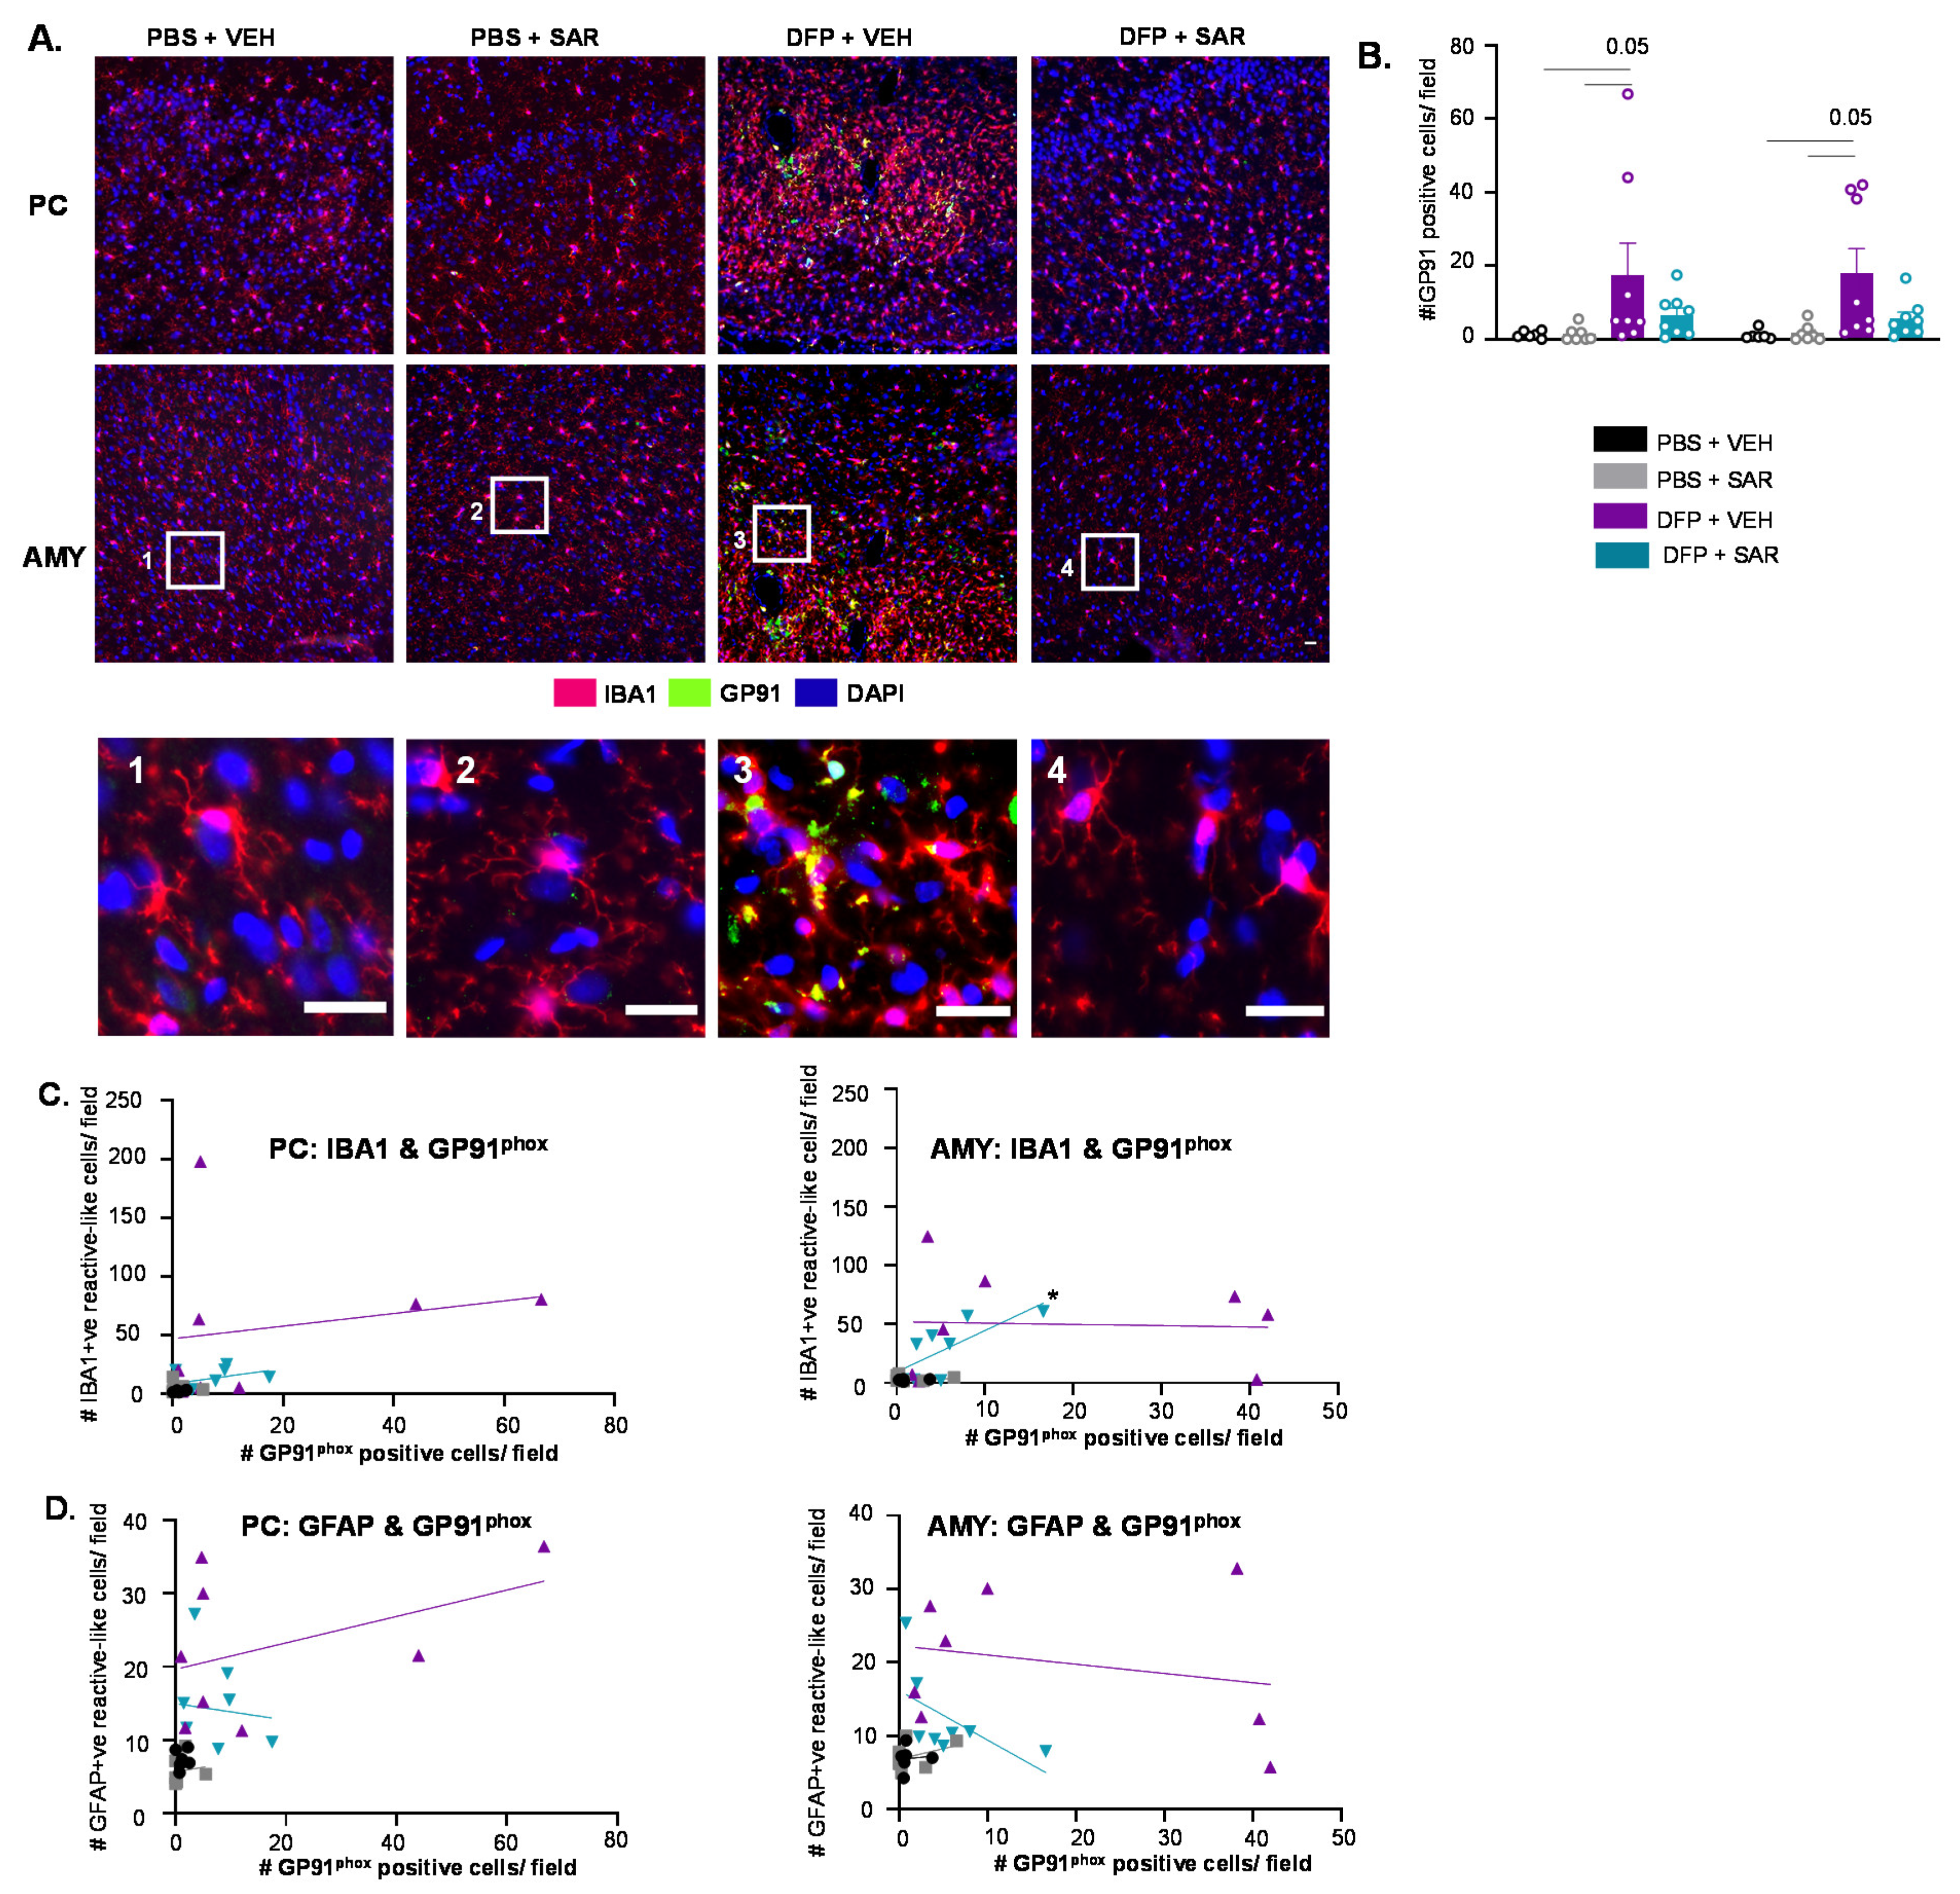
3.6.3. Impact of DFP and SAR on GP91phox
4. Discussion
5. Conclusions
Supplementary Materials
Author Contributions
Funding
Institutional Review Board Statement
Informed Consent Statement
Data Availability Statement
Acknowledgments
Conflicts of Interest
References
- Newmark, J. Nerve agents. In Clinical Neurotoxicology: Syndromes, Substances, Environments; Elsevier Inc.: Amsterdam, The Netherlands, 2009; pp. 646–659. ISBN 9780323052603. [Google Scholar]
- Richardson, J.R.; Fitsanakis, V.; Westerink, R.H.S.; Kanthasamy, A.G. Neurotoxicity of pesticides. Acta Neuropathol. 2019, 138, 343–362. [Google Scholar] [CrossRef] [PubMed]
- Yanagisawa, N.; Morita, H.; Nakajima, T. Sarin experiences in Japan: Acute toxicity and long-term effects. J. Neurol. Sci. 2006, 249, 76–85. [Google Scholar] [CrossRef]
- Sidell, F.R.; Borak, J. Chemical warfare agents: II. Nerve agents. Ann. Emerg. Med. 1992, 21, 865–871. [Google Scholar] [CrossRef]
- Jett, D.A. Neurological aspects of chemical terrorism. Ann. Neurol. 2007, 61, 9–13. [Google Scholar] [CrossRef] [PubMed]
- Coupland, R.; Leins, K.-R. Science and prohibited weapons. Science 2005, 308, 1841. [Google Scholar] [CrossRef] [Green Version]
- Mukherjee, S.; Gupta, R.D. Organophosphorus Nerve Agents: Types, Toxicity, and Treatments. J. Toxicol. 2020, 2020, 1–16. [Google Scholar] [CrossRef]
- Moshiri, M.; Darchini-Maragheh, E.; Balali-Mood, M. Advances in toxicology and medical treatment of chemical warfare nerve agents. DARU J. Pharm. Sci. 2012, 20, 81. [Google Scholar] [CrossRef] [Green Version]
- Robb, E.L.; Baker, M.B. Organophosphate Toxicity; StatPearls Publishing: Treasure Island, FL, USA, 2021. [Google Scholar]
- Sawyer, T. Toxicity of organophosphate nerve agents and related phosphonylated oximes compared to their anticholinesterase activity in neuron cultures. Fundam. Appl. Toxicol. 1991, 17, 208–214. [Google Scholar] [CrossRef]
- Bajgar, J. Organophosphates{plus 45 degree rule}Nerve Agent Poisoning: Mechanism of Action, Diagnosis, Prophylaxis, and Treatment. Adv. Clin. Chem. 2004, 38, 151–216. [Google Scholar]
- Bird, S.B. Cholinergic Toxicity. DeckerMed Med. 2015. [Google Scholar] [CrossRef]
- Senanayake, N. Organophosporous Insecticide Poisoning. Electron. J. Int. Fed. Clin. Chem. Lab. 1999, 11, 30. [Google Scholar]
- Eddleston, M.; Buckley, N.A.; Eyer, P.; Dawson, A.H. Management of acute organophosphorus pesticide poisoning. Lancet 2008, 371, 597–607. [Google Scholar] [CrossRef] [Green Version]
- McDonough, J.H.; Shih, T.-M. Neuropharmacological Mechanisms of Nerve Agent-induced Seizure and Neuropathology. Neurosci. Biobehav. Rev. 1997, 21, 559–579. [Google Scholar] [CrossRef]
- Shih, T.-M.; Rowland, T.C.; McDonough, J.H. Anticonvulsants for nerve agent-induced seizures: The influence of the therapeutic dose of atropine. J. Pharmacol. Exp. Ther. 2007, 320, 154–161. [Google Scholar] [CrossRef] [Green Version]
- Seinfeld, S.; Goodkin, H.P.; Shinnar, S. Status epilepticus. Cold Spring Harb. Perspect. Med. 2016, 6, a022830. [Google Scholar] [CrossRef] [PubMed]
- Seidenberg, M.; Pulsipher, D.T.; Hermann, B. Association of epilepsy and comorbid conditions. Future Neurol. 2009, 4, 663–668. [Google Scholar] [CrossRef] [PubMed] [Green Version]
- Aroniadou-Anderjaska, V.; Figueiredo, T.H.; Apland, J.P.; Prager, E.M.; Pidoplichko, V.I.; Miller, S.L.; Braga, M.F.M. Long-term neuropathological and behavioral impairments after exposure to nerve agents. Ann. N. Y. Acad. Sci. 2016, 1374, 17–28. [Google Scholar] [CrossRef]
- Guignet, M.; Dhakal, K.; Flannery, B.M.; Hobson, B.A.; Zolkowska, D.; Dhir, A.; Bruun, D.A.; Li, S.; Wahab, A.; Harvey, D.J.; et al. Persistent behavior deficits, neuroinflammation, and oxidative stress in a rat model of acute organophosphate intoxication. Neurobiol. Dis. 2019, 133, 104431. [Google Scholar] [CrossRef] [PubMed]
- Hermann, B.; Seidenberg, M. Epilepsy and Cognition. Epilepsy Curr. 2007, 7, 1–6. [Google Scholar] [CrossRef]
- Puttachary, S.; Sharma, S.; Stark, S.; Thippeswamy, T. Seizure-induced oxidative stress in temporal lobe epilepsy. Biomed Res. Int. 2015, 2015, 745613. [Google Scholar] [CrossRef]
- Losi, G.; Cammarota, M.; Carmignoto, G. The Role of Astroglia in the Epileptic Brain. Front. Pharmacol. 2012, 3, 132. [Google Scholar] [CrossRef] [Green Version]
- Rana, A.; Musto, A.E. The role of inflammation in the development of epilepsy. J. Neuroinflamm. 2018, 15, 1–12. [Google Scholar] [CrossRef]
- Farrell, J.S.; Wolff, M.D.; Teskey, G.C. Neurodegeneration and Pathology in Epilepsy: Clinical and Basic Perspectives. Neurodegener. Dis. 2017, 15, 317–334. [Google Scholar]
- Gage, M.; Golden, M.; Putra, M.; Sharma, S.; Thippeswamy, T. Sex as a biological variable in the rat model of diisopropylfluorophosphate-induced long-term neurotoxicity. Ann. N. Y. Acad. Sci. 2020, 1479, 44–64. [Google Scholar] [CrossRef]
- Putra, M.; Gage, M.; Sharma, S.; Gardner, C.; Gasser, G.; Anantharam, V.; Thippeswamy, T. Diapocynin, an NADPH oxidase inhibitor, counteracts diisopropylfluorophosphate-induced long-term neurotoxicity in the rat model. Ann. N. Y. Acad. Sci. 2020, 1479, 75. [Google Scholar] [CrossRef] [PubMed]
- Putra, M.; Sharma, S.; Gage, M.; Gasser, G.; Hinojo-Perez, A.; Olson, A.; Gregory-Flores, A.; Puttachary, S.; Wang, C.; Anantharam, V.; et al. Inducible nitric oxide synthase inhibitor, 1400 W, mitigates DFP-induced long-term neurotoxicity in the rat model. Neurobiol. Dis. 2019, 133, 104443. [Google Scholar] [CrossRef] [PubMed]
- Rojas, A.; Wang, W.; Glover, A.; Manji, Z.; Fu, Y.; Dingledine, R. Beneficial Outcome of Urethane Treatment Following Status Epilepticus in a Rat Organophosphorus Toxicity Model. eNeuro 2018, 5. [Google Scholar] [CrossRef] [PubMed]
- Kuruba, R.; Wu, X.; Reddy, D.S. Benzodiazepine-refractory status epilepticus, neuroinflammation, and interneuron neurodegeneration after acute organophosphate intoxication. Biochim. Biophys. Acta Mol. Basis Dis. 2018, 1864, 2845–2858. [Google Scholar] [CrossRef] [PubMed]
- Flannery, B.M.; Bruun, D.A.; Rowland, D.J.; Banks, C.N.; Austin, A.T.; Kukis, D.L.; Li, Y.; Ford, B.D.; Tancredi, D.J.; Silverman, J.L.; et al. Persistent neuroinflammation and cognitive impairment in a rat model of acute diisopropylfluorophosphate intoxication. J. Neuroinflamm. 2016, 13, 267. [Google Scholar] [CrossRef] [PubMed] [Green Version]
- Deshpande, L.S.; Carter, D.S.; Blair, R.E.; DeLorenzo, R.J. Development of a Prolonged Calcium Plateau in Hippocampal Neurons in Rats Surviving Status Epilepticus Induced by the Organophosphate Diisopropylfluorophosphate. Toxicol. Sci. 2010, 116, 623–631. [Google Scholar] [CrossRef] [Green Version]
- Eddleston, M.; Szinicz, L.; Eyer, P.; Buckley, N. Oximes in acute organophosphorus pesticide poisoning: A systematic review of clinical trials. QJM 2002, 95, 275–283. [Google Scholar] [CrossRef] [Green Version]
- Eddleston, M.; Singh, S.; Buckley, N. Organophosphorus poisoning (acute). BMJ Clin. Evid. 2007, 2007, 2102. [Google Scholar]
- Eyer, P. The role of oximes in the management of organophosphorus pesticide poisoning. Toxicol. Rev. 2003, 22, 165–190. [Google Scholar] [CrossRef]
- Garcia, G.E.; Campbell, A.J.; Olson, J.; Moorad-Doctor, D.; Morthole, V.I. Novel oximes as blood-brain barrier penetrating cholinesterase reactivators. Chem. Biol. Interact. 2010, 187, 199–206. [Google Scholar] [CrossRef] [PubMed]
- Melchers, B.P.C.; Philippens, I.H.; Wolthuis, O.L. Efficacy of HI-6 and HLö-7 in preventing incapacitation following nerve agent poisoning. Pharmacol. Biochem. Behav. 1994, 49, 781–788. [Google Scholar] [CrossRef]
- Wu, X.; Kuruba, R.; Reddy, D.S. Midazolam-Resistant Seizures and Brain Injury after Acute Intoxication of Diisopropylfluorophosphate, an Organophosphate Pesticide and Surrogate for Nerve Agents. J. Pharmacol. Exp. Ther. 2018, 367, 302–321. [Google Scholar] [CrossRef] [Green Version]
- Miller, S.A.; Blick, D.W.; Kerenyi, S.Z.; Murphy, M.R. Efficacy of physostigmine as a pretreatment for organophosphate poisoning. Pharmacol. Biochem. Behav. 1993, 44, 343–347. [Google Scholar] [CrossRef]
- Albuquerque, E.X.; Pereira, E.F.R.; Aracava, Y.; Fawcett, W.P.; Oliveira, M.; Randall, W.R.; Hamilton, T.A.; Kan, R.K.; Romano, J.A.; Adler, M. Effective countermeasure against poisoning by organophosphorus insecticides and nerve agents. Proc. Natl. Acad. Sci. USA 2006, 103, 13220–13225. [Google Scholar] [CrossRef] [PubMed] [Green Version]
- Bruun, D.A.; Guignet, M.; Harvey, D.J.; Lein, P.J. Pretreatment with pyridostigmine bromide has no effect on seizure behavior or 24 hour survival in the rat model of acute diisopropylfluorophosphate intoxication. Neurotoxicology 2019, 73, 81–84. [Google Scholar] [CrossRef]
- Gilhus, N.E.; Deuschl, G. Neuroinflammation—A common thread in neurological disorders. Nat. Rev. Neurol. 2019, 15, 429–430. [Google Scholar] [CrossRef]
- Vitaliti, G.; Pavone, P.; Mahmood, F.; Nunnari, G.; Falsaperla, R. Targeting inflammation as a therapeutic strategy for drug-resistant epilepsies: An update of new immune-modulating approaches. Hum. Vaccines Immunother. 2014, 10, 868–875. [Google Scholar] [CrossRef] [Green Version]
- Grant, S. Analysis of NMDA receptor mediated synaptic plasticity using gene targeting: Roles of Fyn and FAK non-receptor tyrosine kinases. J. Physiol. 1996, 90, 337–338. [Google Scholar] [CrossRef]
- Lu, Y.F.; Kojima, N.; Tomizawa, K.; Moriwaki, A.; Matsushita, M.; Obata, K.; Matsui, H. Enhanced synaptic transmission and reduced threshold for LTP induction in fyn-transgenic mice. Eur. J. Neurosci. 1999, 11, 75–82. [Google Scholar] [CrossRef] [PubMed]
- Arnaud, L.; Ballif, B.A.; Förster, E.; Cooper, J.A. Fyn tyrosine kinase is a critical regulator of Disabled-1 during brain development. Curr. Biol. 2003, 13, 9–17. [Google Scholar] [CrossRef] [Green Version]
- Grant, S.G.N.; O’Dell, T.J.; Karl, K.A.; Stein, P.L.; Soriano, P.; Kandel, E.R. Impaired long-term potentiation, spatial learning, and hippocampal development in fyn mutant mice. Science 1992, 258, 1903–1910. [Google Scholar] [CrossRef] [PubMed] [Green Version]
- Gage, M.C.; Thippeswamy, T. Inhibitors of Src Family Kinases, Inducible Nitric Oxide Synthase, and NADPH Oxidase as Potential CNS Drug Targets for Neurological Diseases. CNS Drugs 2021, 35, 1–20. [Google Scholar] [CrossRef]
- Jin, D.Z.; Mao, L.M.; Wang, J.Q. An essential role of fyn in the modulation of metabotropic glutamate receptor 1 in neurons. eNeuro 2017, 4, 4. [Google Scholar] [CrossRef] [Green Version]
- Suh, Y.H.; Chang, K.; Roche, K.W. Metabotropic glutamate receptor trafficking. Mol. Cell. Neurosci. 2018, 91, 10–24. [Google Scholar] [CrossRef]
- Trepanier, C.H.; Jackson, M.F.; MacDonald, J.F. Regulation of NMDA receptors by the tyrosine kinase Fyn. FEBS J. 2012, 279, 12–19. [Google Scholar] [CrossRef] [PubMed]
- Putra, M.; Puttachary, S.; Liu, G.; Lee, G.; Thippeswamy, T. Fyn-tau Ablation Modifies PTZ-Induced Seizures and Post-seizure Hallmarks of Early Epileptogenesis. Front. Cell. Neurosci. 2020, 14, 592374. [Google Scholar] [CrossRef]
- Ittner, L.M.; Ke, Y.D.; Delerue, F.; Bi, M.; Gladbach, A.; van Eersel, J.; Wölfing, H.; Chieng, B.C.; Christie, M.J.; Napier, I.A.; et al. Dendritic function of tau mediates amyloid-β toxicity in alzheimer’s disease mouse models. Cell 2010, 142, 387–397. [Google Scholar] [CrossRef] [Green Version]
- Miyamoto, T.; Stein, L.; Thomas, R.; Djukic, B.; Taneja, P.; Knox, J.; Vossel, K.; Mucke, L. Phosphorylation of tau at Y18, but not tau-fyn binding, is required for tau to modulate NMDA receptor-dependent excitotoxicity in primary neuronal culture. Mol. Neurodegener. 2017, 12, 1–19. [Google Scholar] [CrossRef]
- Knox, R.; Jiang, X. Fyn in Neurodevelopment and Ischemic Brain Injury. Dev. Neurosci. 2015, 37, 311–320. [Google Scholar] [CrossRef] [Green Version]
- Boehm, S.L.; Peden, L.; Harris, R.A.; Blednov, Y.A. Deletion of the fyn-kinase gene alters sensitivity to GABAergic drugs: Dependence on β2/β3 GABAA receptor subunits. J. Pharmacol. Exp. Ther. 2004, 309, 1154–1159. [Google Scholar] [CrossRef] [Green Version]
- Sharma, S.; Carlson, S.; Puttachary, S.; Sarkar, S.; Showman, L.; Putra, M.; Kanthasamy, A.G.; Thippeswamy, T. Role of the Fyn-PKCδ signaling in SE-induced neuroinflammation and epileptogenesis in experimental models of temporal lobe epilepsy. Neurobiol. Dis. 2018, 110, 102–121. [Google Scholar] [CrossRef]
- Panicker, N.; Saminathan, H.; Jin, H.; Neal, M.; Harischandra, D.S.; Gordon, R.; Kanthasamy, K.; Lawana, V.; Sarkar, S.; Luo, J.; et al. Fyn kinase regulates microglial neuroinflammatory responses in cell culture and animal models of parkinson’s disease. J. Neurosci. 2015, 35, 10058–10077. [Google Scholar] [CrossRef] [PubMed]
- Shih, R.H.; Wang, C.Y.; Yang, C.M. NF-kappaB signaling pathways in neurological inflammation: A mini review. Front. Mol. Neurosci. 2015, 8, 77. [Google Scholar] [CrossRef] [PubMed] [Green Version]
- Clark, R.A.; Valente, A.J. Nuclear factor kappa B activation by NADPH oxidases. Mech. Ageing Dev. 2004, 125, 799–810. [Google Scholar] [CrossRef] [PubMed]
- Liu, T.; Zhang, L.; Joo, D.; Sun, S.C. NF-κB signaling in inflammation. Signal Transduct. Target. Ther. 2017, 2, 17023. [Google Scholar] [CrossRef] [Green Version]
- McNeish, I.A.; Ledermann, J.A.; Webber, L.; James, L.; Kaye, S.B.; Hall, M.; Hall, G.; Clamp, A.; Earl, H.; Banerjee, S.; et al. A randomised, placebo-controlled trial of weekly paclitaxel and saracatinib (AZD0530) in platinum-resistant ovarian, fallopian tube or primary peritoneal cancer. Ann. Oncol. 2014, 25, 1988–1995. [Google Scholar] [CrossRef]
- Molina, J.R.; Foster, N.R.; Reungwetwattana, T.; Nelson, G.D.; Grainger, A.V.; Steen, P.D.; Stella, P.J.; Marks, R.; Wright, J.; Adjei, A.A. A phase II trial of the Src-kinase inhibitor saracatinib after four cycles of chemotherapy for patients with extensive stage small cell lung cancer: NCCTG trial N-0621. Lung Cancer 2014, 85, 245–250. [Google Scholar] [CrossRef] [Green Version]
- Dhawan, G.; Combs, C.K. Inhibition of Src kinase activity attenuates amyloid associated microgliosis in a murine model of Alzheimer’s disease. J. Neuroinflamm. 2012, 9, 563. [Google Scholar] [CrossRef] [PubMed] [Green Version]
- Panicker, N.; Kanthasamy, A.; Kanthasamy, A.G. Fyn amplifies NLRP3 inflammasome signaling in Parkinson’s disease. Aging 2019, 11, 5871–5873. [Google Scholar] [CrossRef] [PubMed]
- Yang, H.; Wang, L.; Zang, C.; Wang, Y.; Shang, J.; Zhang, Z.; Liu, H.; Bao, X.; Wang, X.; Zhang, D. Src Inhibition Attenuates Neuroinflammation and Protects Dopaminergic Neurons in Parkinson’s Disease Models. Front. Neurosci. 2020, 14, 45. [Google Scholar] [CrossRef] [Green Version]
- Nygaard, H.B.; Wagner, A.F.; Bowen, G.S.; Good, S.P.; MacAvoy, M.G.; Strittmatter, K.A.; Kaufman, A.C.; Rosenberg, B.J.; Sekine-Konno, T.; Varma, P.; et al. A phase Ib multiple ascending dose study of the safety, tolerability, and central nervous system availability of AZD0530 (saracatinib) in Alzheimer’s disease. Alzheimers Res. Ther. 2015, 7, 1–11. [Google Scholar] [CrossRef] [PubMed] [Green Version]
- Sharma, S.; Carlson, S.; Gregory-Flores, A.; Hinojo-Perez, A.; Olson, A.; Thippeswamy, T. Mechanisms of disease-modifying effect of saracatinib (AZD0530), a Src/Fyn tyrosine kinase inhibitor, in the rat kainate model of temporal lobe epilepsy. Neurobiol. Dis. 2021, 156, 105410. [Google Scholar] [CrossRef]
- Luo, X.-M.; Zhao, J.; Wu, W.-Y.; Fu, J.; Li, Z.-Y.; Zhang, M.; Lu, J. Post-status epilepticus treatment with the Fyn inhibitor, saracatinib, improves cognitive function in mice. BMC Neurosci. 2021, 22, 1–8. [Google Scholar] [CrossRef] [PubMed]
- Gage, M.; Putra, M.; Estrada, C.G.; Golden, M.; Wachter, L.; Gard, M.; Thippeswamy, T. Differential impact of severity and duration of status epilepticus, medical countermeasures, and a disease-modifier, saracatinib (AZD0530), on brain regions in the rat diisopropylfluorophosphate (DFP) model. Front. Cell. Neurosci. 2021, 15, 426. [Google Scholar] [CrossRef] [PubMed]
- Kilkenny, C.; Browne, W.J.; Cuthill, I.C.; Emerson, M.; Altman, D.G. Improving Bioscience Research Reporting: The ARRIVE Guidelines for Reporting Animal Research. PLoS Biol. 2010, 8, e1000412. [Google Scholar] [CrossRef]
- Racine, R.J. Modification of seizure activity by electrical stimulation. II: Motor seizure. Electroencephalogr. Clin. Neurophysiol. 1972, 32, 281–294. [Google Scholar] [CrossRef]
- Irwin, S. Comprehensive observational assessment: Ia. A systematic, quantitative procedure for assessing the behavioral and physiologic state of the mouse. Psychopharmacologia 1968, 13, 222–257. [Google Scholar] [CrossRef] [PubMed]
- Rojas, A.; Ganesh, T.; Manji, Z.; O’neill, T.; Dingledine, R. Inhibition of the prostaglandin E2 receptor EP2 prevents status epilepticus-induced deficits in the novel object recognition task in rats. Neuropharmacology 2016, 110, 419–430. [Google Scholar] [CrossRef] [Green Version]
- Lueptow, L.M. Novel object recognition test for the investigation of learning and memory in mice. J. Vis. Exp. 2017, 2017, 55718. [Google Scholar] [CrossRef] [PubMed]
- Pearson, J.N.; Schulz, K.M.; Patel, M. Specific alterations in the performance of learning and memory tasks in models of chemoconvulsant-induced status epilepticus. Epilepsy Res. 2014, 108, 1032–1040. [Google Scholar] [CrossRef] [PubMed] [Green Version]
- Yankelevitch-Yahav, R.; Franko, M.; Huly, A.; Doron, R. The forced swim test as a model of depressive-like behavior. J. Vis. Exp. 2015, 2015, 52587. [Google Scholar] [CrossRef]
- Cosgrave, A.S.; McKay, J.S.; Bubb, V.; Morris, R.; Quinn, J.P.; Thippeswamy, T. Regulation of activity-dependent neuroprotective protein (ADNP) by the NO-cGMP pathway in the hippocampus during kainic acid-induced seizure. Neurobiol. Dis. 2008, 30, 281–292. [Google Scholar] [CrossRef]
- Beamer, E.; Otahal, J.; Sills, G.J.; Thippeswamy, T. Nw-Propyl-l-arginine (L-NPA) reduces status epilepticus and early epileptogenic events in a mouse model of epilepsy: Behavioural, EEG and immunohistochemical analyses. Eur. J. Neurosci. 2012, 36, 3194–3203. [Google Scholar] [CrossRef]
- Streit, W.J.; Walter, S.A.; Pennell, N.A. Reactive microgliosis. Prog. Neurobiol. 1999, 57, 563–581. [Google Scholar] [CrossRef]
- Liu, T.; Zhang, M.; Mukosera, G.T.; Borchardt, D.; Li, Q.; Tipple, T.E.; Ahmed, A.S.I.; Power, G.G.; Blood, A.B. L-NAME releases nitric oxide and potentiates subsequent nitroglycerin-mediated vasodilation. Redox Biol. 2019, 26, 101238. [Google Scholar] [CrossRef]
- Sántha, P.; Veszelka, S.; Hoyk, Z.; Mészáros, M.; Walter, F.R.; Tóth, A.E.; Deli, M.A. Restraint Stress-Induced Morphological Changes at the Blood-Brain Barrier in Adult Rats. Front. Mol. Neurosci. 2016, 8, 88. [Google Scholar] [CrossRef] [Green Version]
- Green, T.P.; Fennell, M.; Whittaker, R.; Curwen, J.; Jacobs, V.; Allen, J.; Logie, A.; Hargreaves, J.; Hickinson, D.M.; Wilkinson, R.W.; et al. Preclinical anticancer activity of the potent, oral Src inhibitor AZD0530. Mol. Oncol. 2009, 3, 248–261. [Google Scholar] [CrossRef] [Green Version]
- Fujisaka, Y.; Onozawa, Y.; Kurata, T.; Yasui, H.; Goto, I.; Yamazaki, K.; Machida, N.; Watanabe, J.; Shimada, H.; Shi, X.; et al. First report of the safety, tolerability, and pharmacokinetics of the Src kinase inhibitor saracatinib (AZD0530) in Japanese patients with advanced solid tumours. Investig. New Drugs 2013, 31, 108–114. [Google Scholar] [CrossRef]
- Baselga, J.; Cervantes, A.; Martinelli, E.; Chirivella, I.; Hoekman, K.; Hurwitz, H.I.; Jodrell, D.I.; Hamberg, P.; Casado, E.; Elvin, P.; et al. Phase I safety, pharmacokinetics, and inhibition of src activity study of saracatinib in patients with solid tumors. Clin. Cancer Res. 2010, 16, 4876–4883. [Google Scholar] [CrossRef] [PubMed] [Green Version]
- Gucal, A.; Sparano, J.; Caravelli, A.; Santamauro, J.; Patil, S.; Abbruzzi, A.; Pellegrino, C.; Bromberg, J.; Dang, C.; Theodoulou, M.; et al. Phase II trial of saracatinib (AZD0530), an oral SRC-inhibitor for the treatment of patients with hormone receptor-negative metastatic breast cancer. Clin. Breast Cancer 2011, 11, 306–311. [Google Scholar] [CrossRef] [Green Version]
- Chen, J.; Peng, Y.; Zheng, J. Cytochrome P450 Mediated Bioactivation of Saracatinib. Chem. Res. Toxicol. 2016, 29, 1835–1842. [Google Scholar] [CrossRef]
- Attwa, M.; Kadi, A.; Darwish, H.; Alrabiah, H. LC-MS/MS reveals the formation of reactive ortho-quinone and iminium intermediates in saracatinib metabolism: Phase I metabolic profiling. Clin. Chim. Acta 2018, 482, 84–94. [Google Scholar] [CrossRef] [PubMed]
- Li, J.; Chen, Y.; Tang, Y.; Li, W.; Tu, Y. Homotropic Cooperativity of Midazolam Metabolism by Cytochrome P450 3A4: Insight from Computational Studies. J. Chem. Inf. Model. 2021, 61, 2418–2426. [Google Scholar] [CrossRef]
- Tao, G.; Huang, J.; Moorthy, B.; Wang, C.; Hu, M.; Gao, S.; Ghose, R. Potential role of drug metabolizing enzymes in chemotherapy-induced gastrointestinal toxicity and hepatotoxicity. Expert Opin. Drug Metab. Toxicol. 2020, 16, 1109–1124. [Google Scholar] [CrossRef]
- Kaufman, A.C.; Salazar, S.V.; Haas, L.T.; Yang, J.; Kostylev, M.A.; Jeng, A.T.; Robinson, S.A.; Gunther, E.C.; van Dyck, C.H.; Nygaard, H.B.; et al. Fyn Inhibition Rescues Established Memory and Synapse Loss in Alzheimer Mice. Ann. Neurol. 2015, 77, 953. [Google Scholar] [CrossRef] [PubMed] [Green Version]
- Kast, R.E.; Focosi, D. Three paths to better tyrosine kinase inhibition behind the blood-brain barrier in treating chronic myelogenous leukemia and glioblastoma with imatinib. Transl. Oncol. 2010, 3, 13–15. [Google Scholar] [CrossRef] [Green Version]
- Mittapalli, R.K.; Chung, A.H.; Parrish, K.E.; Crabtree, D.; Halvorson, K.G.; Hu, G.; Elmquist, W.F.; Becher, O.J. ABCG2 and ABCB1 limit the efficacy of dasatinib in a PDGF-B-driven brainstem glioma model. Mol. Cancer Ther. 2016, 15, 819–829. [Google Scholar] [CrossRef] [PubMed] [Green Version]
- Smith, L.M.; Zhu, R.; Strittmatter, S.M. Disease-modifying benefit of Fyn blockade persists after washout in mouse Alzheimer’s model. Neuropharmacology 2018, 130, 54–61. [Google Scholar] [CrossRef]
- Toyonaga, T.; Smith, L.M.; Finnema, S.J.; Gallezot, J.-D.; Naganawa, M.; Bini, J.; Mulnix, T.; Cai, Z.; Ropchan, J.; Huang, Y.; et al. In Vivo Synaptic Density Imaging with 11C-UCB-J Detects Treatment Effects of Saracatinib in a Mouse Model of Alzheimer Disease. J. Nucl. Med. 2019, 60, 1780. [Google Scholar] [CrossRef]
- Choi, Y.R.; Kim, J.; Kang, S.; Noh, H.R.; Jou, I.; Joe, E.; Park, S.M. The dual role of c-src in cell-to-cell transmission of α-synuclein. EMBO Rep. 2020, 21, e48950. [Google Scholar] [CrossRef] [PubMed]
- Posadas, E.M.; Ahmed, R.S.; Karrison, T.; Szmulewitz, R.Z.; O’Donnell, P.H.; Wade, J.L., III; Stadler, W.M. Saracatinib as a metastasis inhibitor in metastatic castration-resistant prostate cancer: A University of Chicago Phase 2 Consortium and DOD/PCF Prostate Cancer Clinical Trials Consortium Study. Prostate 2016, 76, 286–293. [Google Scholar] [CrossRef] [Green Version]
- Baird, K.; Glod, J.; Steinberg, S.; Reinke, D.; Pressey, J.; Mascarenhas, L.; Federman, N.; Marina, N.; Chawla, S.; Lagmay, J.; et al. Results of a Randomized, Double-Blinded, Placebo-Controlled, Phase 2.5 Study of Saracatinib (AZD0530), in Patients with Recurrent Osteosarcoma Localized to the Lung. Sarcoma 2020, 2020, 1–6. [Google Scholar] [CrossRef]
- Van Dyck, C.H.; Nygaard, H.B.; Chen, K.; Donohue, M.C.; Raman, R.; Rissman, R.A.; Brewer, J.B.; Koeppe, R.A.; Chow, T.W.; Rafii, M.S.; et al. Effect of AZD0530 on Cerebral Metabolic Decline in Alzheimer Disease: A Randomized Clinical Trial. JAMA Neurol. 2019, 76, 1219–1229. [Google Scholar] [CrossRef] [PubMed] [Green Version]
- Castro, O.W.; Santos, V.R.; Pun, R.Y.K.; McKlveen, J.M.; Batie, M.; Holland, K.D.; Gardner, M.; Garcia-Cairasco, N.; Herman, J.P.; Danzer, S.C. Impact of corticosterone treatment on spontaneous seizure frequency and epileptiform activity in mice with chronic epilepsy. PLoS ONE 2012, 7, e46044. [Google Scholar] [CrossRef] [Green Version]
- Cano-López, I.; González-Bono, E. Cortisol levels and seizures in adults with epilepsy: A systematic review. Neurosci. Biobehav. Rev. 2019, 103, 216–229. [Google Scholar] [CrossRef]
- Maguire, J.; Salpekar, J.A. Stress, seizures, and hypothalamic-pituitary-adrenal axis targets for the treatment of epilepsy. Epilepsy Behav. 2013, 26, 352–362. [Google Scholar] [CrossRef] [Green Version]
- Lundt, A.; Wormuth, C.; Siwek, M.E.; Müller, R.; Ehninger, D.; Henseler, C.; Broich, K.; Papazoglou, A.; Weiergräber, M. EEG Radiotelemetry in Small Laboratory Rodents: A Powerful State-of-the Art Approach in Neuropsychiatric, Neurodegenerative, and Epilepsy Research. Neural Plast. 2016, 2016. [Google Scholar] [CrossRef] [Green Version]
- Abdullah, J.M.; Islam, M.R. Telemetric EEG and the rat: A guide for neuroscientists. Malays. J. Med. Sci. 2012, 19, 1–5. [Google Scholar] [PubMed]
- Zhao, X.; Liao, Y.; Morgan, S.; Mathur, R.; Feustel, P.; Mazurkiewicz, J.; Qian, J.; Chang, J.; Mathern, G.W.; Adamo, M.A.; et al. Noninflammatory Changes of Microglia Are Sufficient to Cause Epilepsy. Cell Rep. 2018, 22, 2080–2093. [Google Scholar] [CrossRef] [Green Version]
- Lull, M.E.; Block, M.L. Microglial Activation and Chronic Neurodegeneration. Neurotherapeutics 2010, 7, 354–365. [Google Scholar] [CrossRef] [Green Version]
- Tang, Y.; Li, X.; Mao, X. Editorial: Linking Neuroinflammation and Glial Phenotypic Changes in Neurological Diseases. Front. Cell. Neurosci. 2019, 13, 542. [Google Scholar] [CrossRef] [Green Version]
- Rao, M.S.; Hattiangady, B.; Reddy, D.S.; Shetty, A.K. Hippocampal neurodegeneration, spontaneous seizures, and mossy fiber sprouting in the F344 rat model of temporal lobe epilepsy. J. Neurosci. Res. 2006, 83, 1088–1105. [Google Scholar] [CrossRef] [PubMed]
- Namba, T. Cholinesterase inhibition by organophosphorus compounds and its clinical effects. Bull. World Health Organ. 1971, 44, 289. [Google Scholar] [PubMed]
- Barker-Haliski, M.; Löscher, W.; White, H.; Galanopoulou, A. Neuroinflammation in epileptogenesis: Insights and translational perspectives from new models of epilepsy. Epilepsia 2017, 58 (Suppl. S3), 39–47. [Google Scholar] [CrossRef] [Green Version]
- Vezzani, A.; French, J.; Bartfai, T.; Baram, T.Z. The role of inflammation in epilepsy. Nat. Rev. Neurol. 2011, 7, 31–40. [Google Scholar] [CrossRef] [Green Version]
- Tang, F.; Hartz, A.; Bauer, B. Drug-Resistant Epilepsy: Multiple Hypotheses, Few Answers. Front. Neurol. 2017, 8, 301. [Google Scholar] [CrossRef]
- Rojas, A.; Ganesh, T.; Wang, W.; Wang, J.; Dingledine, R. A rat model of organophosphate-induced status epilepticus and the beneficial effects of EP2 receptor inhibition. Neurobiol. Dis. 2019, 133, 104399. [Google Scholar] [CrossRef]
- Chaban, V.; Lakhter, A.; Micevych, P. A membrane estrogen receptor mediates intracellular calcium release in astrocytes. Endocrinology 2004, 145, 3788–3795. [Google Scholar] [CrossRef] [PubMed] [Green Version]
- Rurak, G.M.; Woodside, B.; Aguilar-Valles, A.; Salmaso, N. Astroglial cells as neuroendocrine targets in forebrain development: Implications for sex differences in psychiatric disease. Front. Neuroendocrinol. 2021, 60, 100897. [Google Scholar] [CrossRef]
- Coan, A.C.; Cendes, F. Epilepsy as progressive disorders: What is the evidence that can guide our clinical decisions and how can neuroimaging help? Epilepsy Behav. 2013, 26, 313–321. [Google Scholar] [CrossRef] [PubMed] [Green Version]
- Cendes, F. Progressive hippocampal and extrahippocampal atrophy in drug resistant epilepsy. Curr. Opin. Neurol. 2005, 18, 173–177. [Google Scholar] [CrossRef]
- Gorter, J.A.; van Vliet, E.A.; Aronica, E.; da Silva, F.H.L. Progression of spontaneous seizures after status epilepticus is associated with mossy fibre sprouting and extensive bilateral loss of hilar parvalbumin and somatostatin-immunoreactive neurons. Eur. J. Neurosci. 2001, 13, 657–669. [Google Scholar] [CrossRef] [PubMed]
- Vismer, M.S.; Forcelli, P.A.; Skopin, M.D.; Gale, K.; Koubeissi, M.Z. The piriform, perirhinal, and entorhinal cortex in seizure generation. Front. Neural Circuits 2015, 9, 27. [Google Scholar] [CrossRef] [Green Version]
- Yang, Y.; Wang, J.-Z. From Structure to Behavior in Basolateral Amygdala-Hippocampus Circuits. Front. Neural Circuits 2017, 11, 86. [Google Scholar] [CrossRef] [PubMed] [Green Version]
- Thom, M.; Eriksson, S.; Martinian, L.; Caboclo, L.O.; McEvoy, A.W.; Duncan, J.S.; Sisodiya, S.M. Temporal Lobe Sclerosis Associated with Hippocampal Sclerosis in Temporal Lobe Epilepsy: Neuropathological Features. J. Neuropathol. Exp. Neurol. 2009, 68, 928. [Google Scholar] [CrossRef]
- Henry, T.R.; Chupin, M.; Lehéricy, S.; Strupp, J.P.; Sikora, M.A.; Sha, Z.Y.; Uğurbil, K.; Moortele, P.-F. Van de Hippocampal Sclerosis in Temporal Lobe Epilepsy: Findings at 7 T. Radiology 2011, 261, 199. [Google Scholar] [CrossRef] [Green Version]
- England, M.J.; Liverman, C.T.; Schultz, A.M.; Strawbridge, L.M. Epilepsy across the spectrum: Promoting health and understanding.: A summary of the Institute of Medicine report. Epilepsy Behav. 2012, 25, 266–276. [Google Scholar] [CrossRef] [PubMed] [Green Version]
- Holmes, G.L. Cognitive impairment in Epilepsy: The Role of Network Abnormalities. Epileptic Disord. 2015, 17, 101. [Google Scholar] [CrossRef]
- Jackson, M.J.; Turkington, D. Depression and anxiety in epilepsy. J. Neurol. Neurosurg. Psychiatry 2005, 76, i45–i47. [Google Scholar] [CrossRef] [Green Version]
- Simmatis, L.E.R.; Jin, A.Y.; Keiski, M.; Lomax, L.B.; Scott, S.H.; Winston, G.P. Assessing various sensorimotor and cognitive functions in people with epilepsy is feasible with robotics-NC-ND license. Epilepsy Behav. 2020, 103, 106859. [Google Scholar] [CrossRef] [Green Version]
- Antunes, M.; Biala, G. The novel object recognition memory: Neurobiology, test procedure, and its modifications. Cogn. Process. 2012, 13, 93–110. [Google Scholar] [CrossRef] [Green Version]
- Kadar, T.; Cohen, G.; Sahar, R.; Alkalai, D.; Shapira, S. Long-Term Study of Brain Lesions Following Soman, in Comparison to DFP and Metrazol Poisoning. Hum. Exp. Toxicol. 1992, 11, 517–523. [Google Scholar] [CrossRef] [PubMed]
- Barsegyan, A.; McGaugh, J.L.; Roozendaal, B. Noradrenergic activation of the basolateral amygdala modulates the consolidation of object-in-context recognition memory. Front. Behav. Neurosci. 2014, 8, 160. [Google Scholar] [CrossRef] [PubMed]
- Yu, X.; Zhou, T.; Yu, H.; Chang, L.Y.; Wei, L.L. Corilagin reduces the frequency of seizures and improves cognitive function in a rat model of chronic epilepsy. Med. Sci. Monit. 2018, 24, 2832–2840. [Google Scholar] [CrossRef] [Green Version]
- Shuman, T.; Aharoni, D.; Cai, D.J.; Lee, C.R.; Chavlis, S.; Page-Harley, L.; Vetere, L.M.; Feng, Y.; Yang, C.Y.; Mollinedo-Gajate, I.; et al. Breakdown of spatial coding and interneuron synchronization in epileptic mice. Nat. Neurosci. 2020, 23, 229–238. [Google Scholar] [CrossRef]
- Branders, R.; Raveh, L.; Grunwald, J.; Cohen, E.; Ashani, Y. Prevention of soman-induced cognitive deficits by pretreatment with human butyrylcholinesterase in rats. Pharmacol. Biochem. Behav. 1993, 46, 889–896. [Google Scholar] [CrossRef]
- D’Hooge, R.; De Deyn, P. Applications of the Morris water maze in the study of learning and memory. Brain Res. Rev. 2001, 36, 60–90. [Google Scholar] [CrossRef]
- Braun, A.A.; Skelton, M.R.; Vorhees, C.V.; Williams, M.T. Comparison of the elevated plus and elevated zero mazes in treated and untreated male Sprague-Dawley rats: Effects of anxiolytic and anxiogenic agents. Pharmacol. Biochem. Behav. 2011, 97, 406–415. [Google Scholar] [CrossRef] [Green Version]
- Inostroza, M.; Cid, E.; Brotons-Mas, J.; Gal, B.; Aivar, P.; Uzcateg, Y.G.; Sandi, C.; de la Prida, L.M. Hippocampal-Dependent spatial memory in the water maze is preserved in an experimental model of temporal lobe epilepsy in rats. PLoS ONE 2011, 6, e22372. [Google Scholar] [CrossRef]
- Koh, S.; Magid, R.; Chung, H.; Stine, C.D.; Wilson, D.N. Depressive behavior and selective downregulation of serotonin receptor expression after early-life seizures: Reversal by environmental enrichment. Epilepsy Behav. 2007, 10, 26–31. [Google Scholar] [CrossRef] [Green Version]
- Bogdanova, O.V.; Kanekar, S.; D’anci, K.E.; Renshaw, P.F.; Author, P.B. Factors influencing behavior in the forced swim test HHS Public Access Author manuscript. Physiol. Behav. 2013, 118, 227–239. [Google Scholar] [CrossRef] [Green Version]
- Deacon, R.M.J. Measuring motor coordination in mice. J. Vis. Exp. 2013, 75, e2609. [Google Scholar] [CrossRef] [PubMed]
- Buitrago, M.M.; Schulz, J.B.; Dichgans, J.; Luft, A.R. Short and long-term motor skill learning in an accelerated rotarod training paradigm. Neurobiol. Learn. Mem. 2004, 81, 211–216. [Google Scholar] [CrossRef]
- Takano, T.; Hayashi, A.; Harada, Y. Progression of motor disability in cerebral palsy: The role of concomitant epilepsy. Seizure 2020, 80, 81–85. [Google Scholar] [CrossRef]
- Liu, J.; Lin, L.; Wang, D.V. Representation of Fear of Heights by Basolateral Amygdala Neurons. J. Neurosci. 2021, 41, 1080–1091. [Google Scholar] [CrossRef] [PubMed]
- Janak, P.H.; Tye, K.M. From circuits to behaviour in the amygdala. Nature 2015, 517, 284. [Google Scholar] [CrossRef] [PubMed] [Green Version]
- Salter, M.W.; Kalia, L.V. SRC kinases: A hub for NMDA receptor regulation. Nat. Rev. Neurosci. 2004, 5, 317–328. [Google Scholar] [CrossRef]
- Jurd, R.; Tretter, V.; Walker, J.; Brandon, N.J.; Moss, S.J. Fyn kinase contributes to tyrosine phosphorylation of the GABAA receptor γ2 subunit. Mol. Cell. Neurosci. 2010, 44, 129–134. [Google Scholar] [CrossRef] [Green Version]
- Fan, Y.; Xie, L.; Chung, C.Y. Signaling pathways controlling microglia chemotaxis. Mol. Cells 2017, 40, 163–168. [Google Scholar]
- Lee, S.H.; Hollingsworth, R.; Kwon, H.Y.; Lee, N.; Chung, C.Y. β-arrestin 2-dependent activation of ERK1/2 is required for ADP-induced paxillin phosphorylation at Ser83 and microglia chemotaxis. Glia 2012, 60, 1366–1377. [Google Scholar] [CrossRef] [Green Version]
- Panicker, N.; Sarkar, S.; Harischandra, D.S.; Neal, M.; Kam, T.I.; Jin, H.; Saminathan, H.; Langley, M.; Charli, A.; Samidurai, M.; et al. Fyn kinase regulates misfolded α-synuclein uptake and NLRP3 inflammasome activation in microglia. J. Exp. Med. 2019, 216, 1411–1430. [Google Scholar] [CrossRef]
- Kaltschmidt, B.; Kaltschmidt, C. NF-kappaB in the nervous system. Cold Spring Harb. Perspect. Biol. 2009, 1, a001271. [Google Scholar] [CrossRef] [Green Version]
- Anrather, J.; Racchumi, G.; Iadecola, C. NF-κB regulates phagocytic NADPH oxidase by inducing the expression of gp91phox. J. Biol. Chem. 2006, 281, 5657–5667. [Google Scholar] [CrossRef] [Green Version]
- Aktan, F. iNOS-mediated nitric oxide production and its regulation. Life Sci. 2004, 75, 639–653. [Google Scholar] [CrossRef] [PubMed]
- Walker, G.; Pfeilschifter, J.; Kunz, D. Mechanisms of suppression of inducible nitric-oxide synthase (iNOS) expression in interferon (IFN)-γ-stimulated RAW 264.7 cells by dexamethasone. Evidence for glucocorticoid-induced degradation of iNOS protein by calpain as a key step in post-transcriptional regulation. J. Biol. Chem. 1997, 272, 16679–16687. [Google Scholar] [PubMed] [Green Version]
- Knott, A.B.; Bossy-Wetzel, E. Nitric oxide in health and disease of the nervous system. Antioxid. Redox Signal. 2009, 11, 541–553. [Google Scholar] [CrossRef] [PubMed] [Green Version]
- Tyryshkin, A.; Gorgun, F.; Fattah, E.A.; Mazumdar, T.; Pandit, L.; Zeng, S.; Eissa, N. Src kinase-mediated phosphorylation stabilizes inducible nitric-oxide synthase in normal cells and cancer cells. J. Biol. Chem. 2010, 285, 784–792. [Google Scholar] [CrossRef] [Green Version]
- Ahsan, H. 3-Nitrotyrosine: A biomarker of nitrogen free radical species modified proteins in systemic autoimmunogenic conditions. Hum. Immunol. 2013, 74, 1392–1399. [Google Scholar] [CrossRef]
- Cooney, S.J.; Bermudez-Sabogal, S.L.; Byrnes, K.R. Cellular and temporal expression of NADPH oxidase (NOX) isotypes after brain injury. J. Neuroinflamm. 2013, 10, 155. [Google Scholar] [CrossRef] [Green Version]
- Fuentes, E.; Gibbins, J.M.; Holbrook, L.M.; Palomo, I. NADPH oxidase 2 (NOX2): A key target of oxidative stress-mediated platelet activation and thrombosis. Trends Cardiovasc. Med. 2018, 28, 429–434. [Google Scholar] [CrossRef]
- Sharma, S.; Puttachary, S.; Thippeswamy, T. Glial source of nitric oxide in epileptogenesis: A target for disease modification in epilepsy. J. Neurosci. Res. 2017, 97, 1363–1377. [Google Scholar] [CrossRef] [PubMed]
- Ray, P.D.; Huang, B.W.; Tsuji, Y. Reactive oxygen species (ROS) homeostasis and redox regulation in cellular signaling. Cell. Signal. 2012, 24, 981–990. [Google Scholar] [CrossRef] [Green Version]
- Mittler, R. ROS Are Good. Trends Plant Sci. 2017, 22, 11–19. [Google Scholar] [CrossRef] [PubMed] [Green Version]
- Kumar, H.; Lim, H.-W.; More, S.V.; Kim, B.-W.; Koppula, S.; Kim, I.S.; Choi, D.-K. The Role of Free Radicals in the Aging Brain and Parkinson’s Disease: Convergence and Parallelism. Int. J. Mol. Sci. 2012, 13, 10478. [Google Scholar] [CrossRef] [PubMed] [Green Version]
- Uttara, B.; Singh, A.V.; Zamboni, P.; Mahajan, R. Oxidative Stress and Neurodegenerative Diseases: A Review of Upstream and Downstream Antioxidant Therapeutic Options. Curr. Neuropharmacol. 2009, 7, 65. [Google Scholar] [CrossRef] [Green Version]
- Wu, L.; Xiong, X.; Wu, X.; Ye, Y.; Jian, Z.; Zhi, Z.; Gu, L. Targeting Oxidative Stress and Inflammation to Prevent Ischemia-Reperfusion Injury. Front. Mol. Neurosci. 2020, 13, 28. [Google Scholar] [CrossRef] [Green Version]


| Timepoint | Midazolam Administration | PBS + VEH | PBS + SAR | DFP + VEH | DFP + SAR |
|---|---|---|---|---|---|
| 8 days Males | One hour post DFP | 5 | 0 | 7 | 10 (20%) |
| 8 days Females | One hour post DFP | 5 | 0 | 8 | 8 (25%) |
| 10 weeks Males | After 20 min CS | 14 | 14 | 16 | 16 (6%) |
Publisher’s Note: MDPI stays neutral with regard to jurisdictional claims in published maps and institutional affiliations. |
© 2021 by the authors. Licensee MDPI, Basel, Switzerland. This article is an open access article distributed under the terms and conditions of the Creative Commons Attribution (CC BY) license (https://creativecommons.org/licenses/by/4.0/).
Share and Cite
Gage, M.; Putra, M.; Wachter, L.; Dishman, K.; Gard, M.; Gomez-Estrada, C.; Thippeswamy, T. Saracatinib, a Src Tyrosine Kinase Inhibitor, as a Disease Modifier in the Rat DFP Model: Sex Differences, Neurobehavior, Gliosis, Neurodegeneration, and Nitro-Oxidative Stress. Antioxidants 2022, 11, 61. https://0-doi-org.brum.beds.ac.uk/10.3390/antiox11010061
Gage M, Putra M, Wachter L, Dishman K, Gard M, Gomez-Estrada C, Thippeswamy T. Saracatinib, a Src Tyrosine Kinase Inhibitor, as a Disease Modifier in the Rat DFP Model: Sex Differences, Neurobehavior, Gliosis, Neurodegeneration, and Nitro-Oxidative Stress. Antioxidants. 2022; 11(1):61. https://0-doi-org.brum.beds.ac.uk/10.3390/antiox11010061
Chicago/Turabian StyleGage, Meghan, Marson Putra, Logan Wachter, Kylie Dishman, Megan Gard, Crystal Gomez-Estrada, and Thimmasettappa Thippeswamy. 2022. "Saracatinib, a Src Tyrosine Kinase Inhibitor, as a Disease Modifier in the Rat DFP Model: Sex Differences, Neurobehavior, Gliosis, Neurodegeneration, and Nitro-Oxidative Stress" Antioxidants 11, no. 1: 61. https://0-doi-org.brum.beds.ac.uk/10.3390/antiox11010061