1. Introduction
In order to maintain their homeostasis, plants and algae are well-known to deploy rapid and efficient antioxidant strategies against drastic environmental challenges [
1]. Carotenoids (with more than 700 identified species) [
2] and flavonoids (with 7 main families and more than 10,000 identified species) [
3,
4], together with other classical nonenzymatic antioxidants, such as glutathione, ascorbate and α-tocopherol, comprise the main breeding ground of compounds than can be extracted from plants for their antioxidant properties [
5].
The detailed study of different antioxidant properties in plants or plant extracts has been limited for a long time, as chemical tools such as HAT (hydrogen atop transfer) and SET (single-electron transfer) approaches [
6] provide information in the form of an antioxidant capacity (AC) only. They give no clues about the actual antioxidant effect expected in living organisms [
7].
Apart from animal studies, various cell and assay models have been developed in the last decade to overcome this issue [
8,
9]. The HepG2 cell line, which originates from the human liver, remains the most common human cell model used for antioxidant analysis, especially when working on food supplements, as liver is the first target organ following the entry of nutriments in the gastrointestinal tract [
10].
The most recognized cell-based assay available to date for antioxidant activity measurement uses the so-called Keap1/Nrf2/ARE stress-response pathway, which is also called the “master regulator of stress response”. This canonical pathway regulates the transcription of a multitude of proteins involved in cellular antioxidant systems, such as the redoxin system, the OH-1 antioxidant and NQO1 cytoprotective enzymes [
11]. They are all involved in the cell’s defense strategy against oxidative attacks. Stable ARE-driven firefly luciferase reporter cell lines now provide a useful tool to follow antioxidant effects at the cell level [
12]. Different studies have shown that numerous phytochemicals act by activating the Keap1/Nrf2/ARE pathway [
13,
14,
15,
16]. This assay was also applied successfully to screen plant extracts according to the level of their Antioxidant Response Element (ARE) transcriptional activation. In a study carried out in HepG2 cells, 28 out of 45 (62.2%) phytochemicals and plant extracts, including coffee, broccoli and spices showed significant ARE activities [
17]. More ambitiously, a high throughput screening campaign counting no less than 280 methanolic extracts from more than 181 plants collected in Panama was conducted using an Nrf2/ARE assay performed on ARE/luciferase stably transfected AREc32 cells [
18]. The assay proved to be robust enough to be conducted in 384-microwell plates, and a significant increase in the ARE transcription machinery was observed (57.5%) for 161 extracts. This methodology appeared to be the most effective and discriminative, since the in vitro antioxidant capacity (AC) evaluated in parallel was positive without any useful information for 93.5% of the 280 extracts.
Tackling antioxidant effects by looking at gene expression partially answers the question as to whether direct free-radical-quenching processes can also be involved at the cell level or not. These processes are much harder to detect and assess on cell systems due to the very small half-lives of free radicals, in the order of nano- to milli-seconds. In addition to this, their production can also be difficult to control. Recent developments in cell biology and energy transfer technologies led to the AOP1 live-cell assay, which allows the monitoring of free-radical production by a photoinduction process involving an asymmetrical cyanine fluorescent biosensor located in the intracellular compartment [
19]. As for the Nrf2/ARE assay, the AOP1 live-cell assay facilitates dose–response studies and has already been successful in classifying many plant extracts and standard antioxidant quenchers. These studies were undertaken based on the intracellular free-radical-neutralizing properties in HepG2 and other cell models [
20]. The current list of botanical extracts was determined through bibliographical review and the European regulatory interpretations that allow their use as antioxidant botanical extracts for intended oral use.
The present work represents the first attempt to screen plant extracts on both direct (intracellular free-radical-quenching by AOP1) and indirect (gene expression by Nrf2/ARE reporter-gene system) antioxidant cell-based assays. In order to get a full picture of antioxidant effects in relation to the human organism, extracts showing the most interesting profiles were then submitted to a Transwell cellular intestinal barrier transport model in order to analyze the remaining antioxidant effects present in the basolateral postbarrier function compartments. Combinations of some extracts were eventually assayed with the hope of finding synergistic effects.
2. Material and Methods
2.1. Materials and Reagents
Thiazole orange (TO) and sulforaphane were purchased from Sigma-Aldrich (Saint-Quentin Fallavier, France). Gibco DMEM (high glucose, GlutaMAX supplement and pyruvate), fetal bovine serum (FBS) (HyClone, Logan, UT, USA), pen-strep solution (100X) (Gibco), 0.05% Trypsin-EDTA (HyClone), Gibco DPBS without Calcium, Magnesium (1X), Gibco Selective Antibiotic Geneticin (G418) (50 mg/mL) and Transwell (3402, Corning, NY, USA) were purchased from Thermo Fisher Scientific (Illkirch-Graffenstaden, France). A ONE-Step Luciferase Assay System was purchased from BPS Bioscience (catalogue number 60690, San Diego, CA, USA). HepG2 and Caco-2 cell lines were respectively purchased from the ATCC (catalog number HB8065, LGC Standards, Molsheim, France) and given by Led Engineering Development (LED, Montauban, France). A HepG2 ARE reporter cell line (Nrf2 antioxidant pathway) was purchased from BPS Bioscience (catalogue number 60513).
2.2. Sample Extraction Process
All plant extracts were sourced by Nexira. The list of botanical extracts is presented in
Table 1, where scientific botanical names and the plant parts used are presented. The types of extraction process are also reported. Basically, the first-stage extraction used water as a solvent. S/L aqueous extract designates Solid/Liquid extraction, where the botanical raw material under dried form was extracted in an aqueous phase and separated by centrifugation. For a few specific botanical extracts, a purification stage was added to the first-stage extraction, notably for grape, as this source has been widely explored in terms of antioxidant properties, and its activities could differ because of the extraction process. All the extracts were dried and used in powder form, except for AI, AJ, AP and BB, which were used in concentrated liquid, as they were not dryable. All data here are reported in a dried-form equivalency unit of the native extract.
2.3. Sample Preparation
Stock solutions of compounds and samples were prepared in advance. Apart from the samples already in liquid format, all samples were solubilized in a DMEM culture medium. The solutions were centrifuged at 8700 rpm for 10 min, and supernatant was collected, aliquoted and stored at −20 °C. For the dose–response experiments, different concentrations were obtained by serial factor-2 dilutions. The experiments were carried out in 96-well microplates using the 60 most-centered wells. The samples were incubated in a serum-free medium in order to avoid potential interaction with components of the serum. Each experiment was performed in triplicates (AOP1) or duplicates (ARE/Nrf2), including the negative control (culture medium, ethanol or DMSO), according to the solvent used. Apart from the last series of data presented in
Section 3.5, all conditions were subjected to two independent sets of experiments.
2.4. Cell Culture
The HepG2 cells (passages 15–35) were cultured at 37 °C under 5% CO2 in a complemented (FBS 10%, pen-strep 1X) GlutaMAX DMEM medium. For the HepG2/Nrf2 cells (passages 4–16), the cells were cultured at 37 °C/5% CO2 in a GlutaMAX DMEM medium complemented with a 10% FBS, 1X pen-strep solution and 50 mg/mL G418. The Caco-2 cells (passage 20 to 35) were grown in a GlutaMAX DMEM medium complemented with 20% FBS and 1X pen-strep. The cells were grown up to 70–80% confluence before transfer (106 cells/mL for HepG2 and 4 × 10⁵ cells/mL for Caco-2) to clear-bottom 96-well microplates.
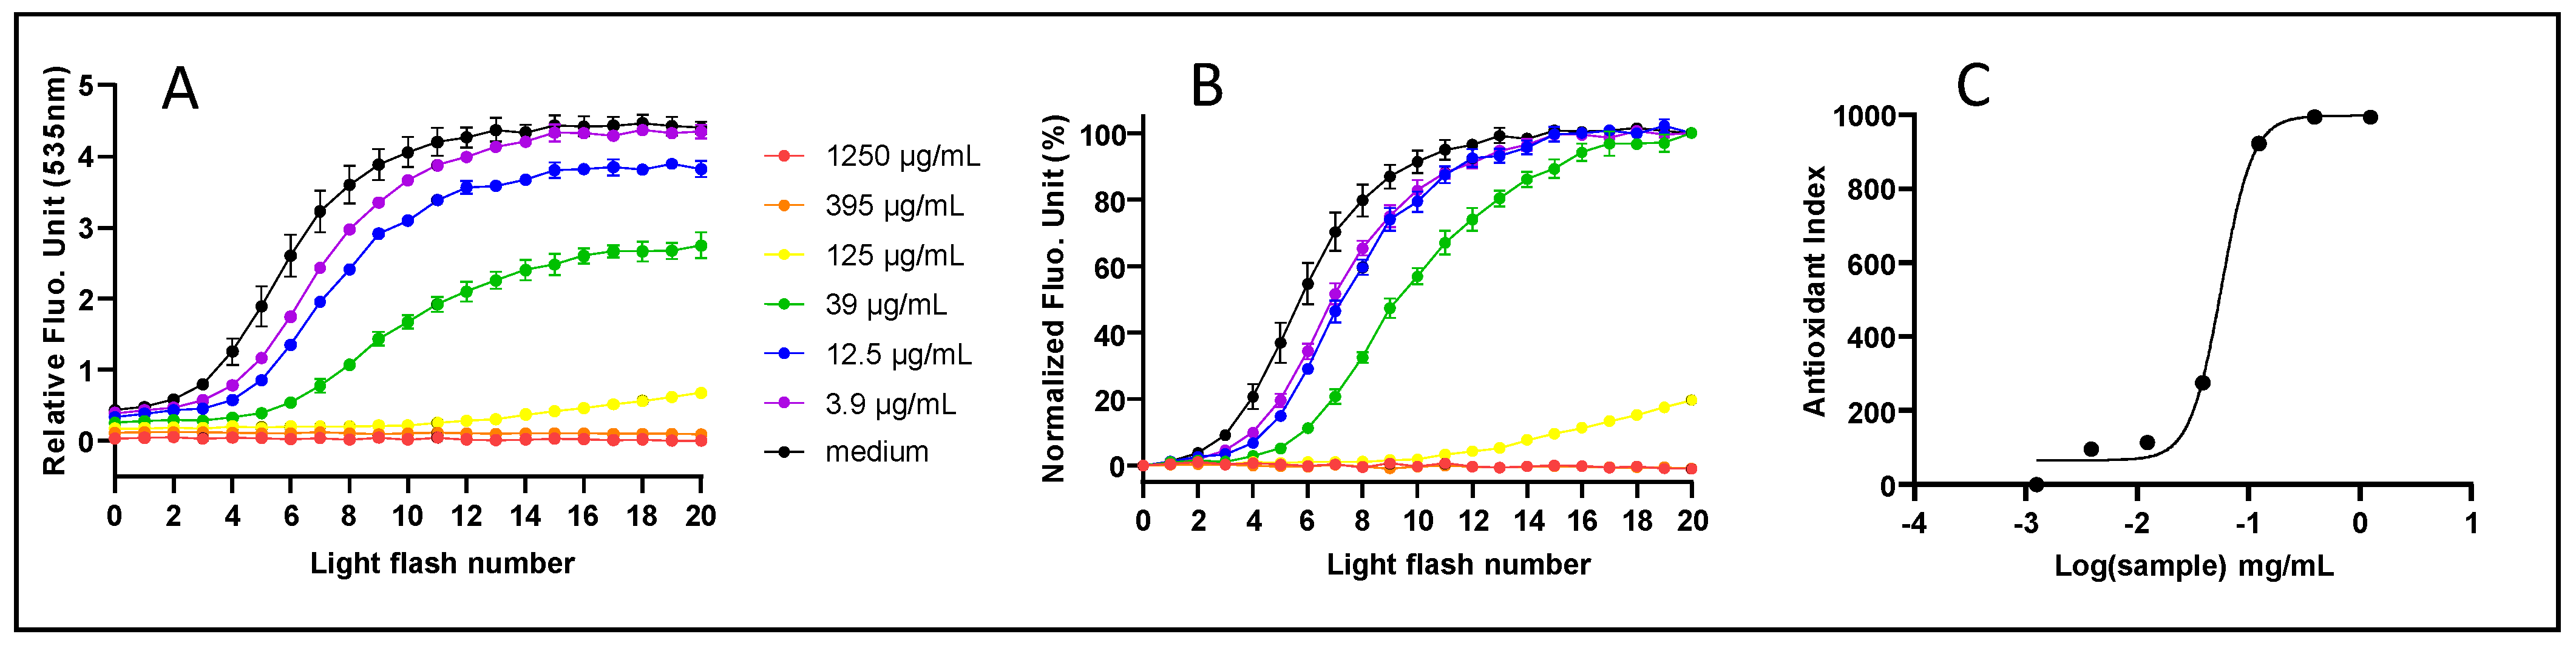
2.5. AOP1 Assay Experimental Protocol
The cells were first incubated for 4 h at 37 °C in 5% CO2 with each experimental condition. TO was added to the cells (4 μM, 1 h, 37 °C in 5% CO2). Fluorescence emission (expressed as RFU, Relative Fluorescence Unit) was measured (flash number 0) using a Varioskan Flash Spectral Scanning Multimode Reader (Thermo Fisher Scientific, Waltham, MA, USA) set up at 505/535 (excitation/emission) nm. The microplates were illuminated (470 nm, 24 mJ/cm2) using a light application device (24 LEDs, each centered on the intersection of a square of 4 wells) provided by LED (Montauban, France). Fluorescence emission was measured again immediately after illumination (flash number 1) before applying the light again. This cycle was repeated (flash number 2, 3, 4, etc.) until the fluorescence emission reached a plateau.
Kinetic profiles were normalized using Prism8 (GraphPad, San Diego, CA, USA), according to control data and expressed as a cellular Antioxidant Index (AI) according to the formula:
Dose–response curves, obtained by compiling AIs according to a logarithm (10) of the sample concentration, were submitted to a sigmoid fit according to the formula:
where SC = sample concentration and HS = hillslope = slope coefficient of the tangent at the inflection point. EC
50 (50% efficacy concentration), EC
10 and EC
90 are then evaluated according to the fit.
p values were produced when necessary, using a two-tailed, unpaired
t-test.
2.6. ARE/Nrf2 Reporter-Gene System
The HepG2/Nrf2 cells were treated with conditions for 17 h; then, they were treated with a mix (BPS Bioscience, USA) comprising cell lysis solution and luciferin (substrate of luciferase) for 40 min. Luminescence was read on a Varioskan Flash Spectral Scanning Multimode Reader. Relative Luminescence values (RLU) reveal luciferase gene expression following ARE promotion. The results are presented as Fold Increase (FI) in the control values at t = 20 min according to the formula:
As above, dose–response curves were submitted to a sigmoid fit, and EC50 (50% efficacy concentration) was evaluated according to the fit. p values were produced when necessary, using a two-tailed, unpaired t-test.
2.7. Transwell Intestinal Epithelial Barrier Model
The Caco-2 cells (passages 20–35) were cultured at 37 °C in 5% CO2 in a complemented (FBS 20%, pen-strep 1X) GlutaMAX DMEM medium. The cells were allowed to grow to 70–80% confluence. The basolateral compartments of the Transwell polycarbonate membrane cell culture inserts (12-well microplate, Corning 3402) were filled with 1.5 mL of the medium. Next, 500 µL of cells (760,000 cells) were added in the apical compartments, and the cells were grown for 21 days at 37 °C/5% CO2. The culture medium (500 µL) was replaced in the apical compartments every other day. After 21 days, the medium in the apical compartments was replaced by the samples, all at 10 mg/mL concentration, apart from H. italicum at 1 mg/mL, for 4 h at 37 °C/5% CO2. At the end of the incubation, both compartments were collected for further experiments. Transepithelial Electrical Resistance (TEER) was measured before sample addition, and again after 4 h incubation, with an ohmmeter (MERS00002 Millipore Voltmètre-Ohmmètre Millicell-ER).
4. Discussion
This study shows that cell-based assays provide a powerful screening system to select natural extracts on the basis of their intracellular antioxidant activity. The Nrf2/ARE assay proved to be sensitive enough to detect antioxidant effects downstream of intestinal transport, opening the way to study the synergistic effects of combinations of metabolites produced in post-intestinal barrier compartments. In a screening campaign carried out in parallel to this study, intestinal epithelial cells have been used in combination with human adipose cells to explore the activities of plant extracts, revealing the relevancy of this method to document the physiological activities of plant extracts [
21].
The strong antioxidant effects (µg/mL range) observed in this study are supported by the compounds we could actually detect in the samples used in this study. Some of them are presented in
Table 7.
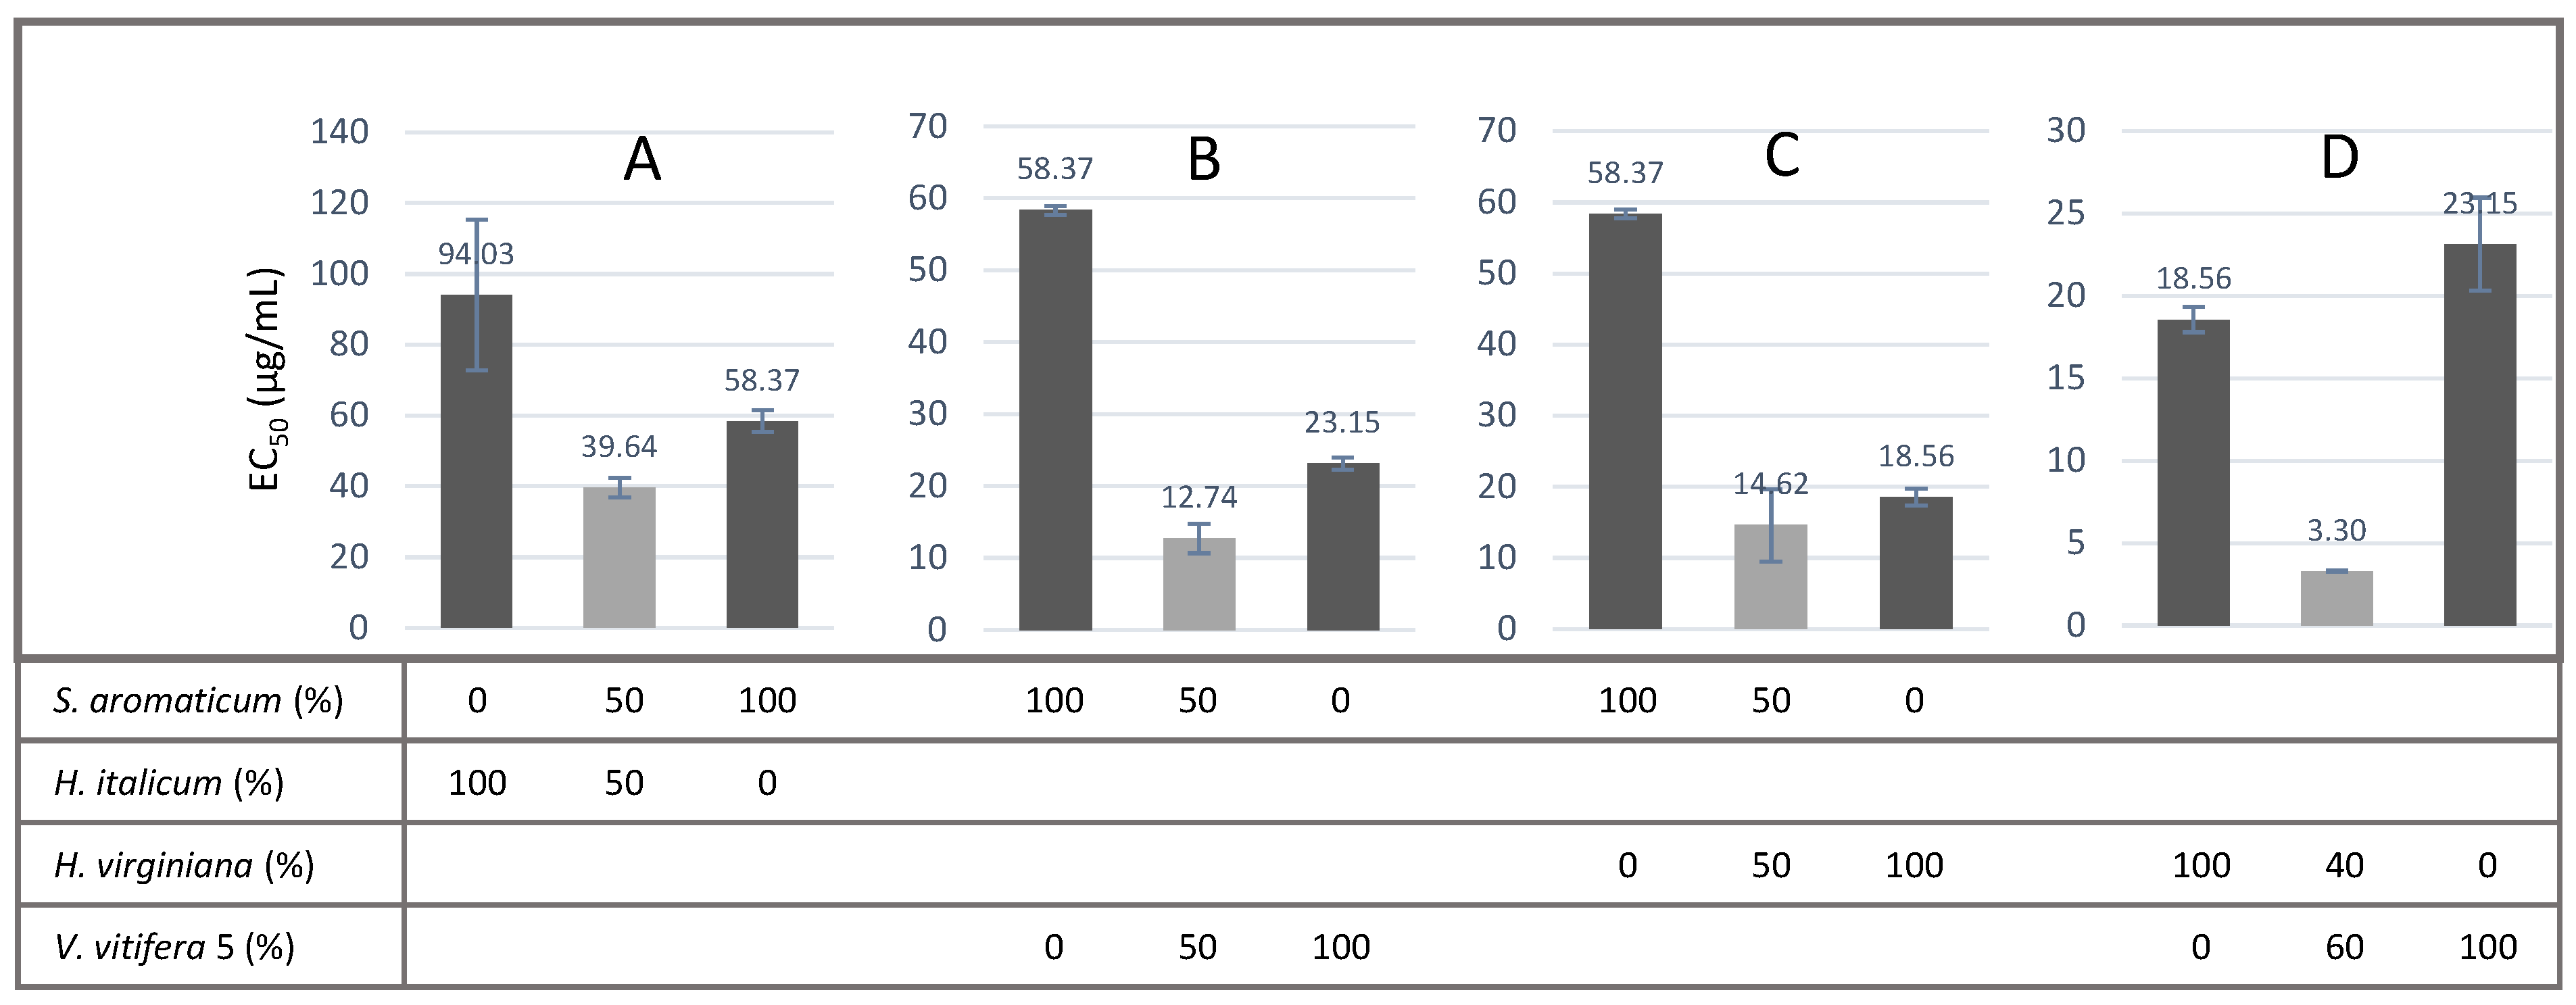
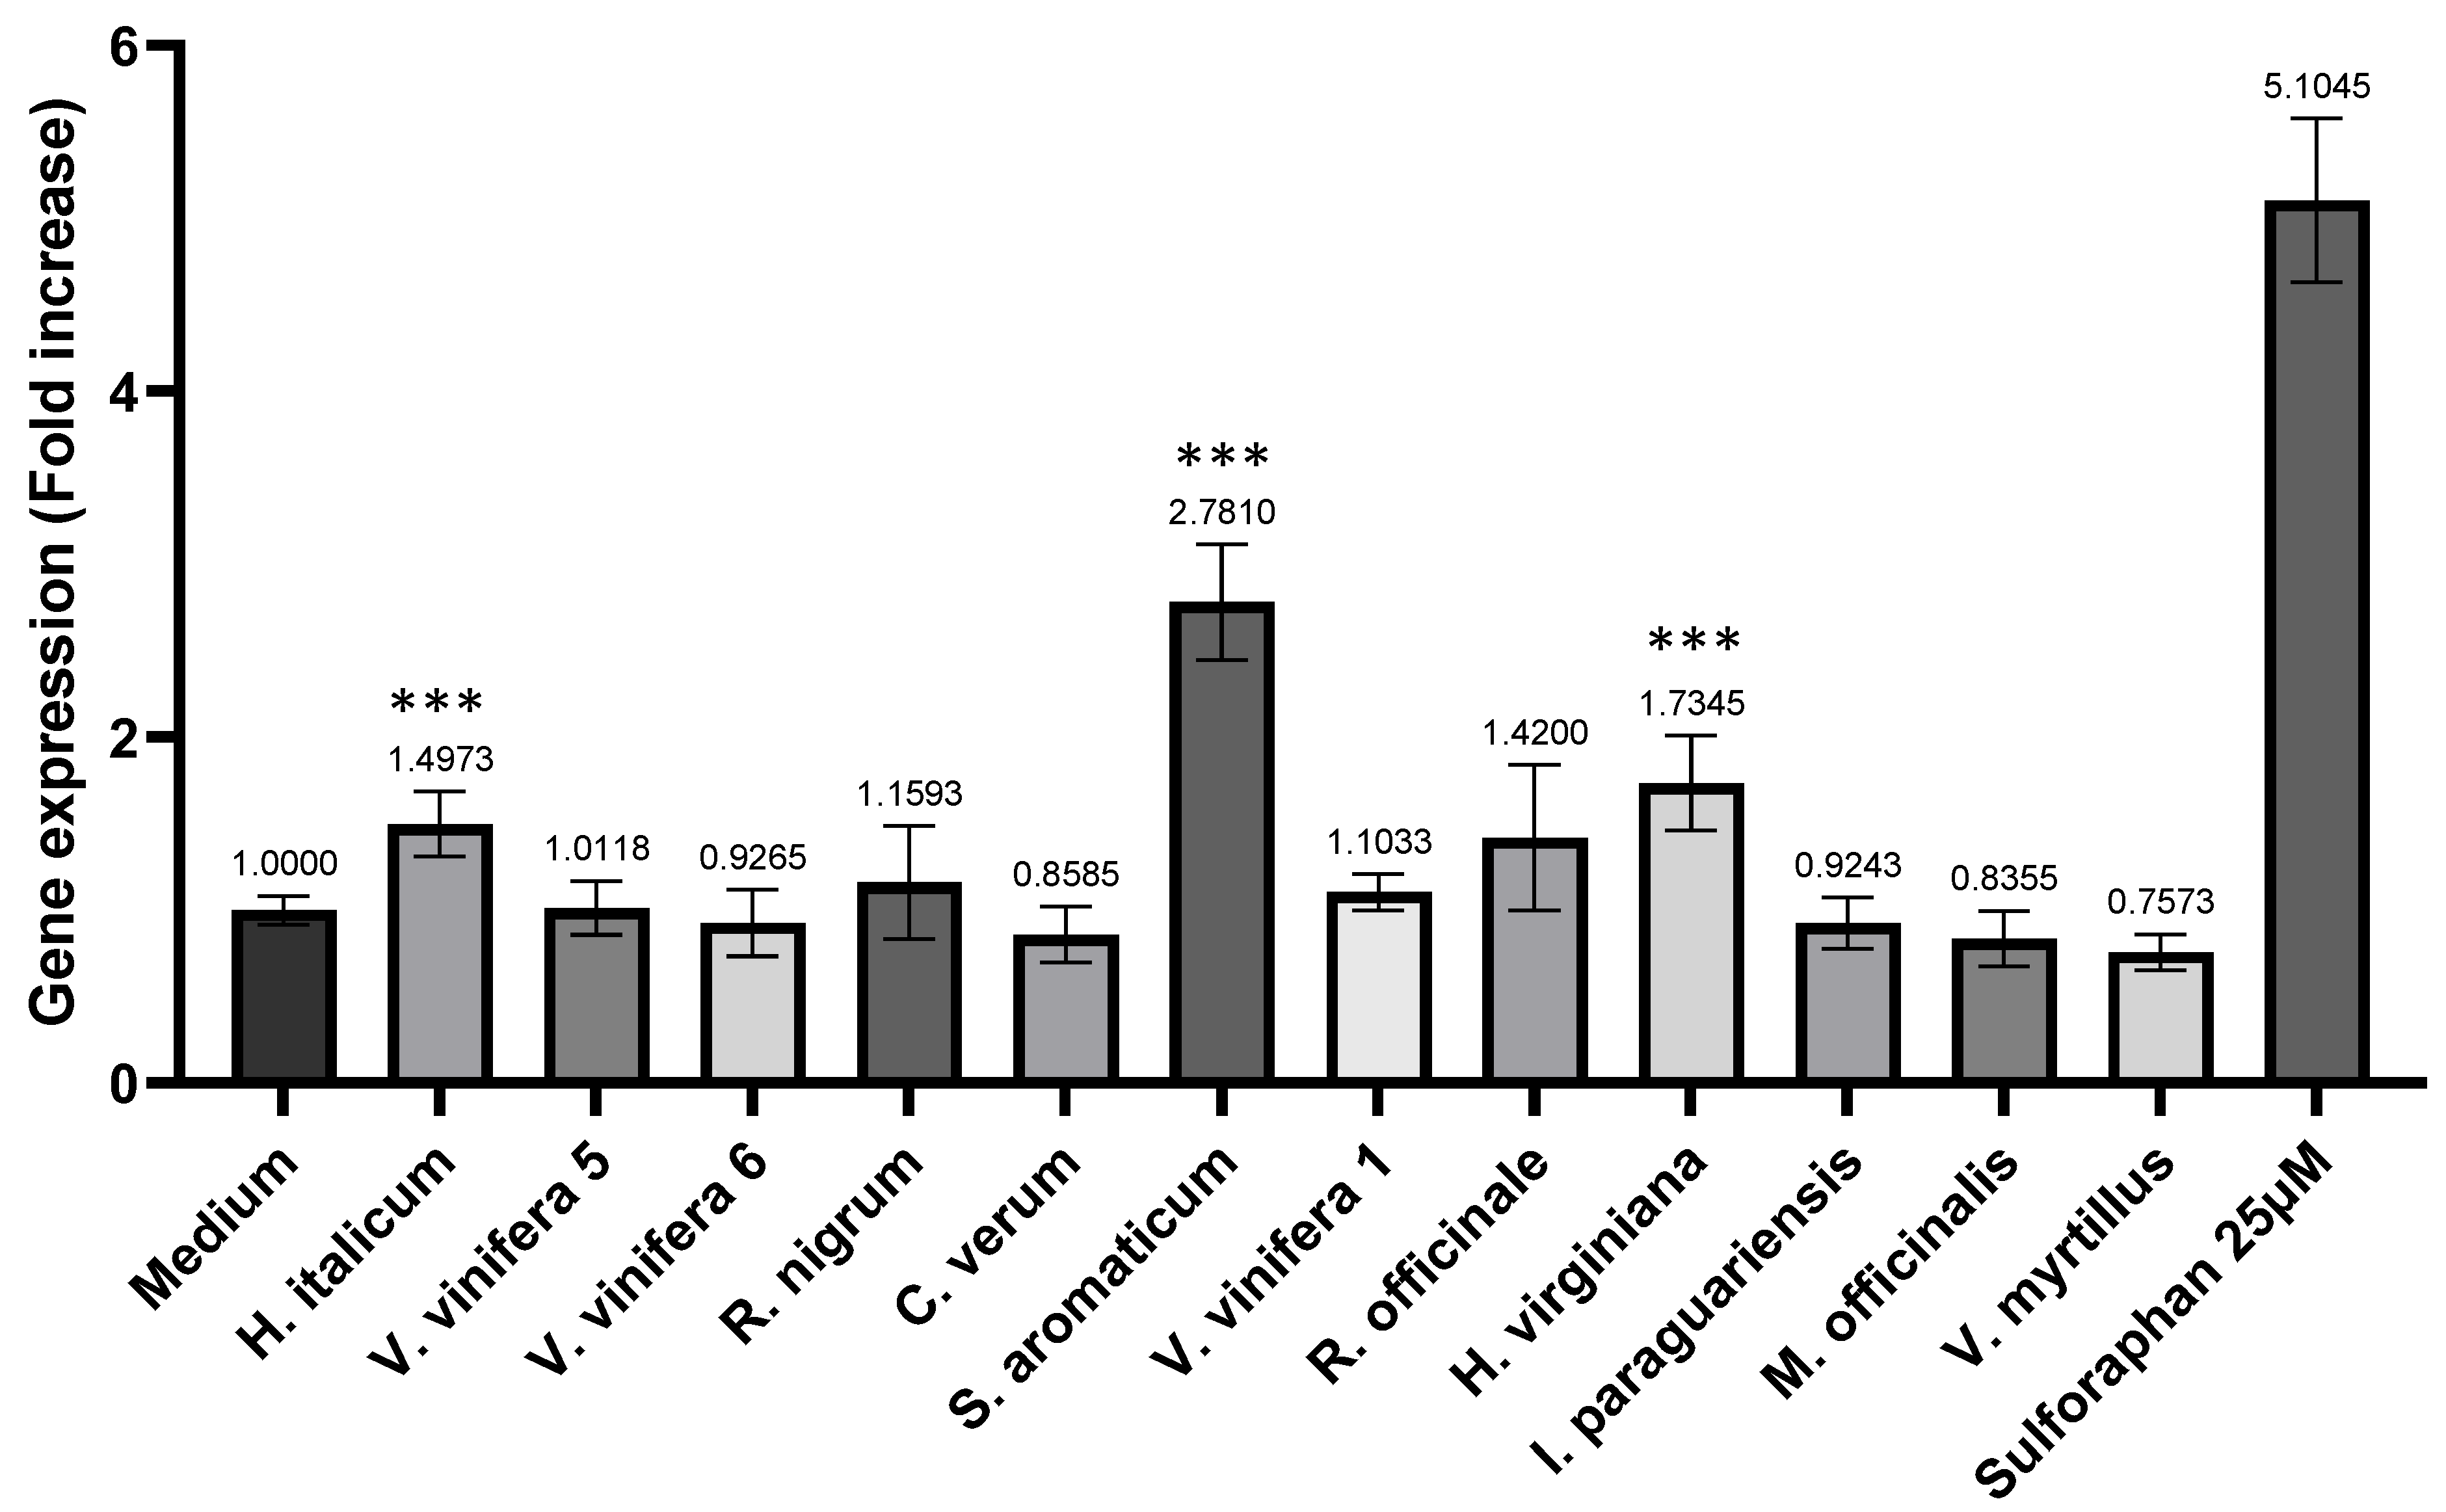
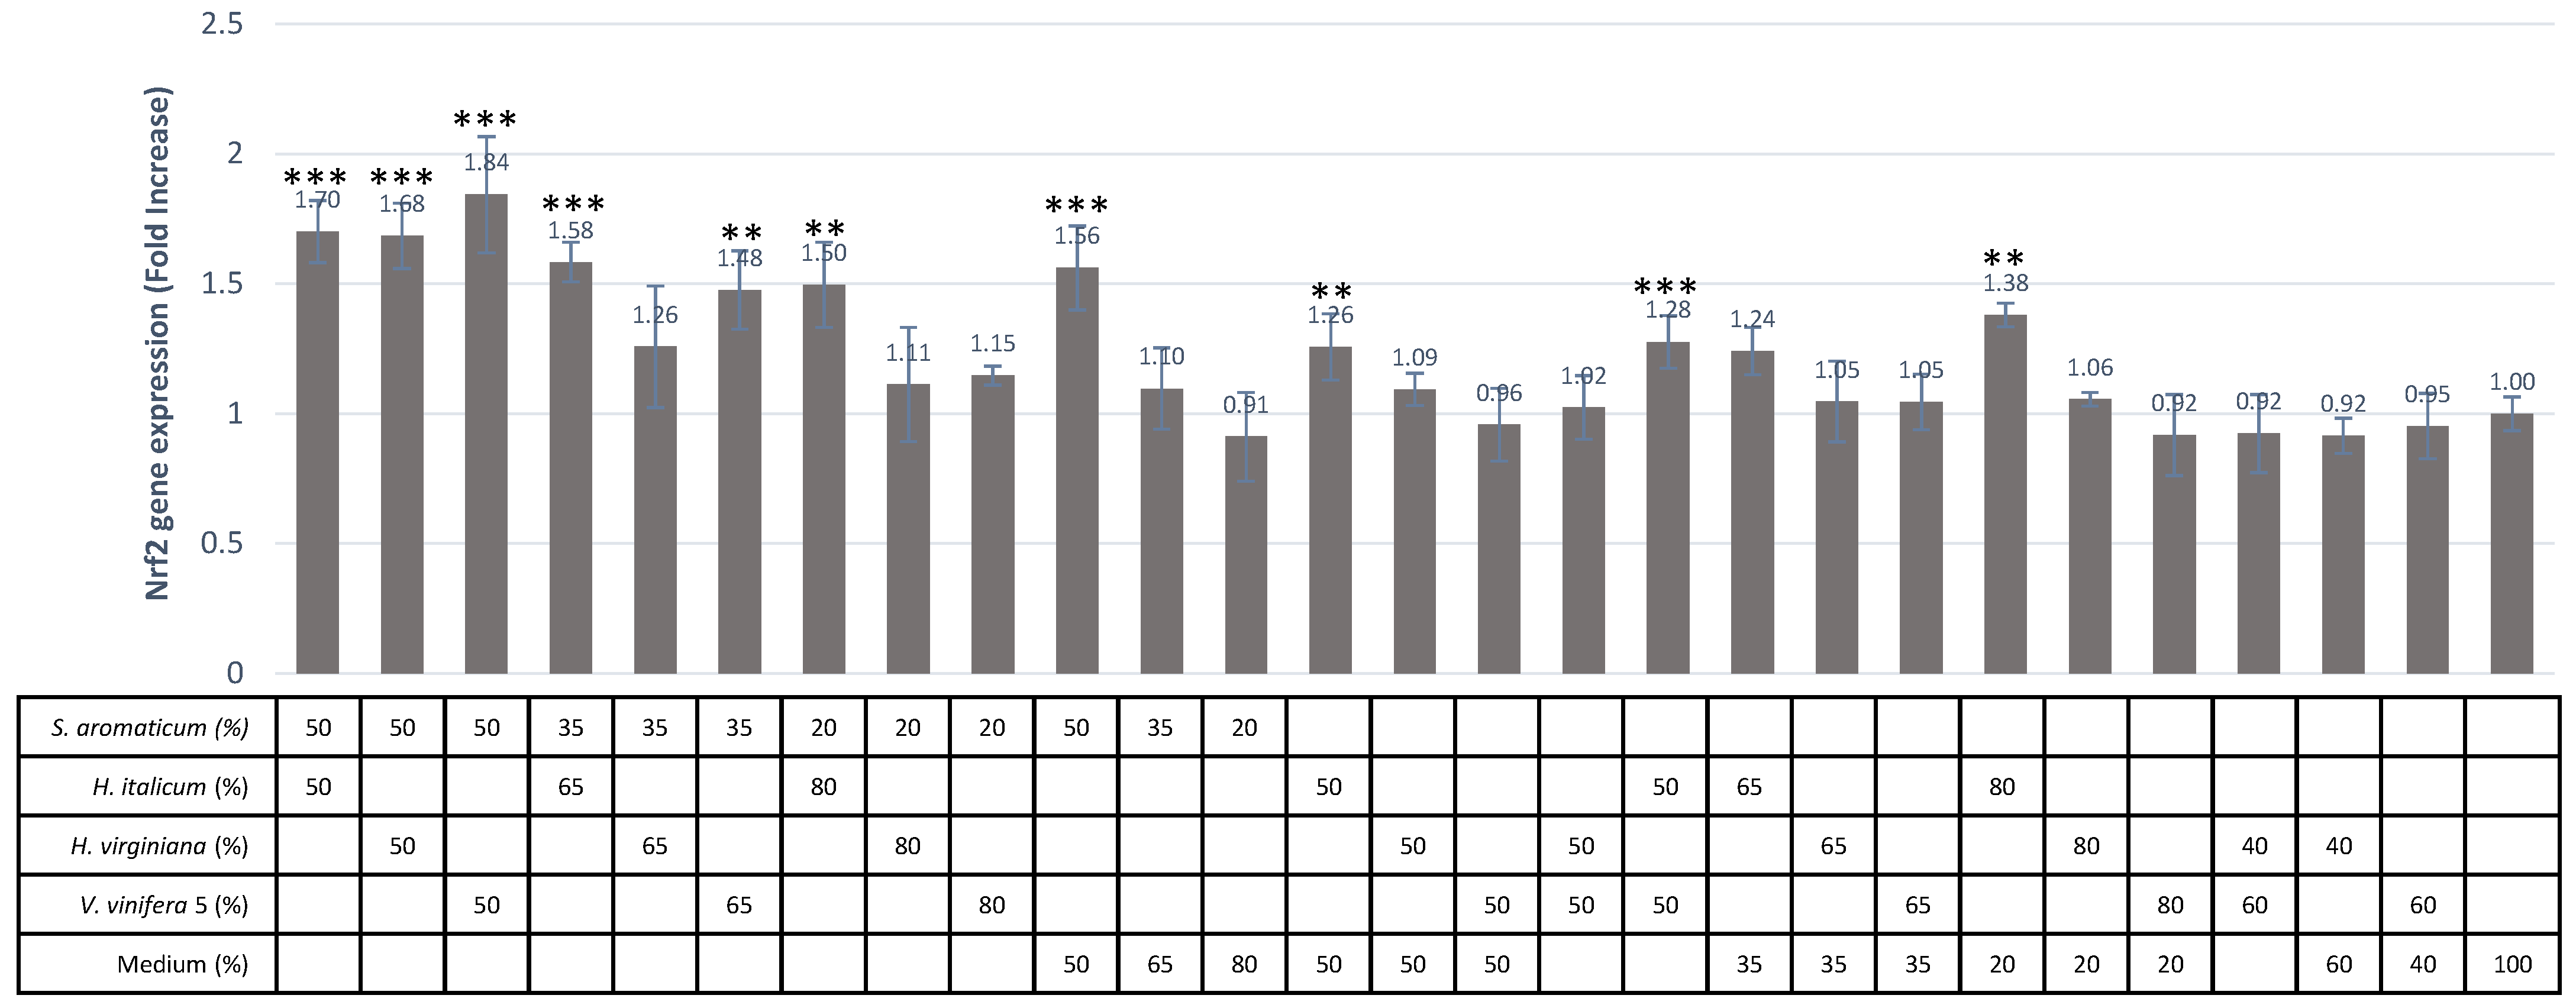
It is remarkable that the synergistic effects could be demonstrated both before and after intestinal transport for three combinations, namely S. aromaticum/H. italicum, S. aromaticum/H. virginiana and S. aromaticum/V. vinifera. The present study provides the first demonstration of such effects. For these four extracts taken individually, the direct and indirect antioxidant effects we observed here are in line with previously published data.
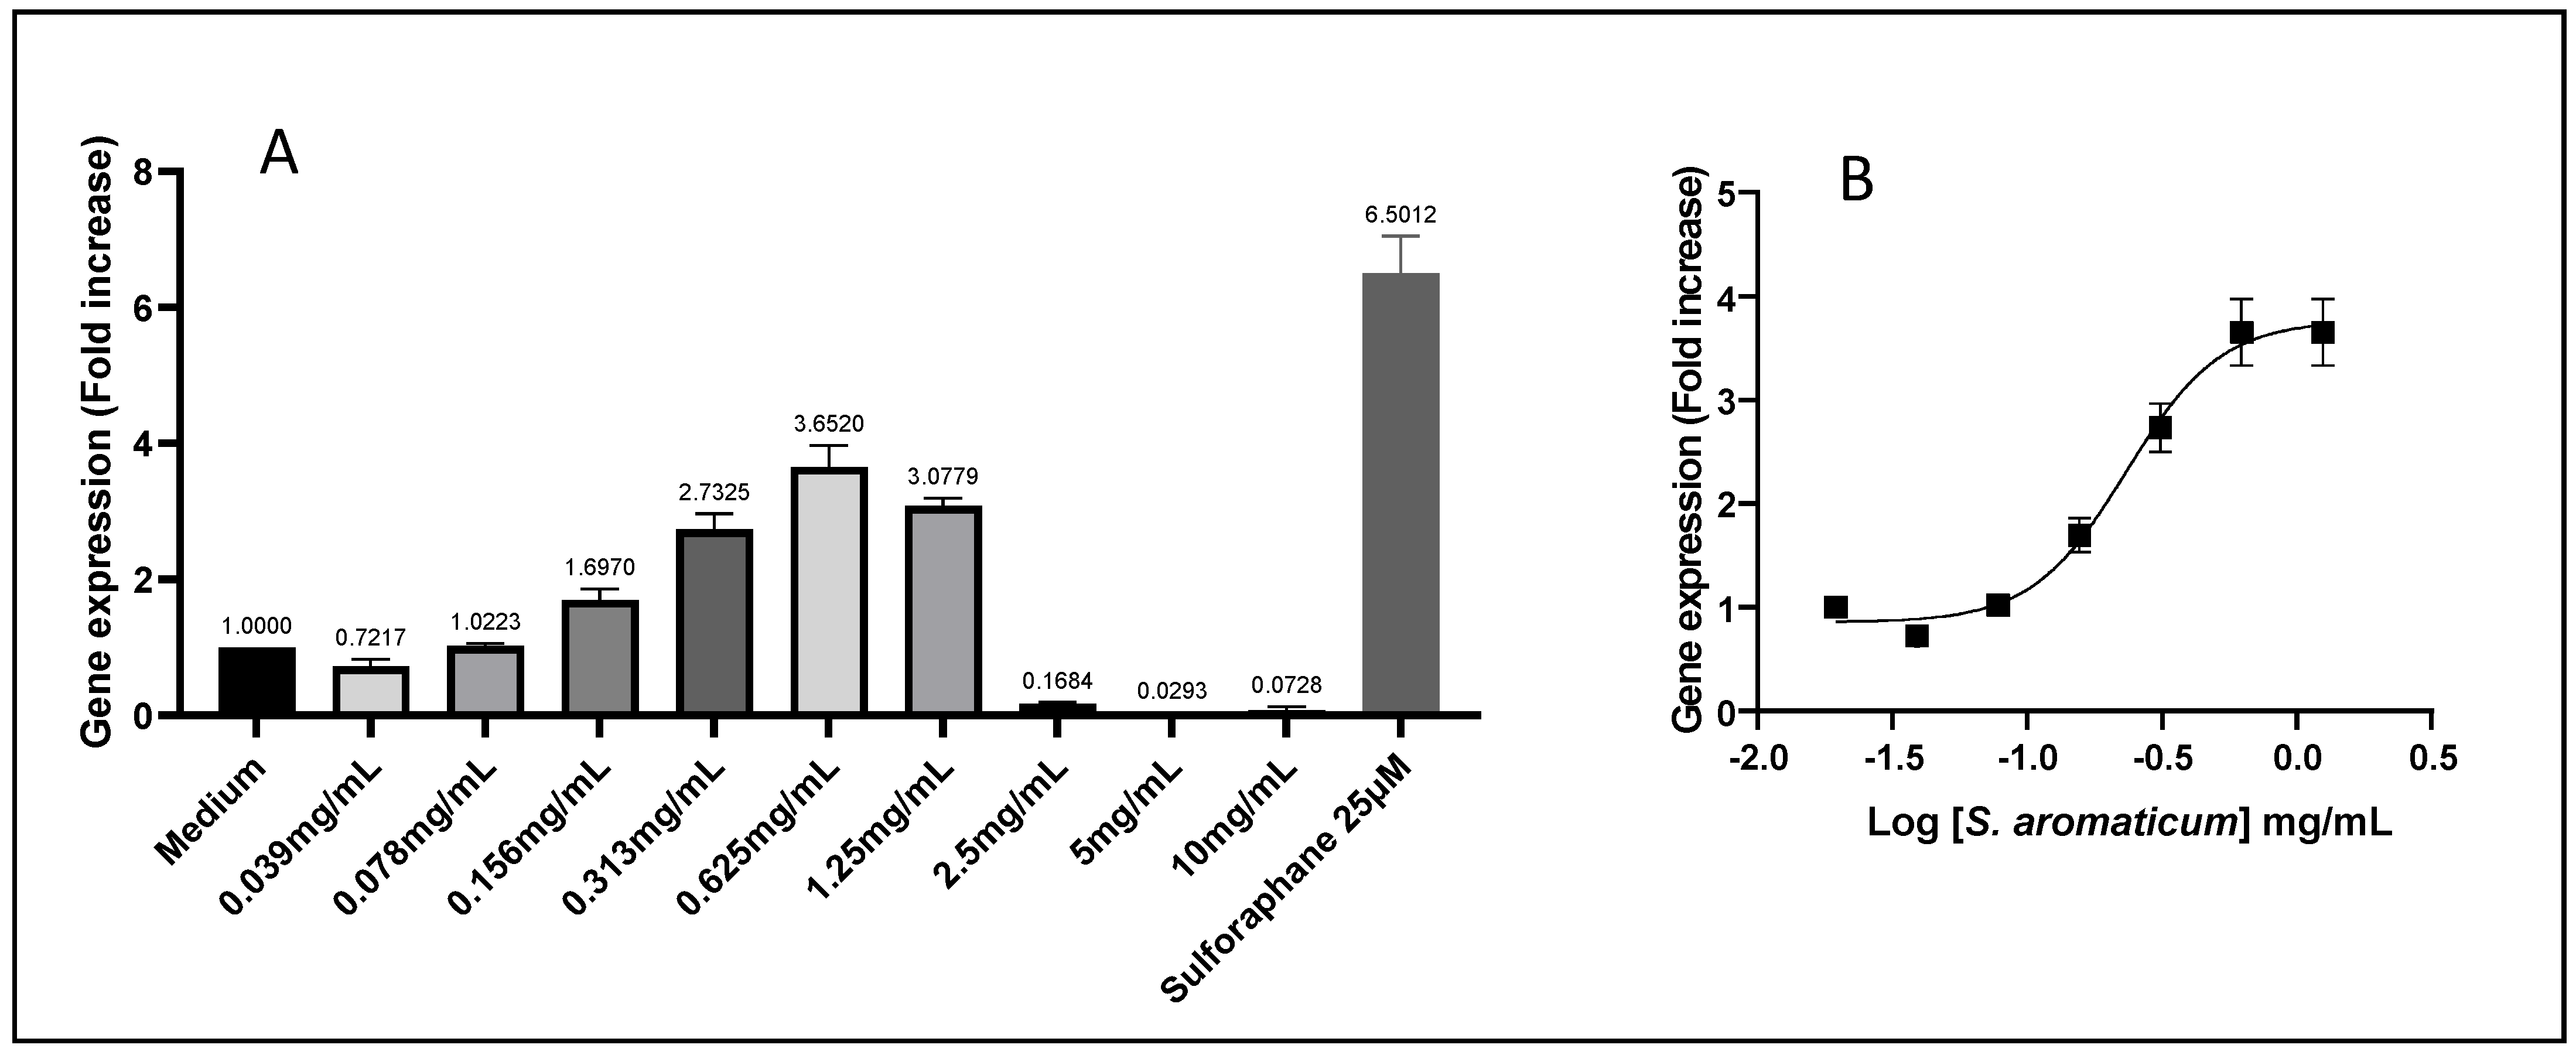
In the case of
S. aromaticum, for instance, the Nrf2/ARE antioxidant EC
50 was evaluated at 233 μg/mL in HepG2 cells, the lowest value among the 12 tested extracts (
Table 4). This extract also gave EC
50s in the range of 10 micromolar in the AOP1 free-radical-scavenging assay, both in the Caco-2 and HepG2 models (
Table 3). With an increase of 2.78 times the gene expression induced by Nrf2/ARE, the
S. aromaticum extract also showed the best post-intestinal barrier antioxidant effect of all the tested conditions (
Figure 5). It is well-known that clove contains polyphenols, such as hydroxybenzoic acids, hydroxyphenyl propene, hydroxycinnamic acids and eugenol—the major bioactive compound—and gallic acid derivatives, such as hydrolysable tannins [
22]. Moreover, clove contains flavonoids (kaempferol, quercetin, etc.) and phenolic acids (salicylic, ferulic, ellagic and caffeic acids, etc.) [
23], all known to exert antioxidant effects. The main polyphenols detected in our extract are presented in
Table 7. The superiority of flavonoid content and antioxidant activity in crude clove has been observed in comparison with many other crude plants (even
Curcuma longa) [
24]. In accordance with our extract characterization, the clove polyphenols responsible for antioxidant activities have been notably highlighted as quercetin glucoside, isorhamnetin, biflorin and other derivatives [
25,
26,
27]. Specifically, some of these compounds have also demonstrated direct implications and support for the detoxification process, notably through Nrf2 activation [
28,
29]. In a previous study, an H
2O
2 scavenging activity could be detected in cell-free assays of clove bud oil and, to a lesser extent, in clove bud [
30]. Another study has demonstrated that water extraction of clove presented a higher yield in extraction of flavonoids and antioxidant activity in vitro, compared to ethanol or ethyl acetate solvent extraction [
31]. In streptozotocin-induced diabetic rats, treatment with the bark extract of
S. aromaticum increased the expression of Nrf2 protein, leading to an upregulation of glyoxalase 1 and a downregulation of the receptor for AGEs [
32]. In the present study, the data collected from the HepG2 human liver cells showed high free-radical-quenching and Nrf2 activities. This antioxidant activity of
S. aromaticum in this cell model is not surprising, as the plant has already proven effective for liver support in other contexts. Clove has been reported for liver protection in traditional uses in India [
33]. Many in vivo studies have demonstrated the hepatoprotective effects of clove extracts and crude powder, such as significant toxicity modulation [
34], notable antioxidant activities [
35] and restoration of normal hepatic safety parameters [
36].
Similar to
S. aromaticum, the
H. italicum extract gave an Nrf2/ARE EC
50 of 390.5 μg/mL in Caco-2 cells (
Table 4), and an AOP1 EC
50 of 76.25 μg/mL in the Caco-2 model (
Table 3), while showing a significant increase in Nrf2/ARE induction in the post-intestinal barrier compartment. Immortelle is also known to produce antioxidants. Kramberger et al. [
37] recently reviewed clinical trials and internal uses for the immortelle aerial part, and they reported that the main active components were phenolic acids, such as caffeic acid and chlorogenic acid, and its derivatives. The same team also reported the presence of flavonoids, namely pinocembrin, quercetin and naringenin [
38]. Other identified components were triterpenoids (ursolic acid), acetophenones, phloroglucinols, pyrones and sesquiterpenes, which are all good candidates as antioxidants. The list of main polyphenols we detected in our extract (
Table 7) are in line with other data [
39]. One of these compounds, leontopodic acid, has demonstrated antioxidant and protective effects against mycotoxin in immunity cells [
40]. Interestingly, the analysis of antioxidant capacity by the DPPH radical assay showed that the use of
H. italicum subspecies (HIT vs. HII) extracted by different procedures led to different results, unrelated to the total phenolic content yield. According to another report, arzanol, a pyrone-phloroglucinol heterodimer, seems to be the most characteristic compound of immortelle that showed a protective effect against lipid oxidation after tert-butyl hydroperoxide (TBH) induction in the plasma membranes of Vero and Caco-2 cells [
41]. Scopoletin, another coumarin phenolic compound, was very recently isolated from
H. italicum and other plants [
42]. Interestingly, scopoletin has been shown to exert free-radical-scavenging activity in
Morinda citrifolia (noni fruit) [
43] and activate the Keap1-Nrf2/ARE pathway in SH-SY5Y cells [
44].
With an Nrf2/ARE EC
50 of 634 μg/mL measured in Caco-2 cells (
Table 4), and AOP1 EC
50s of, respectively, 18.58 and 23 μg/mL in the Caco-2 and HepG2 models (
Table 3),
H. virginiana is one of the strongest antioxidant extracts tested in this study. As with the two previously discussed extracts, it also showed a significant Nrf2/ARE induction in the post-intestinal barrier compartment. Witch hazel (
H. virginiana) has long been used in traditional herbal medicine, and its antioxidant activities have been utilized for decades [
45]. The bark polyphenols are mainly hamamelitannin and various proanthocyanidins (PACs). On the other hand, the leaf polyphenols are a mixture of gallotannins and PACs [
46]. The main polyphenols specifically detected in our samples are presented in
Table 7. The superoxide scavenging properties of hamamelitannin were demonstrated using electron spin resonance (ESR) [
47]. Fractions rich in pyrogallol-containing polyphenols, such as proanthocyanidins, gallotannins and gallates, were shown to be active as free-radical scavengers in HAT (hydrogen atom transfer) and SET (single-electron transfer) assays. Additionally, it was found that they are able to protect red blood cells from free radical induced hemolysis [
48].
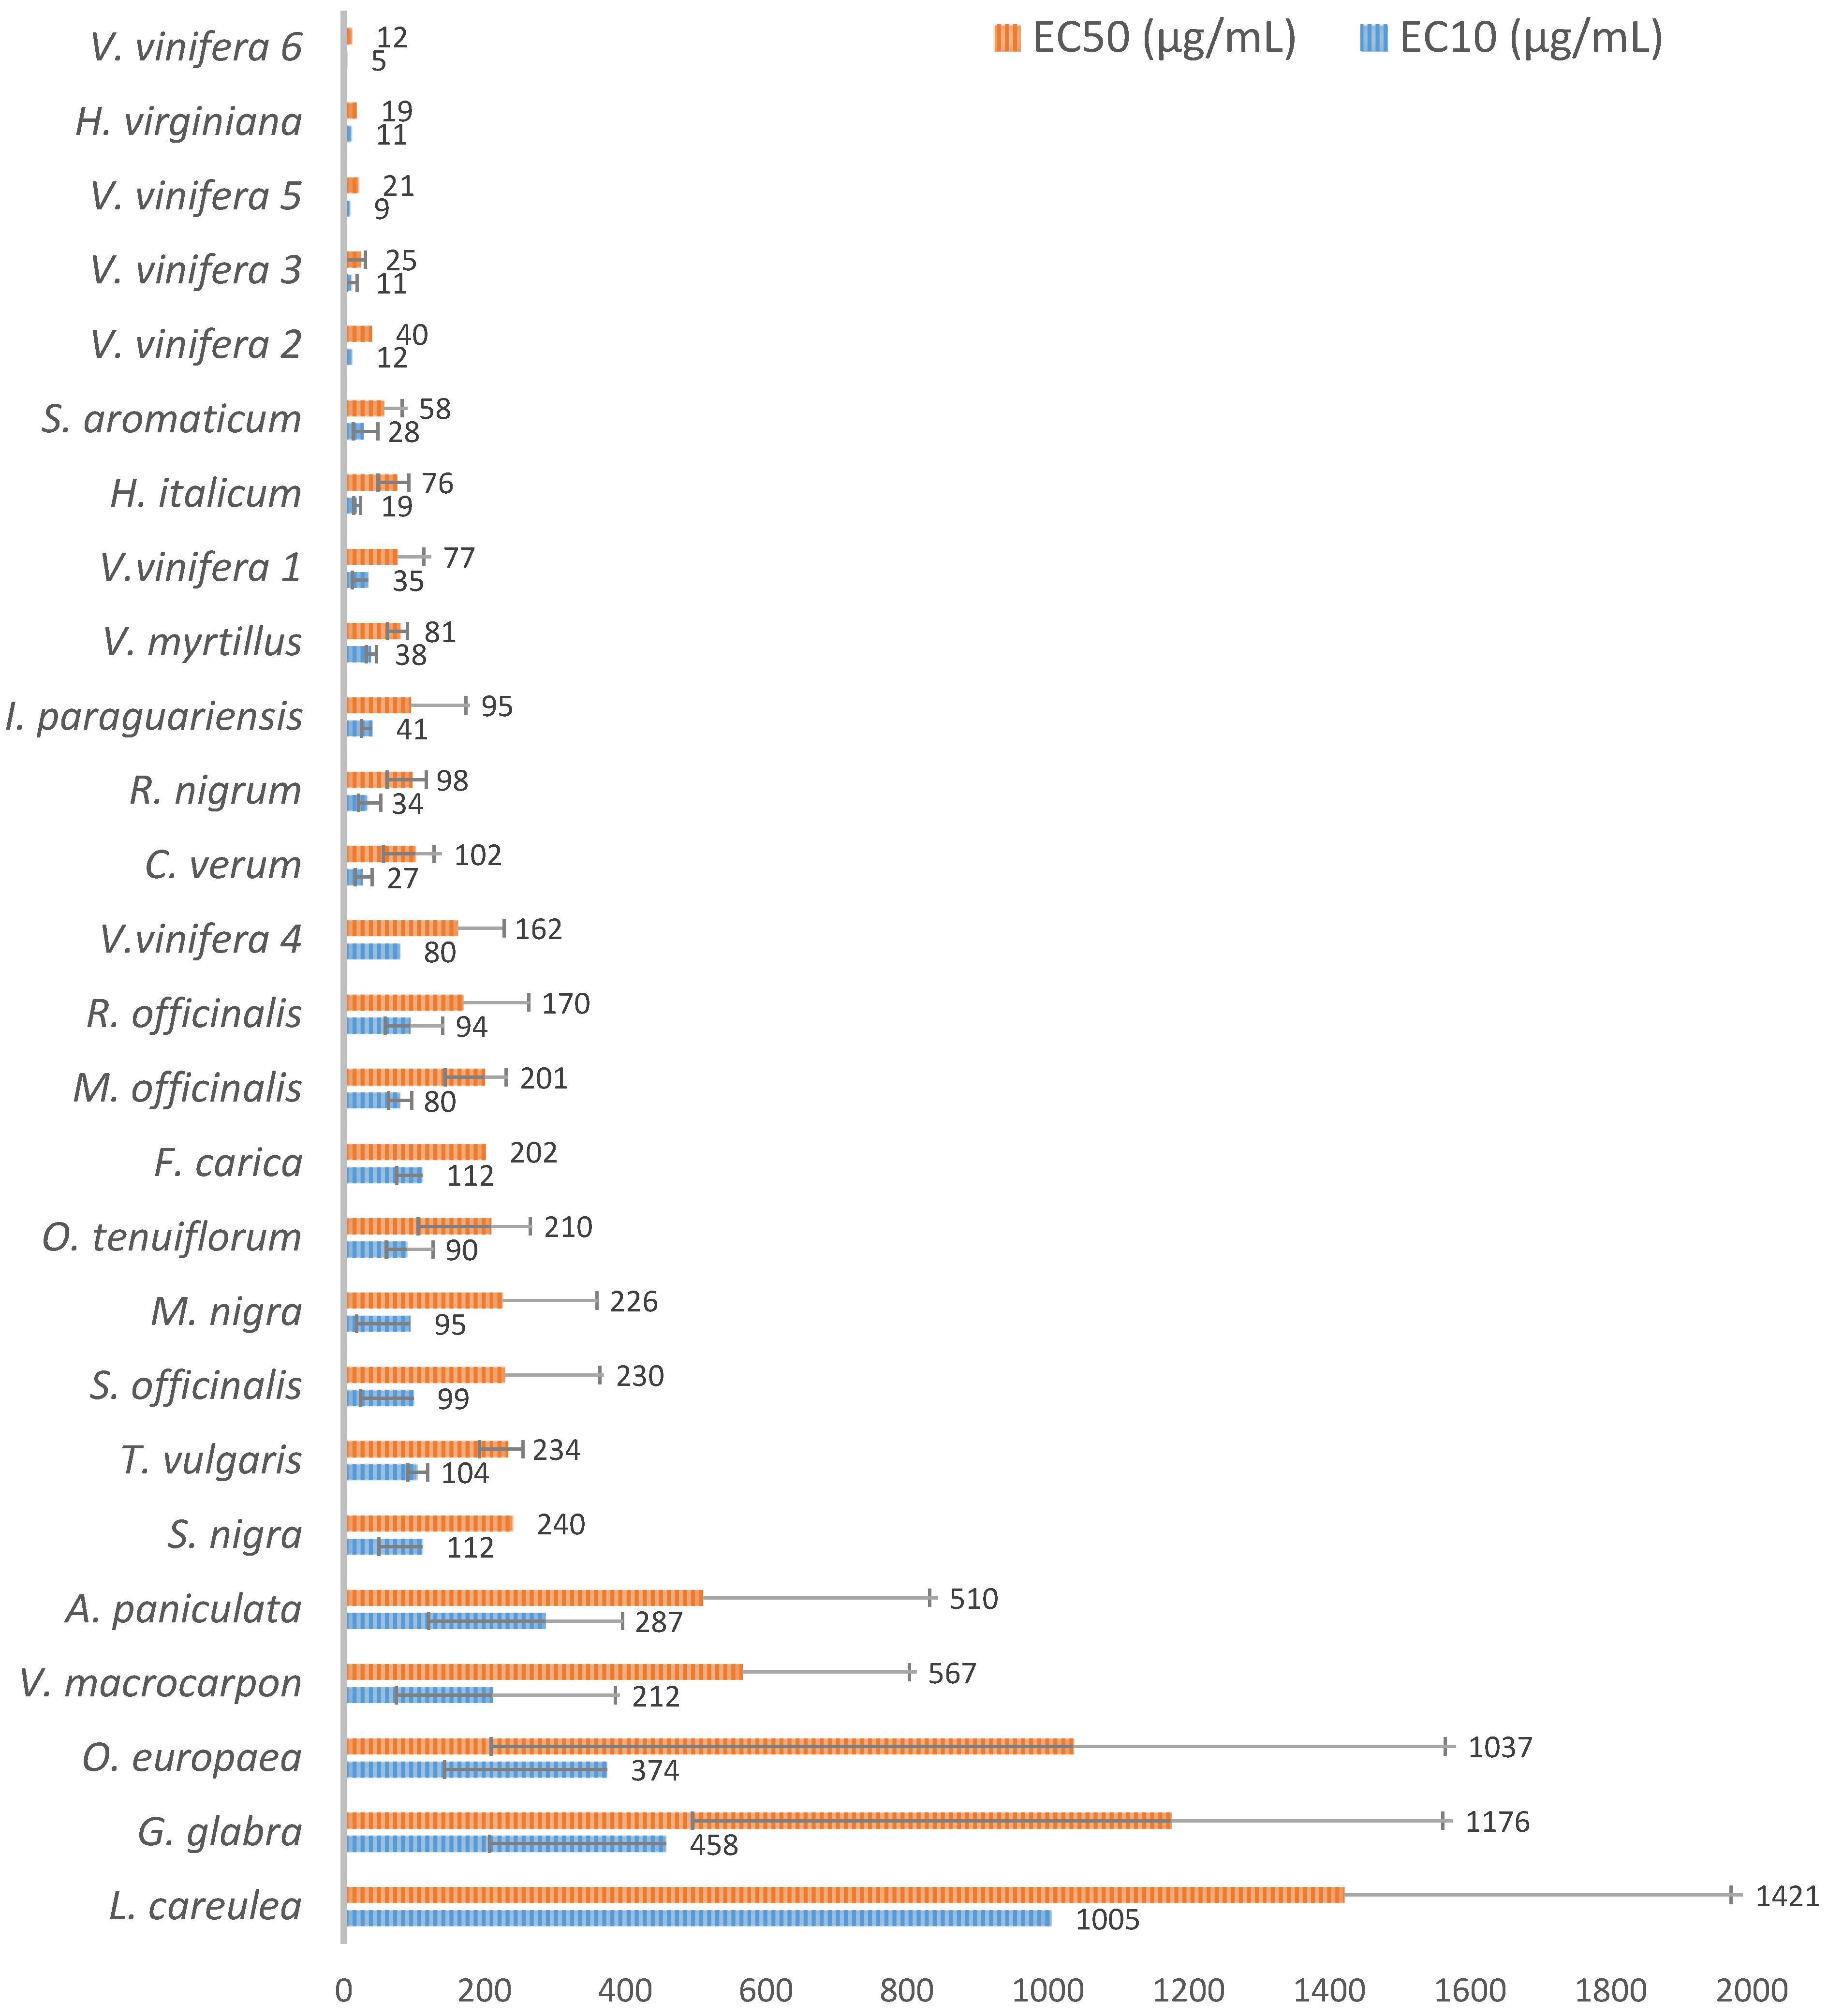
The six different
V. vinifera extracts used in the present study (three originating from the seed, two from the fruit pomace and one from the leaf) all showed very strong cell antioxidant activities, with AOP1 EC
50s ranging from 11.62 to 162.2 μg/mL in Caco-2 cells (
Figure 2). Notably, the two highest activities, EC
50s = 11.62 and 20.96 μg/mL, were found in seed extracts after aqueous extraction and purification (
Table 1), followed by pomace extracts with EC
50s = 24.62 and 40.11 μg/mL and the leaf extract with EC
50 = 76.75 μg/mL. These results are in agreement with several previous in vitro studies that identified seeds as the first reservoir of antioxidant compounds in grape. Grapes are also known to contain large amounts of polyphenols. Flavonoids are mainly located in the skin of the berry, whereas flavan-3-ols (catechins and proanthocyanidins) are present both in the skin and in the seed [
49]. For comparison, the antioxidant compounds detected in our sample are presented in
Table 7. The total phenolic content and antioxidant capacities (AC) (DPPH, ABTS and FRAP approaches) were determined in a previous study for different parts (pulp, seed and skin) of seven white and fifteen red grape cultivars [
50]. Seeds presented the highest ACs, followed by skin and pulp. The same approaches were used in another study to show that the AC was highest in seeds and increased by the altitude [
51]. Oligomeric and polymeric procyanidins were also isolated from grape seeds, with the polymeric form presenting the highest ACs, followed by oligomers and monomeric forms of catechins [
52]. The trend seems to be different in the context of Nrf2/ARE pathway activation. In this study, we were unable to show any increase in Nrf2/ARE activity in the two
V. vinifera extracts originating from seeds (
Figure 5). However, the leaf extract showed a significant induction of the gene transcription pathway, with an EC
50 around 661 μg/mL. As a comparison, the work of Esatbeyoglu et al. [
53] can be considered here. In this work, the authors have studied the Nrf2 pathway activation of a root extract of
V. vinifera in the Huh7 human liver hepatoma cell line. They concluded that the extract, at a concentration of 50 μg/mL, significantly induced Nrf2 and its downstream target genes, heme oxygenase-1 (HO-1) and γ-glutamylcysteine synthetase (γ-GCS). Eventually, two studies carried out on rat models showed that the consumption of grapes by hypertensive rats reduced heart failure and increased Nrf2 transcription factor activity [
54], while in a model of cardiorenal-injured rats, a combination of silymarin and
V. vinifera extract synergistically promoted the activation of the Keap1/Nrf2 signaling pathway [
55].
This study has brought to light that, among the two main antioxidant approaches we could assay on cell systems, only the ARE/Nrf2 pathway activation is detectable downstream of the intestinal barrier. The Antioxidant Response Element (ARE) is known to regulate a pool of around 600 genes coding for multiple enzymes and regulatory proteins involved in the redox modulation and detoxification processes [
56,
57]. The ARE/Nrf2 is a regulatory pathway shared by all cells, but its importance has been established in vivo in different pathological contexts [
58], such as liver tissues, which are the location of detoxification processes [
59,
60]; ocular diseases [
61], including diseases of the macula, which is widely exposed to UV rays and visible light [
62]; erectile dysfunction [
63]; neurological disorders [
64]; and inflammation [
65].


 and
and 


