
Nucleoredoxin Plays a Key Role in the Maintenance of Retinal Pigmented Epithelium Differentiation
 , , , and
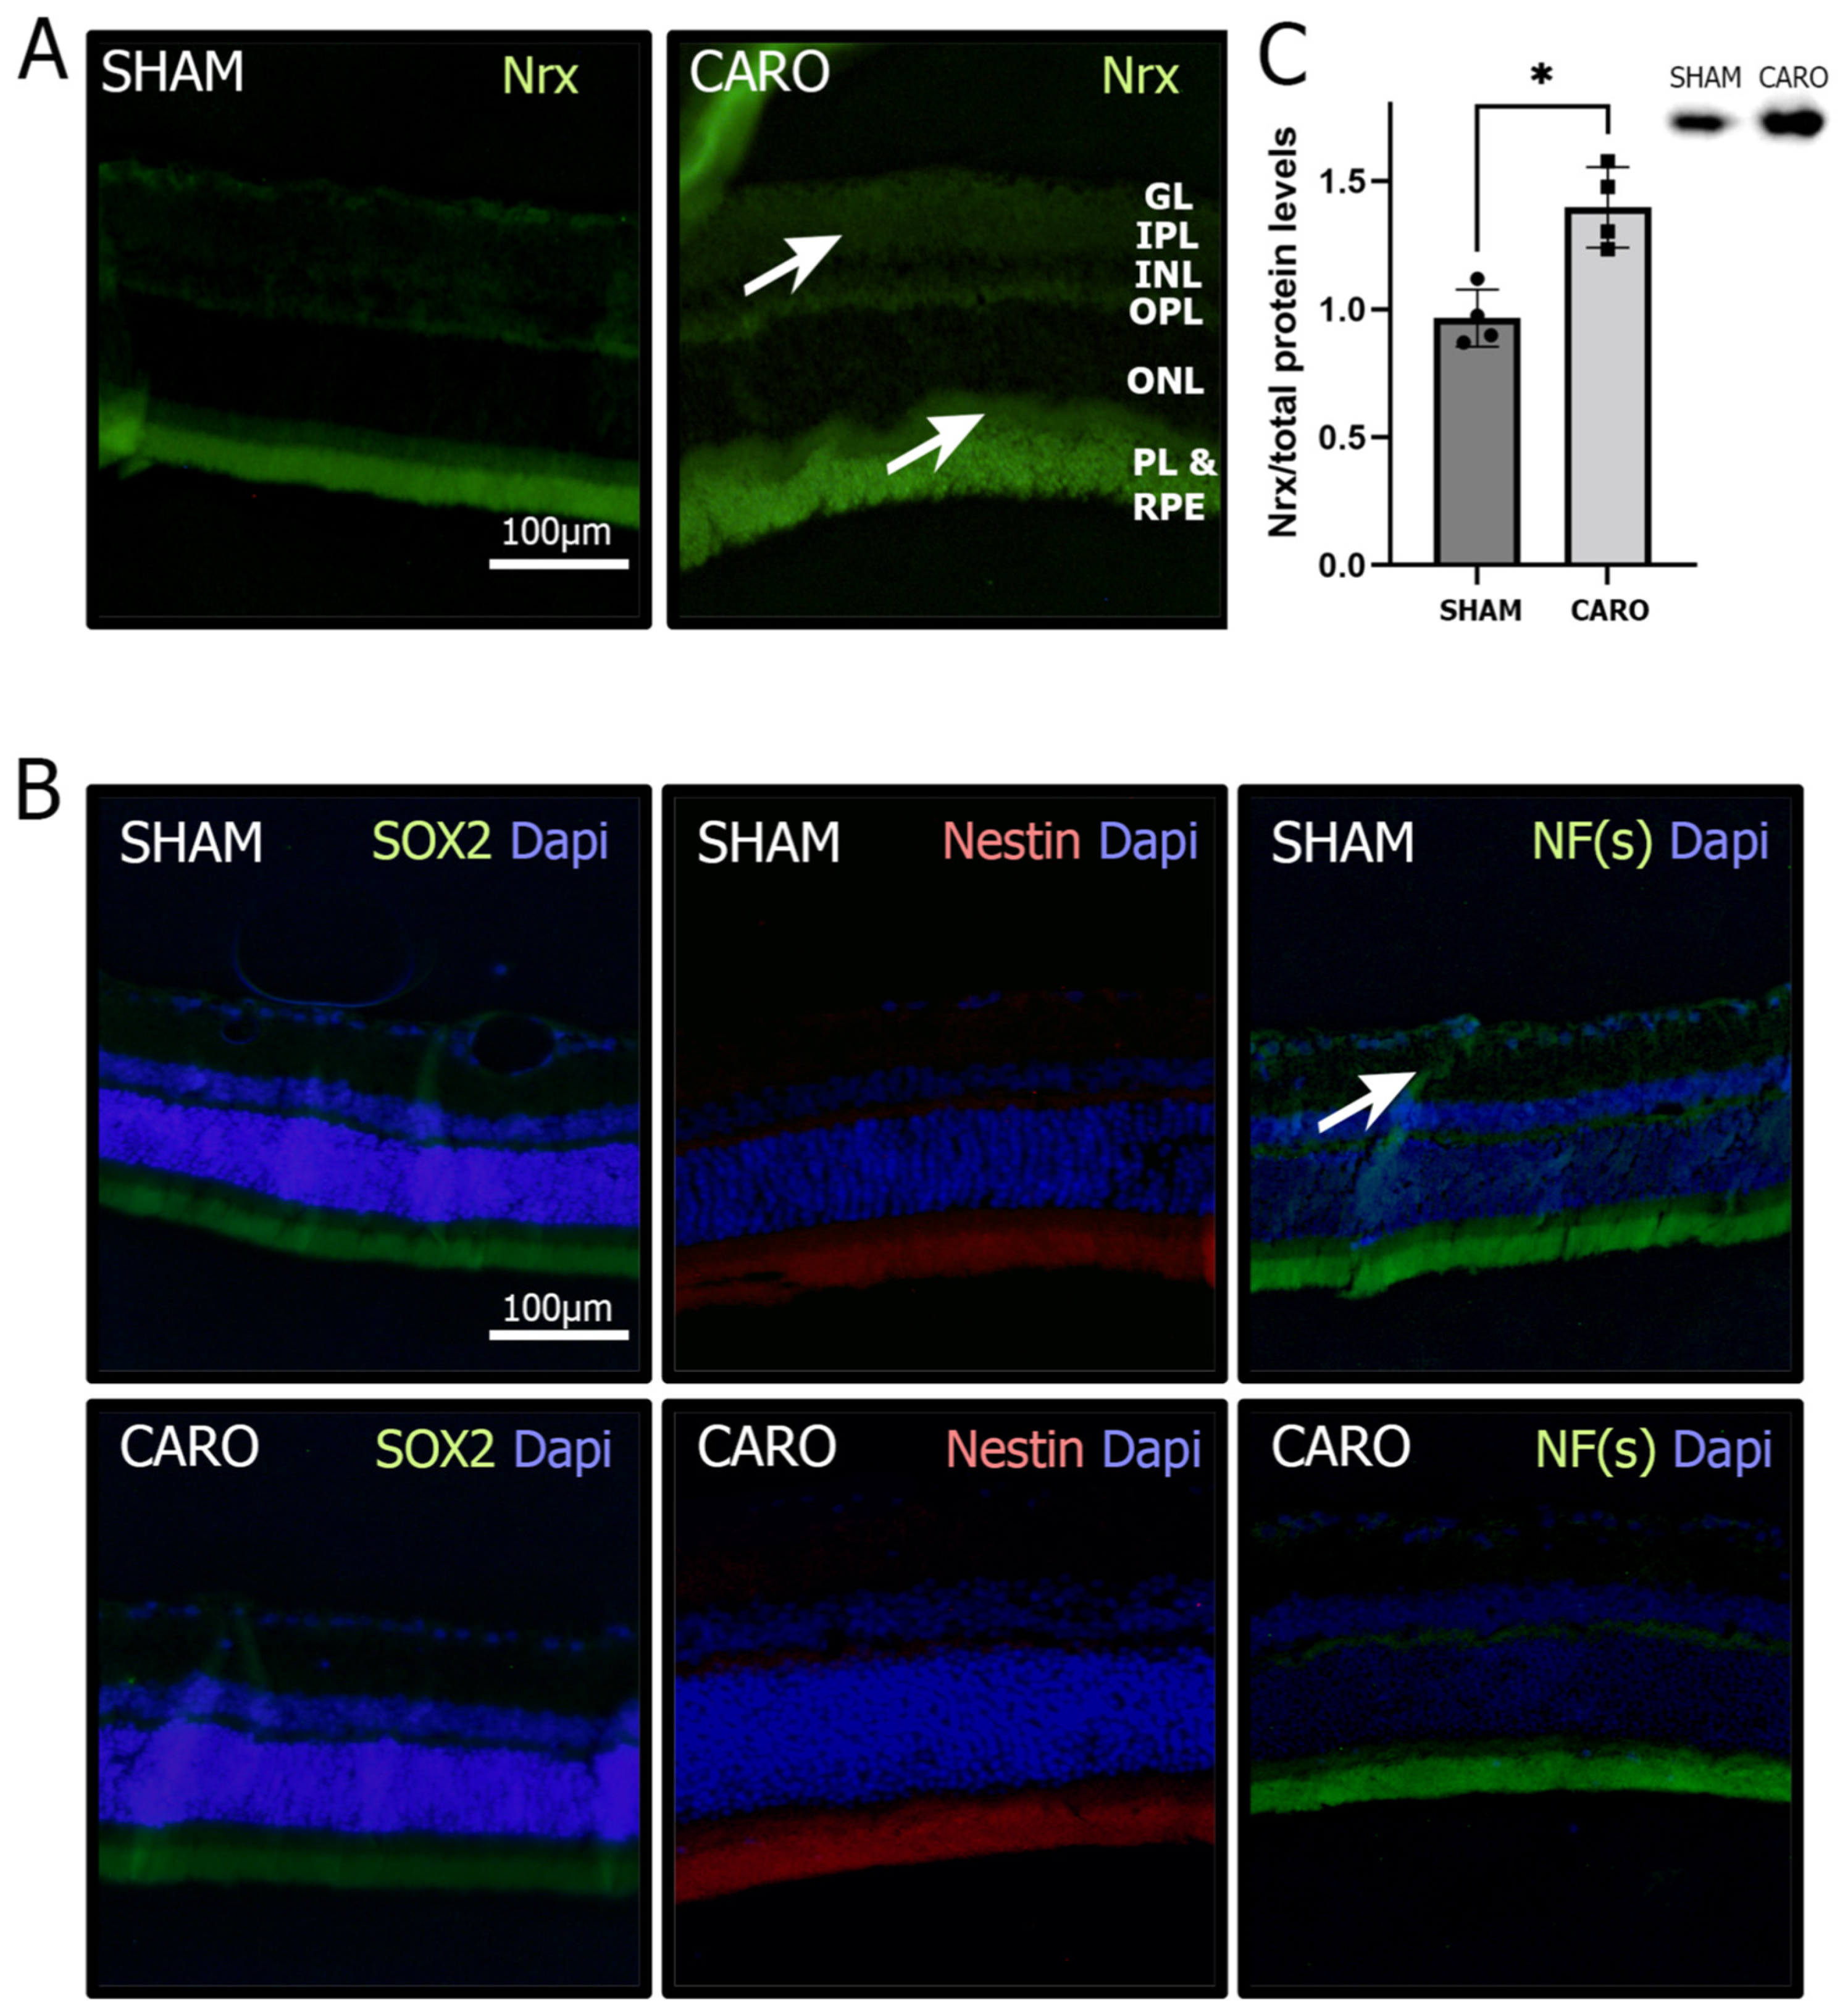
Abstract
:1. Introduction
2. Materials and Methods
2.1. Chemicals and Reagents
2.2. Ethical Statement
2.3. Animal Model of Perinatal Hypoxia-Ischemia
2.3.1. Tissue Processing
2.3.2. Immunohistochemistry
2.4. Cell Model: Hypoxia-Reoxygenation in ARPE-19 Cells
2.4.1. Gene Expression
2.4.2. Western Blotting
2.4.3. Immunocytochemistry
2.4.4. Nrx Knock-Down
2.4.5. MTT Assay
2.4.6. 2D and 3D Morphology Analysis
2.4.7. Sholl Analysis
2.4.8. VEGF Release
2.5. Statistical Analysis
3. Results
3.1. Nrx Levels Are Increased in Retinas Exposed to Neonatal Hypoxia-Ischemia
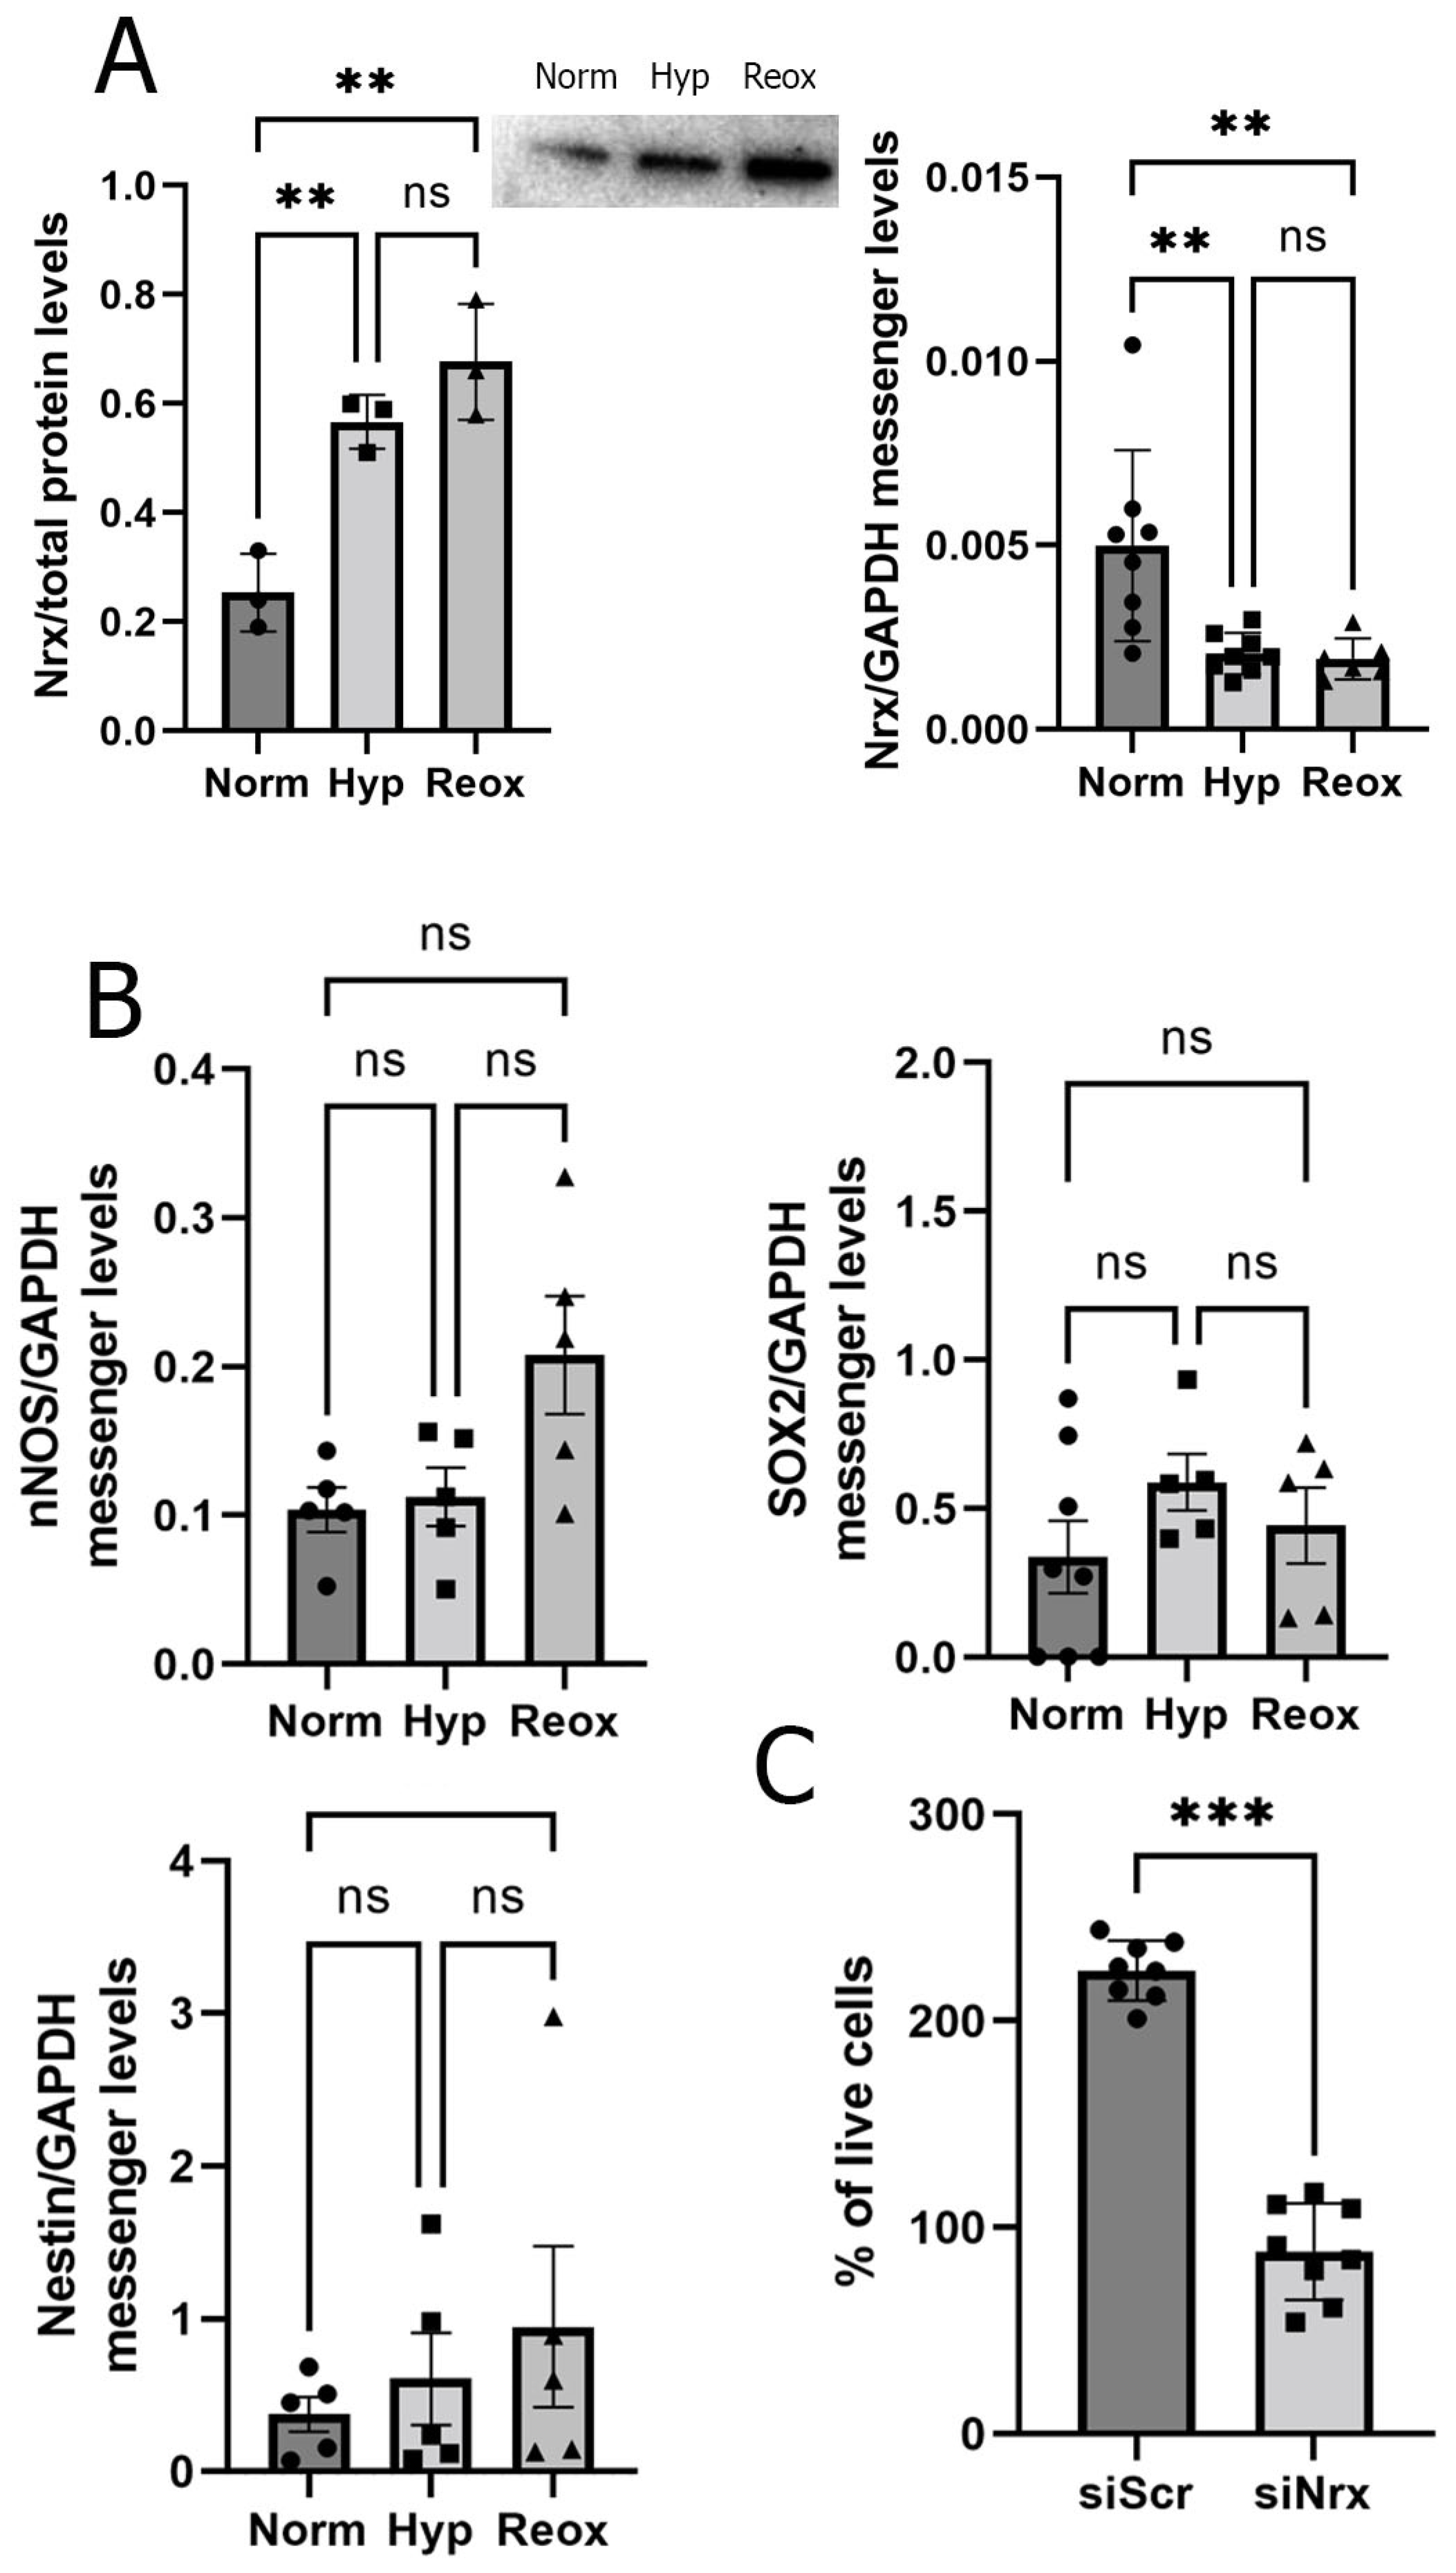
3.2. RPE Cells Exposed to Hypoxia and Reoxygenation Present Higher Levels of Nrx Protein but Lower Levels of Nrx mRNA
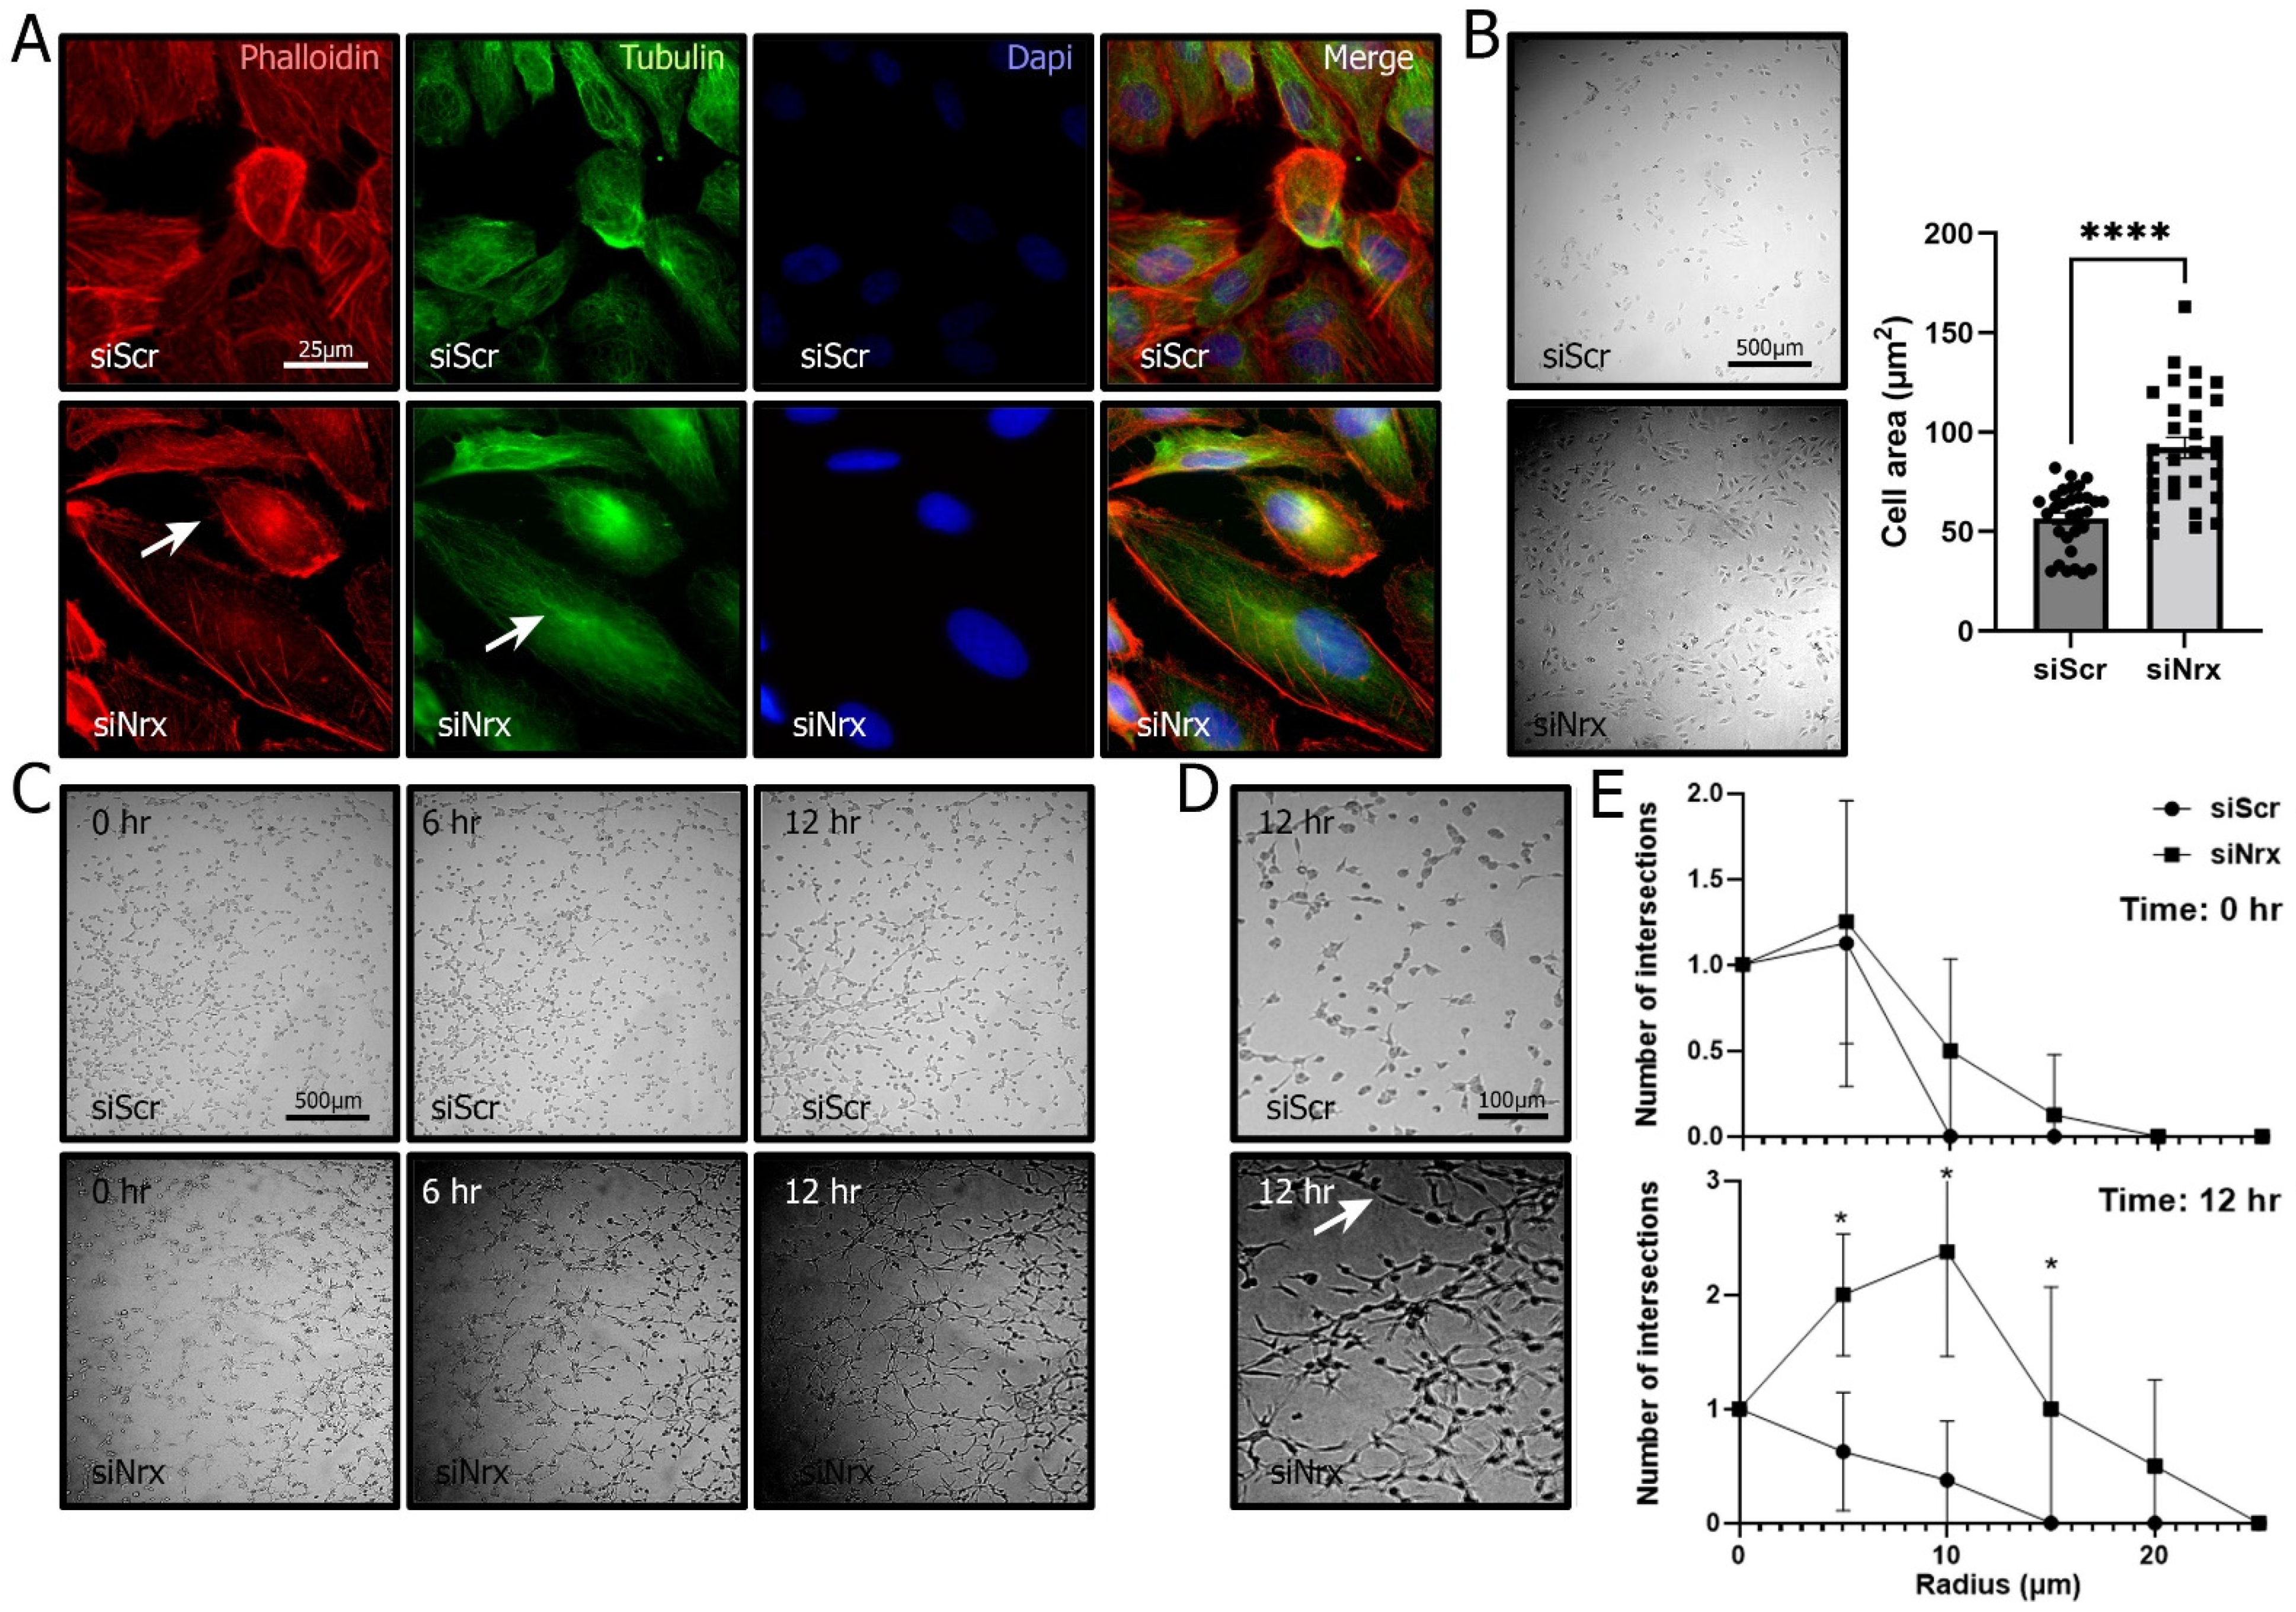
3.3. Nrx-Silenced ARPE-19 Cells have Lower Survival Levels and an Altered Morphology
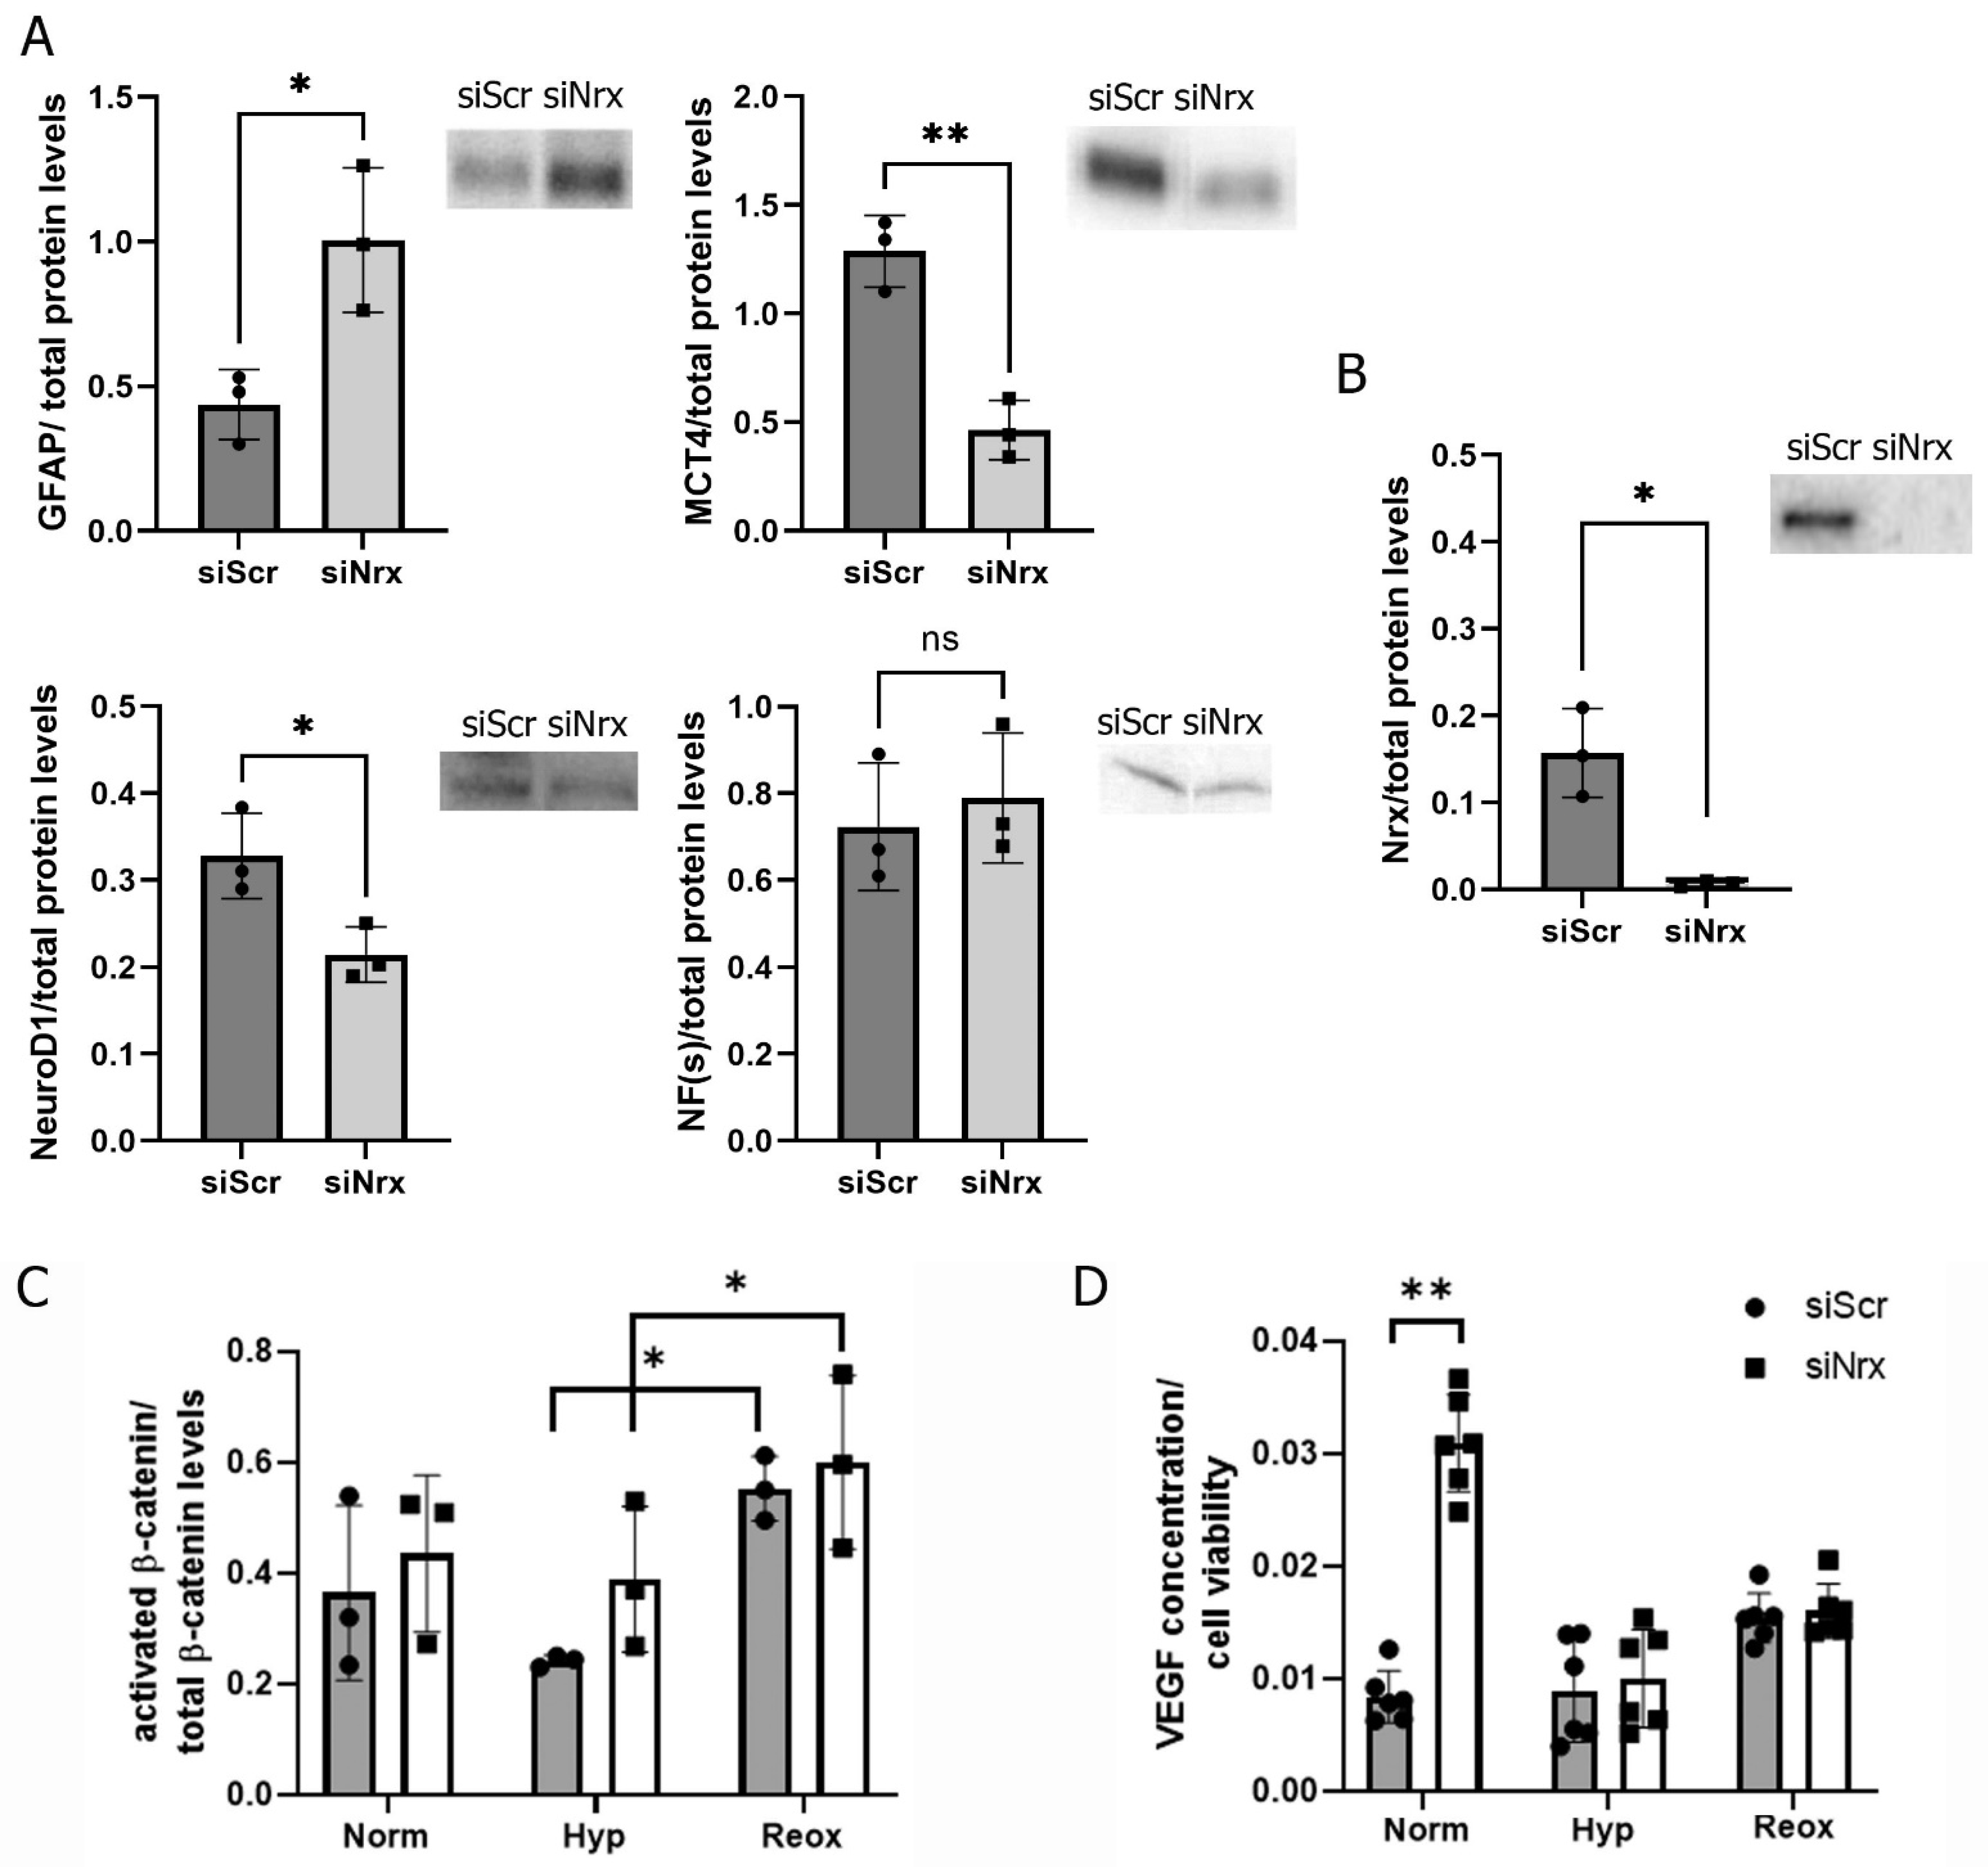
3.4. Nrx Silencing Induces Changes in ARPE-19 Cell Differentiation Levels
3.5. Nrx May Affect Cell Differentiation via VEGF Rather Than the Wnt/β-Catenin Pathway
4. Discussion
5. Conclusions
Supplementary Materials
Author Contributions
Funding
Institutional Review Board Statement
Informed Consent Statement
Data Availability Statement
Conflicts of Interest
References
- Kurooka, H.; Kato, K.; Minoguchi, S.; Takahashi, Y.; Ikeda, J.; Habu, S.; Osawa, N.; Buchberg, A.M.; Moriwaki, K.; Shisa, H.; et al. Cloning and characterization of the nucleoredoxin gene that encodes a novel nuclear protein related to thioredoxin. Genomics 1997, 39, 331–339. [Google Scholar] [CrossRef] [PubMed]
- Funato, Y.; Miki, H. Nucleoredoxin, a novel thioredoxin family member involved in cell growth and differentiation. Antioxid. Redox Signal. 2007, 9, 1035–1057. [Google Scholar] [CrossRef] [PubMed]
- Laughner, B.J.; Sehnke, P.C.; Ferl, R.J. A novel nuclear member of the thioredoxin superfamily. Plant Physiol. 1998, 118, 987–996. [Google Scholar] [CrossRef] [PubMed]
- Funato, Y.; Miki, H. Redox regulation of Wnt signalling via nucleoredoxin. Free Radic. Res. 2010, 44, 379–388. [Google Scholar] [CrossRef]
- Rharass, T.; Lemcke, H.; Lantow, M.; Kuznetsov, S.A.; Weiss, D.G.; Panáková, D. Ca2+-mediated mitochondrial reactive oxygen species metabolism augments Wnt/β-catenin pathway activation to facilitate cell differentiation. J. Biol. Chem. 2014, 289, 27937–27951. [Google Scholar] [CrossRef]
- Funato, Y.; Michiue, T.; Asashima, M.; Miki, H. The thioredoxin-related redox-regulating protein nucleoredoxin inhibits Wnt-beta-catenin signalling through dishevelled. Nat. Cell Biol. 2006, 8, 501–508. [Google Scholar] [CrossRef]
- Idelfonso-García, O.G.; Alarcón-Sánchez, B.R.; Vásquez-Garzón, V.R.; Baltiérrez-Hoyos, R.; Villa-Treviño, S.; Muriel, P.; Serrano, H.; Pérez-Carreón, J.I.; Arellanes-Robledo, J. Is Nucleoredoxin a Master Regulator of Cellular Redox Homeostasis? Its Implication in Different Pathologies. Antioxidants 2022, 11, 670. [Google Scholar] [CrossRef]
- Kneeshaw, S.; Keyani, R.; Delorme-Hinoux, V.; Imrie, L.; Loake, G.J.; Le Bihan, T.; Reichheld, J.P.; Spoel, S.H. Nucleoredoxin guards against oxidative stress by protecting antioxidant enzymes. Proc. Natl. Acad. Sci. USA. 2017, 114, 8414–8419. [Google Scholar] [CrossRef]
- Urbainsky, C.; Nölker, R.; Imber, M.; Lübken, A.; Mostertz, J.; Hochgräfe, F.; Godoy, J.R.; Hanschmann, E.-M.; Lillig, C.H. Nucleoredoxin-Dependent Targets and Processes in Neuronal Cells. Oxid. Med. Cell. Longev. 2018, 2018, 4829872. [Google Scholar] [CrossRef]
- Alonso-Alconada, D.; Álvarez, F.J.; Goñi-de-Cerio, F.; Hilario, E.; Álvarez, A. Cannabinoid-mediated Modulation of Oxidative Stress and Early Inflammatory Response after Hypoxia-Ischemia. Int. J. Mol. Sci. 2020, 21, 1283. [Google Scholar] [CrossRef]
- de Groot, H.; Rauen, U. Ischemia-Reperfusion Injury: Processes in Pathogenetic Networks: A Review. Transplant. Proc. 2007, 39, 481–484. [Google Scholar] [CrossRef] [PubMed]
- Johnston, M.V.; Trescher, W.H.; Ishida, A.; Nakajima, W. Neurobiology of hypoxic-ischemic injury in the developing brain. Pediatr. Res. 2001, 49, 735–741. [Google Scholar] [CrossRef] [PubMed]
- Ferriero, D.M. Oxidant Mechanisms in Neonatal Hypoxia-Ischemia. Dev. Neurosci. 2001, 23, 198–202. [Google Scholar] [CrossRef] [PubMed]
- Johnston, M.; Trescher, W.H.; Ishida, A.; Nakajima, W. Novel treatments after experimental brain injury. Semin. Neonatol. 2000, 5, 75–86. [Google Scholar] [CrossRef]
- Kalogeris, T.; Baines, C.P.; Krenz, M.; Korthuis, R.J. Cell Biology of Ischemia/Reperfusion Injury. Int. Rev. Cell Mol. Biol. 2012, 298, 229–317. [Google Scholar]
- Uria-Avellanal, C.; Robertson, N.J. Na+/H+ Exchangers and Intracellular pH in Perinatal Brain Injury. Transl. Stroke Res. 2014, 5, 79–98. [Google Scholar] [CrossRef]
- Edwards, A.D.; Azzopardi, D.V. Perinatal hypoxia-ischemia and brain injury. Pediatr. Res. 2000, 47, 431–432. [Google Scholar] [CrossRef]
- Johnston, M.V.; Fatemi, A.; Wilson, M.A.; Northington, F. Treatment advances in neonatal neuroprotection and neurointensive care. Lancet Neurol. 2011, 10, 372–382. [Google Scholar] [CrossRef]
- Romero, J.I.; Hanschmann, E.-M.; Gellert, M.; Eitner, S.; Holubiec, M.I.; Blanco-Calvo, E.; Lillig, C.H.; Capani, F. Thioredoxin 1 and glutaredoxin 2 contribute to maintain the phenotype and integrity of neurons following perinatal asphyxia. Biochim. Biophys. Acta 2015, 1850, 1274–1285. [Google Scholar] [CrossRef]
- Romero, J.I.; Holubiec, M.I.; Tornatore, T.L.; Rivière, S.; Hanschmann, E.-M.; Kölliker-Frers, R.A.; Tau, J.; Blanco, E.; Galeano, P.; Rodríguez de Fonseca, F.; et al. Neuronal Damage Induced by Perinatal Asphyxia Is Attenuated by Postinjury Glutaredoxin-2 Administration. Oxid. Med. Cell. Longev. 2017, 2017, 4162465. [Google Scholar] [CrossRef]
- Lillig, C.H.; Holmgren, A. Thioredoxin and Related Molecules-From Biology to Health and Disease. Antioxid. Redox Signal. 2007, 10, 1344–1365. [Google Scholar] [CrossRef] [PubMed]
- Garg, T.K.; Chang, J.Y. Oxidative stress causes ERK phosphorylation and cell death in cultured retinal pigment epithelium: Prevention of cell death by AG126 and 15-deoxy-delta 12, 14-PGJ2. BMC Ophthalmol. 2003, 3, 5. [Google Scholar] [CrossRef] [PubMed]
- German, O.L.; Buzzi, E.; Rotstein, N.P.; Rodríguez-Boulan, E.; Politi, L.E. Retinal pigment epithelial cells promote spatial reorganization and differentiation of retina photoreceptors. J. Neurosci. Res. 2008, 86, 3503–3514. [Google Scholar] [CrossRef] [PubMed]
- Chtcheglova, L.A.; Ohlmann, A.; Boytsov, D.; Hinterdorfer, P.; Priglinger, S.G.; Priglinger, C.S. Nanoscopic Approach to Study the Early Stages of Epithelial to Mesenchymal Transition (EMT) of Human Retinal Pigment Epithelial (RPE) Cells In Vitro. Life 2020, 10, 128. [Google Scholar] [CrossRef] [PubMed]
- Li, K.R.; Zhang, Z.Q.; Yao, J.; Zhao, Y.X.; Duan, J.; Cao, C.; Jiang, Q. Ginsenoside Rg-1 protects retinal pigment epithelium (RPE) cells from cobalt chloride (CoCl2) and hypoxia assaults. PLoS ONE. 2013, 8, e84171. [Google Scholar] [CrossRef] [PubMed]
- Tsui, I.; Chu, A. Hot Topics in Retinopathy of Prematurity. Pediatric Ann. 2017, 46, 11. [Google Scholar] [CrossRef]
- Zhang, X.; Wang, Y.; Ulrich, J.N.; Yang, Y.; Ding, L.; Yang, Y.; Xu, D.; Tarczy-Hornoch, K.; Cabrera, M.T. Evaluation of retinopathy of prematurity incidence with telemedicine confirmation in Gansu, China: A pilot study. Ophthalmic Epidemiol. 2018, 25, 120–125. [Google Scholar] [CrossRef]
- Fernández, J.C.; Peláez, R.; Rey-Funes, M.; Soliño, M.; Contartese, D.S.; Dorfman, V.B.; López-Costa, J.J.; Larrayoz, I.M.; Loidl, C.F. Alfredo Martínez. Methylene Blue Prevents Retinal Damage Caused by Perinatal Asphyxia in the Rat. Front. Cell Neurosci. 2020, 14, 157. [Google Scholar] [CrossRef]
- Wallsh, J.O.; Gallemore, R.P. Anti-VEGF-Resistant Retinal Diseases: A Review of the Latest Treatment Options. Cells. 2021, 10, 1049. [Google Scholar] [CrossRef]
- Dudley, A.C.; Thomas, D.; Best, J.; Jenkins, A. A VEGF/JAK2/STAT5 axis may partially mediate endothelial cell tolerance to hypoxia. Biochem. J. 2005, 390, 427–436. [Google Scholar] [CrossRef]
- Ohlmann, A.; Scholz, M.; Koch, M.; Tamm, E.R. Epithelial-mesenchymal transition of the retinal pigment epithelium causes choriocapillaris atrophy. Histochem. Cell Biol. 2016, 146, 769–780. [Google Scholar] [CrossRef] [PubMed]
- Rice, J.E., 3rd; Vannucci, R.C.; Brierley, J.B. The influence of immaturity on hypoxic-ischemic brain damage in the rat. Ann. Neurol. 1981, 2, 131–141. [Google Scholar] [CrossRef] [PubMed]
- Vannucci, R.C.; Vannucci, S.J. Perinatal hypoxic-ischemic brain damage: Evolution of an animal model. Dev. Neurosci. 2005, 27, 81–86. [Google Scholar] [CrossRef] [PubMed]
- López-Aguilera, F.; Plateo-Pignatari, M.G.; Biaggio, V.; Ayala, C.; Seltzer, A.M. Hypoxic preconditioning induces an AT2-R/VEGFR-2(Flk-1) interaction in the neonatal brain microvasculature for neuroprotection. Neuroscience 2012, 216, 1–9. [Google Scholar] [CrossRef]
- Dunn, K.C.; Aotaki-Keen, A.E.; Putkey, F.R.; Hjelmeland, L.M. ARPE-19, a human retinal pigment epithelial cell line with differentiated properties. Exp. Eye Res. 1996, 62, 69–155. [Google Scholar] [CrossRef]
- Weiter, J.J.; Zuckerman, R. The influence of the photoreceptor-RPE complex on the inner retina. An explanation for the beneficial effects of photocoagulation. Ophthalmology 1980, 87, 1133–1139. [Google Scholar] [CrossRef]
- Kurihara, T.; Westenskow, P.D.; Gantner, M.L.; Usui, Y.; Schultz, A.; Bravo, S.; Aguilar, E.; Wittgrove, C.; Friedlander, M.S.; Paris, L.P.; et al. Hypoxia-induced metabolic stress in retinal pigment epithelial cells is sufficient to induce photoreceptor degeneration. Elife. 2016, 5, e14319. [Google Scholar] [CrossRef]
- Cheng, A.; Wang, S.; Cain, J.; Rao, M.S.; Mattson, M.P. Nitric oxide acts in a positive feedback loop with BDNF to regulate neural progenitor cell proliferation and differentiation in the mammalian brain. Dev. Biol. 2003, 258, 319–333. [Google Scholar] [CrossRef]
- Hol, E.M.; Pekny, M. Glial fibrillary acidic protein (GFAP) and the astrocyte intermediate filament system in diseases of the central nervous system. Curr. Opin. Cell Biol. 2015, 32, 121–130. [Google Scholar] [CrossRef]
- Casper, K.; McCarthy, K.D. GFAP-positive progenitor cells produce neurons and oligodendrocytes throughout the CNS. Mol. Cell. Neurosci. 2006, 31, 676–684. [Google Scholar] [CrossRef]
- Garcia, D.R.; Doan, N.B.; Imura, T.; Bush, T.G.; Sofroniew, M.V. GFAP-expressing progenitors are the principal source of constitutive neurogenesis in adult mouse forebrain. Nat. Neurosci. 2004, 7, 1233–1241. [Google Scholar] [CrossRef] [PubMed]
- Mao, C.A.; Wang, S.W.; Pan, P.; Klein, W.H. Rewiring the retinal ganglion cell gene regulatory network: Neurod1 promotes retinal ganglion cell fate in the absence of Math5. Development 2008, 135, 3379–3388. [Google Scholar] [CrossRef] [PubMed]
- Lobsiger, C.S.; Cleveland, D.W. Neurofilaments: Organization and Function in Neurons. Encycl. Neurosci. 2009, 6, 433–436. [Google Scholar]
- Rafikia, A.; Boullanda, J.L.; Halestrapb, A.P.; Ottersena, O.P.; Bergersena, L. Highly differential expression of the monocarboxylate transporters MCT2 and MCT4 in the developing rat brain. Neuroscience 2003, 122, 677–688. [Google Scholar] [CrossRef] [PubMed]
- Gao, C.; Zhoub, L.; Zhuc, W.; Wang, H.; Wang, R.; Hec, Y.; Li, Z. Monocarboxylate transporter-dependent mechanism confers resistance to oxygen- and glucose-deprivation injury in astrocyte-neuron co-cultures. Neurosci. Lett. 2015, 594, 99–104. [Google Scholar] [CrossRef] [PubMed]
- Hong, S.; Ahn, J.Y.; Cho, G.-S.; Kim, I.H.; Cho, J.H.; Ahn, J.H.; Park, J.H.; Won, M.H.; Chen, B.H.; Shin, B.N.; et al. Monocarboxylate transporter 4 plays a significant role in the neuroprotective mechanism of ischemic preconditioning in transient cerebral ischemia. Neural. Regen. Res. 2015, 10, 1604–1611. [Google Scholar]
- González, A.; González-González, A.; Alonso-González, C.; Menéndez-Menéndez, J.; Martínez-Campa, C.; Cos, S. Melatonin inhibits angiogenesis in SH-SY5Y human neuroblastoma cells by downregulation of VEGF. Oncol Rep. 2017, 37, 2433–2440. [Google Scholar] [CrossRef]
- Jiao, S.; Xu, H.; Xu, J.; Zhan, Y.; Zhang, S. Effect of VEGF on neural differentiation of human embryonic stem cells in vitro. J. Huazhong Univ. Sci. Technolog. Med. Sci. 2009, 29, 563–566. [Google Scholar] [CrossRef]
- Sun, J.; Sha, B.; Zhou, W.; Yang, Y. VEGF-mediated angiogenesis stimulates neural stem cell proliferation and differentiation in the premature brain. Biochem. Biophys. Res. Commun. 2010, 394, 146–152. [Google Scholar] [CrossRef]
- Novo, E.; Parola, M. Redox mechanisms in hepatic chronic wound healing and fibrogenesis. Fibrogenesis Tissue Repair 2008, 1, 5. [Google Scholar] [CrossRef]
- Kozlowski, M.R. The ARPE-19 cell line: Mortality status and utility in macular degeneration research. Curr. Eye Res. 2015, 40, 501–509. [Google Scholar] [CrossRef] [PubMed]
- Stern, J.; Temple, S. Retinal pigment epithelial cell proliferation. Exp. Biol Med. 2015, 240, 1079–1086. [Google Scholar] [CrossRef] [PubMed]
- Lin, Y.-C.; Boone, M.; Meuris, L.; Lemmens, I.; Van Roy, N.; Soete, A.; Reumers, J.; Moisse, M.; Plaisance, S.; Drmanac, R.; et al. Genome dynamics of the human embryonic kidney 293 lineage in response to cell biology manipulations. Nat. Commun. 2014, 5, 4767. [Google Scholar] [CrossRef] [PubMed]
- Thomas, P.; Smart, T.G. HEK293 cell line: A vehicle for the expression of recombinant proteins. J. Pharmacol. Toxicol. Methods 2005, 51, 187–200. [Google Scholar] [CrossRef]
- Aon-Bertolino, M.L.; Romero, J.I.; Galeano, P.; Holubiec, M.; Badorrey, M.S.; Saraceno, G.E.; Hanschmann, E.-M.; Lillig, C.H.; Capani, F. Thioredoxin and glutaredoxin system proteins-immunolocalization in the rat central nervous system. Biochim. Biophys. Acta 2011, 1810, 93–110. [Google Scholar] [CrossRef]
- Hanschmann, E.-M.; Godoy, J.R.; Berndt, C.; Hudemann, C.; Lillig, C.H. Thioredoxins, glutaredoxins, and peroxiredoxins-molecular mechanisms and health significance: From cofactors to antioxidants to redox signaling. Antioxid. Redox Signal. 2013, 19, 1539–1605. [Google Scholar] [CrossRef]
- Zhu, C.; Wang, X.; Huang, Z.; Qiu, L.; Xu, F.; Vahsen, N.; Nilsson, M.; Eriksson, P.S.; Hagberg, H.; Culmsee, C.; et al. Apoptosis-inducing factor is a major contributor to neuronal loss induced by neonatal cerebral hypoxia-ischemia. Cell Death Diff. 2007, 14, 775–784. [Google Scholar] [CrossRef]
- Weisse, I. Changes in the aging rat retina. Ophtalmic Res. 1995, 27, 154–163. [Google Scholar] [CrossRef]
- Elmore, S. Apoptosis: A review of programmed cell death. Toxicol. Pathol. 2007, 35, 495–516. [Google Scholar] [CrossRef]
- Häcker, G. The morphology of apoptosis. Cell Tissue Res. 2000, 301, 5–17. [Google Scholar] [CrossRef]
- Xu, X.; Lai, Y.; Hua, Z.-C. Apoptosis and apoptotic body: Disease message and therapeutic target potentials. Biosci. Rep. 2019, 39, BSR20180992. [Google Scholar] [CrossRef] [PubMed]
- Zhang, A.; Wang, G.; Jia, L.; Su, T.; Zhang, L. Exosome-mediated microRNA-138 and vascular endothelial growth factor in endometriosis through inflammation and apoptosis via the nuclear factor-κB signaling pathway. Int. J. Mol. Med. 2019, 43, 358–370. [Google Scholar] [CrossRef] [PubMed]
- Lee, M.K.; Cleveland, D.W. Neurofilament function and dysfunction: Involvement in axonal growth and neuronal disease. Curr. Opin. Cell Biol. 1994, 6, 34–40. [Google Scholar] [CrossRef]
- Liu, Y.; Namba, T.; Liu, J.; Suzuki, R.; Shioda, S.; Seki, T. Glial fibrillary acidic protein-expressing neural progenitors give rise to immature neurons via early intermediate progenitors expressing both glial fibrillary acidic protein and neuronal markers in the adult hippocampus. Neuroscience 2010, 166, 241–251. [Google Scholar] [CrossRef]
- Olsen, J.J.; Öther-Gee Pohl, S.; Deshmukh, A.; Visweswaran, M.; Ward, N.C.; Arfuso, F.; Agostino, M.; Dharmarajan, A. The Role of WntSignalling in Angiogenesis. Clin. Biochem. Rev. 2017, 38, 131–142. [Google Scholar]
- Yang, Y.; Mlodzik, M. Wnt-Frizzled/planar cell polarity signaling: Cellular orientation by facing the wind (Wnt). Annu. Rev. Cell Dev. Biol. 2015, 31, 623–646. [Google Scholar] [CrossRef]
- Philp, N.J.; Wang, D.; Yoon, H.; Hjelmeland, L.M. Polarized Expression of Monocarboxylate Transporters in Human Retinal Pigment Epithelium and ARPE-19. Cells Retin. Cell Biol. 2003, 44, 1716–1721. [Google Scholar] [CrossRef]
- Kannan, R.; Zhang, N.; Sreekumar, P.G.; Spee, C.K.; Rodriguez, A.; Barron, E.; Hinton, D.R. Stimulation of apical and basolateral VEGF-A and VEGF-C secretion by oxidative stress in polarized retinal pigment epithelial cells. Mol. Vis. 2006, 12, 1649–1659. [Google Scholar]
- Weng, W.-C.; Lin, K.-H.; Wu, P.-Y.; Ho, Y.-H.; Liu, Y.-L.; Wang, B.-J.; Chen, C.-C.; Lin, Y.-C.; Liao, Y.-F.; Lee, W.-T.; et al. VEGF expression correlates with neuronal differentiation and predicts a favorable prognosis in patients with neuroblastoma. Sci. Rep. 2017, 7, 11212. [Google Scholar] [CrossRef]
- Lee, C.Y.; Bautch, V.L. Ups and downs of guided vessel sprouting: The role of polarity. Physiology 2011, 26, 326–333. [Google Scholar] [CrossRef]
- Carmeliet, P.; Storkebaum, E. Vascular and neuronal effects of VEGF in the nervous system: Implications for neurological disorders. Semin. Cell Dev. Biol. 2002, 13, 39–53. [Google Scholar] [CrossRef] [PubMed]
- Pe’er, J.; Folberg, R.; Itin, A.; Gnessin, H.; Hemo, I.; Keshet, E. Upregulated expression of vascular endothelial growth factor in proliferative diabetic retinopathy. Br. J. Ophthalmol. 1996, 80, 241–245. [Google Scholar] [CrossRef] [PubMed]


Publisher’s Note: MDPI stays neutral with regard to jurisdictional claims in published maps and institutional affiliations. |
© 2022 by the authors. Licensee MDPI, Basel, Switzerland. This article is an open access article distributed under the terms and conditions of the Creative Commons Attribution (CC BY) license (https://creativecommons.org/licenses/by/4.0/).
Share and Cite
Holubiec, M.I.; Romero, J.I.; Urbainsky, C.; Gellert, M.; Galeano, P.; Capani, F.; Lillig, C.H.; Hanschmann, E.-M. Nucleoredoxin Plays a Key Role in the Maintenance of Retinal Pigmented Epithelium Differentiation. Antioxidants 2022, 11, 1106. https://0-doi-org.brum.beds.ac.uk/10.3390/antiox11061106
Holubiec MI, Romero JI, Urbainsky C, Gellert M, Galeano P, Capani F, Lillig CH, Hanschmann E-M. Nucleoredoxin Plays a Key Role in the Maintenance of Retinal Pigmented Epithelium Differentiation. Antioxidants. 2022; 11(6):1106. https://0-doi-org.brum.beds.ac.uk/10.3390/antiox11061106
Chicago/Turabian StyleHolubiec, Mariana I., Juan I. Romero, Claudia Urbainsky, Manuela Gellert, Pablo Galeano, Francisco Capani, Christopher Horst Lillig, and Eva-Maria Hanschmann. 2022. "Nucleoredoxin Plays a Key Role in the Maintenance of Retinal Pigmented Epithelium Differentiation" Antioxidants 11, no. 6: 1106. https://0-doi-org.brum.beds.ac.uk/10.3390/antiox11061106