
Urinary Phenolic Metabolites Associated with Peanut Consumption May Have a Beneficial Impact on Vascular Health Biomarkers
 , , and
Abstract
:1. Introduction
2. Materials and Methods
2.1. Study Population and Recruitment
2.2. Study Design
2.3. Measurements and Outcome Assessment
2.3.1. Anthropometric and Clinical Measurements
2.3.2. Sample Collection and Biochemical Analysis
2.3.3. Dietary Intake and Physical Activity
2.4. Urinary Phenolic Metabolites Analysis
2.4.1. Standards and Reagents
2.4.2. Urine Treatment for Phenolic Metabolite Analysis
2.4.3. Chromatographic Conditions
2.4.4. Identification and Quantification of Urinary Phenolic Metabolites
2.5. Determination of Eicosanoids in Urine
2.6. Statistical Analyses
3. Results
3.1. Baseline Characteristics
3.2. Effect of the Intervention on Urinary Phenolic Metabolite Levels
3.3. Effect of the Intervention on Eicosanoid Levels in Urine
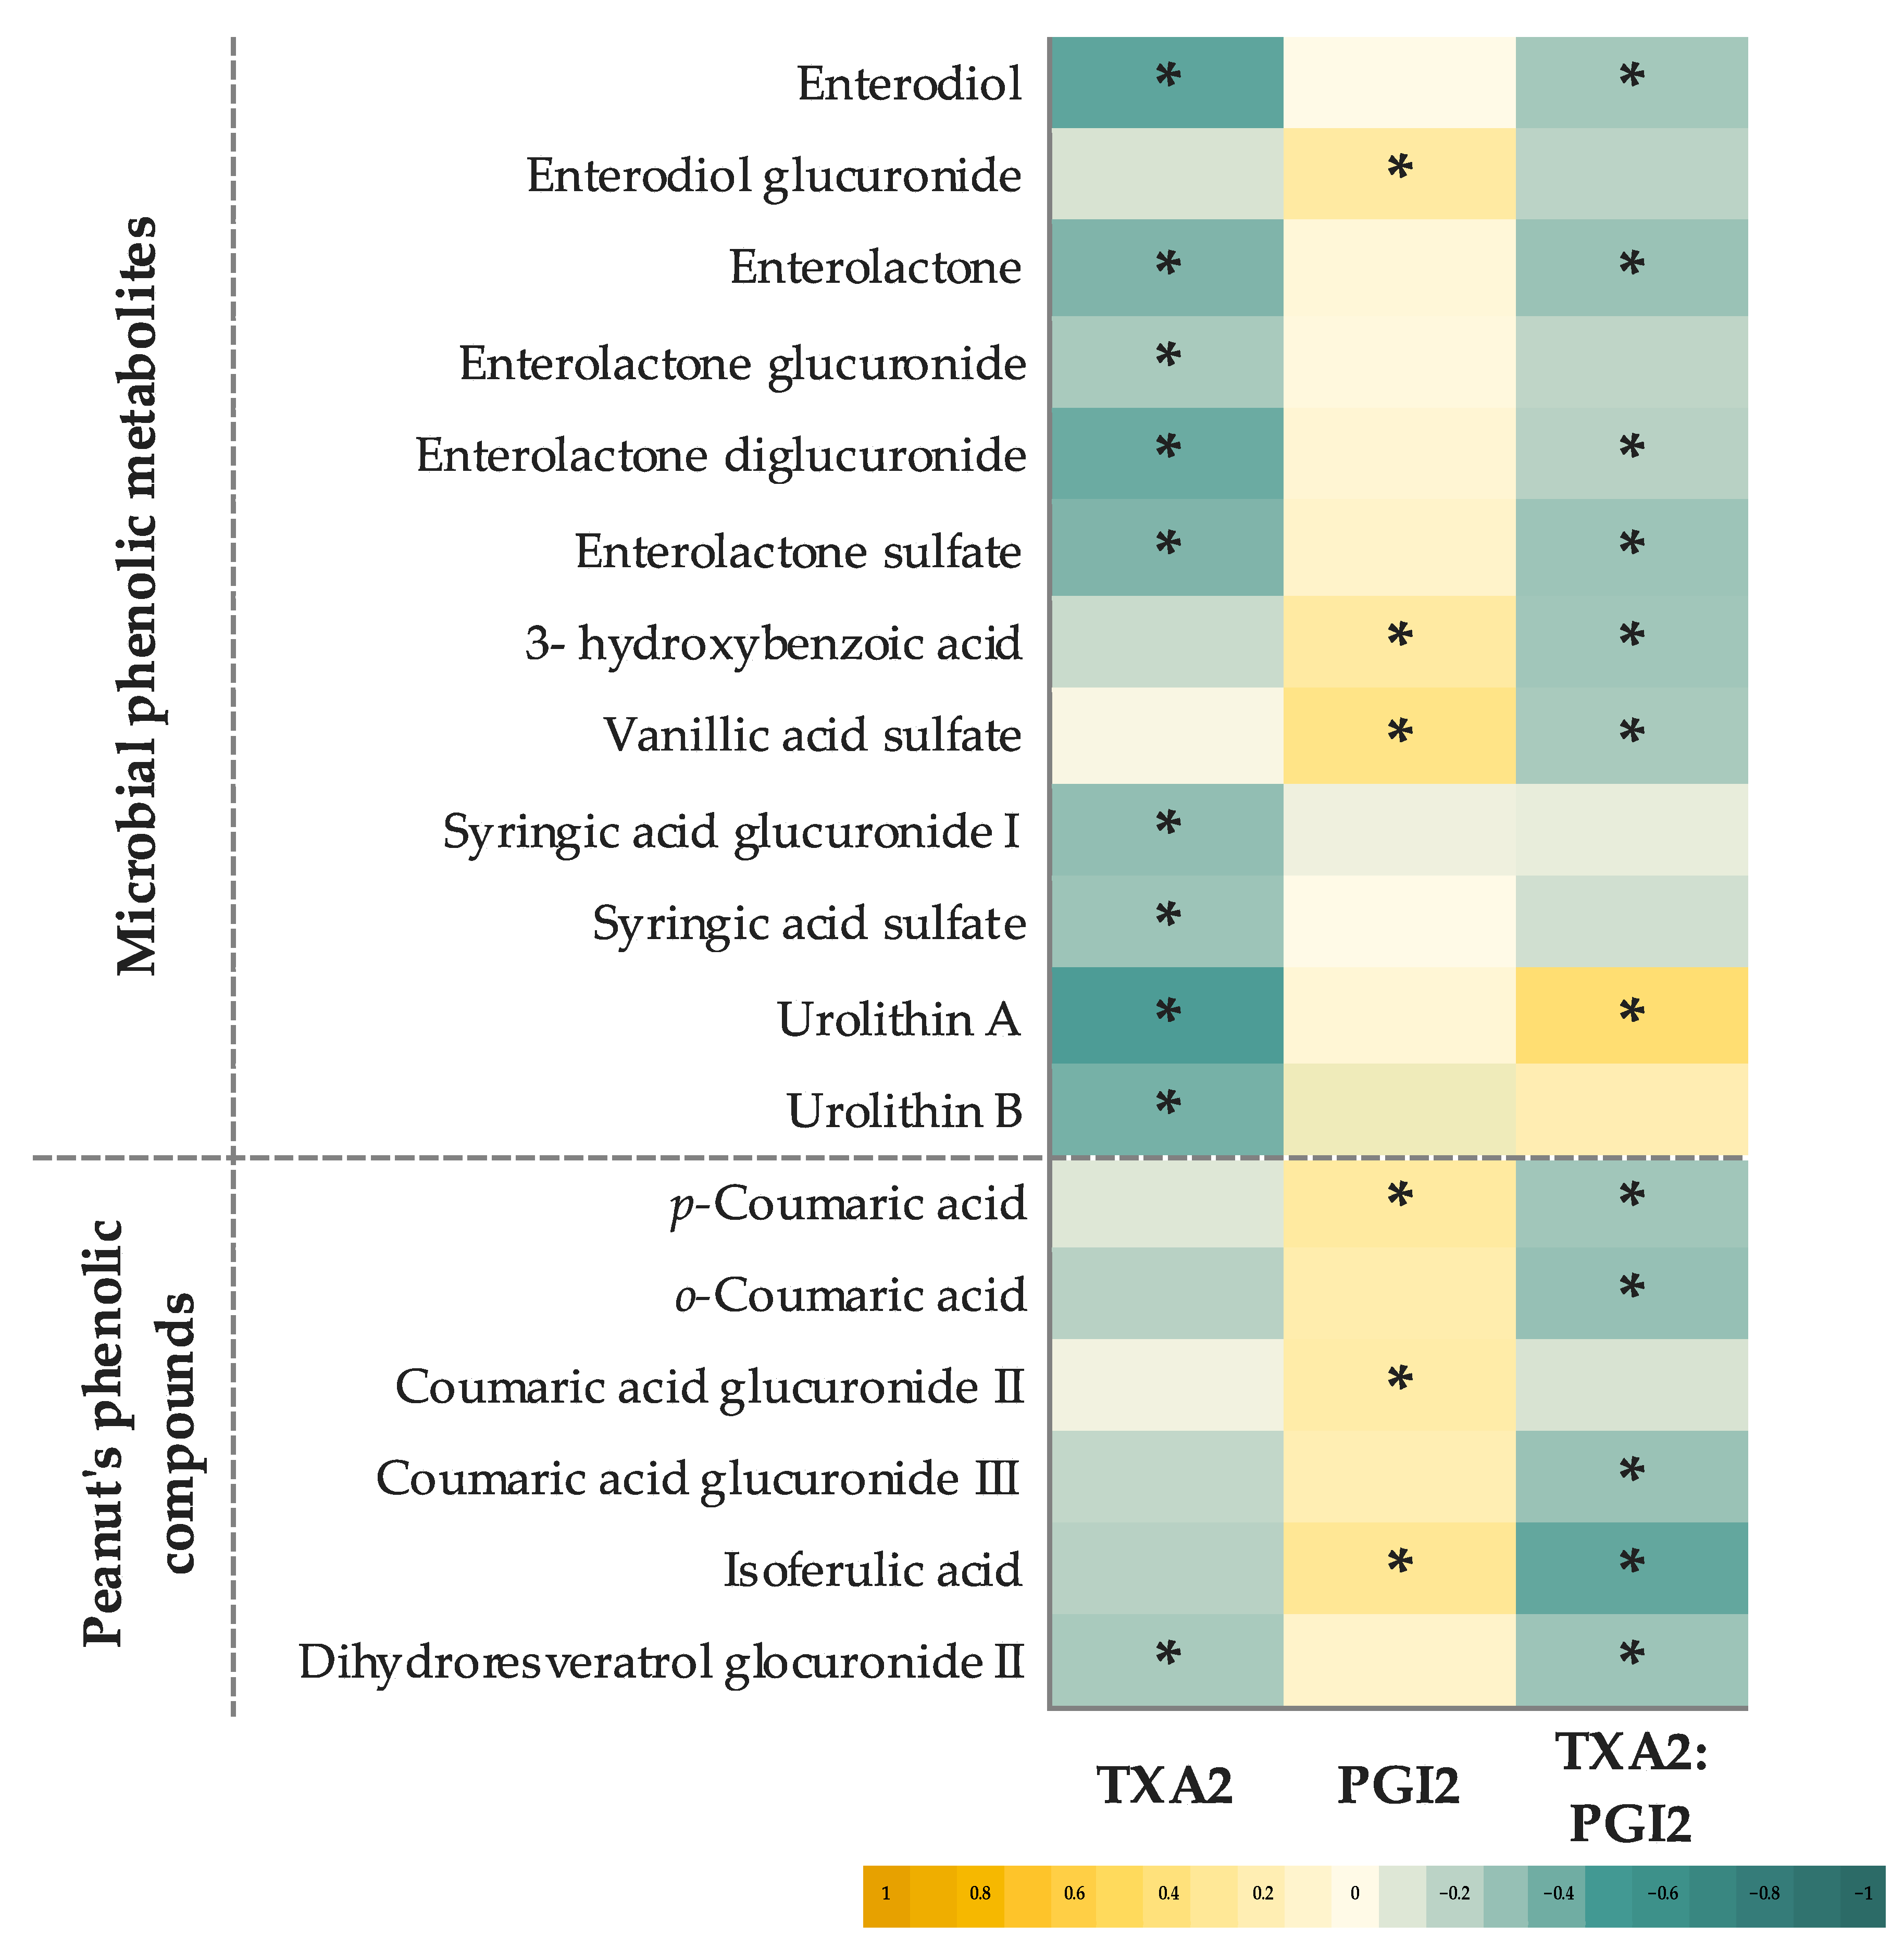
3.4. Relationship between Urinary Phenolic Metabolites and Eicosanoids
4. Discussion
Strengths and Limitations
5. Conclusions
Author Contributions
Funding
Institutional Review Board Statement
Informed Consent Statement
Data Availability Statement
Acknowledgments
Conflicts of Interest
Appendix A

| SRP vs. CB | PB vs. CB | ||||
|---|---|---|---|---|---|
| Models | Difference Time- Exposure (95% CI) | p-Value | Difference Time- Exposure (95% CI) | p-Value | |
| Urinary phenolic metabolites | |||||
| Lignans-Lignans | Model 1 | 8.23 (−0.80, 17.27) | 0.074 | 9.12 (0.63, 17.62) | 0.035 |
| Model 2 | 7.77 (−1.03, 16.57) | 0.084 | 9.11 (0.49, 17.73) | 0.038 | |
| Enterodiol | Model 1 | −0.40 (−5.63, 4.83) | 0.881 | 0.41 (−3.59, 4.43) | 0.839 |
| Model 2 | −0.57 (−5.91, 4.78) | 0.836 | 0.46 (−3.62, 4.55) | 0.824 | |
| Enterodiol glucuronide | Model 1 | 2.02 (0.22, 3.81) | 0.028 | 2.62 (0.14, 5.06) | 0.038 |
| Model 2 | 2.27 (0.39, 4.15) | 0.018 | 2.94 (0.28, 5.61) | 0.031 | |
| Enterodiol sulfate | Model 1 | 0.14 (−0.17, 0.45) | 0.373 | 0.02 (−0.26, 0.30) | 0.901 |
| Model 2 | 0.14 (−0.16, 0.44) | 0.373 | 0.01 (−0.26, 0.29) | 0.914 | |
| Enterolactone | Model 1 | 0.73 (−0.45, 1.90) | 0.224 | 0.06 (−0.08, 0.20) | 0.388 |
| Model 2 | 0.72 (−0.40, 1.86) | 0.206 | 0.05 (−0.12, 0.24) | 0.545 | |
| Enterolactone glucuronide | Model 1 | 5.52 (0.06, 10.97) | 0.047 | 5.17 (0.46, 9.88) | 0.032 |
| Model 2 | 6.05 (0.04, 12.56) | 0.045 | 5.19 (0.45, 9.94) | 0.032 | |
| Enterolactone diglucuronide | Model 1 | −0.03 (−0.05, 0.00) | 0.083 | −0.03 (0.05, 0.00) | 0.028 |
| Model 2 | −0.03 (−0.06, 0.01) | 0.100 | −0.04 (−0.09, 0.00) | 0.054 | |
| Enterolactone sulfate | Model 1 | 0.05 (0.01, 0.09) | 0.022 | 0.03 (−0.01, 0.07) | 0.126 |
| Model 2 | 0.02 (0.02, 0.07) | 0.020 | 0.04 (−0.11, 0.06) | 0.086 | |
| Hydroxybenzoic acids | Model 1 | 21.08 (−3.87, 45.91) | 0.098 | 32.33 (1.46, 63.19) | 0.040 |
| Model 2 | 15.16 (−7.60, 33.93) | 0.169 | 25.35 (−0.99, 51.69) | 0.059 | |
| 3-Hydroxybenzoic acid | Model 1 | 3.66 (1.09, 6.23) | 0.005 | 3.88 (2.03, 5.72) | <0.001 |
| Model 2 | 3.67 (1.34, 6.00) | 0.002 | 3.64 (1.91, 5.38) | <0.001 | |
| 4-Hydroxybenzoic acid | Model 1 | 0.17 (−0.63, 0.97) | 0.673 | 0.04 (−0.58, 0.65) | 0.903 |
| Model 2 | 0.20 (−0.62, 1.01) | 0.631 | 0.03 (−0.59, 0.66) | 0.914 | |
| Hydroxybenzoic acid glucuronide | Model 1 | 0.14 (−0.67, 0.94) | 0.737 | 0.04 (−0.72, 0.81) | 0.910 |
| Model 2 | 0.09 (−0.76, 0.94) | 0.832 | 0.02 (−0.79, 0.84) | 0.958 | |
| Hydroxybenzoic acid sulfate | Model 1 | 2.28 (−0.86, 5.43) | 0.155 | 5.71 (1.93, 9.49) | 0.003 |
| Model 2 | 2.34 (−0.69, 5.38) | 0.090 | 5.55 (1.72, 9.37) | 0.004 | |
| Protocatechuic acid | Model 1 | −0.64 (−2.05, 0.77) | 0.371 | −0.97 (−2.56, 0.62) | 0.234 |
| Model 2 | −0.66 (−1.99, 0.67) | 0.331 | −0.77 (−2.33, 0.80) | 0.335 | |
| Protocatechuic acid glucuronide I | Model 1 | 0.41 (−0.12, 0.93) | 0.127 | 0.43 (−0.36, 1.21) | 0.289 |
| Model 2 | 0.32 (−0.13, 0.76) | 0.157 | 0.41 (−0.35, 1.17) | 0.291 | |
| Protocatechuic acid glucuronide II | Model 1 | −0.04 (−0.15, 0.06) | 0.420 | 0.04 (−0.11, 0.19) | 0.613 |
| Model 2 | −0.08 (−0.17, 0.01) | 0.083 | −0.01 (−0.17, 0.15) | 0.921 | |
| Protocatechuic acid sulfate | Model 1 | −0.87 (−2.69, 0.95) | 0.351 | −0.15 (−2.10, 1.81) | 0.884 |
| Model 2 | −0.86 (−2.68, 0.96) | 0.354 | −0.14 (−2.10, 1.81) | 0.885 | |
| Vanillic acid | Model 1 | −2.27 (−8.41, 3.87) | 0.469 | −1.93 (−11.52, 7.64) | 0.692 |
| Model 2 | −4.40 (−8.08, 0.72) | 0.079 | −3.47 (−8.52, 1.57) | 0.177 | |
| Vanillic acid glucuronide I | Model 1 | −0.84 (−8.46, 6.77) | 0.828 | −0.35 (−9.47, 8.77) | 0.940 |
| Model 2 | −2.23 (−5.25, 0.78) | 0.146 | −1.71 (−6.87, 3.44) | 0.515 | |
| Vanillic acid glucuronide II | Model 1 | −1.51 (−8.77, 5.75) | 0.684 | 4.85 (−5.47, 15.17) | 0.357 |
| Model 2 | −5.92 (−13.22, 1.39) | 0.112 | −0.15 (−10.44, 10.13) | 0.976 | |
| Vanillic acid sulfate | Model 1 | 9.32 (−1.49, 20.11) | 0.091 | 11.86 (3.43, 20.31) | 0.006 |
| Model 2 | 8.77 (1.10, 17.65) | 0.048 | 11.54 (3.24, 19.84) | 0.006 | |
| Syringic acid | Model 1 | 1.21 (−0.49, 2.91) | 0.163 | 0.62 (−0.81, 2.06) | 0.394 |
| Model 2 | 1.20 (−0.16, 2.56) | 0.083 | 0.84 (−0.30, 1.99) | 0.149 | |
| Syringic acid glucuronide I | Model 1 | 0.90 (−0.45, 2.26) | 0.192 | 0.79 (−0.30, 1.87) | 0.155 |
| Model 2 | 0.64 (−0.49, 1.77) | 0.267 | 0.79 (−0.32, 1.90) | 0.165 | |
| Syringic acid glucuronide II | Model 1 | 3.70 (0.38, 7.01) | 0.029 | 4.19 (0.89, 7.48) | 0.013 |
| Model 2 | 2.59 (−0.02, 5.21) | 0.052 | 3.51 (0.47, 6.54) | 0.023 | |
| Syringic acid sulfate | Model 1 | 5.41 (−0.99, 11.81) | 0.098 | 3.28 (−2.92, 9.47) | 0.300 |
| Model 2 | 5.66 (0.23, 11.09) | 0.041 | 3.49 (−1.95, 8.93) | 0.208 | |
| Hydroxycinnamic acids | Model 1 | 1.69 (0.14, 3.26) | 0.033 | 4.12 (1.90, 6.34) | <0.001 |
| Model 2 | 1.40 (0.38, 3.18) | 0.040 | 3.91 (1.54, 6.27) | 0.001 | |
| p-Coumaric acid | Model 1 | 0.16 (0.01, 0.68) | 0.042 | 0.47 (0.10, 0.83) | 0.012 |
| Model 2 | 0.18 (0.01, 0.58) | 0.046 | 0.46 (0.09, 0.83) | 0.016 | |
| m-Coumaric acid | Model 1 | −0.19 (−0.59, 0.19) | 0.322 | −0.02 (−0.56, 0.52) | 0.945 |
| Model 2 | −0.17 (−0.60, 0.27) | 0.454 | −0.05 (−0.91, 0.82) | 0.919 | |
| o-Coumaric acid | Model 1 | −0.16 (−0.51, 0.20) | 0.389 | 0.08 (−0.03, 0.19) | 0.147 |
| Model 2 | −0.15 (−0.54, 0.23) | 0.127 | 0.09 (−0.00, 0.18) | 0.054 | |
| Coumaric acid glucuronide I | Model 1 | 0.23 (0.05, 0.41) | 0.011 | 0.25 (0.01, 0.48) | 0.041 |
| Model 2 | 0.13 (0.05, 0.21) | 0.001 | 0.12 (0.00, 0.33) | 0.040 | |
| Coumaric acid glucuronide II | Model 1 | 0.07 (0.02, 0.13) | 0.012 | 0.07 (0.00, 0.14) | 0.043 |
| Model 2 | 0.05 (0.02, 0.09) | 0.003 | 0.04 (0.00, 0.10) | 0.036 | |
| Coumaric acid glucuronide III | Model 1 | 0.09 (−0.33, 0.50) | 0.677 | 0.28 (−0.05, 0.61) | 0.101 |
| Model 2 | 0.09 (−0.33, 0.52) | 0.672 | 0.28 (−0.05, 0.61) | 0.095 | |
| Coumaric acid glucuronide IV | Model 1 | 0.17 (−0.06, 0.40) | 0.156 | 0.11 (−0.12, 0.34) | 0.365 |
| Model 2 | 0.05 (−0.19, 0.29) | 0.673 | 0.07 (−0.14, 0.28) | 0.493 | |
| Isoferulic acid | Model 1 | 1.43 (0.76, 2.09) | <0.001 | 2.89 (1.11, 4.67) | 0.001 |
| Model 2 | 1.07 (0.15, 1.27) | 0.013 | 2.17 (0.43, 3.92) | 0.015 | |
| Stilbenes | Model 1 | 0.92 (−2.07, 3.91) | 0.546 | 1.26 (−0.99, 3.51) | 0.273 |
| Model 2 | 1.23 (−1.55, 4.00) | 0.371 | 0.13 (−1.28, 1.55) | 0.882 | |
| Dihydroresveratrol glucuronide I | Model 1 | 1.06 (−0.63, 2.74) | 0.219 | 1.14 (−0.23, 2.51) | 0.103 |
| Model 2 | 1.21 (−0.96, 3.38) | 0.274 | 0.85 (−0.30, 2.01) | 0.146 | |
| Dihydroresveratrol glucuronide II | Model 1 | −0.16 (−2.64, 2.31) | 0.897 | 0.01 (−1.80, 1.82) | 0.987 |
| Model 2 | 0.87 (−0.07, 1.81) | 0.068 | 0.51 (0.16, 0.86) | 0.004 | |
| Dihydroresveratrol glucuronide III | Model 1 | 0.03 (−0.14, 0.20) | 0.730 | 0.10 (−0.18, 0.37) | 0.490 |
| Model 2 | 0.06 (−0.11, 0.22) | 0.506 | 0.07 (−0.13, 0.27) | 0.508 | |
| Hydroxycoumarins | Model 1 | 0.55 (−10.76, 11.86) | 0.924 | 1.22 (−9.41, 11.86) | 0.822 |
| Model 2 | 1.38 (−8.83, 11.58) | 0.791 | 1.73 (−6.92, 10.38) | 0.694 | |
| Urolithin A | Model 1 | −0.52 (−1.21, 0.17) | 0.137 | −0.17 (−0.88, 0.54) | 0.635 |
| Model 2 | −0.42 (−0.99, 0.15) | 0.153 | 0.00 (−0.32, 0.32) | 0.572 | |
| Urolithin A glucuronide | Model 1 | 0.98 (−10.40, 12.35) | 0.866 | 1.25 (−9.43, 11.93) | 0.819 |
| Model 2 | 1.56 (−8.79, 11.90) | 0.768 | 1.64 (−7.32, 10.59) | 0.720 | |
| Urolithin A sulfate | Model 1 | 0.07 (−0.10, 0.23) | 0.430 | 0.06 (−0.14, 4.25) | 0.550 |
| Model 2 | 0.09 (−0.07, 0.26) | 0.268 | 0.07 (−0.12, 0.25) | 0.466 | |
| Urolithin B | Model 1 | 0.03 (−0.19, 0.25) | 0.789 | 0.14 (−0.18, 0.46) | 0.393 |
| Model 2 | 0.03 (−0.18, 0.23) | 0.807 | 0.12 (−0.19, 0.42) | 0.425 | |
| SRP vs. CB | PB vs. CB | ||||
|---|---|---|---|---|---|
| Models | Difference Time- Exposure (95% CI) | p-Value | Difference Time- Exposure (95% CI) | p-Value | |
| Eicosanoids | |||||
| TXA2 (pg/mL) | Model 1 | −192 (−686, 538) | 0.448 | −253 (−747, 241) | 0.316 |
| Model 2 | −152 (−664, 361) | 0.456 | −198 (−711, 315) | 0.414 | |
| PGI2 (pg/mL) | Model 1 | 2989 (−757, 5735) | 0.090 | 2657 (−1098, 6812) | 0.139 |
| Model 2 | 3844 (516, 6982) | 0.037 | 3046 (−989, 7080) | 0.070 | |
| TXA2:PGI2 ratio | Model 1 | −0.15 (−0.26, −0.04) | 0.007 | −0.09 (−0.17, −0.01) | 0.042 |
| Model 2 | −0.15 (−0.27, −0.04) | 0.008 | −0.08 (−0.18, −0.00) | 0.047 | |
References
- Luo, C.; Zhang, Y.; Ding, Y.; Shan, Z.; Chen, S.; Yu, M.; Hu, F.B.; Liu, L. Nut Consumption and Risk of Type 2 Diabetes, Cardiovascular Disease, and All-Cause Mortality: A Systematic Review and Meta-Analysis. Am. J. Clin. Nutr. 2014, 100, 256–269. [Google Scholar] [CrossRef] [PubMed] [Green Version]
- Becerra-Tomás, N.; Paz-Graniel, I.; Kendall, C.; Kahleova, H.; Rahelić, D.; Sievenpiper, J.L.; Salas-Salvadó, J. Nut Consumption and Incidence of Cardiovascular Diseases and Cardiovascular Disease Mortality: A Meta-Analysis of Prospective Cohort Studies. Nutr. Rev. 2019, 77, 691–709. [Google Scholar] [CrossRef] [PubMed]
- Guasch-Ferré, M.; Liu, X.; Malik, V.S.; Sun, Q.; Willett, W.C.; Manson, J.A.E.; Rexrode, K.M.; Li, Y.; Hu, F.B.; Bhupathiraju, S.N. Nut Consumption and Risk of Cardiovascular Disease. J. Am. Coll. Cardiol. 2017, 70, 2519–2532. [Google Scholar] [CrossRef] [PubMed]
- Reis, C.E.G.; Ribeiro, D.N.; Costa, N.M.B.; Bressan, J.; Alfenas, R.C.G.; Mattes, R.D. Acute and Second-Meal Effects of Peanuts on Glycaemic Response and Appetite in Obese Women with High Type 2 Diabetes Risk: A Randomised Cross-over Clinical Trial. Br. J. Nutr. 2013, 109, 2015–2023. [Google Scholar] [CrossRef] [Green Version]
- Hou, Y.Y.; Ojo, O.; Wang, L.L.; Wang, Q.; Jiang, Q.; Shao, X.Y.; Wang, X.H. A Randomized Controlled Trial to Compare the Effect of Peanuts and Almonds on the Cardio-Metabolic and Inflammatory Parameters in Patients with Type 2 Diabetes Mellitus. Nutrients 2018, 10, 1565. [Google Scholar] [CrossRef] [PubMed] [Green Version]
- Afshin, A.; Micha, R.; Khatibzadeh, S.; Mozaffarian, D. Consumption of Nuts and Legumes and Risk of Incident Ischemic Heart Disease, Stroke, and Diabetes: A Systematic Review and Meta-Analysis. Am. J. Clin. Nutr. 2014, 100, 278–288. [Google Scholar] [CrossRef] [PubMed] [Green Version]
- Liu, X.; Hill, A.M.; West, S.G.; Gabauer, R.M.; McCrea, C.E.; Fleming, J.A.; Kris-Etherton, P.M. Acute Peanut Consumption Alters Postprandial Lipids and Vascular Responses in Healthy Overweight or Obese Men. J. Nutr. 2017, 147, 835–840. [Google Scholar] [CrossRef] [PubMed] [Green Version]
- de Oliveira Fialho, C.G.; Moreira, A.P.B.; Bressan, J.; de Cássia Gonçalves Alfenas, R.; Mattes, R.; Costa, N.M.B. Effects of Whole Peanut within an Energy-Restricted Diet on Inflammatory and Oxidative Processes in Obese Women: A Randomized Controlled Trial. J. Sci. Food Agric. 2022, 102, 3446–3455. [Google Scholar] [CrossRef] [PubMed]
- Gulati, S.; Misra, A.; Pandey, R.M.; Bhatt, S.P.; Saluja, S. Effects of Pistachio Nuts on Body Composition, Metabolic, Inflammatory and Oxidative Stress Parameters in Asian Indians with Metabolic Syndrome: A 24-Wk, Randomized Control Trial. Nutrition 2014, 30, 192–197. [Google Scholar] [CrossRef]
- Liu, J.F.; Liu, Y.H.; Chen, C.M.; Chang, W.H.; Chen, C.Y.O. The Effect of Almonds on Inflammation and Oxidative Stress in Chinese Patients with Type 2 Diabetes Mellitus: A Randomized Crossover Controlled Feeding Trial. Eur. J. Nutr. 2013, 52, 927–935. [Google Scholar] [CrossRef] [PubMed]
- Yu, Z.; Malik, V.S.; Keum, N.N.; Hu, F.B.; Giovannucci, E.L.; Stampfer, M.J.; Willett, W.C.; Fuchs, C.S.; Bao, Y. Associations between Nut Consumption and Inflammatory Biomarkers. Am. J. Clin. Nutr. 2016, 104, 722–728. [Google Scholar] [CrossRef] [PubMed] [Green Version]
- Neale, E.P.; Tapsell, L.C.; Guan, V.; Batterham, M.J. The Effect of Nut Consumption on Markers of Inflammation and Endothelial Function: A Systematic Review and Meta-Analysis of Randomised Controlled Trials. BMJ Open 2017, 7, e016863. [Google Scholar] [CrossRef] [PubMed]
- Toomer, O.T. Nutritional Chemistry of the Peanut (Arachis Hypogaea). Crit. Rev. Food Sci. Nutr. 2018, 58, 3042–3053. [Google Scholar] [CrossRef] [PubMed]
- Brufau, G.; Boatella, J.; Rafecas, M. Nuts: Source of Energy and Macronutrients. Br. J. Nutr. 2006, 96, 24–28. [Google Scholar] [CrossRef] [Green Version]
- Shahbandeh, M. Consumption of Tree Nuts Worldwide in 2018. Available online: https://0-www-statista-com.brum.beds.ac.uk/statistics/1030815/tree-nut-global-consumption-by-type/ (accessed on 10 October 2022).
- Ros, E. Health Benefits of Nut Consumption. Nutrients 2010, 2, 652–682. [Google Scholar] [CrossRef] [Green Version]
- Isanga, J.; Zhang, G.-N. Biologically Active Components and Nutraceuticals in Peanuts and Related Products: Review. Food Rev. Int. 2007, 23, 123–140. [Google Scholar] [CrossRef]
- Christman, L.M.; Dean, L.L.; Bueno Almeida, C.; Weissburg, J.R. Acceptability of Peanut Skins as a Natural Antioxidant in Flavored Coated Peanuts. J. Food Sci. 2018, 83, 2571–2577. [Google Scholar] [CrossRef]
- Parilli-Moser, I.; Domínguez-López, I.; Arancibia-Riveros, C.; Marhuenda-Muñoz, M.; Vallverdú-Queralt, A.; Hurtado-Barroso, S.; Lamuela-Raventós, R.M. Effect of Crushing Peanuts on Fatty Acid and Phenolic Bioaccessibility: A Long-Term Study. Antioxidants 2022, 11, 423. [Google Scholar] [CrossRef]
- Gormaz, J.; Valls, N.; Sotomayor, C.; Turner, T.; Rodrigo, R. Potential Role of Polyphenols in the Prevention of Cardiovascular Diseases: Molecular Bases. Curr. Med. Chem. 2016, 23, 115–128. [Google Scholar] [CrossRef]
- Yahfoufi, N.; Alsadi, N.; Jambi, M.; Matar, C. The Immunomodulatory and Anti-Inflammatory Role of Polyphenols. Nutrients 2018, 10, 1618. [Google Scholar] [CrossRef] [Green Version]
- Fraga, C.G.; Croft, K.D.; Kennedy, D.O.; Tomás-Barberán, F.A. The Effects of Polyphenols and Other Bioactives on Human Health. Food Funct. 2019, 10, 514–528. [Google Scholar] [CrossRef] [PubMed] [Green Version]
- Rudrapal, M.; Khairnar, S.J.; Khan, J.; Dukhyil, A.B.; Ansari, M.A.; Alomary, M.N.; Alshabrmi, F.M.; Palai, S.; Deb, P.K.; Devi, R. Dietary Polyphenols and Their Role in Oxidative Stress-Induced Human Diseases: Insights Into Protective Effects, Antioxidant Potentials and Mechanism(s) of Action. Front. Pharmacol. 2022, 13, 806470. [Google Scholar] [CrossRef]
- Hussain, T.; Tan, B.; Yin, Y.; Blachier, F.; Tossou, M.C.B.; Rahu, N. Oxidative Stress and Inflammation: What Polyphenols Can Do for Us? Oxid. Med. Cell. Longev. 2016, 2016, 7432797. [Google Scholar] [CrossRef] [PubMed] [Green Version]
- Santangelo, C.; Varì, R.; Scazzocchio, B.; Filesi, C.; Masella, R. Polyphenols, Intracellular Signalling and Inflammation. Ann. Ist. Super Sanità 2007, 43, 394–405. [Google Scholar] [PubMed]
- Moncada, S.; Gryglewski, R.; Bunting, S.; Vane, J.R. An Enzyme Isolated from Arteries Transforms Prostaglandin Endoperoxides to an Unstable Substance That Inhibits Platelet Aggregation. Nature 1976, 263, 663–665. [Google Scholar] [CrossRef] [PubMed]
- Hammarstrom, S.; Falardeau, P. Resolution of prostaglandin endoperoxide synthase and thromboxane synthase of human platelets. Proc. Natl. Acad. Sci. USA. 1977, 74, 3691–3695. [Google Scholar] [CrossRef] [Green Version]
- Negishi, M.; Sugimoto, Y.; Ichikawa, A. Molecular Mechanisms of Diverse Actions of Prostanoid Receptors. Biochim. Biophys. Acta 1995, 1259, 109–120. [Google Scholar] [CrossRef]
- Dusting, G.J.; Moncada, S.; Vane, J.R. Prostaglandins Prostacyclin (Pgx) Is the Endogenous Metabolite Responsible for Relaxation of Coronary Arteries Induced by Arachidonic Acid. Prostaglandins 1977, 13, 3–15. [Google Scholar] [CrossRef]
- Arehart, E.; Gleim, S.; Kasza, Z.; Fetalvero, K.M.; Martin, K.A.; Hwa, J. Prostacyclin, Atherothrombosis, and Cardiovascular Disease. Curr. Med. Chem. 2007, 14, 2161–2169. [Google Scholar] [CrossRef]
- Parilli-Moser, I.; Domínguez-López, I.; Trius-Soler, M.; Castellví, M.; Bosch, B.; Castro-Barquero, S.; Estruch, R.; Hurtado-Barroso, S.; Lamuela-Raventós, R.M. Consumption of Peanut Products Improves Memory and Stress Response in Healthy Adults from the ARISTOTLE Study: A 6-Month Randomized Controlled Trial. Clin. Nutr. 2021, 40, 5556–5567. [Google Scholar] [CrossRef]
- Juton, C.; Castro-barquero, S.; Casas, R.; Freitas, T.; Ruiz-león, A.M.; Crovetto, F.; Domenech, M.; Crispi, F.; Vieta, E.; Gratacós, E.; et al. Reliability and Concurrent and Construct Validity of a Food Frequency Questionnaire for Pregnant Women at High Risk to Develop Fetal Growth Restriction. Nutrients 2021, 13, 1629. [Google Scholar] [CrossRef] [PubMed]
- Elosua, R.; Garcia, M.; Aguilar, A.; Molina, L.; Covas, M.I.; Marrugat, J. Validation of the Minnesota Leisure Time Physical Activity Questionnaire in Spanish Women. Med. Sci. Sport. Exerc. 2000, 32, 1431–1437. [Google Scholar] [CrossRef] [PubMed]
- Laveriano-Santos, E.P.; Marhuenda-Muñoz, M.; Vallverdú-Queralt, A.; Martínez-Huélamo, M.; Tresserra-Rimbau, A.; Miliarakis, E.; Arancibia-Riveros, C.; Jáuregui, O.; Ruiz-León, A.M.; Castro-Baquero, S.; et al. Identification and Quantification of Urinary Microbial Phenolic Metabolites by HPLC-ESI-LTQ-Orbitrap-HRMS and Their Relationship with Dietary Polyphenols in Adolescents. Antioxidants 2022, 11, 1167. [Google Scholar] [CrossRef]
- Rocchetti, G.; Bhumireddy, S.R.; Giuberti, G.; Mandal, R.; Lucini, L.; Wishart, D.S. Edible Nuts Deliver Polyphenols and Their Transformation Products to the Large Intestine: An in Vitro Fermentation Model Combining Targeted/Untargeted Metabolomics. Food Res. Int. 2019, 116, 786–794. [Google Scholar] [CrossRef] [PubMed]
- Bai, N.; He, K.; Roller, M.; Zheng, B.; Chen, X.; Shao, Z.; Peng, T.; Zheng, Q. Active Compounds from Lagerstroemia Speciosa, Insulin-like Glucose Uptake-Stimulatory/Inhibitory and Adipocyte Differentiation-Inhibitory Activities in 3T3-L1 Cells. J. Agric. Food Chem. 2008, 56, 11668–11674. [Google Scholar] [CrossRef] [PubMed]
- Larrosa, M.; García-Conesa, M.T.; Espín, J.C.; Tomás-Barberán, F.A. Ellagitannins, Ellagic Acid and Vascular Health. Mol. Aspects Med. 2010, 31, 513–539. [Google Scholar] [CrossRef] [PubMed]
- Tulipani, S.; Urpi-Sarda, M.; García-Villalba, R.; Rabassa, M.; López-Uriarte, P.; Bulló, M.; Jáuregui, O.; Tomás-Barberán, F.; Salas-Salvadó, J.; Espín, J.C.; et al. Urolithins Are the Main Urinary Microbial-Derived Phenolic Metabolites Discriminating a Moderate Consumption of Nuts in Free-Living Subjects with Diagnosed Metabolic Syndrome. J. Agric. Food Chem. 2012, 60, 8930–8940. [Google Scholar] [CrossRef]
- Marhuenda-Muñoz, M.; Laveriano-Santos, E.P.; Tresserra-Rimbau, A.; Lamuela-Raventós, R.M.; Martínez-Huélamo, M.; Vallverdú-Queralt, A. Microbial Phenolic Metabolites: Which Molecules Actually Have an Effect on Human Health? Nutrients 2019, 11, 2725. [Google Scholar] [CrossRef] [Green Version]
- Mosele, J.I.; Macià, A.; Motilva, M.J. Metabolic and Microbial Modulation of the Large Intestine Ecosystem by Non-Absorbed Diet Phenolic Compounds: A Review. Molecules 2015, 20, 17429–17468. [Google Scholar] [CrossRef] [Green Version]
- Serrano, J.; Puupponen-Pimiä, R.; Dauer, A.; Aura, A.M.; Saura-Calixto, F. Tannins: Current Knowledge of Food Sources, Intake, Bioavailability and Biological Effects. Mol. Nutr. Food Res. 2009, 53, S310–S329. [Google Scholar] [CrossRef] [Green Version]
- Hullar, M.A.J.; Lancaster, S.M.; Li, F.; Tseng, E.; Beer, K.; Atkinson, C.; Wähälä, K.; Copeland, W.K.; Randolph, T.W.; Newton, K.M.; et al. Enterolignan-Producing Phenotypes Are Associated with Increased Gut Microbial Diversity and Altered Composition in Premenopausal Women in the United States. Cancer Epidemiol. Biomark. Prev. 2015, 24, 546–554. [Google Scholar] [CrossRef] [PubMed] [Green Version]
- Godos, J.; Castellano, S.; Ray, S.; Grosso, G.; Galvano, F. Dietary Polyphenol Intake and Depression: Results from the Mediterranean Healthy Eating, Lifestyle and Aging (MEAL) Study. Molecules 2018, 23, 999. [Google Scholar] [CrossRef] [Green Version]
- Grosso, G.; Stepaniak, U.; Micek, A.; Stefler, D.; Bobak, M.; Pająk, A. Dietary Polyphenols Are Inversely Associated with Metabolic Syndrome in Polish Adults of the HAPIEE Study. Eur. J. Nutr. 2017, 56, 1409–1420. [Google Scholar] [CrossRef] [Green Version]
- Tresserra-Rimbau, A.; Rimm, E.B.; Medina-Remón, A.; Martínez-González, M.A.; de la Torre, R.; Corella, D.; Salas-Salvadó, J.; Gómez-Gracia, E.; Lapetra, J.; Arós, F.; et al. Inverse Association between Habitual Polyphenol Intake and Incidence of Cardiovascular Events in the PREDIMED Study. Nutr. Metab. Cardiovasc. Dis. 2014, 24, 639–647. [Google Scholar] [CrossRef]
- Sun, Q.; Wedick, N.M.; Pan, A.; Townsend, M.K.; Cassidy, A.; Franke, A.A.; Rimm, E.B.; Hu, F.B.; van Dam, R.M. Gut Microbiota Metabolites of Dietary Lignans and Risk of Type 2 Diabetes: A Prospective Investigation in Two Cohorts of U.S. Women. Diabetes Care 2014, 37, 1287–1295. [Google Scholar] [CrossRef] [Green Version]
- Eriksen, A.K.; Kyrø, C.; Nørskov, N.P.; Frederiksen, K.; Bach Knudsen, K.E.; Overvad, K.; Landberg, R.; Tjønneland, A.; Olsen, A. Pre-Diagnostic Plasma Enterolactone Concentrations Are Associated with Lower Mortality among Individuals with Type 2 Diabetes: A Case-Cohort Study in the Danish Diet, Cancer and Health Cohort. Diabetologia 2019, 62, 959–969. [Google Scholar] [CrossRef] [Green Version]
- Matsumoto, Y.; Katano, Y. Cardiovascular Protective Effects of Polyphenols Contained in Passion Fruit Seeds Namely Piceatannol and Scirpusin B: A Review. Tokai J. Exp. Clin. Med. 2021, 46, 151–161. [Google Scholar] [PubMed]
- Alanko, J.; Jolma, P.; Kööbi, P.; Riutta, A.; Kalliovalkama, J.; Tolvanen, J.P.; Pörsti, I. Prostacyclin and Thromboxane A2 Production in Nitric Oxide-Deficient Hypertension in Vivo. Effects of High Calcium Diet and Angiotensin Receptor Blockade. Prostaglandins Leukot Essent Fat. Acids 2003, 69, 345–350. [Google Scholar] [CrossRef]
- Barbour, J.A.; Howe, P.R.C.; Buckley, J.D.; Bryan, J.; Coates, A.M. Effect of 12 Weeks High Oleic Peanut Consumption on Cardio-Metabolic Risk Factors and Body Composition. Nutrients 2015, 7, 7381–7398. [Google Scholar] [CrossRef] [Green Version]
- Lokko, P.; Lartey, A.; Armar-Klemesu, M.; Mattes, R.D. Regular Peanut Consumption Improves Plasma Lipid Levels in Healthy Ghanaians. Int. J. Food Sci. Nutr. 2007, 58, 190–200. [Google Scholar] [CrossRef] [PubMed]
- Canales, A.; Bastida, S.; Librelottto, J.; Nus, M.; Sánchez-Muniz, F.J.; Benedi, J. Platelet Aggregation, Eicosanoid Production and Thrombogenic Ratio in Individuals at High Cardiovascular Risk Consuming Meat Enriched in Walnut Paste. A Crossover, Placebo-Controlled Study. Br. J. Nutr. 2009, 102, 134–141. [Google Scholar] [CrossRef] [PubMed]
- Colpo, E.; Dalton, D.A.; Vilanova, C.; Reetz, L.G.B.; Duarte, M.M.M.F.; Farias, I.L.G.; Meinerz, D.F.; Mariano, D.O.C.; Vendrusculo, R.G.; Boligon, A.A.; et al. Brazilian Nut Consumption by Healthy Volunteers Improves Inflammatory Parameters. Nutrition 2014, 30, 459–465. [Google Scholar] [CrossRef] [PubMed]
- Miles, E.A.; Zoubouli, P.; Calder, P.C. Differential Anti-Inflammatory Effects of Phenolic Compounds from Extra Virgin Olive Oil Identified in Human Whole Blood Cultures. Nutrition 2005, 21, 389–394. [Google Scholar] [CrossRef] [PubMed]
- Schramm, D.D.; Wang, J.F.; Holt, R.R.; Ensunsa, J.L.; Gonsalves, J.L.; Lazarus, S.A.; Schmitz, H.H.; German, J.B.; Keen, C.L. Chocolate Procyanidins Decrease the Leukotriene-Prostacyclin Ratio in Humans and Human Aortic Endothelial Cells. Am. J. Clin. Nutr. 2001, 73, 36–40. [Google Scholar] [CrossRef] [Green Version]
- Stoclet, J.C.; Chataigneau, T.; Ndiaye, M.; Oak, M.H.; el Bedoui, J.; Chataigneau, M.; Schini-Kerth, V.B. Vascular Protection by Dietary Polyphenols. Eur. J. Pharmacol. 2004, 500, 299–313. [Google Scholar] [CrossRef]
- Bogani, P.; Galli, C.; Villa, M.; Visioli, F. Postprandial Anti-Inflammatory and Antioxidant Effects of Extra Virgin Olive Oil. Atherosclerosis 2007, 190, 181–186. [Google Scholar] [CrossRef]
- Rodriguez-Mateos, A.; Feliciano, R.P.; Boeres, A.; Weber, T.; dos Santos, C.N.; Ventura, M.R.; Heiss, C. Cranberry (Poly)Phenol Metabolites Correlate with Improvements in Vascular Function: A Double-Blind, Randomized, Controlled, Dose-Response, Crossover Study. Mol. Nutr. Food Res. 2016, 60, 2130–2140. [Google Scholar] [CrossRef] [Green Version]
- Rodriguez-Mateos, A.; Rendeiro, C.; Bergillos-Meca, T.; Tabatabaee, S.; George, T.W.; Heiss, C.; Spencer, J.P.E. Intake and Time Dependence of Blueberry Flavonoid-Induced Improvements in Vascular Function: A Randomized, Controlled, Double-Blind, Crossover Intervention Study with Mechanistic Insights into Biological Activity. Am. J. Clin. Nutr. 2013, 98, 1179–1191. [Google Scholar] [CrossRef] [Green Version]
- Istas, G.; Feliciano, R.P.; Weber, T.; Garcia-Villalba, R.; Tomas-Barberan, F.; Heiss, C.; Rodriguez-Mateos, A. Plasma Urolithin Metabolites Correlate with Improvements in Endothelial Function after Red Raspberry Consumption: A Double-Blind Randomized Controlled Trial. Arch. Biochem. Biophys. 2018, 651, 43–51. [Google Scholar] [CrossRef]
- Vitaglione, P.; Mennella, I.; Ferracane, R.; Rivellese, A.A.; Giacco, R.; Ercolini, D.; Gibbons, S.M.; la Storia, A.; Gilbert, J.A.; Jonnalagadda, S.; et al. Whole-Grain Wheat Consumption Reduces Inflammation in a Randomized Controlled Trial on Overweight and Obese Subjects with Unhealthy Dietary and Lifestyle Behaviors: Role of Polyphenols Bound to Cereal Dietary Fiber. Am. J. Clin. Nutr. 2015, 101, 251–261. [Google Scholar] [CrossRef] [Green Version]
- Hurtado-Barroso, S.; Quifer-Rada, P.; de Alvarenga, J.F.R.; Pérez-Fernández, S.; Tresserra-Rimbau, A.; Lamuela-Raventos, R.M. Changing to a Low-Polyphenol Diet Alters Vascular Biomarkers in Healthy Men after Only Two Weeks. Nutrients 2018, 10, 1766. [Google Scholar] [CrossRef] [PubMed] [Green Version]
- Carnevale, R.; Loffredo, L.; Pignatelli, P.; Nocella, C.; Bartimoccia, S.; di Santo, S.; Martino, F.; Catasca, E.; Perri, L.; Violi, F. Dark Chocolate Inhibits Platelet Isoprostanes via NOX2 Down-Regulation in Smokers. J. Thromb. Haemost. 2012, 10, 125–132. [Google Scholar] [CrossRef] [PubMed]
- Wan, Y.; Vinson, J.A.; Etherton, T.D.; Proch, J.; Lazarus, S.A.; Kris-Etherton, P.M. Effects of Cocoa Powder and Dark Chocolate on LDL Oxidative Susceptibility and Prostaglandin Concentrations in Humans. Am. J. Clin. Nutr. 2001, 74, 596–602. [Google Scholar] [CrossRef] [PubMed] [Green Version]

| SRP (n = 21) | PB (n = 23) | CB (n = 19) | p-Value | |
|---|---|---|---|---|
| Female, n (%) | 14 (66) | 18 (78) | 12 (63) | 0.528 |
| Age (years) | 22.28 ± 3.20 | 23.43 ± 2.90 | 22.42 ± 3.29 | 0.247 |
| Education level, n (%) | 0.512 | |||
| University students | 11 (52%) | 11 (48%) | 12 (63%) | |
| Graduated | 10 (48%) | 12 (52%) | 7 (37%) | |
| Physical activity (METs/week) | 4850 ± 2124 | 4703 ± 2381 | 4607 ± 1728 | 0.954 |
| Anthropometric measurements | ||||
| Weight (kg) | 63.26 ± 10.12 | 60.10 ± 7.72 | 63.78 ± 10.04 | 0.412 |
| BMI (kg/m2) | 22.12 ± 3.52 | 22.19 ± 2.60 | 22.59 ± 2.67 | 0.679 |
| Waist circumference (cm) | 72.73 ± 8.31 | 71.28 ± 5.53 | 74.68 ± 5.99 | 0.228 |
| Waist to hip ratio | 0.74 ± 0.06 | 0.74 ± 0.05 | 0.77 ± 0.05 | 0.130 |
| Body fat (%) | 26.66 ± 8.07 | 28.45 ± 7.88 | 26.22 ± 7.99 | 0.628 |
| Lipid profile | ||||
| TG (mmol/L) | 0.71 ± 0.20 | 0.85 ± 0.35 | 0.80 ± 0.25 | 0.341 |
| TC (mmol/L) | 4.33 ± 0.52 | 4.60 ± 0.88 | 4.09 ± 0.64 | 0.137 |
| LDL-c (mmol/L) | 2.22 ± 0.39 | 2.60 ± 0.69 | 2.30 ± 0.50 | 0.142 |
| HDL-c (mmol/L) | 1.75 ± 0.30 | 1.59 ± 0.53 | 1.50 ± 0.30 | 0.006 |
| Blood pressure | ||||
| SBP (mmHg) | 111 ± 7.34 | 109 ± 8.87 | 110 ± 11.83 | 0.451 |
| DBP (mmHg) | 72 ± 7.63 | 72 ± 6.20 | 70 ± 8.73 | 0.415 |
| Dietary intake | ||||
| Energy (kcal/day) | 2770 ± 594.50 | 2705 ± 602.17 | 2596 ± 477.97 | 0.588 |
| Carbohydrates (g/day) | 257.43 ± 80.73 | 241.26 ± 73.92 | 246.74 ± 59.49 | 0.867 |
| Sugar (g/day) | 115.86 ± 34.83 | 111.65 ± 35.04 | 113.89 ± 41.02 | 0.906 |
| Fiber (g/day) | 45.17 ± 21.95 | 42.12 ± 14.65 | 38.93 ± 15.07 | 0.768 |
| Protein (g/day) | 103.72 ± 29.47 | 110.17 ± 31.86 | 107.75 ± 27.51 | 0.598 |
| Total fat (g/day) | 144.55 ± 29.17 | 141.83± 35.35 | 129.53 ± 28.96 | 0.249 |
| SFAs (g/day) | 37.61 ± 10.00 | 38.18 ± 11.04 | 36.81 ± 13.02 | 0.871 |
| MUFAs (g/day) | 70.37 ± 16.12 | 69.06 ± 17.17 | 59.46 ± 15.87 | 0.093 |
| PUFAs (g/day) | 25.91 ± 6.76 | 23.99 ± 7.25 | 23.59 ± 6.59 | 0.541 |
| Urinary phenolic metabolites (mg/day) | ||||
| Lignans | 26.63 ± 12.05 | 27.18 ± 7.19 | 29.01 ± 15.26 | 0.140 |
| Hydroxybenzoic acids | 56.05 ± 24.91 | 67.74 ± 59.66 | 71.71 ± 49.26 | 0.755 |
| Hydroxycinnamic acids | 2.93 ± 3.55 | 2.23 ± 1.99 | 2.17 ± 1.92 | 0.960 |
| Stilbenes | 0.49 ± 0.74 | 1.88 ± 1.90 | 1.82 ± 1.75 | 0974 |
| Hydroxycoumarins | 7.99 ± 5.93 | 7.26 ± 4.17 | 7.25 ± 5.84 | 0.732 |
| Eicosanoids | ||||
| TXA2 (pg/mL) | 1409 ± 31.96 | 1297 ± 65.81 | 1315 ± 53.55 | 0.673 |
| PGI2 (pg/mL) | 10,997 ± 57.57 | 10,495 ± 47.39 | 7927 ± 42.01 | 0.150 |
| TXA2:PGI2 ratio | 0.21 ± 0.19 | 0.14 ± 0.07 | 0.17 ± 0.10 | 0.681 |
| SRP (n = 21) | PB (n = 22) | CB (n = 19) | p-Value | |||||
|---|---|---|---|---|---|---|---|---|
| Pre- Intervention | Post- Intervention | Pre- Intervention | Post- Intervention | Pre- Intervention | Post- Intervention | SRP vs. CB | PB vs. CB | |
| Lignans-Lignans | 26.63 ± 12.05 | 34.17 ± 19.55 | 27.18 ± 7.19 | 35.60 ± 18.74 | 29.01 ± 15.26 | 26.36 ± 11.34 | 0.084 | 0.038 |
| Enterodiol | 18.26 ± 8.16 | 17.49 ± 8.42 | 19.89 ± 4.95 | 19.97 ± 7.51 | 19.75 ± 7.89 | 18.83 ± 7.95 | 0.836 | 0.824 |
| Enterodiol glucuronide | 1.78 ± 3.75 | 2.99 ± 3.07 | 0.83 ± 1.18 | 2.64 ± 5.07 | 1.47 ± 3.69 | 0.66 ± 0.97 | 0.018 | 0.031 |
| Enterodiol sulfate | 0.11 ± 0.14 | 0.23 ± 0.31 | 0.11 ± 0.11 | 0.11 ± 0.08 | 0.31 ± 0.65 | 0.29 ± 0.40 | 0.373 | 0.901 |
| Enterolactone | 0.27 ± 0.86 | 1.05 ± 3.63 | 0.09 ± 0.04 | 0.21 ± 0.26 | 0.10 ± 0.06 | 0.16 ± 0.23 | 0.206 | 0.545 |
| Enterolactone glucuronide | 6.11 ± 4.38 | 12.91 ± 11.99 | 6.17 ± 3.96 | 12.72 ± 10.04 | 7.27 ± 8.00 | 8.66 ± 10.78 | 0.045 | 0.032 |
| Enterolactone diglucuronide | 0.06 ± 0.04 | 0.05 ± 0.05 | 0.06 ± 0.03 | 0.05 ± 0.04 | 0.07 ± 0.05 | 0.08 ± 0.06 | 0.100 | 0.054 |
| Enterolactone sulfate | 0.03 ± 0.05 | 0.07 ± 0.05 | 0.04 ± 0.04 | 0.06 ± 0.04 | 0.05 ± 0.06 | 0.04 ± 0.05 | 0.020 | 0.086 |
| Hydroxybenzoic acids | 56.05 ± 24.91 | 76.87 ± 40.28 | 67.74 ± 59.66 | 99.87 ± 77.31 | 71.71 ± 49.26 | 71.51 ± 49.34 | 0.169 | 0.059 |
| 3-Hydroxybenzoic acid | 3.95 ± 3.73 | 7.29 + 4.25 | 2.90 ± 1.72 | 6.46 ± 3.75 | 4.18 ± 2.00 | 3.87 ± 2.52 | 0.002 | <0.001 |
| 4-Hydroxybenzoic acid | 0.25 ± 0.40 | 0.69 ± 1.29 | 0.07 ± 0.07 | 0.38 ± 0.75 | 0.12 ± 0.18 | 0.39 ± 1.25 | 0.631 | 0.914 |
| Hydroxybenzoic acid glucuronide | 0.20 ± 0.23 | 0.53 ± 0.64 | 0.13 ± 0.16 | 0.37 ± 0.39 | 0.38 ± 0.58 | 0.57 ± 1.62 | 0.832 | 0.958 |
| Hydroxybenzoic acid sulfate | 3.17 ± 5.06 | 6.36 ± 4.04 | 3.83 ± 3.30 | 10.44 ± 7.21 | 4.69 ± 3.24 | 5.59 ± 6.43 | 0.090 | 0.004 |
| Protocatechuic acid | 1.13 ± 0.86 | 1.10 ± 1.14 | 2.08 ± 1.80 | 1.72 ± 1.71 | 1.30 ± 0.82 | 1.92 ± 3.18 | 0.331 | 0.335 |
| Protocatechuic acid glucuronide I | 0.72 ± 0.49 | 1.08 ±1.03 | 1.06 ± 1.18 | 1.44 ± 2.06 | 0.69 ± 0.47 | 0.63 ± 0.58 | 0.157 | 0.291 |
| Protocatechuic acid glucuronide II | 0.24 ± 0.11 | 0.19 ± 0.16 | 0.21 ± 0.19 | 0.25 ± 0.26 | 0.21 ± 0.17 | 0.20 ± 0.17 | 0.083 | 0.921 |
| Protocatechuic acid sulfate | 0.40 ± 0.20 | 1.55 ± 1.31 | 0.71 ± 0.73 | 2.58 ± 2.72 | 0.80 ± 0.75 | 2.82 ± 4.45 | 0.354 | 0.885 |
| Vanillic acid | 8.10 ± 6.02 | 6.63 ± 5.78 | 16.69 ± 25.82 | 13.69 ± 21.19 | 9.46 ± 12.23 | 10.27 ± 9.38 | 0.079 | 0.177 |
| Vanillic acid glucuronide I | 6.42 ± 3.92 | 5.52 ± 3.57 | 10.65 ± 16.93 | 10.24 ± 13.70 | 10.58 ± 14.43 | 10.52 ± 14.02 | 0.146 | 0.515 |
| Vanillic acid glucuronide II | 10.84 ± 9.96 | 11.55 ± 10.07 | 11.83 ± 12.70 | 18.90 ± 25.36 | 10.32 ±9.84 | 12.53 ± 12.50 | 0.112 | 0.976 |
| Vanillic acid sulfate | 12.96 ± 13.58 | 16.02 ± 18.58 | 12.13 ± 12.01 | 17.72 ± 14.94 | 16.50 ± 16.34 | 10.24 ± 11.58 | 0.048 | 0.006 |
| Syringic acid | 1.22 ± 1.35 | 2.56 ± 2.37 | 1.04 ± 0.16 | 1.79 ± 1.28 | 1.93 ± 1.84 | 2.07 ± 3.97 | 0.083 | 0.149 |
| Syringic acid glucuronide I | 1.14 ± 0.69 | 2.34 ± 3.25 | 0.93 ± 0.69 | 2.02 ± 2.95 | 1.08 ± 1.57 | 1.38 ± 2.07 | 0.267 | 0.165 |
| Syringic acid glucuronide II | 1.96 ± 2.24 | 2.35 ± 2.76 | 1.63 ± 2.78 | 2.52 ± 3.41 | 4.58 ± 6.83 | 1.28 ± 1.45 | 0.052 | 0.023 |
| Syringic acid sulfate | 3.33 ± 1.93 | 11.08 ± 9.85 | 4.85 ± 5.39 | 10.46 ± 6.09 | 4.88 ± 4.33 | 7.22 ± 10.23 | 0.041 | 0.208 |
| Hydroxycinnamic acids | 2.93 ± 3.55 | 3.75 ± 2.68 | 2.23 ± 1.99 | 5.47 ± 5.08 | 2.17 ± 1.92 | 1.29 ± 0.99 | 0.040 | 0.001 |
| p-Coumaric acid | 0.54 ± 1.34 | 0.37 ± 0.33 | 0.18 ± 0.21 | 0.43 ± 0.47 | 0.41 ± 0.74 | 0.17 ± 0.16 | 0.046 | 0.016 |
| m-Coumaric acid | 0.53 ± 0.95 | 0.36 ± 0.57 | 0.39 ± 1.12 | 0.40 ± 0.49 | 0.32 ± 0.38 | 0.35 ± 0.43 | 0.454 | 0.919 |
| o-Coumaric acid | 0.33 ± 0.84 | 0.12 ± 0.14 | 0.19 ± 0.22 | 0.22 ± 0.30 | 0.20 ± 0.18 | 0.15 ± 0.18 | 0.127 | 0.054 |
| Coumaric acid glucuronide I | 0.32 ± 0.83 | 0.48 ± 0.78 | 0.15 ± 0.17 | 0.33 ± 0.39 | 0.19 ± 0.34 | 0.12 ± 0.17 | 0.001 | 0.040 |
| Coumaric acid glucuronide II | 0.08 ± 0.18 | 0.15 ± 0.21 | 0.06 ± 0.05 | 0.13 ± 0.17 | 0.05 ± 0.06 | 0.06 ± 0.05 | 0.003 | 0.036 |
| Coumaric acid glucuronide III | 0.24 ± 0.28 | 0.43 ± 0.82 | 0.28 ± 0.46 | 0.67 ± 1.06 | 0.17 ± 0.15 | 0.28 ± 0.38 | 0.672 | 0.095 |
| Coumaric acid glucuronide IV | 0.12 ± 0.16 | 0.35 ± 0.49 | 0.22 ± 0.47 | 0.39 ± 0.45 | 0.10 ± 0.24 | 0.16 ± 0.22 | 0.673 | 0.493 |
| Isoferulic acid | 0.78 ± 0.64 | 1.49 ± 1.22 * | 0.79 ± 0.53 | 2.95 ± 4.32 * | 0.74 ± 1.08 | 0.02 ± 0.01 | 0.013 | 0.015 |
| Stilbenes | 2.04 ± 3.18 | 3.37 ± 4.86 | 1.88 ± 1.90 | 3.55 ± 3.84 | 1.82 ± 1.75 | 2.22 ± 3.59 | 0.371 | 0.882 |
| Dihydroresveratrol glucuronide I | 0.49 ± 0.74 | 1.17 ± 3.78 | 0.64 ± 1.18 | 1.42 ± 2.79 | 1.03 ± 1.34 | 0.66 ± 0.51 | 0.274 | 0.146 |
| Dihydroresveratrol glucuronide II | 1.26 ± 3.18 | 1.80 ± 2.95 | 0.98 ± 1.33 | 1.69 ± 2.07 | 0.56 ± 0.85 | 1.26 ± 3.50 | 0.068 | 0.004 |
| Dihydroresveratrol glucuronide III | 0.28 ± 0.19 | 0.38 ± 0.33 | 0.26 ± 0.14 | 0.43 ± 0.61 | 0.22 ± 0.17 | 0.30 ± 0.24 | 0.506 | 0.508 |
| Hydroxycoumarins | 7.99 ± 5.93 | 12.77 ± 14.88 | 7.26 ± 4.17 | 12.73 ± 10.14 | 7.25 ± 5.84 | 11.65 ± 21.63 | 0.791 | 0.694 |
| Urolithin A | 0.77 ± 1.68 | 0.13 ± 0.15 | 0.50 ± 1.69 | 0.21 ± 0.34 | 0.19 ± 0.40 | 0.08 ± 0.09 | 0.123 | 0.572 |
| Urolithin A glucuronide | 6.96 ± 5.67 | 12.24 ± 14.70 | 6.50 ± 3.92 | 12.06 ± 9.71 | 6.79 ± 5.82 | 11.25 ± 21.51 | 0.768 | 0.720 |
| Urolithin A sulfate | 0.16 ± 0.17 | 0.25 ± 0.17 | 0.22 ± 0.20 | 0.30 ± 0.29 | 0.25 ± 0.14 | 0.27 ± 0.26 | 0.268 | 0.466 |
| Urolithin B | 0.10 ± 0.16 | 0.15 ± 0.50 | 0.04 ± 0.06 | 0.20 ± 0.79 | 0.02 ± 0.03 | 0.04 ± 0.06 | 0.807 | 0.425 |
| SRP (n = 21) | PB (n = 22) | CB (n = 19) | p-Value | |||||
|---|---|---|---|---|---|---|---|---|
| Pre- Intervention | Post- Intervention | Pre- Intervention | Post- Intervention | Pre- Intervention | Post- Intervention | SRP vs. CB | PB vs. CB | |
| TXA2 (pg/mL) | 1409 ± 31.96 | 1428 ± 81.76 | 1297 ± 65.81 | 1139 ± 53.39 | 1315 ± 53.55 | 1410 ± 59.59 | 0.456 | 0.414 |
| PGI2 (pg/mL) | 10,997 ± 57.57 | 14,607 ± 73.13 | 10,495 ± 47.39 | 13,773 ± 74.30 | 7927 ± 42.01 | 8548 ± 61.70 | 0.037 | 0.070 |
| TXA2:PGI2 ratio | 0.21 ± 0.19 | 0.13 ± 0.10 | 0.14 ± 0.07 | 0.10 ± 0.05 | 0.17 ± 0.10 | 0.22 ± 0.16 | 0.008 | 0.047 |
Disclaimer/Publisher’s Note: The statements, opinions and data contained in all publications are solely those of the individual author(s) and contributor(s) and not of MDPI and/or the editor(s). MDPI and/or the editor(s) disclaim responsibility for any injury to people or property resulting from any ideas, methods, instructions or products referred to in the content. |
© 2023 by the authors. Licensee MDPI, Basel, Switzerland. This article is an open access article distributed under the terms and conditions of the Creative Commons Attribution (CC BY) license (https://creativecommons.org/licenses/by/4.0/).
Share and Cite
Parilli-Moser, I.; Domínguez-López, I.; Vallverdú-Queralt, A.; Hurtado-Barroso, S.; Lamuela-Raventós, R.M. Urinary Phenolic Metabolites Associated with Peanut Consumption May Have a Beneficial Impact on Vascular Health Biomarkers. Antioxidants 2023, 12, 698. https://0-doi-org.brum.beds.ac.uk/10.3390/antiox12030698
Parilli-Moser I, Domínguez-López I, Vallverdú-Queralt A, Hurtado-Barroso S, Lamuela-Raventós RM. Urinary Phenolic Metabolites Associated with Peanut Consumption May Have a Beneficial Impact on Vascular Health Biomarkers. Antioxidants. 2023; 12(3):698. https://0-doi-org.brum.beds.ac.uk/10.3390/antiox12030698
Chicago/Turabian StyleParilli-Moser, Isabella, Inés Domínguez-López, Anna Vallverdú-Queralt, Sara Hurtado-Barroso, and Rosa M. Lamuela-Raventós. 2023. "Urinary Phenolic Metabolites Associated with Peanut Consumption May Have a Beneficial Impact on Vascular Health Biomarkers" Antioxidants 12, no. 3: 698. https://0-doi-org.brum.beds.ac.uk/10.3390/antiox12030698